Embed Size (px)
Citation preview
Distributed Debugging ToolProject Report
by
Hassan ImhmedKarthik Pattabiraman
Venkatasubramanian Jayaraman
under Professor Thomas W. Doeppner
Department of Computer ScienceBrown University
Providence, Rhode Island 02919December 2010
1
1 IntroductionThis project involves the design and implementation of a distributed debugging tool. The tool
takes as input, a predicate given by the user and evaluates the predicate based on the data extracted from the debugged distributed application nodes. The tool has the ability to generate globally consistent states, avoiding the exponentially possible states, using specific techniques. The tool uses vector clocks to order events and deduce causality among these events which happen across the distributed nodes. This way we overcome some of the disadvantages of using logical clocks. The tool also has the ability to create consistent snapshots of application data. This feature helps us take advantage of the parallelization provided by Hadoop's MapReduce framework to evaluate predicates.
Our tool does not provide real time debugging features. However, we strive to provide as quick a response as possible using parallelization. We realize that generating a globally consistent state is a bottleneck to the performance of any distributed debugging tool. So, the responsibility to generate such states was given to the Map task of the Hadoop MapReduce framework. The file sent as input to each of the Map task can be made as small as possible using our snapshot algorithm.
The tool has been designed to be agnostic to the language used to implement the debugged distributed application. Since the tracing tools that capture the state changes of a distributed node are specific to the language used, we let the user provide a mechanism to give us the traced data. We do provide tracing capabilities for Java using a tool called Btrace.
The design and implementation of this tool was influenced by the course “cs138 Distributed Systems” offered by Brown University's Computer Science department.5th generation.
2 MotivationThe main goal of the distributed debugging tool stated in simple terms is to determine whether a
given user predicate over the global state of the system evaluates to true or false as the system executes. Global state of a distributed system is defined as the collection of states of each application node or process in the system at any given instant in time.
Determining a distributed system's global state is not a trivial task. Consider a simple system which has two application nodes. Each of these nodes may go through a series of states from time t1 to time t2. If we are to determine the global state of the system at time t1' such that t1 < t1' < t2 , then we have to consider all possible combinations of the nodes' states between times t1 and t2. This is because there is no way for us to the causal ordering between the first event of node 1 and the last event of node 2 and vice-versa. When the difference between t1 and t2 is large, the number of combinations grows exponentially.
Our motivation in building this tool is to come up with an efficient approach to generate possible global states of a system consisting of many number of nodes without exploring all the exponential possibilites and evaluate given user predicate over these global states. At the same time the approach should exploit the parallelism inherent in the problem and provide results of the predicate evaluation quickly to the user.
2
3 AssumptionsWhile coming up with design for this tool, the following assumptions were made.
i. The communication between all nodes in the system is first in first out(FIFO).
This is important for the communication between the Local State Monitor and Local State Logger components of the debugging tool as the causal logging of events in log files relies on the FIFO characteristic of the communication (section 4.2 & 4.3). Similarly the Puncutation Store relies on a FIFO communication between itself and Local State Loggers.
ii. Messages communicated between nodes (both system and application) may reach with any amount of delay but are never lost.
Almost all components rely on this assumption. Especially when Local State Loggers communicate send events to remote Local State Logger instances through GTSM clients (section 4.3 and 4.4), and when GTSM server communicates sync messages (section 4.4). Communication between application nodes are also assumed to not lose messages.
iii. The processes corresponding to the tool (LSM, LSM and GTSM) don't crash, although application nodes can definitely crash.
The current debugging tool implementation does not handle failure of any of the components. All process are assumed to be up and running till the application runs.
iv. All nodes where the processes related to the tool run are different from those of the application. They belong to a single network and there is no network partition between these nodes. If any network partition does occur, it will be fixed soon. However network partitions may occur among nodes in the application.
Network partitions may result in delayed communication between Local State Loggers/GTSM clients and between Local State Logger and the Punctuation Store. Delays in communication result in size of the internal queue of events which is limited by the size of memory on the nodes where the tool runs. Hence the assumption is that if there is a network partition, such a partition will be fixed before memory limits are hit.
4 DesignThe sections that follow provide a detailed description on how the debugging tool is designed.
We first present the high level architecture followed by subsections that explain each of the components in greater detail. For each component, we provide the goals that led to creating the component and how the goals were realized using the component. The goals themselves manifested from the requirements of the tool mentioned under Motivation (see section 2).
4.1 Architecture Overview
The diagram below provides the high level architecture of the distributed debugging tool.
3
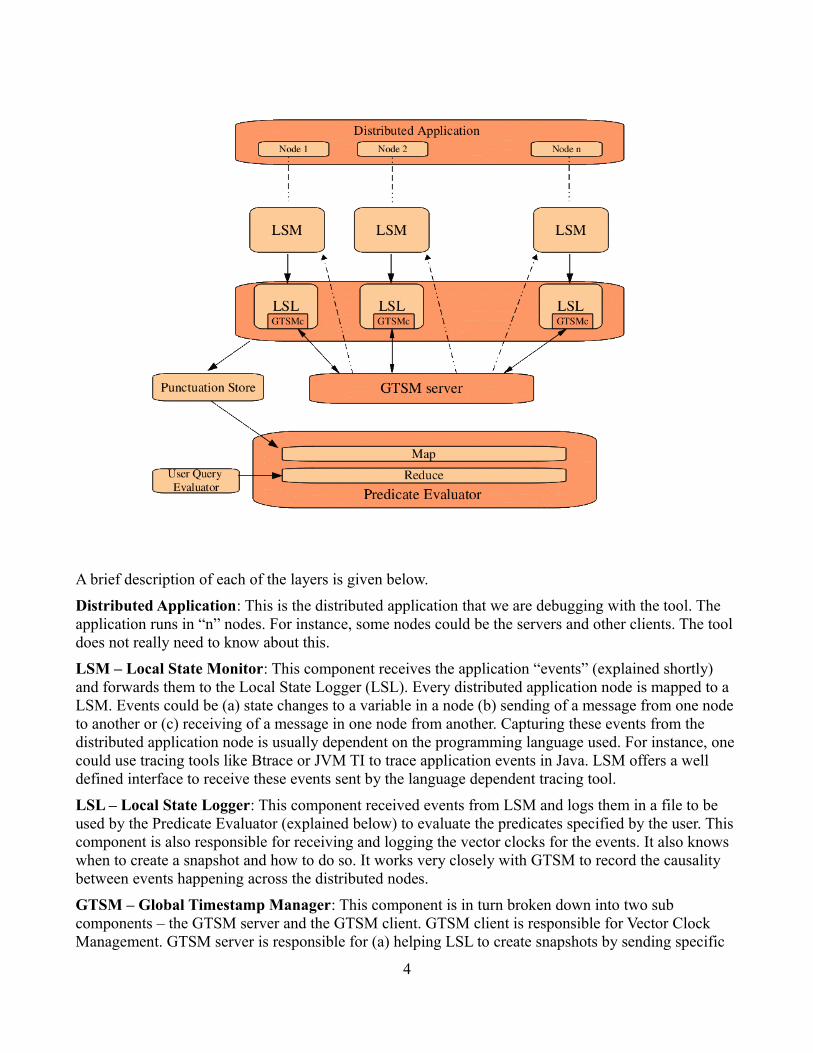
A brief description of each of the layers is given below.
Distributed Application: This is the distributed application that we are debugging with the tool. The application runs in “n” nodes. For instance, some nodes could be the servers and other clients. The tool does not really need to know about this.
LSM – Local State Monitor: This component receives the application “events” (explained shortly) and forwards them to the Local State Logger (LSL). Every distributed application node is mapped to a LSM. Events could be (a) state changes to a variable in a node (b) sending of a message from one node to another or (c) receiving of a message in one node from another. Capturing these events from the distributed application node is usually dependent on the programming language used. For instance, one could use tracing tools like Btrace or JVM TI to trace application events in Java. LSM offers a well defined interface to receive these events sent by the language dependent tracing tool.
LSL – Local State Logger: This component received events from LSM and logs them in a file to be used by the Predicate Evaluator (explained below) to evaluate the predicates specified by the user. This component is also responsible for receiving and logging the vector clocks for the events. It also knows when to create a snapshot and how to do so. It works very closely with GTSM to record the causality between events happening across the distributed nodes.
GTSM – Global Timestamp Manager: This component is in turn broken down into two sub components – the GTSM server and the GTSM client. GTSM client is responsible for Vector Clock Management. GTSM server is responsible for (a) helping LSL to create snapshots by sending specific
4
messages at specific times governed by the snapshot algorithm rules (explained later) and (b) communicate between GTSM clients (and in turn the LSLs).
Predicate Evaluator: The purpose of this component is twofold - (a) Generate a globally consistent state, (b) Evaluate the given predicate using the data from the globally consistent state. We have implemented this component using the MapReduce paradigm. Hadoop framework was used for development. The Map phase takes care of the first purpose – generating globally consistent state. There is a one to one mapping between the number of maps and the number of distributed application nodes. The LSLs generate one log / event file for every distributed node. Each Map task works on a single log file generating [key + event data]. The key generated by the Map task helps the Reduce task to retrieve events belonging to a globally consistent cut. The Reduce Phase takes care of the second purpose – evaluating the predicates. The Reduce task using the [key + event data] from all the Map tasks, evaluates the predicate given by the user.
Punctuation Store: The Punctuation Store has a very specific purpose – help the predicate evaluator with understanding the number of events that should be processed by each of the Map task. The Punctuation Store is a store for timestamps – specifically, the timestamps of receive events (discussed in section 4.3.2)and SYNC events (discussed in section 4.4.2).
User Query Evaluator: This component parses the predicate input (given in a specific format) and creates an in-memory structure that will be used by the Reduce Phase of the Predicate Evaluator. The Reduce Phase uses this in-memory structure and the event data received from the Map Phase to evaluate the predicate.
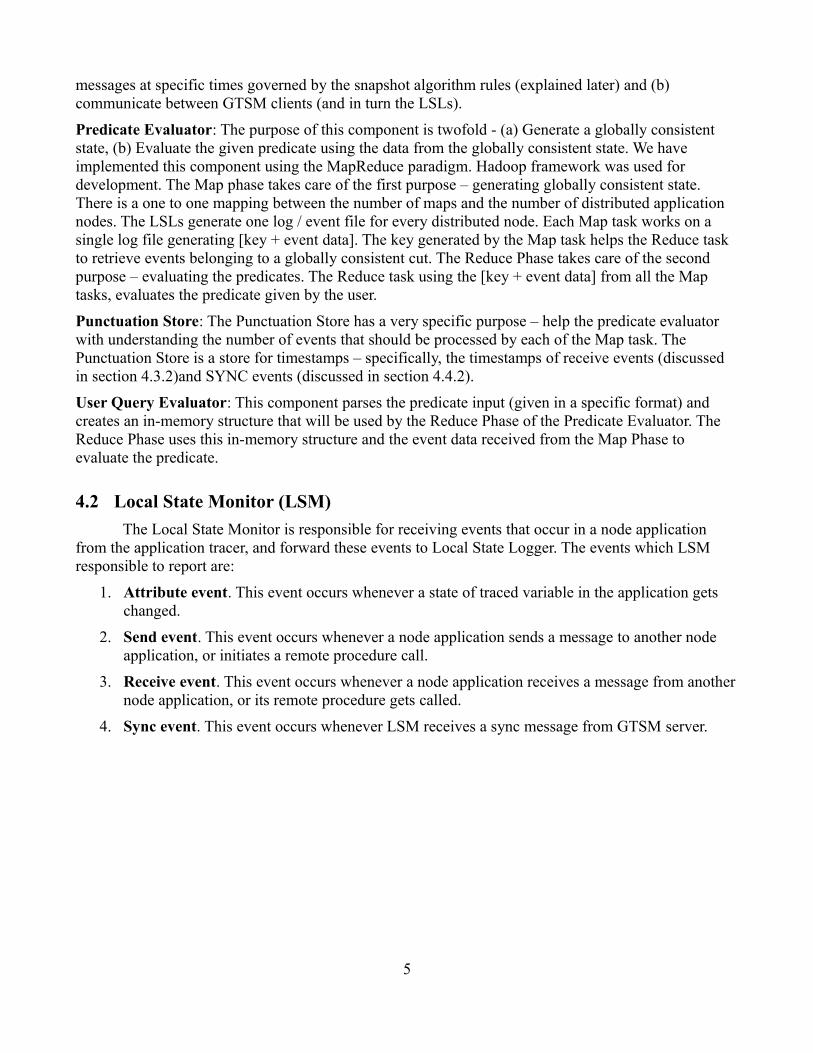
4.2 Local State Monitor (LSM)
The Local State Monitor is responsible for receiving events that occur in a node application from the application tracer, and forward these events to Local State Logger. The events which LSM responsible to report are:
1. Attribute event. This event occurs whenever a state of traced variable in the application gets changed.
2. Send event. This event occurs whenever a node application sends a message to another node application, or initiates a remote procedure call.
3. Receive event. This event occurs whenever a node application receives a message from another node application, or its remote procedure gets called.
4. Sync event. This event occurs whenever LSM receives a sync message from GTSM server.
5
Each node application has only one LSM, and both run in the same machine. User specifies application states that tracer should watch, and once LSM receives an event update from the tracer, it wraps the event into a packet containing other useful information, such as node ID and message ID. Right after building the packet, LSM sends it over the socket to LSL.
4.2.1 Goals
List of goals that must be achieved by the implementation of LSM.
• Establish a connection, over pipe, to an application tracer and continue receiving event updates from this tracer.
• Report the captured events very quick in such a way the application tracer does not get hanged for long.
• Establish a connection with GTSM server, and start receiving sync messages
• Establish a connection with LSL, and notify this LSL about any even occurs.
4.2.2 Implementation Details
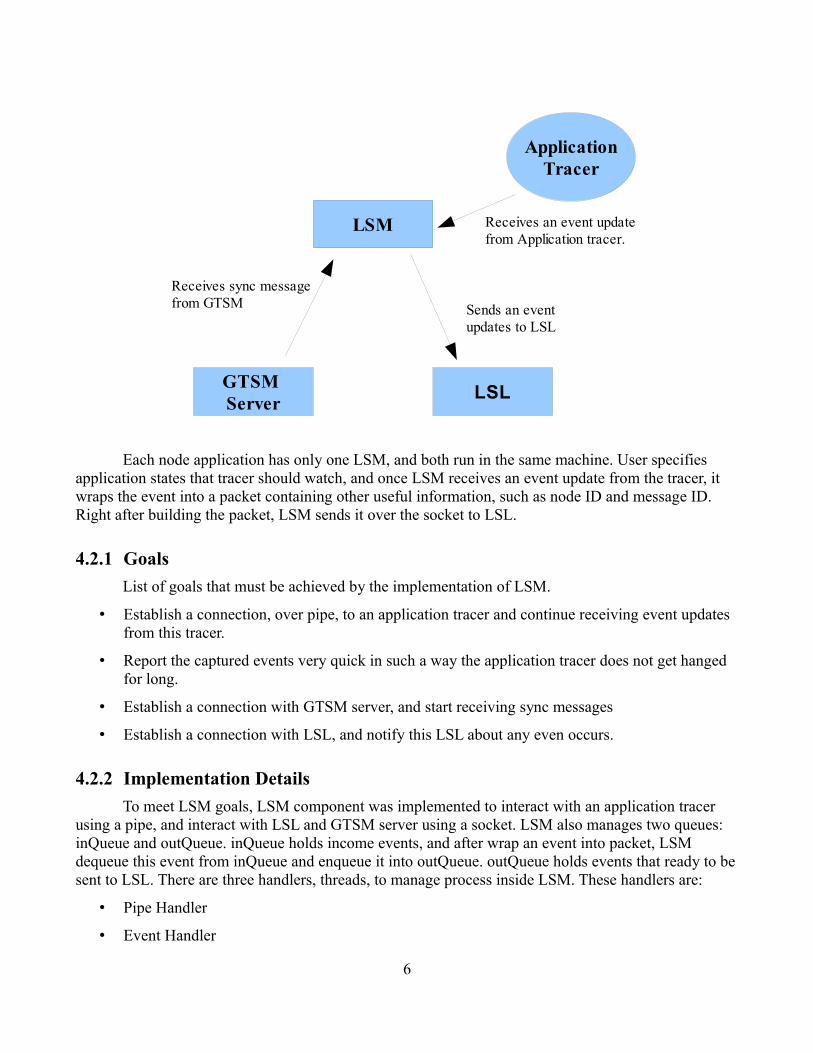
To meet LSM goals, LSM component was implemented to interact with an application tracer using a pipe, and interact with LSL and GTSM server using a socket. LSM also manages two queues: inQueue and outQueue. inQueue holds income events, and after wrap an event into packet, LSM dequeue this event from inQueue and enqueue it into outQueue. outQueue holds events that ready to be sent to LSL. There are three handlers, threads, to manage process inside LSM. These handlers are:
• Pipe Handler
• Event Handler
6
ApplicationTracer
LSM
LSLGTSM Server
Receives an event updatefrom Application tracer.
Sends an event updates to LSL
Receives sync message from GTSM
• Packer Handler
Pipe Handler
Pipe Handler is a thread which is responsible for:
1. Establish connection to Application Tracer, btrace for example, using a named pipe and then constantly listens to this pipe. Once Pipe Handler receives an event message, it immediately enqueues this message into inQueue to be processed later by Event Handler. There is a specific format for the events that sent over the pipe to Handle Piper. Following are example for how the events should look like:
• “<AT> X = 5” means an attribute event occurred; an variable X gets updated to 5.
• “<SE> 129.0.0.1” means a send event occurred; local machine sent a message to 129.0.0.1
• “<RE> 129.0.0.2” means a receive event occurred; local machine received message from 129.0.0.2
2. Establish connection to GTSM Server using a socket and then constantly listens to this socket Once Pipe Handler receives a sync event message, it immediately enqueues this message into inQueue to be processed later by Event Handler. Following is an example for sync event format:
7
Application
Application Tracer
(btrace) pipe
Pipe Handler
Event Handler
PacketHandler
LSL
GTSMServer
LSMPacket
LSM
Socket
Socket
InQueue OutQueue
• “<SY> <[vector clock]>” means a sync event occurred, this message will contain a last updated vector clock from GTSM server.
Event Handler
As shown above, an event information is stored as String format in the inQueue. However, each event should ultimately get converted to an Event object; and this what Event Handler basically does. Event Handler is just a thread which first dequeues a String event from inQueue, constructs an event object equivalent to this String format event. As part of the construction, the Event Handler will add other information to this object; such as Node ID, Message ID, real time Machine. After constructing the event, Event Handler enqueues this event into outQueue.
Packet Handler
Packet Handler is a thread which is responsible for establishing connection to LSL component, and sending captured events to LSL. Packet Handler periodically dequeues an event object from outQueue and wraps the event into a packet, namely LSM Packet, and then sends this packet over the socket to LSL. Packet Handler constructs and sends two types of LSM Packets :
• Session Packet. This packet is sent once from LSM to LSL
• Event Packet. This packet is sent as long as there are events waiting in outQueue.
Session Packet
Session packet is sent only once from Packet Handler to LSL; more specifically right after the Handle Packet establishes a connection with LSL. In this Packet, the Handle Packet informs LSL about the variables, application states, that LSL is responsible to log.
For example, if user wants to use our debugging tool to evaluate predicate on variables: X and Y, then right after establishing a connection between LSM and LSL, a session packet will be constructed by the Handle Packet containing following information:
name: X type: Integer size: 4
name: Y type:Integer size: 4
In addition to variables description, the session packet contains other information which takes pages to explain them. However, comments in source code explains what the packet exactly contains.
Event Packet
As the name suggests, this packet carries information about an event that occurred in LSM machine. Because sending data over network might be slow, the Packet Handler is free to marshal, serialize, may events and wrapping them into one packet. However, each event packet carries enough information to help LSL in order to extract one event at time out of the packet and generates a different vector clock for each one.
For example, assuming outQueue holds three events:
– Attribute Event, X = 60
8
– Send Event, destination ip = 129.0.0.3
– Receive Event, source ip = 129.0.0.2
The Packet Handler can dequeue all these three events and marshals them into one packet, and then sends this packet to LSL. The packet carries these event among other information like this:
Number of Events: 3
Event type: Attribute
Attribute Name: X
Attribute Value: 60
Event type: Send
Destination IP: 129.0.03
Event type: Receive
Source IP: 129.0.0.2
Note: the example gives an idea about what the packets carry; however the packet carries more information than that. For example, it is not mentioned here how the packet header looks like. Best suggestion here is to look at the source code comments.
4.3 Local State Logger (LSL)
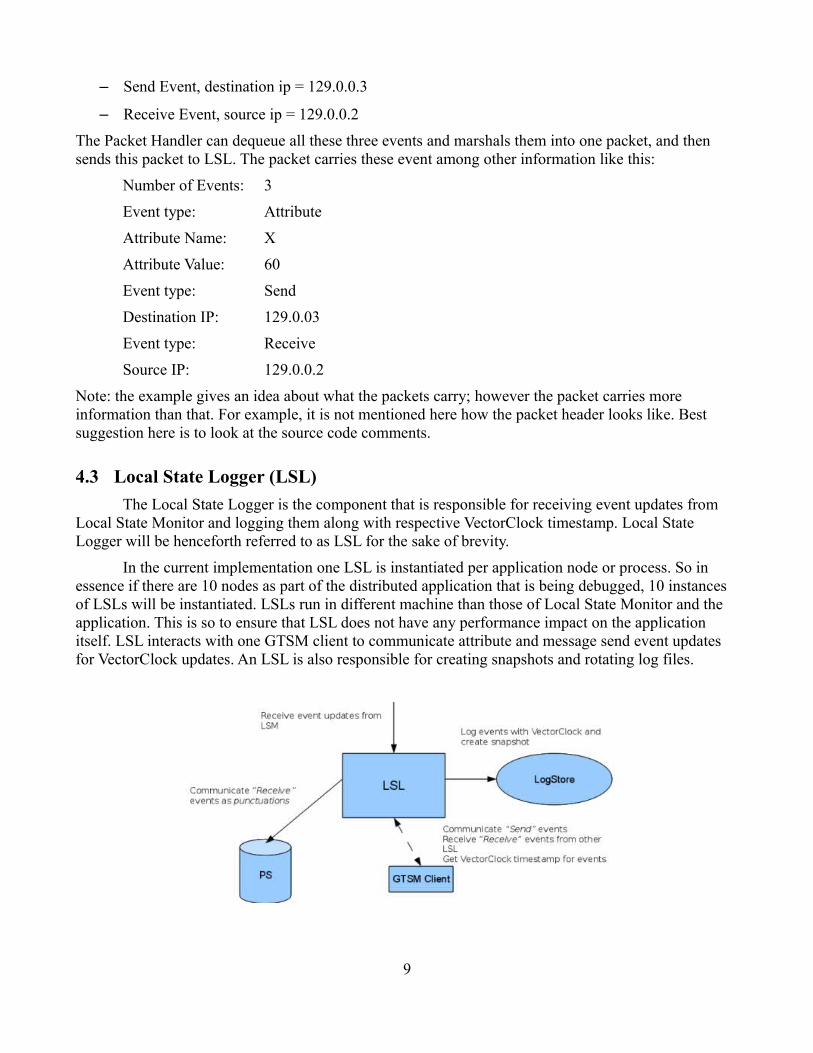
The Local State Logger is the component that is responsible for receiving event updates from Local State Monitor and logging them along with respective VectorClock timestamp. Local State Logger will be henceforth referred to as LSL for the sake of brevity.
In the current implementation one LSL is instantiated per application node or process. So in essence if there are 10 nodes as part of the distributed application that is being debugged, 10 instances of LSLs will be instantiated. LSLs run in different machine than those of Local State Monitor and the application. This is so to ensure that LSL does not have any performance impact on the application itself. LSL interacts with one GTSM client to communicate attribute and message send event updates for VectorClock updates. An LSL is also responsible for creating snapshots and rotating log files.
9
4.3.1 Goals
The responsibilities of LSL component are listed below.
1. Receive event updates from Local State Monitor. These include attribute/variable change events, message send/receive events and GTSM sync events.
2. For each attribute/variable update event received, obtain the VectorClock timestamp from GTSM client and log them.
3. For each send event (a message sending/remote procedure call event) received, obtain the VectorClock timestamp from GTSM client and log them. In addition pass on the send event to GTSM client (GTSM client in turn will pass this to the LSL corresponding to the destination application node that received this message.
4. For any receive event received (receipt of a message/remote procedure call from another node) wait for the corresponding sending event from corresponding LSL node and then log the merged VectorClock. In addition communicate the receive event to PuncutationStore (the reason for this is explained in sections 4.5.2 and 4.6).
5. Upon receiving a SnapshotSync event, create a snapshot for this application node.
4.3.2 Implementation Details
The LSL receives event information from both LSM and GTSM client. While the LSM informs all the events that happen at the application node, the GTSM client informs the send event that happened at any remote node as part of message communication or remote procedure call. To handle this, the LSL consists of two components namely
i. Listener
ii. Logger
4.3.2.1 Listener
The Listener sub-component is responsible for receiving events from the LSM. The communication between LSM and the Listener is through sockets. The Listener listens on a particular port to which all events are communicated by an LSM. This channel of communication is assumed to FIFO(first in first out). In other words if event e1 and e2 happen causally in that order, the Listener is guaranteed to receive them in that order. This way the causality of events are maintained while logging them as well. The Listener starts listening on prespecified port until an LSM connects to it. The communication between LSM and Listener follows a protocol as described in 4.2.2. The Listener upon receiving event information, creates a JLogEvent instance and passes it along to the Logger.
4.3.2.2 Logger
The Logger as already mentioned is responsible for logging events to LogStore. It receives event updates both from LSM (all event updates) and GTSM client (send event update from remote LSL).
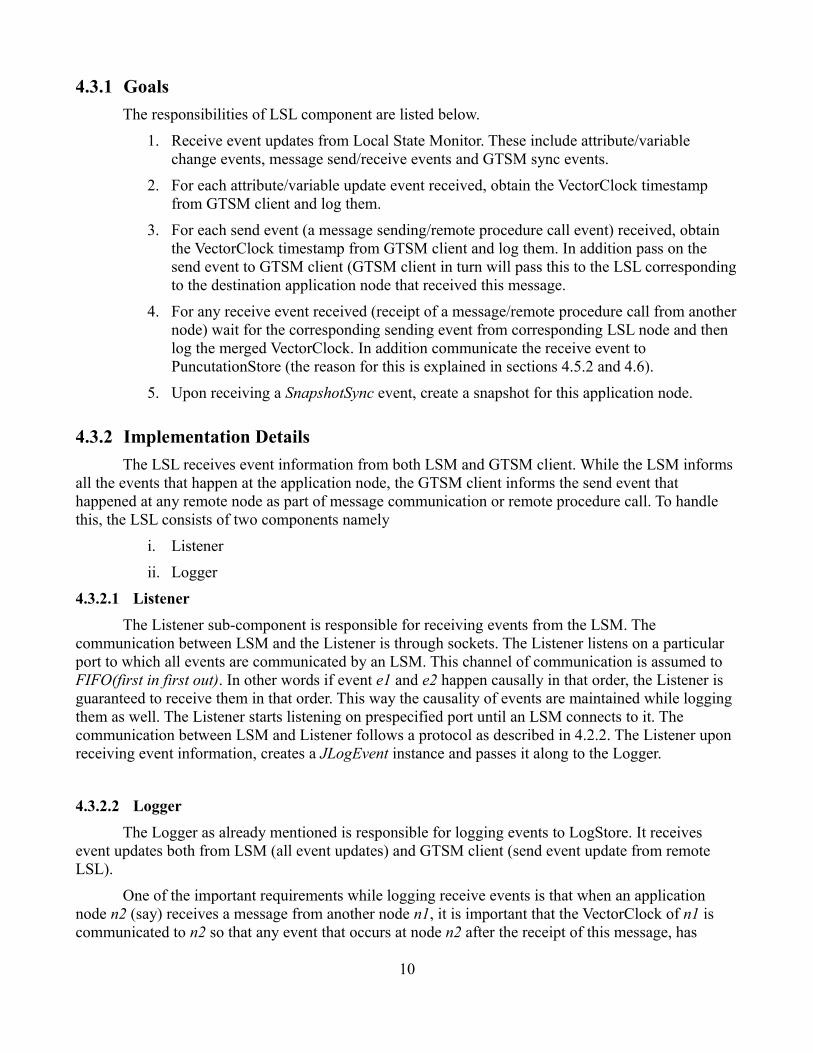
One of the important requirements while logging receive events is that when an application node n2 (say) receives a message from another node n1, it is important that the VectorClock of n1 is communicated to n2 so that any event that occurs at node n2 after the receipt of this message, has
10
updated VectorClock timestamps for n1. This is best explained through the diagram shown below.
The above diagram shows the VectorClock timestamps of nodes n1 and n2. Here the timestamps of n1 and n2 are represented through lowercase and uppercase alphabets respectively. If a message is sent from n1 at a'' to node n2, it should hold that for subsequent events, the VectorClock component for node n1 should have a value which is >= a''.
Typically in distributed debugging tools, communication of VectorClock timestamp is implemented by inclding the timestamp component along with message communication. For example some debugging tools implemented in Java (9), modify the RMI stack to include VectorClock component. Since in many cases this is undesirable, in our distributed debugging tool this is achieved using the LSL itself. Whenever an LSL receives a send event update from LSM, (for example in this case the LSL corresponding to n1) it logs the send event and then passes along this event update together with VectorClock timestamp to the destination LSL (in this example, the LSL corresponding to n2). The destination LSL upon receiving this VectorClock update merges the VectorClock timestamp and uses the merged VectorClock for logging the receive event. (Note: all VectorClock related operations are handled by the respective GTSM client). However because of unreliability on network speeds, this raises the following interesting scenarios at the Logger of n2 depending the order in which events are received. Consider the example shown above.
i. e22 → e23 → e12
It is possible that the Logger receives, any number of events(eg. e23) after a receive event ( e22) before it receives the corresponding send event update (e12) from remote LSL. In that case the Logger should not log any of those events till the send event is received from the remote LSL. As already mentioned it is mandatory that the VectorClock for e23 reflects the timestamp of node n1 at the time e12 happened.
ii. e12 → e21 → e22
It is possible that the Logger receives the send event from the remote LSL first even before it receives any event updates from LSM. In this scenario, the Logger should log e12 with the appropriate VectorClock timestamp. Once it receives e22 , the VectorClock of e12 should be then merged with local VectorClock and then logged.
In order to achieve such above mentioned requirements, the Logger maintains two queues to receive event updates from remote LSL (GTSM client) and LSM respectively. The Logger maintains a
11
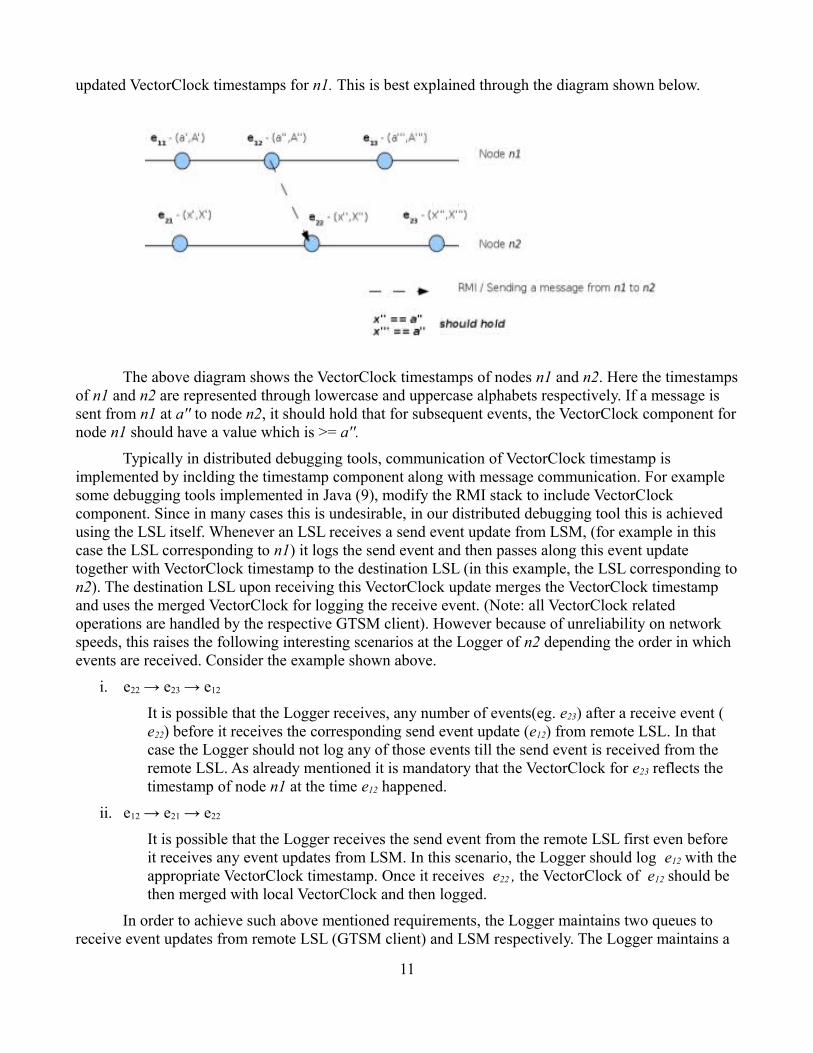
thread which blocks till any of these queues is filled with an event update. If the first element in the LSM queue is a receive event, then the thread blocks till it receives the corresponding send event from remote LSL. If the event in LSL queue is a sync event, the Logger checks if it is a standard SYNC event or a SNAPSHOT SYNC event. If the event is a SYNC event, the VectorClock is merged. However if the event is a SNAPSHOT SYNC event the Logger takes a snapshot of the current state. This is explained in the next section.
Inspite of the fact that there are two queues, the order in which events are logged is determined by the order of events in the LSM queue. Since this is deterministic and is assumed to be FIFO it is guaranteed that the events are logged in the same order as determined by LSM.
4.3.2.3 Snapshots for MapReduce
Log files created by the Logger are rotated periodically instead of generating single huge log file which is difficult to maintain and process for predicate evaluation. MapReduce jobs are run on batches of log files. The first run of MapReduce processes the first log file produced by each LSL. The second run of MapReduce consumes the second log file and so on. Since MapReduce jobs are run on Hadoop, which is a batch processing system, performing incremental MapReduce runs on log files allows us to evaluate predicates quickly and on a relatively smaller scale (because of log file rotation). However it is mandatory to ensure that the ith run of MapReduce does not depend on the i – 1 log files produced by each LSL. If this were not the case then each ith MapReduce run will potentially depend on all the i – 1 log files generated before and this would result in evaluating exponential possibilities.
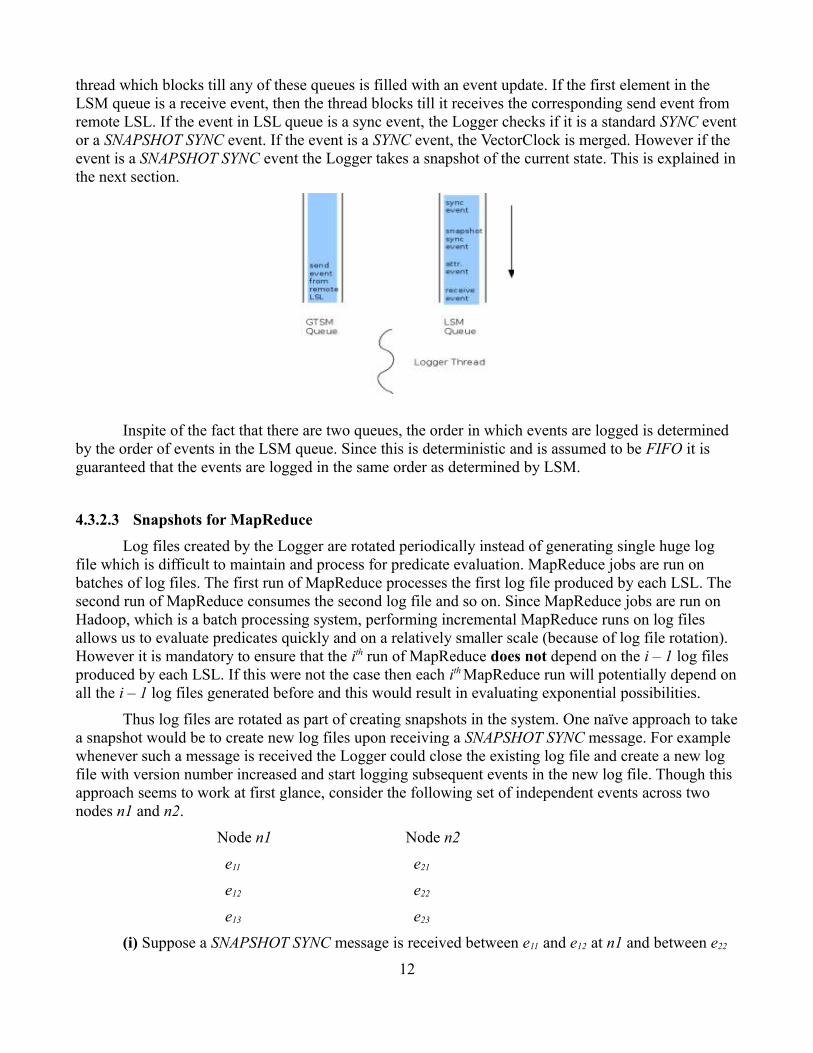
Thus log files are rotated as part of creating snapshots in the system. One naïve approach to take a snapshot would be to create new log files upon receiving a SNAPSHOT SYNC message. For example whenever such a message is received the Logger could close the existing log file and create a new log file with version number increased and start logging subsequent events in the new log file. Though this approach seems to work at first glance, consider the following set of independent events across two nodes n1 and n2.
Node n1 Node n2
e11 e21
e12 e22
e13 e23
(i) Suppose a SNAPSHOT SYNC message is received between e11 and e12 at n1 and between e22
12
and e22 at n2, then events e13 and e23 will be logged in the new log file at each LSL respectively. Because of this when the second MapReduce instance runs, it will ignore the plausible global state namely e11, e21. In other words, since snapshots are taken individually at each node at no point should we introduce causality across independent events. (ii) Another related issue is that there is no guarantee that all LSLs will receive the SNAPSHOT SYNC message at the same time. Hence if a SNAPSHOT SYNC message is sent at the time when a send/receive communication is happening between LSLs, depending on when the sync message reaches, it is likely that the sender may record the sending as part of the snapshot, while the receiver might not record the receipt. Our approach for taking snapshot tries to overcome these issues. The algorithm for taking a snapshot is shown below.
i. Upon receiving a SNAPSHOT SYNC message, the Logger marks the event boundary. It then passes the sync message to GTSM client which will in turn pass it back to the GTSM server.
ii. All events received after the SNAPSHOT SYNC message, are logged in the current log file. Additionally these events are also maintained in an in-memory queue.
iii. The GTSM server on receiving these sync messages from all the LSLs sends a sync message merging the VectorClocks from all the LSLs.
iv. Upon receiving the first SYNC event after a SNAPSHOT SYNC event, close the current log file, create a new log file and log all the events in the in-memory queue. All subsequent events will be logged in the new logfile.
As it can be observed from the above algorithm, the GTSM server initiates snapshot by sending the SNAPSHOT SYNC message. When the subsequent sync message is received at the LSL, it is definitely aware of the fact that all other nodes did receive the SNAPSHOT SYNC message. And this implies that all nodes are consistent in recording the similar events as part of the snapshot. However since it is practically impossible to determine the causality of events that occur during a snapshot process, such events are recorded in both log files to avoid missing out on generating a potential plausible global state.
4.4 Global Timestamp Manager (GTSM)
One of the fundamental requirements for a debugger of a distributed system is the ability to order the events happening across the distributed environment. The GTSM helps in realizing this requirement. The ability to generate globally consistent states is an important goal. Once such a state is generated, evaluating a predicate on each of the global states becomes trivial. The paper D3S-Debugging Deployed Distributed Systems provides an approach to generate such global states.
The design and the algorithms that follow in this section provide an improved approach to parallelize the activity of generating global states, and rely on vector clocks (as opposed to the logical clocks used in D3S) to decide on the consistent states. It is important to understand that nodes in a distributed system may or may not communicate. In the absence of communication, the lattice of global states will contain exponential states expressed as a function of the number of events that happen in each node. We tackle this problem by generating an artificial communication event that ensures (or at least has the effect) all nodes have communicated with one another.
Some of the decisions made during the design of GTSM were influenced by sections 10.5 (Global States) and 10.6 (Distributed Debugging) from the book Distributed Systems (Coulouris, Dollimore, Kindberg). The GTSM has been designed in such a way that ensures achieving maximum
13
parallelization during the Predicate Evaluation phase (the MapReduce phase). Although, currently GTSM itself is a single point of failure, it is possible that failovers can be designed. The effect of switching to a failover will be a delay in predicate evaluation.
4.4.1 Goals
The design of GTSM was influenced by the following goals -
• The Local State Loggers (LSL) should not have the burden to communicate with one another to understand the communication between the nodes (of the distributed system itself) whose events they log.
• It is important that all distributed application nodes communicate with one another frequently to avoid exponential number of global states (with respect to the events seen). However, we cannot rely on the distributed application nodes themselves to achieve this. Someone should fake / simulate the communication between nodes (at the LSL level).
• Enable / help the LSL to generate a consistent cut (a snapshot).
• The LSLs should not worry about the ordering of events across nodes using Vector Clocks. There should a unique owner responsible for managing the vector clock operations.
The next section – Implementation Details – helps us realize these goals.
4.4.2 Implementation Details
The GTSM in order to achieve its goals is split into two subcomponents namely – the GTSM Server and the GTSM Client. While, there exists a single server for each instance of the debugging tool, the GTSM clients are mapped one-to-one for each node in the distributed system. As mentioned in Section 5 (“Tool Operation”), the GTSM Manager and the GTSM Server ensure that “N” GTSM clients (where N is the total distributed node count) are started. This section is divided in to the following four sub sections -
• Vector Clock Management
• Significance of GTSM Events
• GTSM Server – Client Communication
• GTSM Server – LSM Communication
• GTSM Client – LSL Communication
4.4.2.1 Vector Clock Management
Our debugging tool uses a Vector Clock to track the number of events at each node. The number of components in the Vector Clock is the same as the number of nodes in the distributed system. Each GTSM Client is assigned a Vector Clock by the GTSM Server during the registration of the client with the server (see section 5.2 “Components Initialization and Interaction”). The Vector Clock has the following structure.
public class VectorClock {private int _components; // the number of components in the clock
14
private int[] _timestamp; // the value for each of the componentsprivate int _index; // the owner of this Vector Clockprivate Lock _lock; // used when manipulating clock data
}
Any change to the vector clock should be made using the specific GTSM Client in charge of that Vector Clock. Changes to the vector clock can come from two sources – the LSL and the GTSM Server.
LSL knows about the GTSM Client it should communicate when through the process explained in section 5.2. LSL requests changes to the vector clock under the following circumstance -
• When an attribute event (happens when the value of an attribute changes in the application node ) is received from LSM. LSL informs the GTSM client to increment its value of the component identified by the VectorClock._index field.
The GTSM Server requests changes – in the form of vector clock merging – to the vector clock under the following circumstance. Note that the GTSM client does not immediately perform the merging as explained below -
• When a receive event (happens when the GTSM Server is notified by the sender of a message) is received by the GTSM Server, it tells the GTSM Client about it. The GTSM Client now notifies the corresponding LSL about this event. The LSL then decides when to request the GTSM Client to merge the received vector clock with its vector clock.
Importance of Vector Clock Management: This management helps achieve the following goal - • LSLs do not need to worry about Vector Clock Management.
4.4.2.2 Significance of Events
The GTSM has to recognize and handle three important events – SYNC, SNAPSHOT_SYNC and SEND Event.
SYNC Event: The SYNC Event is generated by the GTSM Server. It is responsible for syncing the vector timestamps managed by all the GTSM clients. Every GTSM client maintains its own vector clock. The GTSM Server collects the vector timestamps of all the GTSM clients, merges them and then sends the merged vector timestamp to each of the GTSM clients. The GTSM server does not directly send this SYNCed vector clock to the GTSM client, rather a different approach is used as explained in the following sections.
SNAPSHOT_SYNC Event: This event is generated by the GTSM Server and helps the LSL decide when to take a snapshot. More details on the snapshot algorithm can be found in section 4.3.2.3. This event is received by the LSL. When the SNAPSHOT_SYNC event transmission is in progress, the GTSM server makes sure no other SYNC events are in progress until the GTSM server receives back the SNAPSHOT_SYNC event messages it had broadcast (it goes in a cycle coming back to the GTSM server again).
SEND Event: This event is generated by the GTSM Client whenever its corresponding LSL informs it about the sending of a message from the distributed node the LSL is responsible for. This event helps convey the message that there was a message transmission from one distributed application node to another.
15
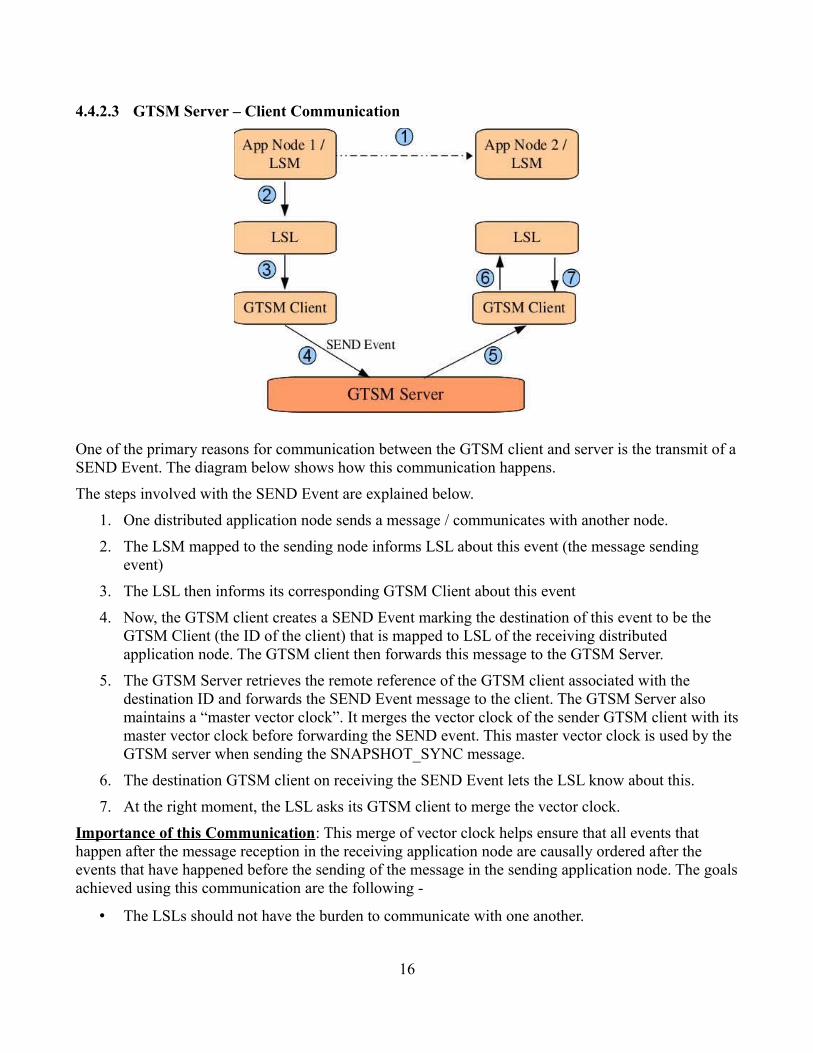
4.4.2.3 GTSM Server – Client Communication
One of the primary reasons for communication between the GTSM client and server is the transmit of a SEND Event. The diagram below shows how this communication happens.
The steps involved with the SEND Event are explained below.
1. One distributed application node sends a message / communicates with another node.
2. The LSM mapped to the sending node informs LSL about this event (the message sending event)
3. The LSL then informs its corresponding GTSM Client about this event
4. Now, the GTSM client creates a SEND Event marking the destination of this event to be the GTSM Client (the ID of the client) that is mapped to LSL of the receiving distributed application node. The GTSM client then forwards this message to the GTSM Server.
5. The GTSM Server retrieves the remote reference of the GTSM client associated with the destination ID and forwards the SEND Event message to the client. The GTSM Server also maintains a “master vector clock”. It merges the vector clock of the sender GTSM client with its master vector clock before forwarding the SEND event. This master vector clock is used by the GTSM server when sending the SNAPSHOT_SYNC message.
6. The destination GTSM client on receiving the SEND Event lets the LSL know about this.
7. At the right moment, the LSL asks its GTSM client to merge the vector clock.
Importance of this Communication: This merge of vector clock helps ensure that all events that happen after the message reception in the receiving application node are causally ordered after the events that have happened before the sending of the message in the sending application node. The goals achieved using this communication are the following -
• The LSLs should not have the burden to communicate with one another.
16

4.4.2.4 GTSM Server – LSM Communication
The GTSM Server and LSM communicate to handle the SYNC Event and the SNAPSHOT_SYNC event. The diagram below shows how this communication happens.
Differences between SYNC and SNAPSHOT_SYNC: The are a couple of differences in the way SYNC and SNAPSHOT_SYNC messages are handled by any component:
1. When a SNAPSHOT_SYNC message transmission is in progress, no other SYNC or SNAPSHOT_SYNC message transmission can be in progress. However, SYNC message transmission do not have this restriction. The SNAPSHOT_SYNC message has this restriction to ensure that every log file generated in the LSL layer is complete and need not depend on other log file generated before and after it. See section 4.3.2.3 for more details.
2. The GTSM server stops sending any other message once it has broadcast the SNAPSHOT_SYNC message until it receives an acknowledgment from all the GTSM clients that they have received the SNAPSHOT_SYNC message. After this acknowledgment, the GTSM server continues in its usual schedule of sending SYNC messages. SYNC messages do not have this restriction, so they are not forwarded from GTSM client to GTSM server.
The steps involved in sending a SYNC / SNAPSHOT_SYNC Event messages is given below.
1. The GTSM Server maintains a master vector clock. The values in the master vector clock get updated as follows – Whenever the GTSM server receives a SEND event from a GTSM client, the master vector clock is merged with the vector clock in the SEND Event (this is the same as the vector clock maintained by the GTSM Client). The GTSM Server generates a SYNC Event / SNAPSHOT_SYNC Event and sends it to all the LSMs. The LSM node information is retrieved from the LSM Manager (see section 5.2).
17
2. LSM forwards the message to LSL.
3. LSL then performs special handling based on what kind of message it is – SNAPSHOT_SYNC or just SYNC. Once the special handling is done, it instructs the GTSM client to merge its vector clock with the clock in the message.
4. The GTSM, then forwards the message only if it is a SNAPSHOT_SYNC event message.
Importance of this Communication: This communication helps ensure the following goals of the GTSM.
• The SYNC events help fake the communication between distributed nodes by sending SYNC messages frequently to LSLs thus avoiding exponential number of states in the lattice of global states.
• The SNAPSHOT_SYNC events helps in the generation of a consistent cut.
To understand why the GTSM Server sends the message to LSM instead of sending it to LSL or GTSM Client, see sections 6.5 and 6.6.
4.4.2.5 GTSM Client – LSL Communication
This communication happens for the following reasons -
• LSL has to request an update to its vector clock when an attribute event is received.
• LSL has to merge its vector clock with that received from SYNC and SNAPSHOT_SYNC events
• LSL has to merge its vector clock when it has received a SEND event from its GTSM client and LSL decides the right time to perform the merge. The GTSM Client first forwards the SEND event it received from the GTSM server to its LSL.
• LSL has to send the SEND Event to the corresponding destination LSL node. The GTSM client and server figure out the corresponding LSL node using the mapping stored in GTSM Manager (see section 5.2).
These are only way GTSM Client and LSL can interact. This communication by itself does not help achieve any specific objective. But, it plays an important role in achieving other objectives like Vector Clock Management.
4.5 Predicate Evaluator (PE)
Determining a distributed system's global state is not a trivial task. Consider a simple system which has two application nodes. Each of these nodes may go through a series of states from time t1 to time t2. If we are to determine the global state of the system at time t1' such that t1 < t1' < t2 , then we have to consider all possible combinations of the nodes' states between times t1 and t2. This is because there is no way for us to know the causal ordering between the first event of node 1 and the last event of node 2 and vice-versa. When the difference between t1 and t2 is large, the number of combinations grows exponentially.
In most distributed applications, nodes in the system communicate messages to other nodes in the system. The communication could be signaling the occurrence of an event, exchanging state
18
information or calling a remote procedure etc., One of the inferences from these communications is that once a communication occurs from node A to node B, it logically follows that any event that subsequently occurs in node B causally succeeds all events before and including the sending event in node A. This aspect helps us to dramatically reduce the number of state combinations to a smaller set. If we can efficiently determine this smaller set, then all we have to do is evaluate the predicate over this smaller set of plausible global states.
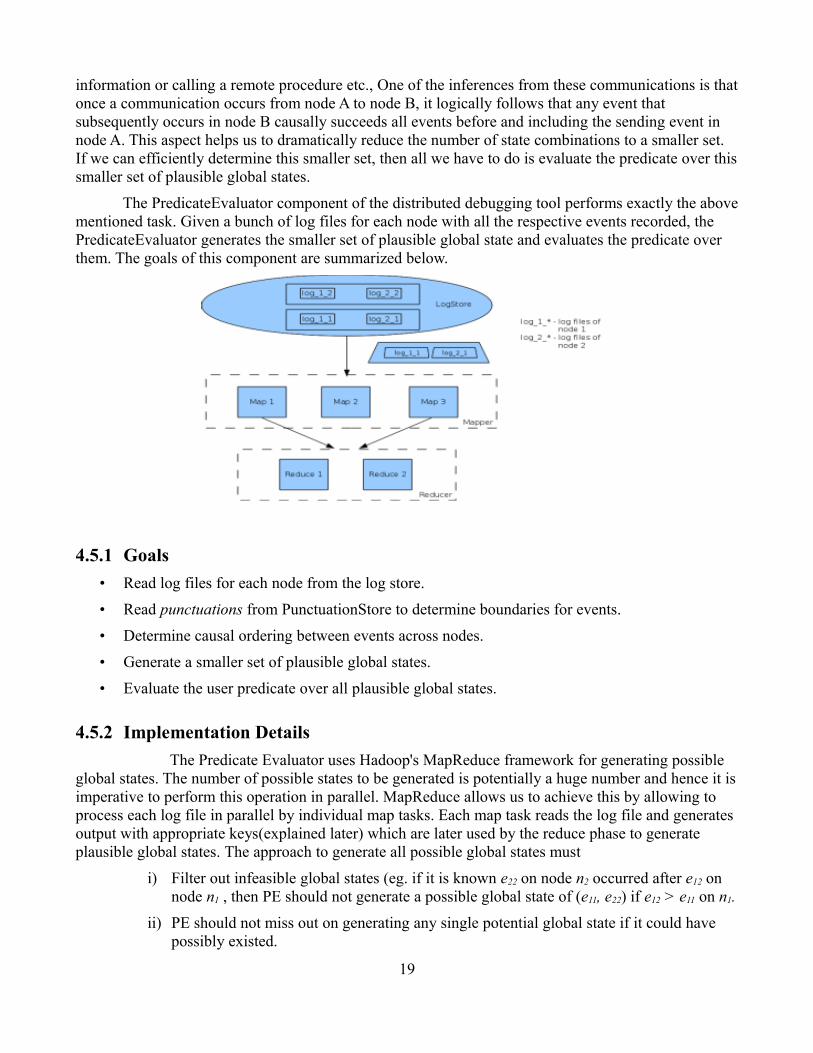
The PredicateEvaluator component of the distributed debugging tool performs exactly the above mentioned task. Given a bunch of log files for each node with all the respective events recorded, the PredicateEvaluator generates the smaller set of plausible global state and evaluates the predicate over them. The goals of this component are summarized below.
4.5.1 Goals
• Read log files for each node from the log store.
• Read punctuations from PunctuationStore to determine boundaries for events.
• Determine causal ordering between events across nodes.
• Generate a smaller set of plausible global states.
• Evaluate the user predicate over all plausible global states.
4.5.2 Implementation Details
The Predicate Evaluator uses Hadoop's MapReduce framework for generating possible global states. The number of possible states to be generated is potentially a huge number and hence it is imperative to perform this operation in parallel. MapReduce allows us to achieve this by allowing to process each log file in parallel by individual map tasks. Each map task reads the log file and generates output with appropriate keys(explained later) which are later used by the reduce phase to generate plausible global states. The approach to generate all possible global states must
i) Filter out infeasible global states (eg. if it is known e22 on node n2 occurred after e12 on node n1 , then PE should not generate a possible global state of (e11, e22) if e12 > e11 on n1.
ii) PE should not miss out on generating any single potential global state if it could have possibly existed.
19
iii) PE should not generate/evaluate the same global state more than once as this is inefficient and time consuming especially given that there are already numerous possibilities to evaluate.
The third requirement though theoritically possible to achieve, we relax it in that for a very small subset of global states our approach evaluates twice. The reason for this is explained below along with algorithm itself.
Our approach relies on the underlying fact that whenever a node n1 communicates a message to another node n2, all subsequent events in n2 definitely occurred causally after the sending of message at n1. Thus all receive events provide some information about causality of events across any two nodes. However in a system where there are multiple nodes, node to node communication alone does not reduce the exponential possibilities to evaluate (eg. sending message from n1 to n2 does not provide any causal relation between n1 and n3). To aid this, the GTSM server (4.4) periodically sends merged timestamps(syncs) of all nodes to all nodes. Thus all receive events together with sync events provide enough information to reduce exponential possibilities. The receive and sync events together are called punctuations. Punctuations of all nodes are together collected in Puncutation Store (4.6).
The Map phase is responsible for outputting variable update events while the reduce phase is responsible for aggregating these events and generating possible global states. The map phase associates keys with events such that events from all maps pertaining to the same key could potentially form a feasible global state. The reduce task determines this feasibility and evaluates the predicate for any feasible global state. The algorithm works as follows.
4.5.2.1 Map Phase
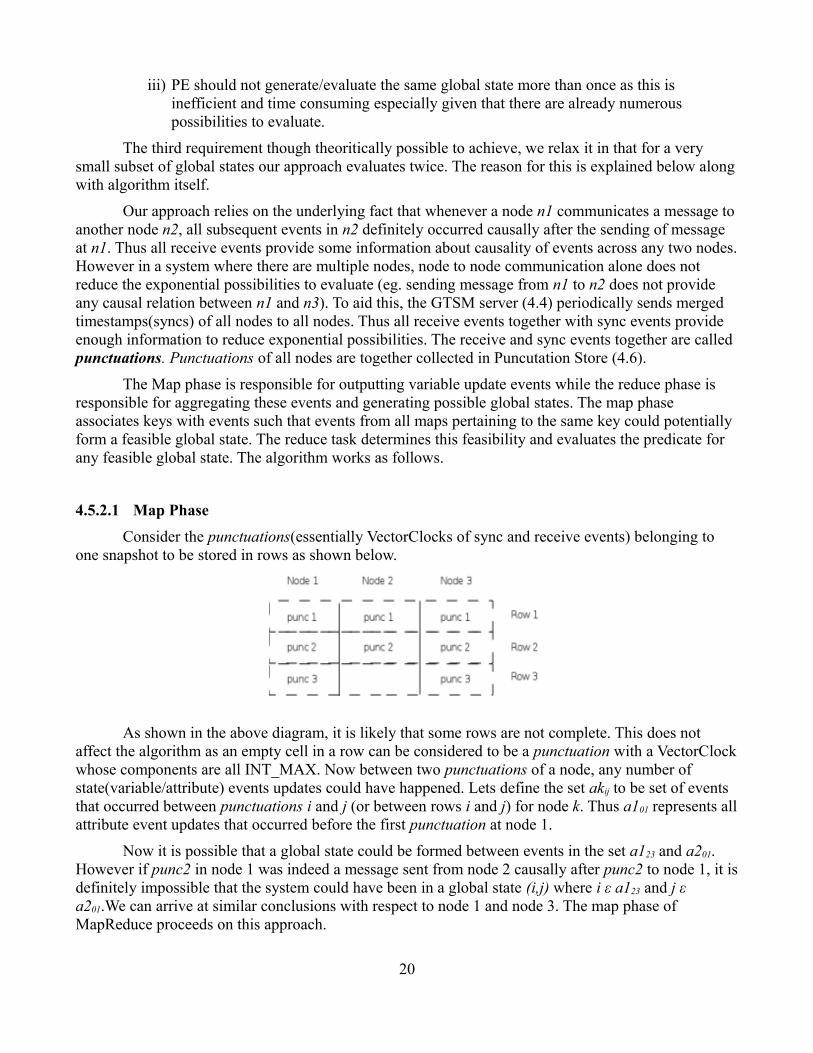
Consider the punctuations(essentially VectorClocks of sync and receive events) belonging to one snapshot to be stored in rows as shown below.
As shown in the above diagram, it is likely that some rows are not complete. This does not affect the algorithm as an empty cell in a row can be considered to be a punctuation with a VectorClock whose components are all INT_MAX. Now between two punctuations of a node, any number of state(variable/attribute) events updates could have happened. Lets define the set akij to be set of events that occurred between punctuations i and j (or between rows i and j) for node k. Thus a101 represents all attribute event updates that occurred before the first punctuation at node 1.
Now it is possible that a global state could be formed between events in the set a123 and a201. However if punc2 in node 1 was indeed a message sent from node 2 causally after punc2 to node 1, it is definitely impossible that the system could have been in a global state (i,j) where i ε a123 and j ε a201.We can arrive at similar conclusions with respect to node 1 and node 3. The map phase of MapReduce proceeds on this approach.
20
Assume one map task is assigned to each node, though we will relax this assumption soon. Each map task contacts the Punctuation Store to obtain the punctuations row information as shown above. Then the algorithm proceeds as follows.
For any map task for node irow_num = 0for each event e
if ( typeOf(e) == receive or typeOf(e) == sync)row_num++;
else if (typeOf(e) == send)continue
for each attribute event ar = rankOfNodeAtRow(row_num)output(attribute event with key “row_num.r”)for each node n 1 to N
if (n == i)continue
for each punctuation row p_row for node np = punctuation(p_row)if (p[n] < a[n])
continuer' = rankOfNodeAtRow(p_row)output(attribute event with key “ p_row.r' ”
In the above algorithm, rank of a node for any given row i is determined by sorting the punctuations of row i and the node with lowest VectorClock is given a rank 1 and so on. This is done so to ensure that keys are generated consistently by separate map tasks.
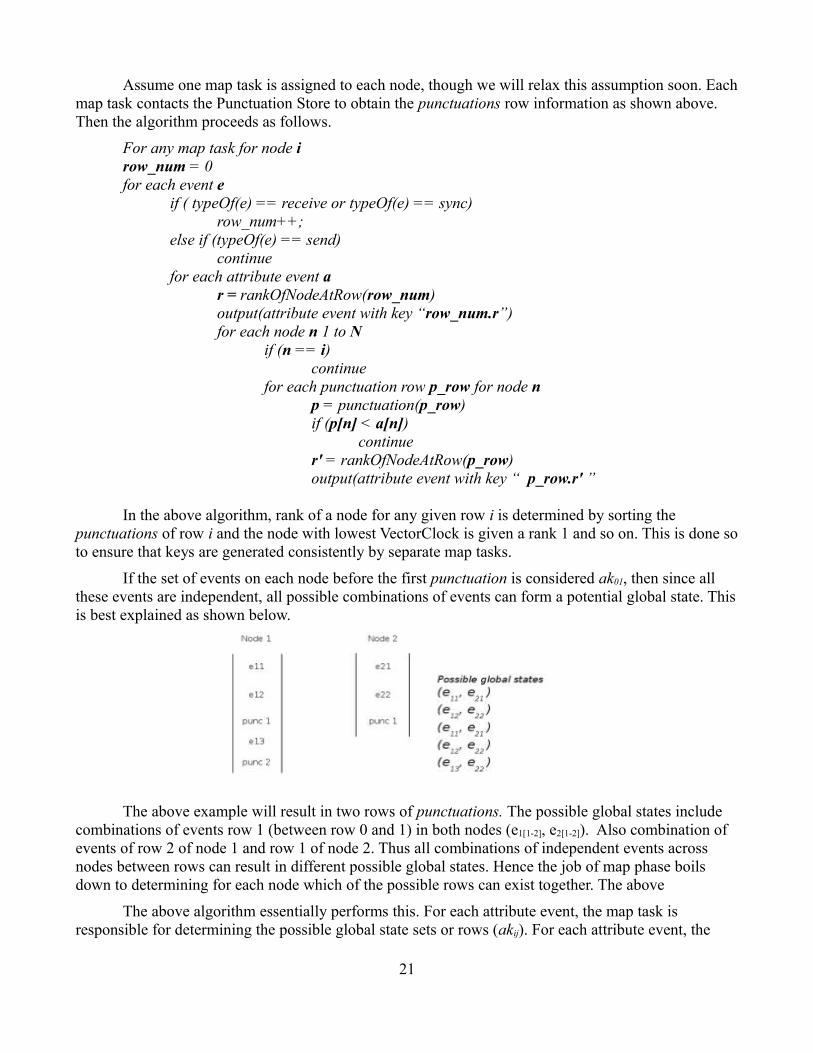
If the set of events on each node before the first punctuation is considered ak01, then since all these events are independent, all possible combinations of events can form a potential global state. This is best explained as shown below.
The above example will result in two rows of punctuations. The possible global states include combinations of events row 1 (between row 0 and 1) in both nodes (e1[1-2], e2[1-2]). Also combination of events of row 2 of node 1 and row 1 of node 2. Thus all combinations of independent events across nodes between rows can result in different possible global states. Hence the job of map phase boils down to determining for each node which of the possible rows can exist together. The above
The above algorithm essentially performs this. For each attribute event, the map task is responsible for determining the possible global state sets or rows (akij). For each attribute event, the
21
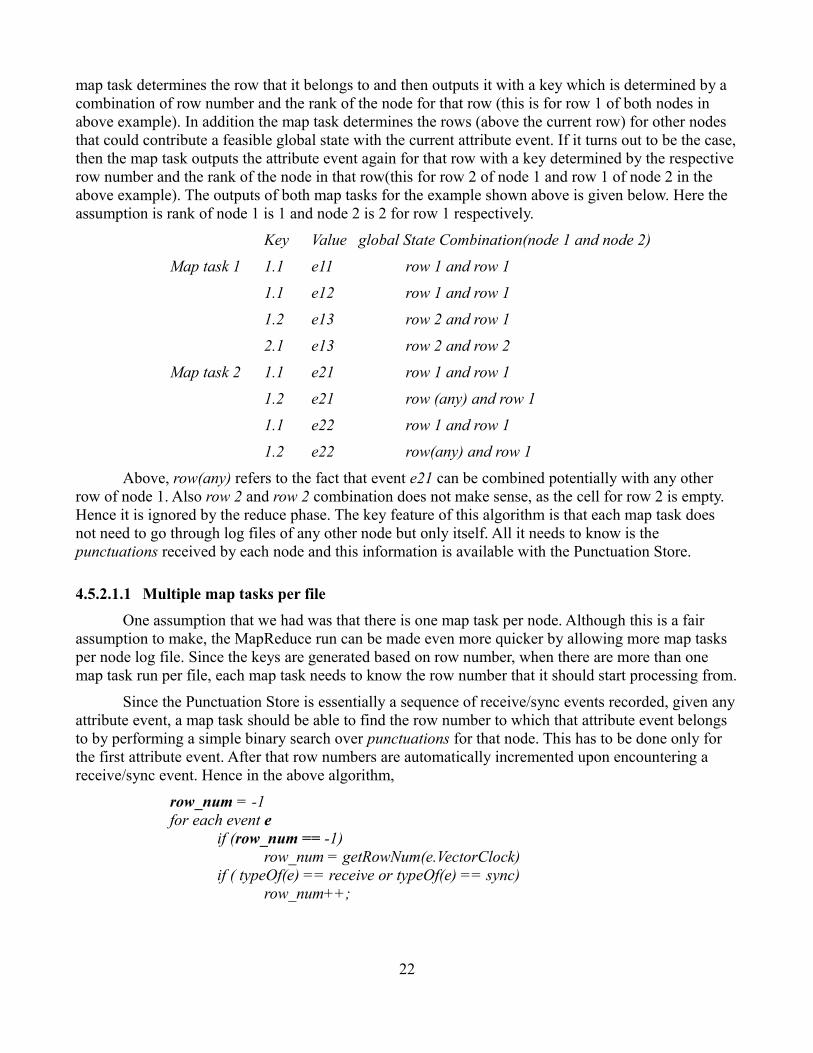
map task determines the row that it belongs to and then outputs it with a key which is determined by a combination of row number and the rank of the node for that row (this is for row 1 of both nodes in above example). In addition the map task determines the rows (above the current row) for other nodes that could contribute a feasible global state with the current attribute event. If it turns out to be the case, then the map task outputs the attribute event again for that row with a key determined by the respective row number and the rank of the node in that row(this for row 2 of node 1 and row 1 of node 2 in the above example). The outputs of both map tasks for the example shown above is given below. Here the assumption is rank of node 1 is 1 and node 2 is 2 for row 1 respectively.
Key Value global State Combination(node 1 and node 2)
Map task 1 1.1 e11 row 1 and row 1
1.1 e12 row 1 and row 1
1.2 e13 row 2 and row 1
2.1 e13 row 2 and row 2
Map task 2 1.1 e21 row 1 and row 1
1.2 e21 row (any) and row 1
1.1 e22 row 1 and row 1
1.2 e22 row(any) and row 1
Above, row(any) refers to the fact that event e21 can be combined potentially with any other row of node 1. Also row 2 and row 2 combination does not make sense, as the cell for row 2 is empty. Hence it is ignored by the reduce phase. The key feature of this algorithm is that each map task does not need to go through log files of any other node but only itself. All it needs to know is the punctuations received by each node and this information is available with the Punctuation Store.
4.5.2.1.1 Multiple map tasks per file
One assumption that we had was that there is one map task per node. Although this is a fair assumption to make, the MapReduce run can be made even more quicker by allowing more map tasks per node log file. Since the keys are generated based on row number, when there are more than one map task run per file, each map task needs to know the row number that it should start processing from.
Since the Punctuation Store is essentially a sequence of receive/sync events recorded, given any attribute event, a map task should be able to find the row number to which that attribute event belongs to by performing a simple binary search over punctuations for that node. This has to be done only for the first attribute event. After that row numbers are automatically incremented upon encountering a receive/sync event. Hence in the above algorithm,
row_num = -1for each event e
if (row_num == -1)row_num = getRowNum(e.VectorClock)
if ( typeOf(e) == receive or typeOf(e) == sync)row_num++;
22
4.5.2.1.2 Complexity of the Map phase
Although the complexity of the algorithm appears of O(n3) it is not the case. If we define n as the number of attribute events for any single node, N the number of nodes in the application, and p as the number of punctuations received by a node, the following assumptions are valid.
i. N << n (N is a constant throughout the application)
ii. p << n
The second assumption is not completely off as in most distributed debugging applications we are interested in attribute states across nodes when communication between them is not as frequent as state changes. Even if it were the case that the application is communication intensive, it only aids in improving the efficiency and speed of generating global possibilities. This is because the more communication between nodes, better information about causality of events across nodes and less number of plausible yet feasible global states. This advantage is clearly visible in the Reduce phase explained below.
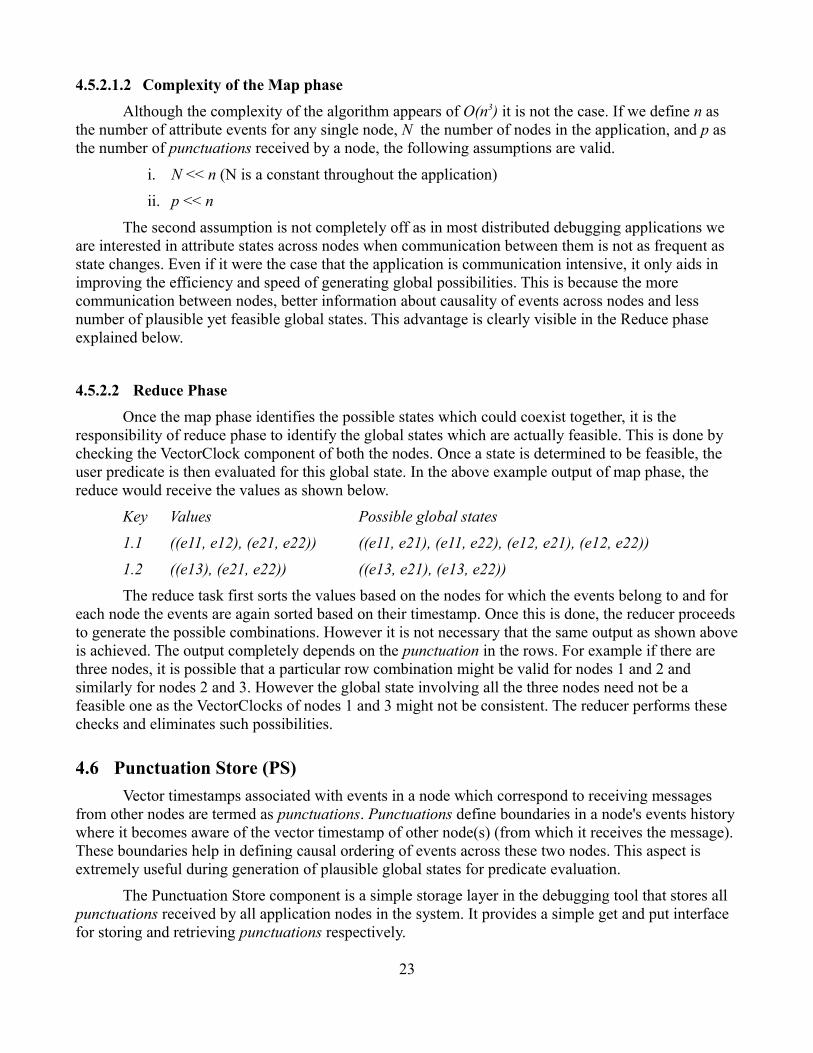
4.5.2.2 Reduce Phase
Once the map phase identifies the possible states which could coexist together, it is the responsibility of reduce phase to identify the global states which are actually feasible. This is done by checking the VectorClock component of both the nodes. Once a state is determined to be feasible, the user predicate is then evaluated for this global state. In the above example output of map phase, the reduce would receive the values as shown below.
Key Values Possible global states
1.1 ((e11, e12), (e21, e22)) ((e11, e21), (e11, e22), (e12, e21), (e12, e22))
1.2 ((e13), (e21, e22)) ((e13, e21), (e13, e22))
The reduce task first sorts the values based on the nodes for which the events belong to and for each node the events are again sorted based on their timestamp. Once this is done, the reducer proceeds to generate the possible combinations. However it is not necessary that the same output as shown above is achieved. The output completely depends on the punctuation in the rows. For example if there are three nodes, it is possible that a particular row combination might be valid for nodes 1 and 2 and similarly for nodes 2 and 3. However the global state involving all the three nodes need not be a feasible one as the VectorClocks of nodes 1 and 3 might not be consistent. The reducer performs these checks and eliminates such possibilities.
4.6 Punctuation Store (PS)
Vector timestamps associated with events in a node which correspond to receiving messages from other nodes are termed as punctuations. Punctuations define boundaries in a node's events history where it becomes aware of the vector timestamp of other node(s) (from which it receives the message). These boundaries help in defining causal ordering of events across these two nodes. This aspect is extremely useful during generation of plausible global states for predicate evaluation.
The Punctuation Store component is a simple storage layer in the debugging tool that stores all punctuations received by all application nodes in the system. It provides a simple get and put interface for storing and retrieving punctuations respectively.
23
4.6.1 Goals
The goals of Punctuation Store layer are summarized below.
• Provide Application Programming Interface(API) to store punctuations.
• Store punctuations for each application node in the system.
• Provide APIs to retrieve stored punctuations.
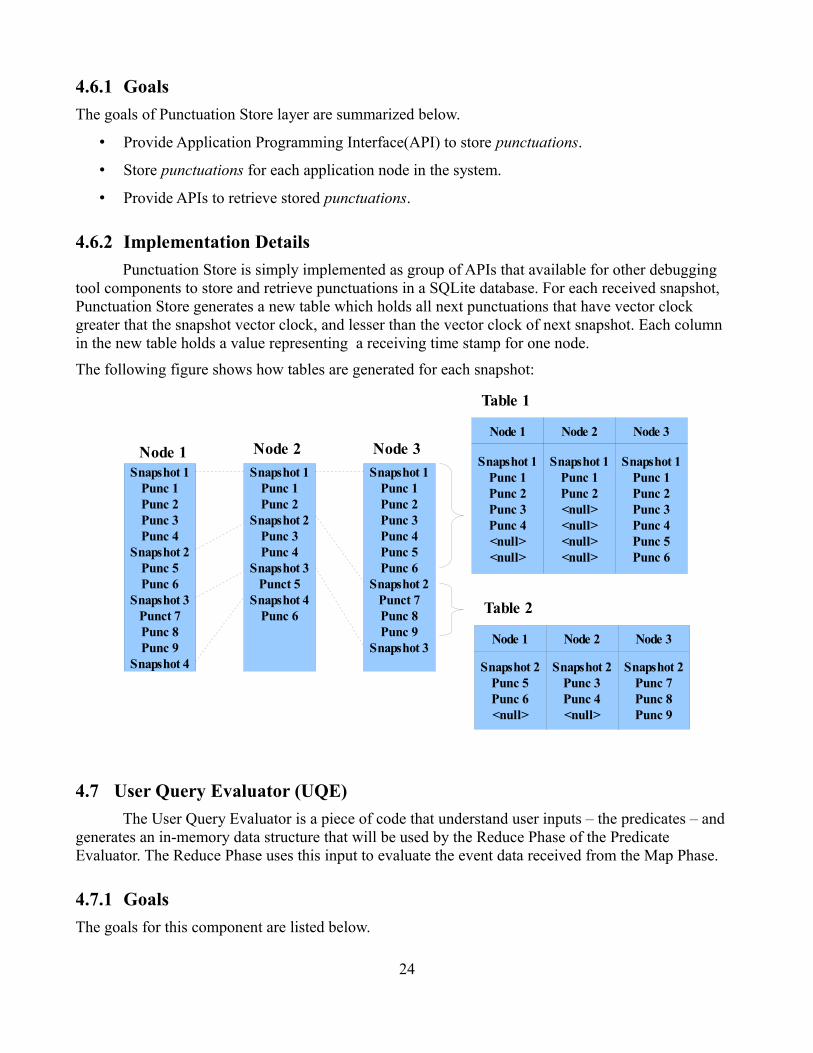
4.6.2 Implementation Details
Punctuation Store is simply implemented as group of APIs that available for other debugging tool components to store and retrieve punctuations in a SQLite database. For each received snapshot, Punctuation Store generates a new table which holds all next punctuations that have vector clock greater that the snapshot vector clock, and lesser than the vector clock of next snapshot. Each column in the new table holds a value representing a receiving time stamp for one node.
The following figure shows how tables are generated for each snapshot:
4.7 User Query Evaluator (UQE)
The User Query Evaluator is a piece of code that understand user inputs – the predicates – and generates an in-memory data structure that will be used by the Reduce Phase of the Predicate Evaluator. The Reduce Phase uses this input to evaluate the event data received from the Map Phase.
4.7.1 Goals
The goals for this component are listed below.
24
Snapshot 1Punc 1Punc 2Punc 3Punc 4
Snapshot 2Punc 5Punc 6
Snapshot 3Punct 7Punc 8Punc 9
Snapshot 4
Snapshot 1Punc 1Punc 2
Snapshot 2Punc 3Punc 4
Snapshot 3Punct 5
Snapshot 4Punc 6
Snapshot 1Punc 1Punc 2Punc 3Punc 4Punc 5Punc 6
Snapshot 2Punct 7Punc 8Punc 9
Snapshot 3
Node 1 Node 2 Node 3Node 1 Node 2 Node 3
Snapshot 1Punc 1Punc 2Punc 3Punc 4<null><null>
Table 1
Snapshot 1Punc 1Punc 2<null><null><null><null>
Snapshot 1Punc 1Punc 2Punc 3Punc 4Punc 5Punc 6
Node 1 Node 2 Node 3
Snapshot 2Punc 5Punc 6<null>
Table 2
Snapshot 2Punc 3Punc 4<null>
Snapshot 2Punc 7Punc 8Punc 9
• The Reduce Phase of the Predicate Evaluator should be immune to the predicate(s) the user wants evaluated.
• The user of the debugging tool should be “unaware” of the face that the debugging tool uses the MapReduce paradigm. This helps us ensure that the user need not know anything about MapReduce.
• Lastly, a less important goal - Reduce Phase should not be complicated
The next section – Implementation Details – helps us realize these goals.
4.7.2 Implementation Details
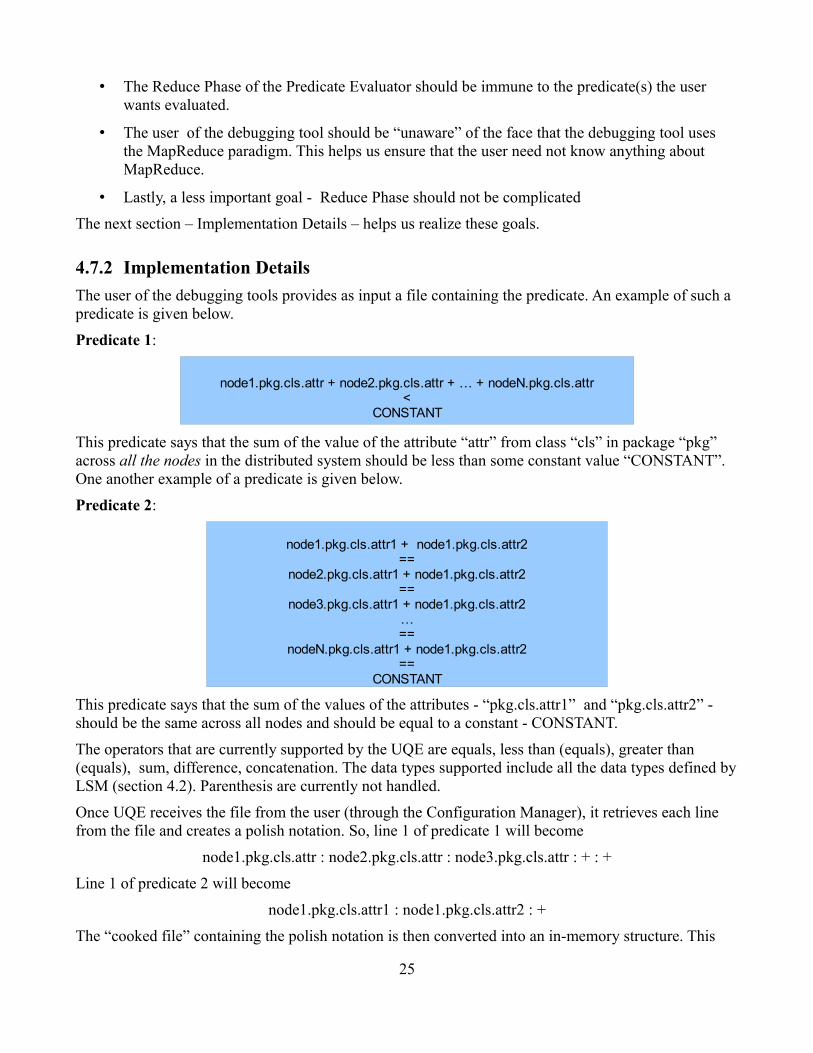
The user of the debugging tools provides as input a file containing the predicate. An example of such a predicate is given below.
Predicate 1:
This predicate says that the sum of the value of the attribute “attr” from class “cls” in package “pkg” across all the nodes in the distributed system should be less than some constant value “CONSTANT”. One another example of a predicate is given below.
Predicate 2:
This predicate says that the sum of the values of the attributes - “pkg.cls.attr1” and “pkg.cls.attr2” - should be the same across all nodes and should be equal to a constant - CONSTANT.
The operators that are currently supported by the UQE are equals, less than (equals), greater than (equals), sum, difference, concatenation. The data types supported include all the data types defined by LSM (section 4.2). Parenthesis are currently not handled.
Once UQE receives the file from the user (through the Configuration Manager), it retrieves each line from the file and creates a polish notation. So, line 1 of predicate 1 will become
node1.pkg.cls.attr : node2.pkg.cls.attr : node3.pkg.cls.attr : + : +
Line 1 of predicate 2 will become
node1.pkg.cls.attr1 : node1.pkg.cls.attr2 : +
The “cooked file” containing the polish notation is then converted into an in-memory structure. This
25
node1.pkg.cls.attr + node2.pkg.cls.attr + … + nodeN.pkg.cls.attr<
CONSTANT
node1.pkg.cls.attr1 + node1.pkg.cls.attr2==
node2.pkg.cls.attr1 + node1.pkg.cls.attr2==
node3.pkg.cls.attr1 + node1.pkg.cls.attr2…==
nodeN.pkg.cls.attr1 + node1.pkg.cls.attr2==
CONSTANT
structure is a ready-to-be-evaluated structure. All it needs is the value for each of the attribute in the predicate. Once these values are mapped to attributes in the structure, query evaluation becomes trivial – it is just a matter of evaluating a polish expression – except that we should handle handle multiple line inputs in the predicate.
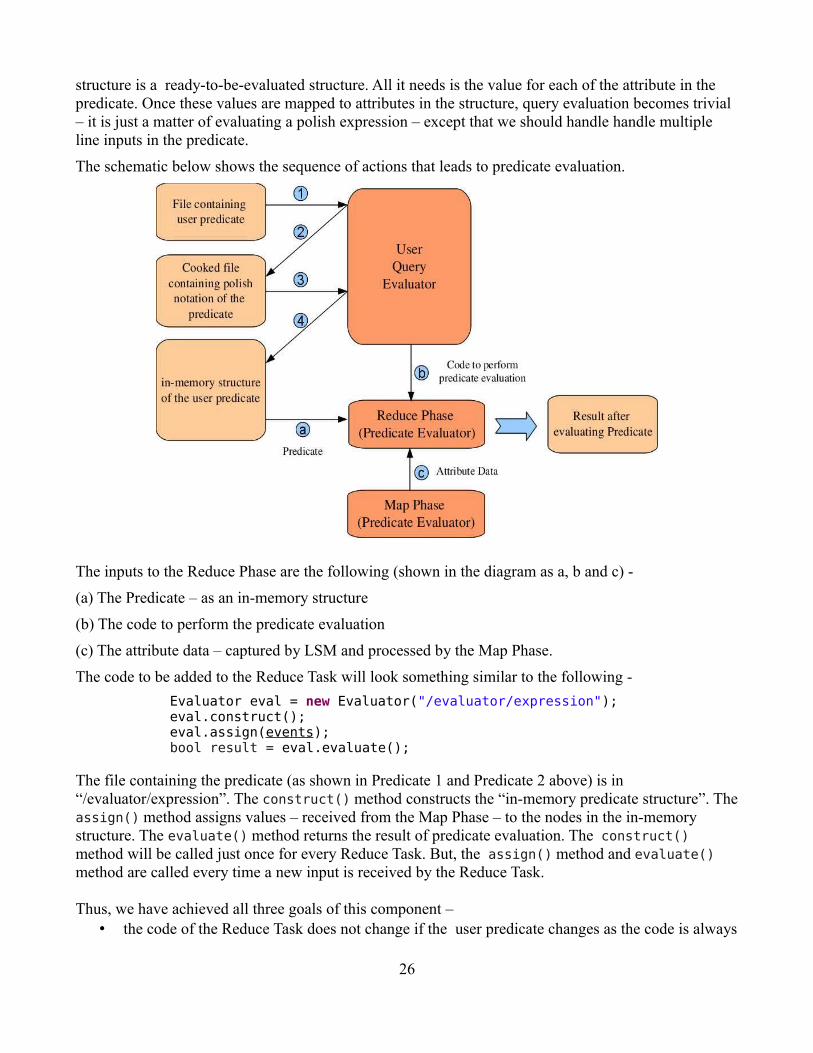
The schematic below shows the sequence of actions that leads to predicate evaluation.
The inputs to the Reduce Phase are the following (shown in the diagram as a, b and c) -
(a) The Predicate – as an in-memory structure
(b) The code to perform the predicate evaluation
(c) The attribute data – captured by LSM and processed by the Map Phase.
The code to be added to the Reduce Task will look something similar to the following -
Evaluator eval = new Evaluator("/evaluator/expression");eval.construct();eval.assign(events);bool result = eval.evaluate();
The file containing the predicate (as shown in Predicate 1 and Predicate 2 above) is in “/evaluator/expression”. The construct() method constructs the “in-memory predicate structure”. The assign() method assigns values – received from the Map Phase – to the nodes in the in-memory structure. The evaluate() method returns the result of predicate evaluation. The construct() method will be called just once for every Reduce Task. But, the assign() method and evaluate() method are called every time a new input is received by the Reduce Task.
Thus, we have achieved all three goals of this component – • the code of the Reduce Task does not change if the user predicate changes as the code is always
26
the same (shown above).• the user is not aware of the existence of a Reduce Task as the user specifies the input in a file in
a specific format, the rest is taken care of by the UQE.• finally, the Reduce Task is not complex.
5 Tool OperationThe goal of this section is to help understand the following -
• How each of the components are initially started
• How each of the components get to know each other
• What happens during the usual working of the tool
To streamline the interaction between various components and to ensure each component can always rely on some external component to get information on other components, we have designed a Configuration Manager. The Configuration Manager is the first component started by the tool.
5.1 Configuration Manager
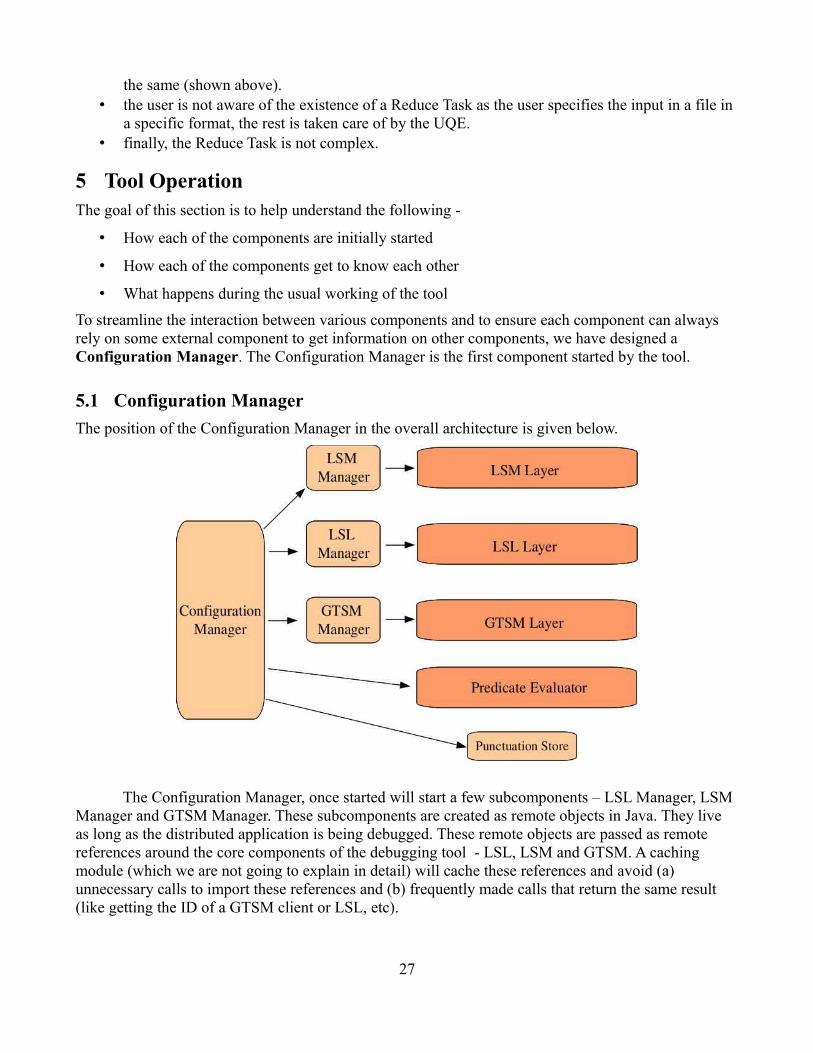
The position of the Configuration Manager in the overall architecture is given below.
The Configuration Manager, once started will start a few subcomponents – LSL Manager, LSM Manager and GTSM Manager. These subcomponents are created as remote objects in Java. They live as long as the distributed application is being debugged. These remote objects are passed as remote references around the core components of the debugging tool - LSL, LSM and GTSM. A caching module (which we are not going to explain in detail) will cache these references and avoid (a) unnecessary calls to import these references and (b) frequently made calls that return the same result (like getting the ID of a GTSM client or LSL, etc).
27
5.2 Components Initialization and Interaction
The Configuration Manager is given a list of nodes (IPs) that could be used to run the following components.
• Local State Manager - LSM
• Local State Logger – LSL
• Global Timestamp Manager - GTSM
• Punctuation Store
• MapReduce tasks of Predicate Evaluator
The Configuration Manager will assign IPs to each of the components randomly. Once that is done, the following actions will take place.
1. Configuration Manager will start the LSM Manager providing the IPs to be used for LSM
2. Configuration Manager will start the LSL Manager providing the IPs to be used for LSM
3. Configuration Manager will start the GTSM Manager providing the IPs to be used for LSM
4. Configuration Manager will start the Punctuation Store. The LSL Manager will contact the Configuration Manager to get the credentials / login information to access the Punctuation Store. The same happens with each of the Map task.
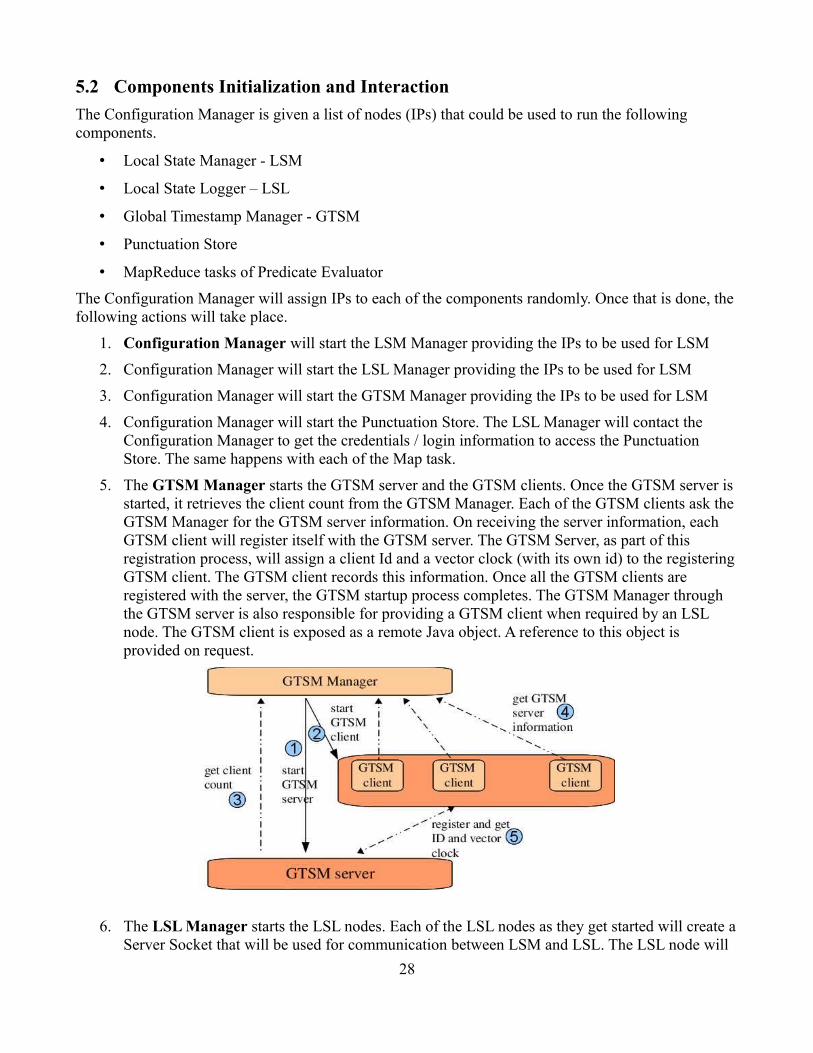
5. The GTSM Manager starts the GTSM server and the GTSM clients. Once the GTSM server is started, it retrieves the client count from the GTSM Manager. Each of the GTSM clients ask the GTSM Manager for the GTSM server information. On receiving the server information, each GTSM client will register itself with the GTSM server. The GTSM Server, as part of this registration process, will assign a client Id and a vector clock (with its own id) to the registering GTSM client. The GTSM client records this information. Once all the GTSM clients are registered with the server, the GTSM startup process completes. The GTSM Manager through the GTSM server is also responsible for providing a GTSM client when required by an LSL node. The GTSM client is exposed as a remote Java object. A reference to this object is provided on request.
6. The LSL Manager starts the LSL nodes. Each of the LSL nodes as they get started will create a Server Socket that will be used for communication between LSM and LSL. The LSL node will
28
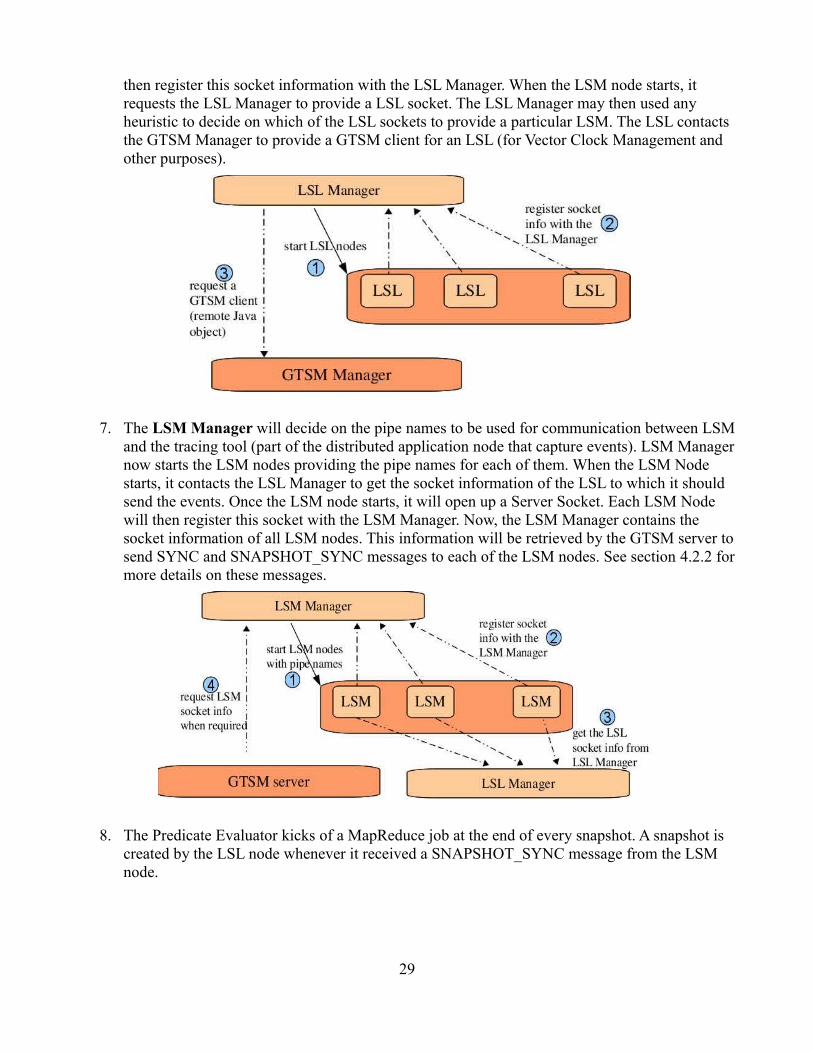
then register this socket information with the LSL Manager. When the LSM node starts, it requests the LSL Manager to provide a LSL socket. The LSL Manager may then used any heuristic to decide on which of the LSL sockets to provide a particular LSM. The LSL contacts the GTSM Manager to provide a GTSM client for an LSL (for Vector Clock Management and other purposes).
7. The LSM Manager will decide on the pipe names to be used for communication between LSM and the tracing tool (part of the distributed application node that capture events). LSM Manager now starts the LSM nodes providing the pipe names for each of them. When the LSM Node starts, it contacts the LSL Manager to get the socket information of the LSL to which it should send the events. Once the LSM node starts, it will open up a Server Socket. Each LSM Node will then register this socket with the LSM Manager. Now, the LSM Manager contains the socket information of all LSM nodes. This information will be retrieved by the GTSM server to send SYNC and SNAPSHOT_SYNC messages to each of the LSM nodes. See section 4.2.2 for more details on these messages.
8. The Predicate Evaluator kicks of a MapReduce job at the end of every snapshot. A snapshot is created by the LSL node whenever it received a SNAPSHOT_SYNC message from the LSM node.
29
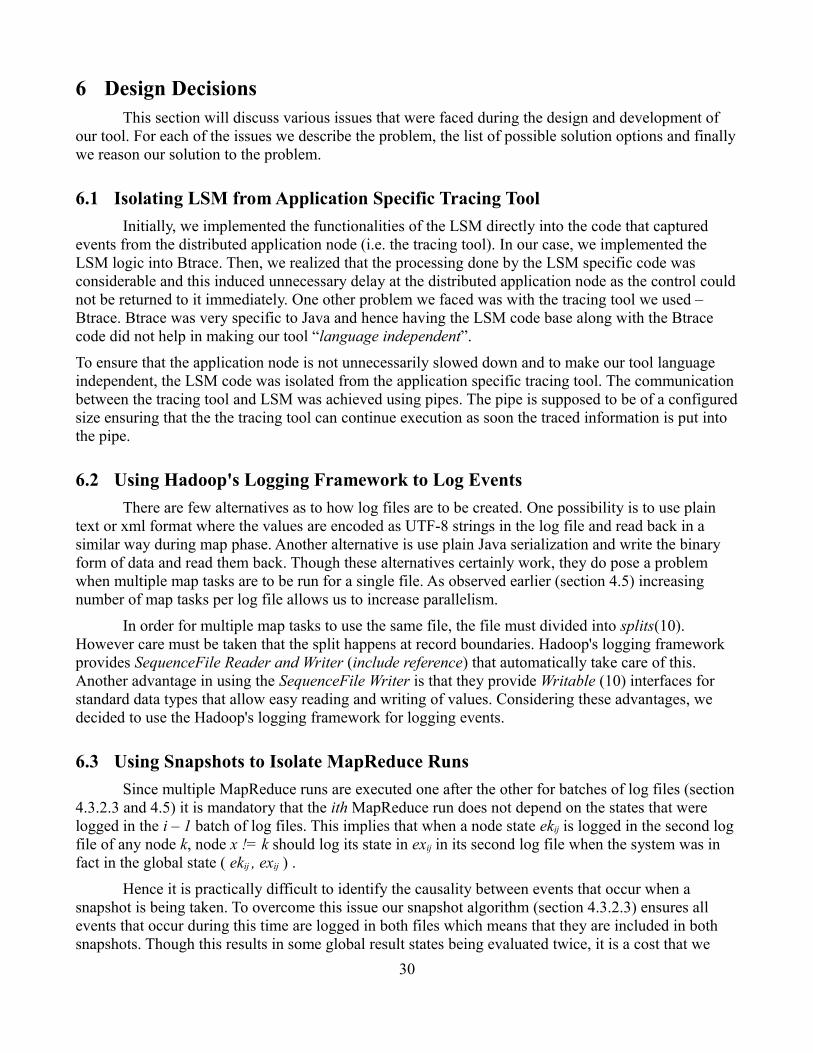
6 Design DecisionsThis section will discuss various issues that were faced during the design and development of
our tool. For each of the issues we describe the problem, the list of possible solution options and finally we reason our solution to the problem.
6.1 Isolating LSM from Application Specific Tracing Tool
Initially, we implemented the functionalities of the LSM directly into the code that captured events from the distributed application node (i.e. the tracing tool). In our case, we implemented the LSM logic into Btrace. Then, we realized that the processing done by the LSM specific code was considerable and this induced unnecessary delay at the distributed application node as the control could not be returned to it immediately. One other problem we faced was with the tracing tool we used – Btrace. Btrace was very specific to Java and hence having the LSM code base along with the Btrace code did not help in making our tool “language independent”.
To ensure that the application node is not unnecessarily slowed down and to make our tool language independent, the LSM code was isolated from the application specific tracing tool. The communication between the tracing tool and LSM was achieved using pipes. The pipe is supposed to be of a configured size ensuring that the the tracing tool can continue execution as soon the traced information is put into the pipe.
6.2 Using Hadoop's Logging Framework to Log Events
There are few alternatives as to how log files are to be created. One possibility is to use plain text or xml format where the values are encoded as UTF-8 strings in the log file and read back in a similar way during map phase. Another alternative is use plain Java serialization and write the binary form of data and read them back. Though these alternatives certainly work, they do pose a problem when multiple map tasks are to be run for a single file. As observed earlier (section 4.5) increasing number of map tasks per log file allows us to increase parallelism.
In order for multiple map tasks to use the same file, the file must divided into splits(10). However care must be taken that the split happens at record boundaries. Hadoop's logging framework provides SequenceFile Reader and Writer (include reference) that automatically take care of this. Another advantage in using the SequenceFile Writer is that they provide Writable (10) interfaces for standard data types that allow easy reading and writing of values. Considering these advantages, we decided to use the Hadoop's logging framework for logging events.
6.3 Using Snapshots to Isolate MapReduce Runs
Since multiple MapReduce runs are executed one after the other for batches of log files (section 4.3.2.3 and 4.5) it is mandatory that the ith MapReduce run does not depend on the states that were logged in the i – 1 batch of log files. This implies that when a node state ekij is logged in the second log file of any node k, node x != k should log its state in exij in its second log file when the system was in fact in the global state ( ekij , exij ) .
Hence it is practically difficult to identify the causality between events that occur when a snapshot is being taken. To overcome this issue our snapshot algorithm (section 4.3.2.3) ensures all events that occur during this time are logged in both files which means that they are included in both snapshots. Though this results in some global result states being evaluated twice, it is a cost that we
30
bear to overcome the problem of missing out plausible global states that might happen if we follow the naïve approach mentioned in section 4.3.2.3.
6.4 Using Counters to Match Send/Receive Events
When one distributed application node sends a message to (or invokes a function in) another application node, two important goals can be achieved.
• We have an opportunity to establish causality between the two nodes. The causality is established by forwarding the vector clock of the sending GTSM Client to the receiving GTSM Client.
• The LSL associated with the receiving node will not process any more events sent to it by the associated LSM unless the SEND Event passes from the GTSM Client of the sending node to the LSL of the receiving node. This communication will be achieved as explained in section 4.4.2.3 (GTSM Server – Client Communication).
Both the goals explained above require the matching of the RECV Event that happens when the receiving application node informs the associated LSM about the message reception. At this point, the LSM will inform the LSL about the message reception at the application node level. Now, the LSL (of the receiving application node) will queue all the subsequent events until it receives the SEND Event from the GTSM Client of the sending application node.
However, it is possible that an application node can receive more than one message from the different application nodes. So, it is important to match a SEND Event with its corresponding RECV Event.
We analyzed a couple of options to achieve this matching.
• Option 1: Inspect / change the Java RMI package to extract the IP of the sending node when a message is received at another application node. Now, the tracing tool, that monitors and informs the LSM about any events happening at the application node, should be able to extract this IP. But, the implementation of the tracing tool is not part of our debugging tool, we cannot always expect this functionality from the tracing tool.
• Option 2: Each LSM maintains one counter per application node from whom it can expect to receive messages. The counter of a specific application node “x” is incremented whenever a node receives a message from that application node “x”. Since, we assume that the messages from the same application node always arrive in the same order (a FIFO queue), it become trivial to match SEND Events with RECV Events.
On analyzing the two methods, we realized that option 2 was simpler and better and we have implemented it. Here is a pictorial representation of how the SEND Event is matched with the RECV Event.
31
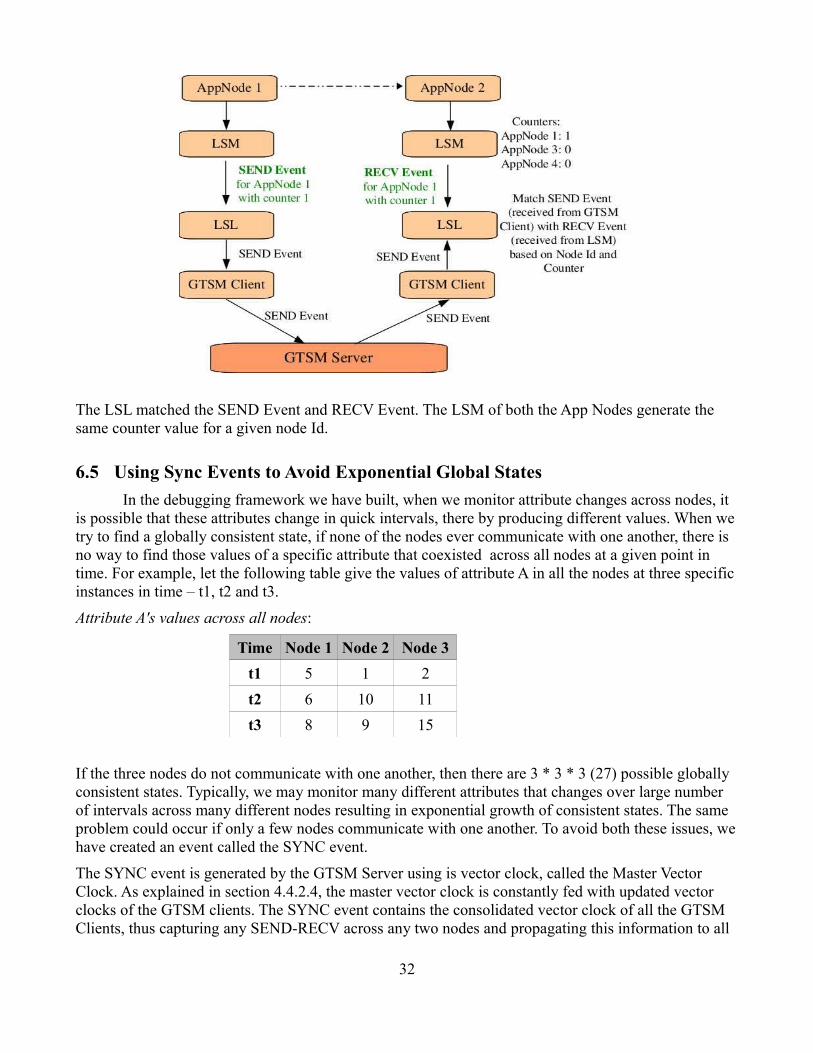
The LSL matched the SEND Event and RECV Event. The LSM of both the App Nodes generate the same counter value for a given node Id.
6.5 Using Sync Events to Avoid Exponential Global States
In the debugging framework we have built, when we monitor attribute changes across nodes, it is possible that these attributes change in quick intervals, there by producing different values. When we try to find a globally consistent state, if none of the nodes ever communicate with one another, there is no way to find those values of a specific attribute that coexisted across all nodes at a given point in time. For example, let the following table give the values of attribute A in all the nodes at three specific instances in time – t1, t2 and t3.
Attribute A's values across all nodes:
Time Node 1 Node 2 Node 3
t1 5 1 2
t2 6 10 11
t3 8 9 15
If the three nodes do not communicate with one another, then there are 3 * 3 * 3 (27) possible globally consistent states. Typically, we may monitor many different attributes that changes over large number of intervals across many different nodes resulting in exponential growth of consistent states. The same problem could occur if only a few nodes communicate with one another. To avoid both these issues, we have created an event called the SYNC event.
The SYNC event is generated by the GTSM Server using is vector clock, called the Master Vector Clock. As explained in section 4.4.2.4, the master vector clock is constantly fed with updated vector clocks of the GTSM clients. The SYNC event contains the consolidated vector clock of all the GTSM Clients, thus capturing any SEND-RECV across any two nodes and propagating this information to all
32
the other nodes. We could also send periodic ping messages from the GTSM clients to the server letting the server know of the number of events that have happened in each client. Once the vector clocks are merged for a given node, all the events that happen in this node will causally follow the events that have happened in all the other nodes as given by the individual components of its vector clock. Thus, exponential global states are avoided.
6.6 Avoiding Causality Inducement across Independent Events
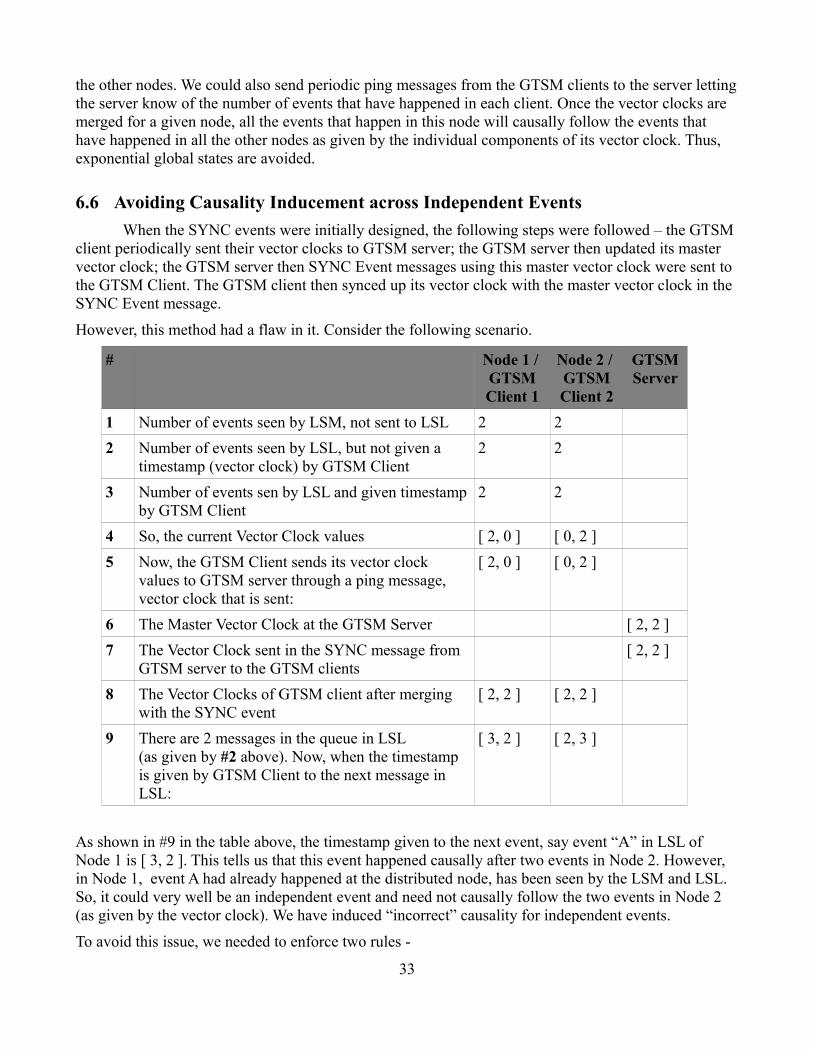
When the SYNC events were initially designed, the following steps were followed – the GTSM client periodically sent their vector clocks to GTSM server; the GTSM server then updated its master vector clock; the GTSM server then SYNC Event messages using this master vector clock were sent to the GTSM Client. The GTSM client then synced up its vector clock with the master vector clock in the SYNC Event message.
However, this method had a flaw in it. Consider the following scenario.
# Node 1 / GTSM Client 1
Node 2 / GTSM Client 2
GTSM Server
1 Number of events seen by LSM, not sent to LSL 2 2
2 Number of events seen by LSL, but not given a timestamp (vector clock) by GTSM Client
2 2
3 Number of events sen by LSL and given timestamp by GTSM Client
2 2
4 So, the current Vector Clock values [ 2, 0 ] [ 0, 2 ]
5 Now, the GTSM Client sends its vector clock values to GTSM server through a ping message, vector clock that is sent:
[ 2, 0 ] [ 0, 2 ]
6 The Master Vector Clock at the GTSM Server [ 2, 2 ]
7 The Vector Clock sent in the SYNC message from GTSM server to the GTSM clients
[ 2, 2 ]
8 The Vector Clocks of GTSM client after merging with the SYNC event
[ 2, 2 ] [ 2, 2 ]
9 There are 2 messages in the queue in LSL (as given by #2 above). Now, when the timestamp is given by GTSM Client to the next message in LSL:
[ 3, 2 ] [ 2, 3 ]
As shown in #9 in the table above, the timestamp given to the next event, say event “A” in LSL of Node 1 is [ 3, 2 ]. This tells us that this event happened causally after two events in Node 2. However, in Node 1, event A had already happened at the distributed node, has been seen by the LSM and LSL. So, it could very well be an independent event and need not causally follow the two events in Node 2 (as given by the vector clock). We have induced “incorrect” causality for independent events.
To avoid this issue, we needed to enforce two rules -
33
• We need a way to ensure that the SYNC messages that were sent by the GTSM server should reach the LSL only after all the messages in the LSM and LSL queue were given a timestamp by the corresponding GTSM client.
• LSM received events from the application specific tracing tool through pipes (similar to UNIX pipes). This pipe has a fixed length. Apart from the LSM and LSL queue, this pipe could also have some events that have already happened in the distributed application node. We should account for events in this pipe also.
In order to enforce these two rules, we modified the SYNC event message generation / transmission procedure as follows -
1. The GTSM receives receives vector clocks of GTSM clients either through ping message or SEND / RECV communication. The GTSM Server merges the vector clock with its master vector clock.
2. The GTSM server generates the SYNC event using the master vector clock.
3. The GTSM server then broadcasts the SYNC message to all LSM nodes.
4. Once the LSM node received the SYNC event, it does the following -
i. Caches the messages
ii. Wait for the pipe it uses to communicate with the application specific tracing to either empty or until the size of messages read by LSM from the pipe is equal to the size of the pipe
iii. When one of these two conditions are satisfied, it sends the SYNC message to LSL.
5. LSL then forwards the message to GTSM Client which merges the master vector clock in the SYNC message with its local vector clock.
Since, we are sending the SYNC event messages to LSM instead of GTSM client, we have ensured that the SYNC event is processed only after all the messages in the LSM queue and LSL queue. Step 4 above ensure that any message that is in the pipe connecting the LSM and the tracing tool is processed first before the SYNC message is processed by LSM. Thus, we have avoided inducing causality across independent events.
6.7 Isolating VectorClock Management from LSL
Initially, we had the vector clock management code integrated with LSL. Later, we realized that LSL's responsibility was just to log messages and as such the chores involved with vector clock management was significant enough to warrant a component on its own. Also, the handling of SEND events needed a special component to free the LSLs from worrying about the communication with other LSLs. Added to this, SYNC and SNAPSHOT_SYNC messages had to be handled differently. All these tasks led to the creation of simple component called the GTSM client. The GTSM Server and GTSM Client could be developed and tested independently from LSL. This also helped reduce the time to integrate GTSM with LSL.
6.8 Avoiding Log File Reads in the Reduce Phase
One approach for the MapReduce operation would be to have the map tasks simply identify the receive/sync events and identify the row boundaries(section 4.5). The reduce task would then go
34
through each of the log files for all nodes then generate possible global states. This approach is relatively simpler to implement and is very intuitive. However this approach is severely inefficient in the reduce phase. Each reduce task ends up reading all log files multiple times depending on global state possibilities.
Our approach of splitting the above responsibilities between map and reduce requires only one read per log file. Here the map performs the task of reading log files while the reduce task generates all possible combinations. Although this approach could incur more network i/o compared to previous approach, it provides the advantage of increased parallelism. Since most of the log files are stored in HDFS(include reference) reading a file multiple times as in the earlier approach indeed increases network i/o which is minimized to a great extent in our approach. In addition the map phase itself filters out many possibilities by not outputting all key values for any attribute event. (section 4.5.2.1)
6.9 Improving MapReduce Efficiency Using Punctuation Store
Punctuation Store(section 4.6) helps to improve the efficiency of the MapReduce jobs by avoiding multiple log file reads. As explained in the MapReduce algorithm(section 4.5), it is imperative to identify receive/sync events to determine causality of events.
An alternative is to read the log files a priori and determine the receive/sync events. This could be done either in the map or reduce phase depending on the implementation. However this is inefficient for reasons mentioned in 6.10. Recording these receive/sync events(punctuations) while logging itself by each LSL ensures that each map task has to consult the Punctuation Store and determine the punctuation information. Since Punctuation Store is implemented as a database that can simultaneously multiple connections with low latencies it does not impact the performance of map tasks.
7 Future WorkWe have implemented a distributed debugging tool that can evaluate user predicates involving
primitive type variables over a system of any number of nodes. Our tool efficiently avoids evaluating exponential combinations of global states through periodic syncs and snapshots. However there are areas that can definitely be improved.
For instance, currently MapReduce runs are run in a batch mode where a run is kicked off only after a snapshot message is communicated to all nodes and the log files are rotated. Snapshot messages are sent periodically which means there is certainly a time interval between occurring of events and evaluating the user predicate for corresponding possible global states. One alternative is to employ a Continuous MapReduce (11), which can accept a stream of inputs and continuously process the logs. There can be a dedicated set of map tasks each receiving inputs from all the Local State Loggers and the corresponding reduce tasks should continuously evaluate the user predicate. This certainly improves the response times of indicating the user about the results of predicate evaluation.
Additionally we currently handle only predicates involving primitive variables. The User Query Evaluator could be extended to parse and comprehend complex predicates involving object instances. The Hadoop logging framework (Writable interfaces) could be extended to support writing complex class instances-. This would certainly entail developing more complex log writing procedures but would enhance flexibility and utility of the tool for the end users while deciding predicates for testing their system.
Current implementation of the tool does not provide efficient fault tolerance when LSM, LSL or
35
GTSM nodes fail. We intend to provide good fault tolerance mechanisms to these components. The GTSM server is a single point of failure. Although providing a fail over for GTSM Server is complicated, we feel it is doable. This is something that will increase the reliability of the tool significantly.
The LSM nodes provide a pipe as the only interface to the tracing tool that captures events from the distributed application node. We feel we could provide alternatives mechanisms like sockets, remote objects, etc based on the language used to implement the distributed application.
8 ConclusionThis project demonstrates the utility of having a distributed debugging tool to evaluate
predicates by generating globally consistent states from distributed nodes. It shows how we can get away from exponential global states in-spite of having few / no communication between application nodes. The tool tries to achieve maximum parallelization by using Hadoop's Map Reduce framework. Since this tool does not place any computational burden on the node that runs the distributed application, the performance impact on the application because of the tool itself is minimal.
We hope that this project will help in adaptation of some new techniques on how to make distributed debugging efficient through parallelization. It is clear that distributed computing is an omnipresent paradigm at present and in the foreseeable future. It is also clear that debugging a distributed application is a difficult problem. Hence, having an efficient distributed debugging tool will be quintessential to develop bug free distributed application.
36
9 References1. Distributed system concepts and design - Tim Kindberg, George Coulouris, Jean Dollimore.
link
2. D3S: Debugging Deployed Distributed Systems. link
3. Btrace – Java Tracing Tool. link
4. Lazy Replication – Exploiting the Semantics of Distributed Services. link
5. A Paradigm for Distributed Debugging. link
6. Understanding the Limitations of Causally and Totally Ordered Communication. link
7. Replay Debugging for Distributed Applications. link
8. Debugging Parallel Programs with Instant Replay. link
9. Annual Review of Scalable Computing, Volume 6. link
10. Apache Hadoop. link
11. Continuous MapReduce link
37


![Debugging Distributed Systems - Devoxx Belgium 2016 [Extended]](https://img.pdfslide.net/doc/110x75/588037f91a28abfd0a8b481b/debugging-distributed-systems-devoxx-belgium-2016-extended.jpg)