Embed Size (px)
Citation preview

Efficient experimental validation of photonic boson sampling against the uniformdistribution
Nicolo Spagnolo,1 Chiara Vitelli,1, 2 Marco Bentivegna,1 Daniel J. Brod,3 Andrea
Crespi,4, 5 Fulvio Flamini,1 Sandro Giacomini,1 Giorgio Milani,1 Roberta Ramponi,4, 5
Paolo Mataloni,1, 6 Roberto Osellame,4, 5, ∗ Ernesto F. Galvao,3, † and Fabio Sciarrino1, 6, ‡
1Dipartimento di Fisica, Sapienza Universita di Roma, Piazzale Aldo Moro 5, I-00185 Roma, Italy2Center of Life NanoScience @ La Sapienza, Istituto Italiano di Tecnologia, Viale Regina Elena, 255, I-00185 Roma, Italy
3Instituto de Fısica, Universidade Federal Fluminense,Av. Gal. Milton Tavares de Souza s/n, Niteroi, RJ, 24210-340, Brazil
4Istituto di Fotonica e Nanotecnologie, Consiglio Nazionale delle Ricerche (IFN-CNR),Piazza Leonardo da Vinci, 32, I-20133 Milano, Italy
5Dipartimento di Fisica, Politecnico di Milano, Piazza Leonardo da Vinci, 32, I-20133 Milano, Italy6Istituto Nazionale di Ottica (INO-CNR), Largo E. Fermi 6, I-50125 Firenze, Italy
A boson sampling device is a specialised quan-tum computer that solves a problem which isstrongly believed to be computationally hardfor classical computers [1]. Recently a num-ber of small-scale implementations have been re-ported [2–5], all based on multi-photon interfer-ence in multimode interferometers. In the hard-to-simulate regime, even validating the device’sfunctioning may pose a problem [6]. In a recentpaper, Gogolin et al. [7] showed that so-calledsymmetric algorithms would be unable to distin-guish the experimental distribution from the triv-ial, uniform distribution. Here we report newboson sampling experiments on larger photonicchips, and analyse the data using a scalable sta-tistical test recently proposed by Aaronson andArkhipov [8]. We show the test successfully vali-dates small experimental data samples against thehypothesis that they are uniformly distributed.We also show how to discriminate data arisingfrom either indistinguishable or distinguishablephotons. Our results pave the way towards largerboson sampling experiments whose functioning,despite being non-trivial to simulate, can be cer-tified against alternative hypotheses.
Large-scale quantum computers hold the promise ofefficiently solving problems which are believed to be in-tractable for classical computers, such as integer factor-ing [9]. We are, however, far from being able to exper-imentally demonstrate a large-scale, universal quantumcomputer [10]. This has motivated the recent study ofdifferent classes of restricted quantum computers [11, 12],which may provide a more feasible way of experimentallyestablishing what has been called the quantum compu-tational supremacy [13] over classical computers.
One example of these restricted quantum computersare multi-mode interferometers designed to solve theBoson Sampling problem [1], recently demonstrated insmall-scale photonic experiments [2–5]. The Boson Sam-pling problem involves simulating the following quantum
experiment (see Fig. 1 a,b): input n bosons in differentmodes of an m-mode linear interferometer (m > n) andmeasure the distribution of bosons at the interferome-ter’s output modes. If performed with indistinguishablebosons, this experiment results in an output distributionwhich is hard to sample, even approximately, on classicalcomputers [1] (under very mild computational complex-ity assumptions). The input for the classical simulationconsists in the m × m unitary matrix U describing theinterferometer and the list of n input modes used. It isdesirable to choose U randomly, both to avoid regularitiesthat could simplify the classical simulation, and becausethe main hardness-of-simulation proof of [1] holds onlyfor uniformly sampled unitaries. These recent theoreticaland experimental results motivated further investigationson error tolerances [14, 15], as well as additional analy-ses of optical implementations [16, 17]. Very recently,there appeared a proposal to implement Boson Samplingcomputers using trapped ions [18].
It has been suggested recently, however, that due totheir very complexity, large boson sampling experimentscould not possibly be validated, i.e. their proper func-tioning could not be ascertained. Gogolin et al. showedin [7] that so-called symmetric algorithms fail to distin-guish the distribution of experimental data from the triv-ial, uniform distribution. Intuitively, it seems hard to usean experimental data set of polynomial size (in n) to dis-tinguish two distributions over a sample space which isexponentially large. This criticism put in question thenotion that larger boson sampling experiments could beshown to decisively outperform classical computers.
This criticism of Boson Sampling has been recently re-futed by Aaronson and Arkhipov [8], who argued thatit was unreasonable to restrict the statistical analysisto symmetric algorithms only. Moreover, Aaronson andArkhipov showed that it is indeed possible to discrim-inate experimental data against the uniform distribu-tion by taking advantage of the input data of the bosonsampling problem (the unitary U and the input state).They proposed a scalable validation test which, for large
arX
iv:1
311.
1622
v2 [
quan
t-ph
] 8
Nov
201
3

2
101000010
d)c)
b) Boson SamplerElectronic stage
m=5 m=7 m=9
010010010
U
Uniform Sampler
outcome j
0
1
2
1 84
101000100
110000100
U
a)
# ev
ents
|0,0,1,1,0,1,0,0,0>Input state
Unitary
Fig. 1: Boson sampling and its certification. a) The Boson Sampling problem consists in sampling from the outputdistribution of n bosons evolving according to a linear transformation U . The m × m unitary matrix U together with theinput state are known quantities in the problem. b) Photonic implementation of Boson Sampling: n indistinguishable photonsinterfere in a random, linear m-mode interferometer, with photo-detection at the output modes. Let us call Boson Sampleran agent that provides events generated by a Boson Sampling experiment; our implementation is shown schematically here.c) The Uniform Sampler is an agent that generates events classically according to a uniform distribution over outputs. d) Weare interested in how well a third agent, the certifier Caesar, can use information about U to distinguish the output data setsgenerated by Boson Sampler from those generated by Uniform Sampler.
enough n and uniformly-drawn unitaries, succeeds withhigh probability using only a constant number of samples(see the Methods section for a description of the test).
Here we report photonic boson sampling experimentsperformed with 3 photons in randomly-designed inte-grated chips with 5, 7 and 9 modes, corresponding to10, 35 and 84 different no-collision outputs, i.e. outputswith at most one photon per mode. We analyse the ex-perimental data using the Aaronson-Arkhipov validationtest [8], showing that the test works in practice, evenin the presence of experimental imperfections. We alsoshow how we can successfully tell apart data correspond-ing to distinguishable and indistinguishable photons inthese experiments.
To perform boson sampling experiments we used threeingredients: a three-photon source, randomly designedinterferometers and a detection apparatus able to recordall the three-photon coincidence events at the output ofthe interferometer (see Fig. 1 b). The three-photon inputstate is produced by exploiting the second order para-metric down conversion process, with three photons sentinto the interferometers and a fourth one used as a trig-ger. We fabricated stable, integrated [19] interferometerswith 5, 7 and 9 modes in a glass chip by femtosecondlaser waveguide writing [20–22]. This technique consistsin a direct inscription of waveguides in the glass volume,exploiting the nonlinear absorption of focused femtosec-
ond laser pulses to induce a permanent and localized in-crease in the refractive index. Single photons may jumpbetween waveguides by evanescent coupling in regionswhere waveguides are brought close together, thus realis-ing the beam splitter transformation. Precise control ofthe coupling between the waveguides and of the photonpath lengths, enabled by a 3D waveguide design [2], al-lowed us to engineer arbitrary interferometers by cascad-ing directional couplers and phase shifters with differentlayouts (see Fig. 1 b and Refs. [2, 23–26]). Finally, singlephoton counting detectors and an electronic acquisitionapparatus are used to reconstruct the probabilities as-sociated with all three-photon coincidence events at thechip’s output. Further details on the integrated circuitsand on the experimental set-up are given in the Methodssection.
Let us now discuss how a certifier (Caesar) can validatesmall sets of boson sampling data generated by an agentwe call the Boson Sampler (BS), against the hypothesisthat they might have been generated by Uniform Sampler(US), an agent that samples from the uniform probabilitydistribution (see Fig. 1 b-d). Caesar succeeds by usingthe Aaronson-Arkhipov test [8] (described in the Meth-ods section) on small experimental data sets. We haveapplied this test to multiple, random experimental datasets of varying sizes. This enabled us to gauge the trade-off between set size and success rate, which has been

3
10 15 20 25 30 35 40 45 50 55 60 3
4
5
6
0100200300400
Nset
Psuccess
20 40 60 80 100 120 1400
0.2
0.4
0.6
0.8
1
Nset
Psuccess
20 40 60 80 100 120 1400
0.2
0.4
0.6
0.8
1
Nset
Psuccess
20 40 60 80 100 120 1400
0.2
0.4
0.6
0.8
1
Nset
Psuccess
50 100 150 200 250 3000
0.2
0.4
0.6
0.8
1d)
a)
e)
n
m
Nmin
Boson Sampler
Uniform Sampler
Boson Sampler Boson Sampler
Uniform Sampler Uniform Sampler
5-mode interferometer b) 7-mode interferometer c) 9-mode interferometer
Boson Sampler
Uniform Sampler
Fig. 2: Experimental validation of boson sampling. Performance of the validation test of reference [8] using experimentaldata sets of varying sizes. Here we show Caesar’s success rate Psuccess in distinguishing the sets, as a function of set sizeNset, in experiments using a) one Haar-random 5-mode interferometer (red circle points: input state |0, 1, 1, 1, 0〉); b) fourdifferent three-photon input combinations in a random 7-mode interferometer (green circle points: input state |0, 0, 1, 1, 1, 0, 0〉;cyan circle points: input state |0, 0, 0, 1, 1, 1, 0〉; black circle points: input state |0, 1, 0, 1, 0, 1, 0〉; magenta circle points: inputstate |1, 1, 1, 0, 0, 0, 0〉); c) two different three-photon inputs in a random 9-mode interferometer (red circle points: input state|0, 0, 0, 1, 1, 1, 0, 0, 0〉; black circle points: input state |0, 0, 1, 1, 0, 0, 0, 1, 0〉). Grey dashed line: level for 95% success probability.Square points: numerical simulations, averaged over 1000 data sets of size Nset, of the validation test for data generated byUniform Sampler. In all plots, blue shaded region corresponds to the theoretical prediction of the Boson sampling validation,reported as 1.5-standard deviation and obtained by averaging over a numerical simulation with 1000 Haar-uniform unitaries.The average is performed by excluding the unitaries where the success rate does not reach 95% even with Nset = 5000. Thenumber of unitaries with the (asymptotically proven) correct behaviour was respectively 434 (m = 5), 573 (m = 7), 822(m = 9) and, for fixed n, increases with m. Green shaded region corresponds to the theoretical prediction for the validationof a uniform sampler, reported as 1.5-standard deviation over a numerical simulation with 1000 Haar-uniform unitaries. d)Simulated performance of the validation test for Boson Sampling experiments with n = 5 photons in 100 Haar-uniform 25-modeinterferometers, plotting the 1.5-standard deviation average success rate obtained. e) Minimum data set size Nmin to obtain> 95% success probability for Boson Sampling experiments and to obtain < 5% success probability for Uniformly-sampledexperiments, as a function of the number of photons n and of the number of modes m obtained through a numerical simulation.For each point, the simulation is averaged over 50 or 100 Haar-uniform unitaries.
theoretically proven to be high only for large enough n[8]. The results are shown in Fig. 2. For the experimentswith the 5-, 7-, and 9-mode chips, Caesar reaches a 95%average success rate with very modest set sizes of just∼ 100 events. This establishes experimentally the use-fulness of the Aaronson-Arkhipov test [8] for the analysisof small-scale experiments.
To show the test will also work in as-yet unperformed,larger-scale experiments, in Fig. 2d we find the test’ssuccess rate for simulated boson sampling experimentswith n = 5 and m = 20. Additionally, in Fig. 2e we nu-merically determine the minimum data set size Nmin forwhich the Aaronson-Arkhipov test discriminated bosonsampling data from the uniform distribution (and vicev-ersa) with a success rate > 95%. Not only is Nmin smallfor all experiments we simulated, it actually decreases as
we increase m. Despite working for all interferometerswe implemented experimentally, our numerical simula-tions revealed that the test fails for some interferometersif the ratio m/n is too low.
In the probed regime with n = 3 photons and inter-ferometers with up to m = 9 modes it is possible toperform a full validation of the boson sampling experi-ments by reconstructing all probabilities associated withno-collision events. This requires recording experimentaldata sets of a larger size; for the m = 7 chip, for ex-ample, we recorded ∼ 2100 events. The experimentallyreconstructed probabilities are then compared with thetheoretical prediction, obtained by applying the perma-nent formula [1]. For the chips with m = 5, 7, we fullyreconstructed the interferometer unitaries using single-photon and two-photon experiments [2, 27], while for the

4
0
0.01
0.02
0.03
0.04
0.05
0.06
0.07
0.08
Pout
P 3,indexp
P 3,indtheo
0
0.01
0.02
0.03
0.04
0.05
0.06
Pout
P 3,indexp
P 3,indtheo
0
0.05
0.1
0.15
Pout
P 3,indexp
P 3,indrec
0
0.05
0.1
0.15
0.2
Pout
P 3,indexp
P 3,indrec
0
0.05
0.1
0.15
0.2
0.25
Pout
P 3,indexp
P 3,indrec
7-mode interferometerb)
Input:
|0, 0, 0, 1, 1, 1, 0!Input:
5-mode interferometera)
9-mode interferometerc)
|0, 1, 1, 1, 0!Input:
Input: |0, 0, 0, 1, 1, 1, 0, 0, 0!
Input: |0, 0, 1, 1, 0, 0, 0, 1, 0!
|0, 0, 1, 1, 1, 0, 0!
500 1000 1500 2000 2500 Ncounts
!1000
!500
500
1000C
Boson Sampler
Uniform Sampler
500 1000 1500 2000 Ncounts
!1000
!500
500
1000C
Boson Sampler
Uniform Sampler
200 400 600 800Ncounts
!300
!200
!100
100
200
300C
Boson Sampler
Uniform Sampler
500 1000 1500 2000 Ncounts
!600
!400
!200
200
400
600C
Boson Sampler
Uniform Sampler
500 1000 1500 2000 Ncounts
!500
500
1000
C
Boson Sampler
Uniform Sampler
(123
)
(124
)
(125
)
(134
)
(135
)
(145
)
(234
)
(235
)
(245
)
(345
)
(123
)(1
24)
(467
)(5
67)
(123
)(1
24)
(467
)(5
67)
output modes output modes output modes
(123
)(1
24)
(689
)(7
89)
output modes
(123
)(1
24)
(689
)(7
89)
output modes
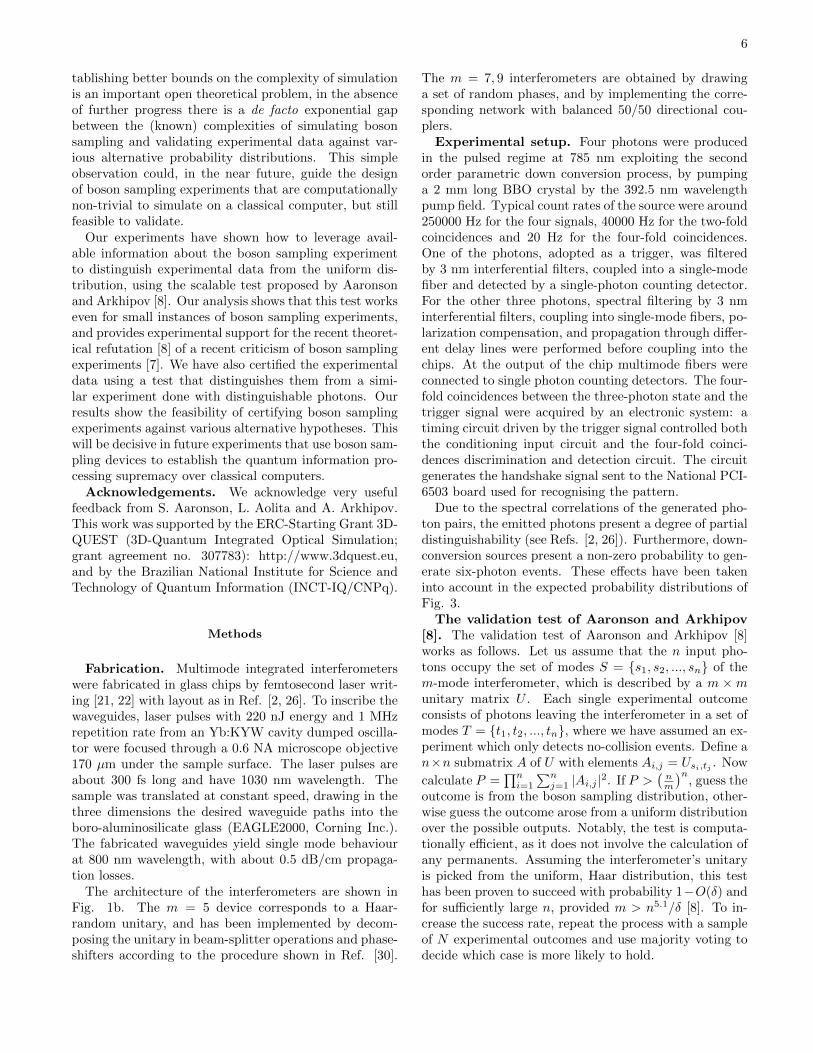
Fig. 3: Full validation of the Boson Sampling experiments. Here we compare the experimentally measured proba-bilities Pout of all no-collision outputs of our Boson Sampling experiments with the expected probabilities (yellow bars) fora) Haar-random 5-mode chip with input state |0, 1, 1, 1, 0〉; b) random 7-mode chip with input states |0, 0, 1, 1, 1, 0, 0〉 and|0, 0, 0, 1, 1, 1, 0〉; c) random 9-mode chip with input states |0, 0, 0, 1, 1, 1, 0, 0, 0〉 and |0, 0, 1, 1, 0, 0, 0, 1, 0〉. The expected prob-abilities take into account the partial photon distinguishability of the source and multiphoton events (see Methods and Ref.[2, 26]). Lighter regions of the blue bars correspond to the experimental error, which is due to the poissonian statistics of theevents. Lighter regions of the yellow bars correspond to the error in the reconstruction process, retrieved by a MonteCarlosimulation. Bottom figures of panels a) and b), right figures of panel c): application of the Aaronson-Arkhipov test to the fullset of experimental data. C is a counting variable that is increased by 1 for each event assigned to the Boson Sampler, anddecreased by 1 for each event assigned to the Uniform Sampler. When C > 0, the complete data set is assigned to the BosonSampler. Blue points: test applied on the experimental data by exploiting the ideal unitary Ut. Black points: test applied onthe experimental data by exploiting the reconstructed unitary Ur (for the m = 5, 7 chips only). Green points: test applied onsimulated data generated by the Uniform Sampler. For states |0, 1, 1, 1, 0〉 (m = 5) and |0, 0, 0, 1, 1, 1, 0〉 (m = 7) blue and blackpoints present a large overlap and superimpose in the figures.
m = 9 we compared the three-photon data with whatis expected from the ideal, theoretical unitary Ut. Theresults are shown in Fig. 3, and the good agreement
between the experiments and the predictions is quan-tified by the variation distance d = 1/2
∑k |pk − qk|,
which reaches values d(2,3,4)exp,r = 0.104 ± 0.022 (m = 5),

5
Nset
Psuccess
20 40 60 80 100 120 1400
0.2
0.4
0.6
0.8
1
500 1000 1500 2000Ncounts
!400
!200
0
200
D
Indistinguishable Boson Sampler
Distinguishable Boson Sampler
7-mode interferometer
|0, 0, 1, 1, 1, 0, 0! |0, 0, 0, 1, 1, 1, 0!
|0, 0, 0, 1, 1, 1, 0, 0, 0!
a)
Input: Input:
9-mode interferometer
Input:
b)
500 1000 1500 2000 Ncounts
!500
0
500
D
Indistinguishable Boson Sampler
Distinguishable Boson Sampler
500 1000 1500 2000 2500 Ncounts
!400
!200
0
200
400
D
Indistinguishable Boson Sampler
Distinguishable Boson Sampler
Indistinguishable Boson Sampler
Distinguishable Boson Sampler
Fig. 4: Discrimination between alternative distributions. a) Experimental results of the discrimination between bosonsampling distributions with distinguishable or indistinguishable photons for the 7-mode chip. The protocol is applied by usingthe probability distributions obtained from the reconstructed unitary Ur. Top figures: evaluation of the D parameter for twodifferent input states. Black data: indistinguishable photons. Red data: distinguishable photons. Bottom figure: successprobability Psuccess of the discrimination protocol as a function of the data set size Nset. Green circle points: input state|0, 0, 1, 1, 1, 0, 0〉. Blue circle points: input state |0, 1, 0, 1, 0, 1, 0〉. Cyan circle points: input state |0, 0, 0, 1, 1, 1, 0〉. Magenta circlepoints: input state |1, 1, 1, 0, 0, 0, 0〉. Square points: corresponding success probability of the protocol for the “false” positiveevents with distinguishable photons. Blue shaded region: numerical simulation of the success probability of discrimination testfor indistinguishable photons, taking into account the partial photon distinguishability of the adopted source (see Methods).The results are averaged over 1000 Haar-uniform unitaries, and are reported as 1.5-standard deviation. Blue dash-dottedline: average behaviour for perfectly indistinguishable photons. Red shaded region: numerical simulation for distinguishablephotons, reported as 1.5-standard deviation, where the partial photon distinguishability of the adopted source has been takeninto account in the indistinguishable photon distribution. Red dash-dotted line: average behaviour without taking into accountpartial photon-distinguishability. b) Experimental results of the discrimination between boson sampling distributions withdistinguishable or indistinguishable or photons for the 9-mode chip with input state |0, 0, 0, 1, 1, 1, 0, 0, 0〉. The protocol isapplied by using the probability distributions obtained from the ideal unitary Ut. Blue data: indistinguishable photons. Reddata: distinguishable photons.
d(3,4,5)exp,r = 0.168± 0.016 and d
(4,5,6)exp,r = 0.133± 0.017 (m =
7), d(4,5,6)exp,t = 0.113 ± 0.017 and d
(3,4,8)exp,t = 0.167 ± 0.020
(m = 9). Furthermore, we have applied the Aaronson-Arkhipov test [8] to the full data set (Fig. 3). We observethat this test can be applied successfully by using eitherthe reconstructed unitary Ur or the ideal unitary Ut.
In addition, simple tests can be used to validate bo-son sampling data against probability distributions whichare more similar to the experimental data than the uni-form distribution is. In the Methods section we describesuch a test, which is a standard likelihood ratio test [28]with added thresholds to better take into considerationexperimental imperfections. We have applied the testto discriminate boson sampling experiments performed
with either indistinguishable or distinguishable photonsin a 7-mode and a 9-mode interferometer (see Fig. 4).The regime of distinguishable photons has been obtainedexperimentally by introducing a relative temporal delaybetween the three photons larger than their coherencetime. Note that the test requires calculating the proba-bilities associated with each observed outcome, and henceit is not computationally efficient. A laptop can, how-ever, test a small sample of boson sampling data withup to about n = 25 photons in a day or so. No bosonsampling simulation algorithm has yet been developedthat is significantly faster than computing the full out-put probability distribution (which involves calculatingan exponential number of permanents) [29]. While es-
6
tablishing better bounds on the complexity of simulationis an important open theoretical problem, in the absenceof further progress there is a de facto exponential gapbetween the (known) complexities of simulating bosonsampling and validating experimental data against var-ious alternative probability distributions. This simpleobservation could, in the near future, guide the designof boson sampling experiments that are computationallynon-trivial to simulate on a classical computer, but stillfeasible to validate.
Our experiments have shown how to leverage avail-able information about the boson sampling experimentto distinguish experimental data from the uniform dis-tribution, using the scalable test proposed by Aaronsonand Arkhipov [8]. Our analysis shows that this test workseven for small instances of boson sampling experiments,and provides experimental support for the recent theoret-ical refutation [8] of a recent criticism of boson samplingexperiments [7]. We have also certified the experimentaldata using a test that distinguishes them from a simi-lar experiment done with distinguishable photons. Ourresults show the feasibility of certifying boson samplingexperiments against various alternative hypotheses. Thiswill be decisive in future experiments that use boson sam-pling devices to establish the quantum information pro-cessing supremacy over classical computers.
Acknowledgements. We acknowledge very usefulfeedback from S. Aaronson, L. Aolita and A. Arkhipov.This work was supported by the ERC-Starting Grant 3D-QUEST (3D-Quantum Integrated Optical Simulation;grant agreement no. 307783): http://www.3dquest.eu,and by the Brazilian National Institute for Science andTechnology of Quantum Information (INCT-IQ/CNPq).
Methods
Fabrication. Multimode integrated interferometerswere fabricated in glass chips by femtosecond laser writ-ing [21, 22] with layout as in Ref. [2, 26]. To inscribe thewaveguides, laser pulses with 220 nJ energy and 1 MHzrepetition rate from an Yb:KYW cavity dumped oscilla-tor were focused through a 0.6 NA microscope objective170 µm under the sample surface. The laser pulses areabout 300 fs long and have 1030 nm wavelength. Thesample was translated at constant speed, drawing in thethree dimensions the desired waveguide paths into theboro-aluminosilicate glass (EAGLE2000, Corning Inc.).The fabricated waveguides yield single mode behaviourat 800 nm wavelength, with about 0.5 dB/cm propaga-tion losses.
The architecture of the interferometers are shown inFig. 1b. The m = 5 device corresponds to a Haar-random unitary, and has been implemented by decom-posing the unitary in beam-splitter operations and phase-shifters according to the procedure shown in Ref. [30].
The m = 7, 9 interferometers are obtained by drawinga set of random phases, and by implementing the corre-sponding network with balanced 50/50 directional cou-plers.
Experimental setup. Four photons were producedin the pulsed regime at 785 nm exploiting the secondorder parametric down conversion process, by pumpinga 2 mm long BBO crystal by the 392.5 nm wavelengthpump field. Typical count rates of the source were around250000 Hz for the four signals, 40000 Hz for the two-foldcoincidences and 20 Hz for the four-fold coincidences.One of the photons, adopted as a trigger, was filteredby 3 nm interferential filters, coupled into a single-modefiber and detected by a single-photon counting detector.For the other three photons, spectral filtering by 3 nminterferential filters, coupling into single-mode fibers, po-larization compensation, and propagation through differ-ent delay lines were performed before coupling into thechips. At the output of the chip multimode fibers wereconnected to single photon counting detectors. The four-fold coincidences between the three-photon state and thetrigger signal were acquired by an electronic system: atiming circuit driven by the trigger signal controlled boththe conditioning input circuit and the four-fold coinci-dences discrimination and detection circuit. The circuitgenerates the handshake signal sent to the National PCI-6503 board used for recognising the pattern.
Due to the spectral correlations of the generated pho-ton pairs, the emitted photons present a degree of partialdistinguishability (see Refs. [2, 26]). Furthermore, down-conversion sources present a non-zero probability to gen-erate six-photon events. These effects have been takeninto account in the expected probability distributions ofFig. 3.
The validation test of Aaronson and Arkhipov[8]. The validation test of Aaronson and Arkhipov [8]works as follows. Let us assume that the n input pho-tons occupy the set of modes S = {s1, s2, ..., sn} of them-mode interferometer, which is described by a m ×munitary matrix U . Each single experimental outcomeconsists of photons leaving the interferometer in a set ofmodes T = {t1, t2, ..., tn}, where we have assumed an ex-periment which only detects no-collision events. Define an×n submatrix A of U with elements Ai,j = Usi,tj . Now
calculate P =∏n
i=1
∑nj=1 |Ai,j |2. If P >
(nm
)n, guess the
outcome is from the boson sampling distribution, other-wise guess the outcome arose from a uniform distributionover the possible outputs. Notably, the test is computa-tionally efficient, as it does not involve the calculation ofany permanents. Assuming the interferometer’s unitaryis picked from the uniform, Haar distribution, this testhas been proven to succeed with probability 1−O(δ) andfor sufficiently large n, provided m > n5.1/δ [8]. To in-crease the success rate, repeat the process with a sampleof N experimental outcomes and use majority voting todecide which case is more likely to hold.

7
Validating boson sampling data against distin-guishable photon distribution. Here we describe atest that can validate boson sampling data against thehypothesis that the photons are distinguishable. Thetest is an adapted version of the likelihood ratio test [28]which incorporates a discrimination threshold to com-pensate for experimental noise. Let pindi and qdisi bethe probabilities associated with indistinguishable anddistinguishable photons for the measured outcome, andlet D be the discrimination parameter, initialized to thevalue D = 0. For each experimental outcome, we cal-culate the ratio of the expected probabilities for indis-tinguishable and distinguishable photons. If the ratio isclose to one, up to to a threshold k1 < pindi /qdisi < 1/k1,the event is considered to be inconclusive and D is leftunchanged. These inconclusive events, however, are stillcounted as a resource and do contribute to the effectivenumber of events required to discriminate the two distri-butions. If 1/k1 ≤ pindi /qdisi < k2, the event is assignedto the Indistinguishable Boson Sampler by adding +1 toD. If the ratio between the two probabilities is high,pindi /qdisi ≥ k2, the event is assigned to the Indistinguish-able Boson Sampler by adding +2 to D, thus reflectingthe higher level of confidence in this case. Conversely, if1/k2 < pindi /qdisi ≤ k1 and pindi /qdisi ≤ 1/k2 the event isassigned to the Distinguishable Boson Sampler by adding−1 and −2 to D respectively. Finally, after N experimen-tal outcomes, if D > 0 the whole data set is assigned tothe Indistinguishable Boson Sampler, and conversely ifD < 0. In our analysis we set k1 = 0.9 and k2 = 1.5.
∗ Electronic address: [email protected]† Electronic address: [email protected]‡ Electronic address: [email protected]
[1] Aaronson, S. & Arkhipov, A. The computation com-plexity of linear optics. In Proceedings of the 43rd an-nual ACM symposium on Theory of computing, San Jose,2011 (ACM press, New York, 2011), 333–342 (2011).
[2] Crespi, A. et al. Experimental boson sampling in arbi-trary integrated photonic circuits. Nature Photonics 7,545 (2013).
[3] Tillmann, M. et al. Experimental boson sampling. NaturePhotonics 7, 540 (2013).
[4] Broome, M. A. et al. Photonic boson sampling in a tun-able circuit. Science 339, 794–798 (2013).
[5] Spring, J. B. et al. Boson sampling on a photonic chip.Science 339, 798–801 (2013).
[6] Barz, S., Fitzsimons, J. F., Kashefi, E. E. & Walther,P. Experimental verification of quantum computation.Nature Physics 9, 727–731 (2013).
[7] Gogolin, C., Kliesch, M., Aolita, L. & Eisert, J.Boson-sampling in the light of sample complexity.ArXiv:1306.3995 (2013).
[8] Aaronson, S. & Arkhipov, A. Bosonsampling is far from
uniform. ArXiv:1309.7460 (2013).[9] Shor, P. W. Polynomial-time algorithms for prime factor-
ization and discrete logarithms on a quantum computer.SIAM J. Comput. 26, 1484–1509 (1997).
[10] Ladd, T. D. et al. Quantum computers. Nature 464,45–53 (2010).
[11] Barreiro, J. T. et al. An open-system quantum simulatorwith trapped ions. Nature 470, 486–491 (2011).
[12] Islam, R. et al. Emergence and frustration of magnetismwith variable-range interactions in a quantum simulator.Science 340, 583–587 (2013).
[13] Preskill, J. Quantum computing and the entanglementfrontier. arXiv preprint arXiv:1203.5813 (2012).
[14] Rohde, P. P. & Ralph, T. C. Error tolerance of theboson-sampling model for linear optics quantum comput-ing. Phys. Rev. A 85, 022332 (2012).
[15] Leverrier, A. & Garcia-Patron, R. Does boson samplingneed fault-tolerance? ArXiv:1309.4687 (2013).
[16] Motes, K. R., Dowling, J. P. & Rohde, P. P. Spon-taneous parametric down-conversion photon sources arescalable in the asymptotic limit for boson-sampling.ArXiv:1307.8238 (2013).
[17] Rohde, P. P., Moten, K. R. & Dowling, J. P. Samplinggeneralized cat states with linear optics is probably hard.ArXiv:1310.0297 (2013).
[18] Shen, C., Zhang, Z. & Duan, L.-M. Scalable im-plementation of boson sampling with trapped ions.ArXiv:1310.4860 (2013).
[19] Politi, A., Cryan, M. J., Rarity, J. G., Yu, S. & O’Brien,J. L. Silica-on-silicon waveguide quantum circuits. Sci-ence 320, 646–649 (2008).
[20] Davis, K. M., Miura, K., Sugimoto, N. & Hirao, K. Writ-ing waveguides in glass with a femtosecond laser. Opt.Lett. 21, 1729–1731 (1996).
[21] Osellame, R. et al. Femtosecond writing of active opticalwaveguides with astigmatically shaped beams. Journal ofthe Optical Society of America B 20, 1559–1567 (2003).
[22] Gattass, R. & Mazur, E. Femtosecond laser microma-chining in transparent materials. Nature Photonics 2,219–225 (2008).
[23] Sansoni, L. et al. Two-particle bosonic-fermionic quan-tum walk via integrated photonics. Phys. Rev. Lett. 108,010502 (2012).
[24] Crespi, A. et al. Anderson localization of entangled pho-tons in an integrated quantum walk. Nat. Photon. 7,322–328 (2013).
[25] Spagnolo, N. et al. Three-photon bosonic coalescence inan integrated tritter. Nat. Commun. 4, 1606 (2013).
[26] Spagnolo, N. et al. General rules for bosonic bunching inmultimode interferometers. Phys. Rev. Lett. 111, 130503(2013).
[27] Laing, A. & O’Brien, J. L. Super-stable tomographyof any linear optical device. Preprint arXiv:1208.2868v1[quant-ph] (2012).
[28] Cover, T. M. & Thomas, J. A. Elements of InformationTheory (Wiley-Interscience, 2006), 2nd edn.
[29] Arkhipov, A. & Aaronson, S. Private communication(2013).
[30] Reck, M., Zeilinger, A., Bernstein, H. J. & P., B. Ex-perimental realization of any discrete unitary operator.Phys. Rev. Lett. 73, 58–61 (1994).