Embed Size (px)
Citation preview

AMERICAN JOURNAL OF PHYSICAL ANTHROPOLOGY 101:307-323 (1996)
Distribution of Four Founding mtDNA Haplogroups Among Native North Americans
JOSEPH G. LORENZ AND DAVID GLENN SMITH Department of Anthropology, University of California, Davis, California 95616
KEY WORDS PCR, Migration, Language group
ABSTRACT The mtDNA of most Native Americans has been shown to cluster into four lineages, or haplogroups. This study provides data on the haplogroup affiliation of nearly 500 Native North Americans including mem- bers of many tribal groups not previously studied. Phenetic cluster analysis shows a fundamental difference among 1) Eskimos and northern Na-Dene groups, which are almost exclusively mtDNA haplogroup A, 2) tribes of the Southwest and adjacent regions, predominantly Hokan and Uto-Aztecan speakers, which lack haplogroup A but exhibit high frequencies of haplogroup B, 3) tribes of the Southwest and Mexico lacking only haplogroup D, and 4) a geographically heterogeneous group of tribes which exhibit varying frequen- cies of all four haplogroups. There is some correspondence between language group affiliations and the frequencies of the mtDNA haplogroups in certain tribes, while geographic proximity appears responsible for the genetic similar- ity among other tribes. Other instances of similarity among tribes suggest hypotheses for testing with more detailed studies. This study also provides a context for understanding the relationships between ancient and modern populations of Native Americans. o 1996 Wiley-Liss, Inc.
The mtDNA of most Native Americans has been shown to cluster into four haplogroups, designated A, B, C, and D, that define four separate mtDNA lineages (Schurr et al., 1990; Torroni et al., 1992). Other haplo- groups have been identified that might have contributed to the founding population of Native Americans (e.g., haplogroup E [Bail- liet et al., 1994]), but there is evidence that a t least some of these are due to recent muta- tions or are of non-Native American origin (Torroni and Wallace, 1995) and in any case represent a minority of Native Americans (i.e., 4.1% [Bailliet et al., 19941). The haplo- groups that define these lineages are identi- fied by the presence or absence of character- istic restriction enzyme cleavage sites (i.e., the presence of a Hue I11 site a t nucleotide pair [np] 663 defines haplogroup A, the ab- sence of a H i m I1 site at np 13,259 and the presence of anAlu I site at np 13,262 defines
haplogroup C, and the absence of an Alu I site at np 5,176 defines haplogroup D) or, in the case of haplogroup B, the presence of a 9 bp deletion in the intergenic region be- tween the cytochrome oxidase I1 and lysine tRNA genes (Schurr et al., 1990; Torroni et al., 1992, 1993a).
Haplogroups A, B, C, and D are also pres- ent in east Asia, where they have been iden- tified among Koreans, Malaysian Chinese, Taiwanese Han (Ballinger et al., 1992) and Tibetans (Torroni et al., 1994a), although at much lower frequencies than in New World
~
Received March 1, 1995; accepted June 3, 1996. Address reprint requests to David Glenn Smith, Department of
Anthropology, University of California, Davis, California 95616. Joseph G. Lorenz’s current address is Analytical Genetic Test-
ing Center, Suite 201, 7808 Cherry Creek s. Dr., Denver, CO 80231.
0 1996 WILEY-LISS. INC.

308 J.G. LORENZ AND D.G. SMITH
populations, leading to speculation of a founder effect on the New World gene pool (Wallace et al., 1985). Haplogroups A, C, and D are absent among non-Chinese southeast Asians. In Siberia haplogroup B is absent, but the frequencies of haplogroups A and especially C and D are higher than in east Asia (Torroni et al., 1993b). Torroni et al. (1992, 1993a) have shown that in North America the distribution of the haplogroups in northern Na-Dene tribal groups differs from that in Amerinds and southern Na- Dene tribal groups (the terms Nu-Dene and Amerind refer to two of the three major lin- guistic “families” from Greenberg’s [ 19871 taxonomy of Native American languages). Virtually all members of northern Na-Dene tribes belong to haplogroup A, while all four haplogroups have been reported to be pres- ent in the Amerinds and southern Na-Dene. However, the frequency of the four haplo- groups varies greatly among Amerind ethnic groups, with some haplogroups being absent in some populations (Torroni et al., 1993a). In support of Greenberg (19871, it has been proposed that a t least some haplogroups rep- resent separate founding populations and that tribalization resulted from the subse- quent isolation among incipient ethnic groups (Wallace et al., 1985; Torroni e t al., 1993a). Hence, groups that speak similar languages should also exhibit genetic sirni- larities (Torroni et al., 199413; Torroni and Wallace, 1994). The conclusion of Chakra- borty and Weiss (1991) that mtDNA of the New World is in mutation-drift equilibrium due to migration of lineages across popula- tion boundaries, while based on a very lim- ited sample, is not consistent with the hy- pothesis of founder effects from multiple migrations. However, because studies of mtDNA variation in North America have fo- cused mainly on Native American groups from the Northwest Coast and the American Southwest, mtDNA variation in tribes from a sufficient geographic range in North America to evaluate the fit of language and genetic similarities has not been charac- terized.
In an earlier study (Lorenz and Smith, 1994) we showed that the 9 bp deletion, a marker for haplogroup B, is present among all Amerind groups but that its frequency
varies considerably among these groups. Moreover, we found that geographic proxim- ity influences the frequency of this haplo- group more strongly than does linguistic af- filiation, probably due both to substantial female migration among adjacent but lin- guistically unrelated (or only remotely re- lated) tribes and to language spreads across regions containing genetically unrelated (or only remotely related) tribes (Nichols, 1992). The purpose of the present study is not to address the issue of how the New World was settled but rather to extend our knowledge of the distribution of mtDNA variation among Native North Americans by determining whether or not the distribution of haplo- groups A, C, and D, like that of haplogroup B, are also structured linguistically or geo- graphically. This knowledge will be useful for reconstructing mtDNA relationships among living Native North Americans and provide a context within which to interpret the distribution of mtDNA haplogroups from archaeological populations (e.g., see Stone and Stoneking, 1993; Parr et al., 1995; Kaes- tle, 1995).
MATERIAL AND METHODS Haplogroup determination
The haplogroup affiliation of 497 individu- als from more than 40 ethnic groups across North America was determined. The source and description of these samples have been presented elsewhere (Lorenz and Smith, 1994). Most of the samples had previously been typed for the presence of the 9 bp dele- tion that defines haplogroup B (Lorenz and Smith, 1994), but an additional 101 samples were subsequently typed for the 9 bp dele- tion in order to increase the sample size of underrepresented tribal groups. All samples which were determined not to be haplogroup B (i.e., those that were determined to lack the 9 bp deletion) were amplified and tested for membership in haplogroup A. Those sam- ples identified as belonging to haplogroup A (but not haplogroup B) were not amplified and tested for the polymorphic markers characterizing haplogroups C and D. Simi- larly, samples not assigned to haplogroup A that possessed the restriction site character- izing haplogroup C were not scored for haplo-

MTDNA VARIATION AMONG NATIVE NORTH AMERICANS 309
group D. Samples that did not exhibit any of the polymorphic markers characteristic of one of the four Native North American haplogroups were scored as other.
Because all 497 individuals were not typed for all four haplogroup markers, individuals with markers that are characteristic of two (or more) haplogroups would have been over- looked. Since the haplogroup affiliation of such “compound haplotypes” is ambiguous without more detailed analysis, they should be eliminated from comparisons of the distri- butions of haplogroups. However, compound haplotypes are relatively rare. Of the 1,102 individuals typed in Siberia and the New World in previous studies, only 11 had com- pound haplotypes 6e. , less than 1% LSchurr et al., 1990; Torroni et al., 1993a,b, 1994b; Bailliet et al., 19941). It is unlikely that our failure to identify and eliminate the fewer than a half dozen compound haplotypes we would have expected to identify could distort the overall picture this study is meant to provide of the distribution of the four haplo- groups in North America. Nevertheless, to ensure that compound haplotypes were not unexpectedly common in our own sample, 52 individuals included in the present study were typed for all four haplogroups.
The primers used to amplify regions of the mtDNA which contain the diagnostic restric- tion enzyme digestion sites for haplogroups A, B, C, and D are listed in Table 1. Amplifi- cation reactions were carried out in a total volume of 25 p.1 and contained 0.5 p.1 of each primer (1.0 pM final concentration), 0.65 p1 of 20 mg/ml bovine serum albumin (Boeh- ringer-Mannheim, Indianapolis, IN), and 12.5 p1 of PCR Master (Boehringer-Mann- heim; 2.5 U Taq DNA polymerase in Brij 35, 0.005% [v/vl, dATP, dCTP, dGTP, dTTP each at 0.2 mM, 10 mM Tris-HC1,50 mM KCL, 1.5 mM MgC1, final concentration). The thermal cycling profile consisted of an initial dena- turing for 3 rnin at 94°C followed by 35 cycles of 1 min at 94”C, 1 min at 45”C, and 1 min at 72°C. A 5 min 72°C extension step followed the last cycle. A 5 pl portion of the amplifica- tion product was electrophoresed on a 6% polyacrylamide gel and stained with ethid- ium bromide to confirm the presence of PCR product. In cases where no visible product was detected, an internal amplification was
performed using 1 p1 of the previously ampli- fied product in a reaction mixture identical t o that described above except for the use of internal primers (see Table 1). The thermal cycling profile for the internal amplifications was as described above except that the primer annealing temperature was lowered to 37°C. In cases of successful amplification the remainder of the amplification reactions was digested for 1-3 h with 5-10 units of the appropriate restriction enzyme. A 5-10 ~1 portion of the digest was then electropho- resed on a 6% polyacrylamide gel, stained with ethidium bromide, and photographed over a W transilluminator to determine whether or not the amplified fragment had been cut by the restriction enzyme.
Individuals assigned a haplogroup affilia- tion based on the presence or absence of a restriction site in one of the amplified seg- ments were grouped by tribe as illustrated in Table 2. All analyses described below were based on the data obtained from this study, our earlier study (Lorenz and Smith, 1994), and 332 individuals whose haplogroups were reported in other studies cited in Table 2.
Statistical analyses
Between-group heterogeneity. Each hap- logroup was regarded as one of four alleles at a single, haploid locus. Individuals be- longing to other haplogroups were removed from their respective tribes, and the frequen- cies of the four haplogroups in those tribes were rescaled to unity. Values of 6, which is equivalent to Wright’s FST statistic adjusted for sampling bias (Weir, 1990), were then calculated to assess among-cluster variation in the frequencies of the four haplogroups after grouping the tribes in various configu- rations. 6 values for different configurations of clusters were calculated only to indicate whether clustering tribes in a given configu- ration increased or decreased, relative to a standard value, the heterogeneity among the clusters. Higher values of 6 indicate greater intragroup homogeneity and greater intergroup heterogeneity which is expected when the clustering of samples into groups is based on valid assumptions. Lower values of 6, on the other hand, indicate less intra- group homogeneity coupled with less in- tergroup heterogeneity, suggesting that the

3 10 J.G. LORENZ AND D.G. SMITH
TABLE 1. PCR primers used to amplify the four mtDNA haplogroup markers
Polymorphic Primer Haplogroup site coordinates' Primer sequence (5'+3')
A Hae 111-663 535-553 CCCATACCCCGAACCAACC 725-707 GGTGAACTCACTGGAACGG 568-577 CCCCCCACAG 701492 CTTGCATGTG
B 9 bp deletion 8,150-8,166 CCGGGGGTATACTACGG 8,366-8,345 TTTC ACTGTAAAGAGGTGTTGG 8,316-8297 ATGCTAAGTTAGCTTTACAG 8,19643,215 ACAGTTTCATGCCCATCGTC
C Hind 11-13259 13,197-13,213 GCAGCAGTCTGCGCCC A h 1-13262 13,403-13,384 ATATCTTGTTCATTGT'IAA
13,23&13,245 AATCGTAGCC 13,37613,366 GATGGACCC
D Alu 1-5176 5,151-5,170 CTACTACTATCTCGCACCTG 5,481-5,464 GTAGGAGTAGC GTGGTAA 5,161-5,170 CTCGCACC 5,272-5,263 TCGATAATGG
'Numbered according to the Andersan et a1 (1981) reference sequence
assumptions underlying that grouping lack validity. If configurations of clusters that conform to language taxonomy but crosscut many geographic regions are found to have high 6 values, a high degree of overlap be- tween genetics and culture is indicated. This outcome is consistent with a pattern of early biologic differentiation which was paralleled by linguistic differentiation and then fol- lowed by isolation with only very recent, if any, admixture. High 6 values for geographic configurations that crosscut language affili- ations, on the other hand, provide evidence for gene flow (and/or recent genetic differen- tiation) within a region. Low values of 6 for configurations of clusters conforming to both language taxonomy and geographical prox- imity are consistent with language spreads not associated with admixture. High values of 6 for configurations of clusters conforming to both language taxonomy and geographical proximity are consistent with early tribali- zation followed by recent admixture.
As a standard for comparing values of 6 associated with alternative configurations of clustering, a baseline 6 value was calculated for 30 tribes. Some of these 30 unclustered tribes actually comprise pools of tribes in- cluded in Table 2 that are both geographi- cally and linguistically proximate but for which few samples were available. For ex- ample, Chippewa and Kickapoo were pooled together since they both speak Algonquian languages and they are approximately geo- graphically contiguous (Chippewa individu-
als were sampled from South Dakota, Minnesota, and Wisconsin; the Kickapoo homeland is in Wisconsin). Figure 1 indi- cates the geographic location of the 30 tribes. Tribes represented by fewer than 10 individ- uals and which could not be pooled using the criteria described above were not included in this baseline analysis (e.g., the Micmac individuals, although representing a tribe that speaks an Algonquian language, were not pooled with the ChippewalKickapoo be- cause they live in Newfoundland).
For geographic analysis all the tribes were divided into one of the following areas as defined in our previous study (Lorenz and Smith, 1994): Arctic/Subarctic, Northwest Coast, East, MidwesUGreat Plains, South- west, CalifornidGreat Basin, and Mexico. Four identical analyses were conducted on hierarchically arranged clusters of tribes that were variously grouped (i.e., 3, 9, 20, and 24 language groups) according to lan- guage affiliation (Campbell and Mithun, 1979; Greenberg, 1987). The statistical sig- nificance of differences in the frequency dis- tributions of haplogroups among clusters of tribes based on geographic or language crite- ria was confirmed using the chi-square test for homogeneity (Siegel, 1956).
Genetic distance. The method of Cavalli- Sforza and Edwards (1967) was used to cal- culate genetic distances between pairs of the 30 modern tribes or tribes that had been pooled as described above and in addition

TAB
LE 2.
Freq
uenc
y of
mtD
NA
hap
logr
oups
in
mod
ern
Nat
ive
Nor
th A
mer
ican
s
Lin
guis
tic a
ffili
atio
n Fr
eque
ncy
of h
aplo
grou
ps (
%)
Gre
enbe
rrr (
1987
) Fa
mily
Su
blev
el 1
Esk
imo-
Ale
ut
Inui
t N
a-D
ene
Hai
da
Tlin
git
Ath
abas
kan-
Eya
k A
thab
aska
n-E
yak
Ath
abas
kan-
E ya
k A
thab
aska
n-E
yak
Am
erin
d A
lmos
an-K
eres
ioua
n A
lmos
an-K
eres
ioua
n A
lmos
an-K
eres
ioua
n A
lmos
an-K
eres
ioua
n A
lmos
an-K
eres
ioua
n A
lmos
an-K
eres
ioua
n A
lmos
an-K
eres
ioua
n A
lmos
an-K
eres
ioua
n A
lmos
an-K
eres
ioua
n A
lmos
an-K
eres
ioua
n Pe
nuti
an
Penu
tian
Pe
nuti
an
Penu
tian
Pe
nuti
an
Penu
tian
Pe
nuti
an
Hok
an
Hok
an
Hok
an
Hok
an
Hok
an
Hok
an
Hok
an
Hok
an
Kio
wa-
Tan
oan
Kio
wa-
Tan
oan
Oto
-Man
gue
Oto
-Man
gue
Uto
-Azt
ecan
U
to-A
ztec
an
Uto
-Azt
ecan
U
to-A
ztec
an
Uto
-Azt
ecan
U
to-A
ztec
an
Cam
pbel
l and
M
ithun
(197
9)
Tri
be
Sam
ple
size
A
B
C
D
Oth
er
Ref
eren
ce'
Inui
t H
aida
T
lingi
t A
thab
aska
n A
thab
aska
n A
thab
aska
n A
thab
aska
n A
lgon
quia
n A
lgon
quia
n A
lgon
quia
n Y
urok
Sa
lisha
n W
akas
han
Cad
doan
Ir
oquo
is
Ker
es
Siou
an
Penu
tian
M
aya
Mix
e-Z
oque
an
coos
M
usko
gean
M
usko
gean
Z
uni
Hok
an
Was
ho
Yum
an
Yum
an
Yum
an
Yum
an
Yum
an
Sal
inad
Chu
mas
h K
iow
a-T
anoa
n K
iow
a-T
anoa
n M
ixte
c Z
apot
ec
Uto
-Azt
ecan
U
to-A
ztec
an
Uto
-Azt
ecan
U
to-A
ztec
an
Uto
-Azt
ecan
U
to-A
ztec
an
Inui
t H
aida
T
lingi
t D
ogri
b H
upa
Nav
ajo
Apa
che
Chi
ppew
fick
apoo
C
heye
nne/
Ara
paho
e M
icm
acrn
arra
gans
ett
Yur
ok
Bel
la C
olla
N
uu-C
hah-
Nul
th
Paw
nee
Che
roke
e A
com
a Si
ouan
C
alif
orni
a Pe
nuti
an
May
a M
ixe
coos
C
hick
asaw
Kho
ctaw
C
ree W
Sem
inol
e Z
uni
Nor
ther
n C
alif
orni
a H
okan
W
asho
Q
uech
adC
ocop
a H
avas
upai
/Hua
lapa
iapa
i/M
ojav
e K
umia
i K
iliw
flai
pai
Coc
him
i S
alin
adC
hum
ash
Kio
wa
Jem
ez/T
aos/
San
Idel
fons
o M
ixte
c Z
apot
ec
Nah
ua/C
ora
Pim
a Pa
iute
/Sho
shon
e H
opi
Com
anch
e C
alif
orni
a U
to-A
ztec
an
30
29 2 42 2 58
29
62
26 7 1
36
15 3 16 1
34
17
27
16 1
27
18
22 5 28
23
18
16
11
13
11 5 36
29
15
32
37 9 4 2 14
829
0.96
7 0
0.96
6 0
1
0 1
0 0
1
0.51
7 0.
414
0.62
1 0.
172
0.48
4 0.
113
0.30
8 0.
115
0.28
6 0
0 1
0.5
0.05
6 0.
4 0.
067
0.33
3 0.
667
0 0.
313
1
0 0.
529
0.17
6 0.
118
0.41
2 0.
519
0.22
2 0.
625
0.31
3 0
0 0.
667
0.22
2 0.
389
0.11
1 0.
182
0.63
6 0
0.4
0 0.
536
0 0.
652
0.11
1 0.
50
0 0.
625
0 0.
909
0.07
7 0.
462
0.45
5 0.
182
0.4
0 0
0.86
1 0.
828
0.10
3 0.
333
0.33
3 0.
531
0.34
4 0.
054
0.56
8 0
0.22
2 0
1
0 1
0 0.
286
0.41
7 0.
302
0.44
4 0.
321
0 0 0 0 0 0.03
4 0.
138
0.19
4 0.
346
0.14
3 0 0.
139
0.13
3 0 0.
313
0 0.14
7 0.
059
0.14
8 0.
063
1 0.07
4 0.
167
0.09
1 0.
2 0.
357
0.30
4 0.
389
0.37
5 0.
091
0.46
2 0.
091
0.2
0.02
8 0.
069
0.33
3 0.
063
0.37
8 0.
222
0 0 0.42
9 0.
158
0.16
8
0.03
3 0
0.03
4 0
0 0
0 0
0 0
0 0.
034
0.06
9 0
0 0.
21
0.15
4 0.
077
0 0.
571
0 0
0.25
0.
056
0.26
7 0.
133
0 0
0 0.
375
0 0
0.05
9 0.
088
0.41
2 0
0.07
4 0.
037
0 0
0 0
0 0.
037
0.16
7 0.
167
0 0.
091
0.4
0 0.
107
0 0
0.04
3 0
0 0
0 0
0 0
0 0.
273
0 0
0.4
0.02
8 0.
083
0 0
0 0
0 0.
063
0 0
0.44
4 0.
111
0 0
0 0
0.28
6 0
0.06
3 0.
06
0.06
7
a a,
c (2
5)
b a,
b (3
0)
a a,
b (4
8)
a,c
(25)
a,
c (4
3)
a a a a,
c (2
5)
a a a a a b d a a a a a,
b (1
) a a a a a a a a a d d a
a,b
(30)
a
a,b
(1)
a a C
With
out
othe
r 17
9
'Ref
eren
ces
are
as fo
llow
s: a
, pre
sent
stu
dy; b
, Tor
roni
et
al.,
1992
: c, T
orro
ni e
t al
., 19
93a;
d,T
orro
ni e
t al
.. 19
94b.
In c
ases
whe
re t
he s
ampl
e fo
r an
eth
nic
grou
p is
der
ived
from
mor
e th
an o
ne s
tudy
, the
nu
mbe
r in
par
enth
eses
den
otes
the
sam
ple
size
rep
orte
d in
the
earl
ier
stud
y.

312 J.G. LORENZ AND D.G. SMITH
Fig. 1. Geographic location of the 30 modern Native American populations and one pre-Columbian population (Norris Farms [Stone and Stoneking, 19931) used in the phenetic cluster analysis. Populations in phenetic cluster I are denoted by triangles, phenetic cluster I1 by squares, phenetic cluster I11 by filled circles, and phenetic cluster IV by open circles.
the archaeological population from Norris Farms in central Illinois which dates from AD 1300 (Stone and Stoneking, 1993). These distances were calculated from the frequen- cies of the four mtDNA haplogroups in each tribe after removing individuals belonging
to other haplogroups and rescaling the fre- quencies in those tribes t o unity. To deter- mine patterns of similarity among North American groups in the relative frequencies of the four haplogroups independent of lan- guage and geography, UPGMA and maxi-

MTDNA VARIATION AMONG NATIVE NORTH AMERICANS 313
mum likelihood trees were constructed using the CONTCHAR and DISTANCE programs of PHYLIP (Felsenstein, 1993).
RESULTS mtDNA haplogroup distribution
The total number of Native North Ameri- cans typed for one of the four haplogroups or other is 497 (Lorenz and Smith, 1994; present study). None of the 52 samples that were typed for all four haplogroups exhibited a compound haplotype (i.e,, belonged t o more than a single haplogroup or other). The dis- tribution of the frequencies of the four haplo- groups and others identified in this study in addition t o data on 332 Native American individuals from earlier studies is shown in Table 2. Haplogroup A was the most common (over 40%), and haplogroup D was the least common (less than 7%) of the four haplo- groups. Fifty individuals, fewer than for any haplogroup, were classified as other, some of which probably result from admixture with other, presumably European, populations. That more than two-thirds of the others were from Eastern and Midwestern tribes, with whom earlier and more intense contact with nonnative, especially European, peoples oc- curred suggests that many of these others represent nonnative matrilines (i.e., admix- ture with nonnatives). However, Stone and Stoneking (1993) and Parr et al. (1996) clas- sified at least one individual as other (re- ferred to as haplogroup N) in the studies of pre-Columbian populations in Illinois and Utah, respectively. Thus, assuming a recent mutation is not responsible, native haplo- groups other than A, B, C, and D, while rare, apparently existed. A higher resolution screening of these other haplogroups might indeed show some to be Native American in origin, probably resulting from recent muta- tion at the diagnostic haplogroup restriction sites. However, haplotypes identified by high resolution analysis (e.g., see Torroni et al., 1993a) tend to be autapomorphies and hence of no use in determining relatedness among groups, and they were excluded from the analysis whose results follow.
Statistical analyses
Between-group heterogeneity. The over- all 6 value, indicating the relative levels of
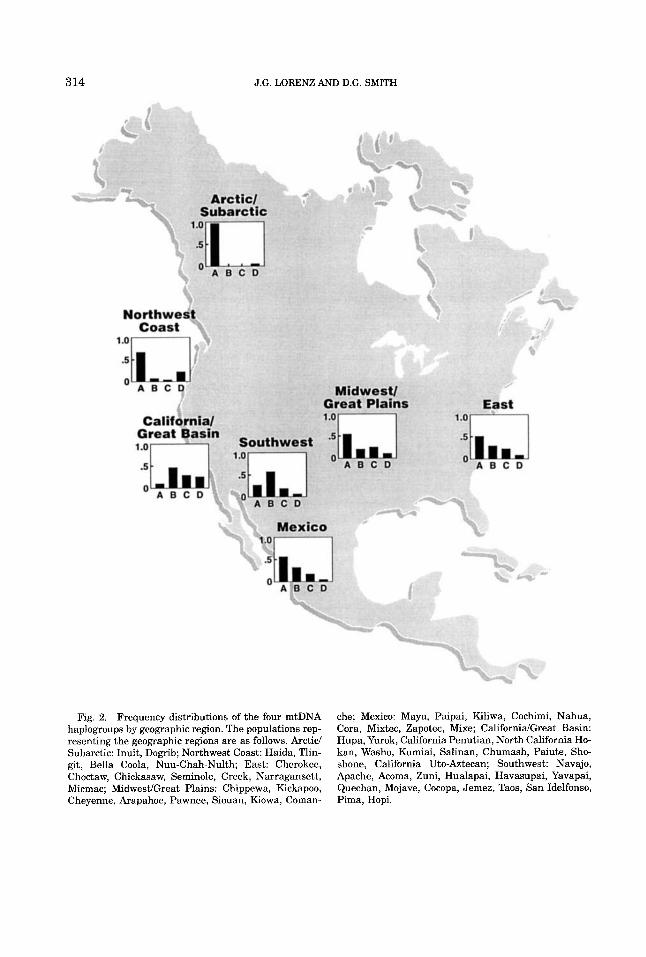
intergroup heterogeneity for the 30 unclus- tered tribes, is 0.291. As illustrated in Table 3, the relative intergroup heterogeneity var- ies greatly depending on how the tribes are clustered for estimating 6. When the tribes are partitioned into the seven geographic re- gions illustrated in Figure 2, 6 decreases from 0.291 to 0.193, indicating that the in- traregion genetic homogeneity is substan- tially less than the intratribe genetic homo- geneity, but the distribution of the four haplogroups is still heterogeneous among the seven geographic regions (x2 = 301.7,18 d.f., P << 0.001). However, when the entire ArcticISubarctic region, in which haplogroup A is virtually fixed, is compared to a single cluster containing the other six geographic regions, 6 is 0.290, indicating that the Arctic/ Subarctic and the rest of North America con- stitute regions that are almost as genetically distinct as individual tribal groups. (This value of 6 was higher than that for three geographic regions: The SouthwestJCalifor- nidGreat Basin, Arctic/Subartic/Northwest Coast, and elsewhere.) This, of course, is pri- marily due to the virtual absence of haplo- groups B, C, and D in the Arctic/Subarctic region, and the differences are even more pronounced when southern Athabaskans (Navaho and Apache) are eliminated from the estimate. Haplogroup A is the most com- mon haplogroup in all of the geographic ar- eas except the Southwest and California/ Great Basin, where the frequencies of haplo- group A, 26% and 7%, respectively, are lower than in any other geographic area. When these three geographic groups, whose haplo- group distributions are most distinctive, are eliminated, the distributions of haplogroups A, B, and C + D among the remaining four geographic regions are much more similar but still statistically significantly heteroge- neous (x2 = 29.7, 6 d.f., P < 0.001).
The frequency of haplogroup B is highest in the Southwest region and declines, in- creasingly sharply, to the west, south, east, and, finally, to the north, where it is almost completely absent. The overall frequency of haplogroup B in North America reported in this study (32%) is greater than that re- ported in our earlier study (20% [Lorenz and Smith, 19941). The exclusion of individuals who could not be assigned to one of the four
3 14 J.G. LORENZ AND D.G. SMITH
Fig. 2. Frequency distributions of the four mtDNA haplogroups by geographic region. The populations rep- resenting the geographic regions are as follows. Arctic/ Subarctic: Inuit, Dogrib; Northwest Coast: Haida, Tlin- git, Bella Coola, Nuu-Chah-Nulth; East: Cherokee, Choctaw, Chickasaw, Seminole, Creek, Narragansett, Micmac; MidwestiGreat Plains: Chippewa, Kickapoo, Cheyenne, Arapahoe, Pawnee, Siouan, Kiowa, Coman-
che; Mexico: Maya, Paipai, Kiliwa, Cochimi, Nahua, Cora, Mixtec, Zapotec, Mixe; CalifornidGreat Basin: Hupa, Yurok, California Penutian, North California Ho- kan, Washo, Kumiai, Salinan, Chumash, Paiute, Sho- shone, California Uto-Aztecan; Southwest: Navajo, Apache, Acoma, Zuni, Hualapai, Havasupai, Yavapai, Quechan, Mojave, Cocopa, Jemez, Taos, San Idelfonso, Pima, Hopi.

MTDNA VARIATION AMONG NATIVE NORTH AMERICANS 3 15
TABLE 3. Contribution ofgeography and langugage to clustering of haplogroup frequencies in North America
6 value'
Geography 30 tribes
7 culture areas 3 geographic groups 2 geographic groups
Language 24 languages 20 languages
9 language groups 3 language families
UPGMA clades
0.291 0.193 (0.256)' 0.199 (0.275)' 0.290 (0.430)'
0.284 0.242 0.205 (0.246)' 0.184 (0.322)' 0.293 (0.32213
Source of homoeeneitv of UPGMA clades Clade Geography Language
I1 Medium Low 111 Low Medium Iv High High
'Value ofchi-square for homogeneity statistically sigmficant a t a t least the 0.05 level of probability. ZValue of 6 after eliminating Apache and Navaho from sample. SThe five tribes identified by a n asterisk in Figure 3 were excluded from this estimate.
I High Low
haplogroups might have inflated the fre- quency of haplogroup B in this study. How- ever, it is more likely that the difference is due to the fact that a larger number of indi- viduals that were typed only for the presence or absence of the 9 bp deletion but not the other haplogroup markers in other studies (Shields et al., 1992,1993; Ward et al., 1991, 1993) were necessarily excluded from the present but not from our earlier analysis. These individuals came from areas generally low in the frequency of haplogroup B.
Haplogroup C occurs a t a frequency of 17% in North America and, while more homoge- neously distributed than other haplogroups, is absent or nearly absent in the northwest- ern part of North America. Haplogroup D, the rarest of the four haplogroups in North America at 7%, is most prevalent in the northern Paiute/Shoshone, in which its fre- quency exceeds 40%. It is present at very low frequencies (<6.0%) everywhere except in the Northwest Coast and CalifornidGreat Basin regions, where it reaches frequencies of 18% and 22%, respectively. Even when the three most similar geographic regions (the East, MidwesiYGreat Plains, and Mexico) are compared, their haplogroup distributions are statistically significantly heterogeneous at the 0.05 level of probability (x2 = 10.8, 4
d.f.). The only two of the seven geographic regions whose haplogroup frequencies are not statistically significantly different were Mexico and the East (x2 = 2.82, 2 d.f., P > 0.241, underscoring the strong influence of geography on the distribution of haplo- groups.
Greenberg (1987) divided all New World languages into three families: Eskimo-Aleut, Na-Dene, and Amerind. The distribution of the four haplogroups differs between the Es- kimo-Aleut and northern Na-Dene groups (as represented by the Inuit, Haida, Tlingit, and Dogrib) on one hand and the Amerind groups and southern Na-Dene (Apache and Navajo) on the other (x2 = 137.5, 3 d.f., P << 0.001). This results from the fact that the Eskimo-Aleut and northern Na-Dene in- dividuals (but not, typically, those in Amer- ind groups) are almost exclusively haplo- group A. All of the 24 Amerind groups represented by more than ten individuals have haplogroups B and C (Table 21, as do the Navajo and Apache. Eight of the 24 Am- erind groups lack haplogroup D, three lack haplogroup A, and four lack both haplo- groups A and D.
6 values for clusters of tribes based on a conservative linguistic taxonomy (Campbell and Mithun, 1979) (see Table 2) range from 0.284 (24 language groups), only slightly lower than that for individual tribal groups, to 0.242 (20 language groups). 6 values based on Greenberg's (1987) more inclusive lin- guistic taxonomy range from 0.205 (nine groups based on the following stocks: Es- kimo, Haida, Continental Na-Dene, and the first sublevel groupings: Almosan-Keresi- ouan, Penutian, Hokan, Kiowa-Tanoan, Oto- Mangue, and Uto-Aztecan), a valve slightly greater than that obtained for the seven geo- graphic regions, to 0.184 for the three fami- lies (Eskimo-Aleut, Na-Dene, and Amerind). When the southern Athabaskan groups, who are presumed to share recent (i.e., as re- cently as 500 years ago) ancestry in common with northern Athabaskans (Basso, 1983; Brugge, 19831, are removed from the analy- sis, 0 values for Greenberg's (1987) nine lan- guage groups increases (from 0.205) to 0.246 (x2 = 337.9, with 14 d.f., P << 0.001), and 6 for the three families increases (from 0.184) to0.322(x2 = 142.1,with4d.f.,P<< 0.001).

316 J.G. LOREN2 AND D.G. SMITH
The latter value is still lower than the com- parable value (0.430) for only two geographic regions that combine all Na-Dene and all Eskimo-Aleut speakers into the ArcticlSub- arctic group. While the haplogroup distribu- tion of northern Na-Dene did not differ sig- nificantly from that of Eskimo-Aleuts, heterogeneity among the six haplogroup dis- tributions (A, B, and C + D) of the Amerind language families alone is statistically sig- nificant (x2 = 156.0, with 10 d.f., P << 0.001), and no two of the six haplogroup dis- tributions are homogeneous at the 0.05 level of probability.
Genetic distance. The phenetic tree ob- tained by UPGMA divides the 30 modern North American tribes and the pre-Colum- bian Norris Farms population into four ma- jor clusters based on their frequencies of the four haplogroups. As illustrated in Figure 3, a major split in this tree is defined by the absence (or near absence) of haplogroup A in tribes within cluster IV. Thus, contrary to expectations based on the tripartite lan- guage taxonomy of Greenberg (1987), most Amerinds cluster together with Eskimo- Aleut and Athabascans in the other main branch. Cluster IV is also characterized by a high frequency of haplogroup B and includes both Hokan-speaking and Uto-Aztecan- speaking tribes, each occupying at least two of the seven geographic regions including or adjacent to the Southwest. Only one of three Uto-Aztecan-speaking and one of seven Ho- kan-speaking tribes falls outside cluster IV. Thus, cluster IV is characterized by relative homogeneity of both language and geo- graphic origin. A curious exception is the presence of Cherokee in this cluster. The sin- gle Kiowa-Tanoan group, which Greenberg (1987) regards as closely related, together with Oto-Mangue-speaking tribes, to Uto- Aztecan, also falls in this cluster.
The remaining tribes are subdivided into three clusters. Cluster I comprises the three northwesternmost groups that are predomi- nantly, if not exclusively, of haplogroup A. With the exception of southern Athabascans, this includes all members of two of the three major families of (presumably) unrelated languages (i.e., Eskimo-Aleut and Na-Dene). Thus, tribes in cluster I exhibit geographic
but not language homogeneity. Cluster I1 consists of tribes that have haplogroups A, B, and C but not D. Three of the four tribes from Mexico used in this analysis and both southwestern tribes not included in cluster IV fall in this cluster. As these six tribes that share close geographic proximity represent four different language groups, cluster I1 is primarily geographically defined. Cluster I11 consists of tribes that have all four haplo- groups and was the most geographically het- erogeneous of the four clusters, including tribes from six of the seven geographic re- gions. In contrast, six of the eight tribes in this cluster belonged to either the Penutian or Almosan-Keresiouan language group. Thus, language is more instrumental than geography in structuring this cluster. A max- imum likelihood tree gives virtually the same four clusters as the UPGMA tree, al- though five groups (Mixtec, Zapotec, Chip- pewa/Kickapoo, Zuni, and California Penu- tians) are placed in different clusters. When these five tribal groups are excluded, the 6 value associated with the UPGMA quadri- partite phenetic clustering of tribal groups is 0.322, a value as high as that associated with any clustering based on language or geographic proximity except that for two geographic regions. None of the tribes in clusters I, 111, or IV were placed in different clusters by the two methods.
DISCUSSION A comparison of the distribution of the
four haplogroups in North America with that in the other regions that have been studied is provided in Figure 4. Almost all Native North Americans (94%) belong to one of the four haplogroups, as do Native Central and South Americans (Torroni et al., 1992, 1993a, 1994b; Baillet et al., 1994). However, the frequencies of the haplogroups vary sig- nificantly but not clinally among North, Cen- tral, and South America (xz = 257.45, 6 d.f., P << 0.001), suggesting that the popula- tions in North and South America have evolved relatively independently with re- stricted gene flow through Central America.
Greenberg’s (1987) classification of all Na- tive North American languages into three major families, and especially his hypothesis of “the unity of Amerind,” has met with much

MTDNA VARIATION AMONG NATIVE NORTH AMERICANS 317
Fig. 3. Phenetic tree constructed in PHYLIP 50%; next to smallest, 11-25%; smallest, 1-10%. An as- terisk denotes populations that are found in different clusters in the maximum likelihood tree. Since this pa- per was submitted, haplogroup C has also been identi- fied (Merriwether et al., 1995) in Dogrib people.
(Felsenstein, 1993) using a UPGMA algorithm from ge- netic distances calculated according to Cavalli-Sforza and Edwards (1967). The relative frequencies of the four haplogroups in each population are indicated by the size of the letter: largest letter, 51-100%; next largest, 26-

318 J.G. LOREN2 AND D.G. SMITH
Fig. 4. Frequency distributions of mtDNA haplogroups in Asia and the New World.
resistance among comparative linguists. Nevertheless, some dental and genetic evi- dence supporting his tripartite division of Native Americans has been used to argue for three separate migrations into the New World (Greenberg et al., 1986). The present analysis, while not designed to test Greenberg’s hypthesis, points to a funda- mental split among the Eskimohorthern Na-Dene, Amerinds from the southwestern states of the US., and all other Amerinds. The clustering of the Eskimo and northern Na-Dene, who speak unrelated languages, together (cluster I) in the phenetic and 6 analyses is consistent with the conclusions of previous genetic studies (Szathmary and
Ossenberg, 1978; Shields et al., 1993; Szath- mary, 1996) and does not support the three migration hypothesis. Although most Amer- ind groups, including those in Central and South America (Merriwether et al., 1995), fall in clusters 11-IV, the major division in the phenetic tree separated most Hokan- speaking and Uto-Aztecan-speaking Amer- inds (cluster IV), whose languages are not regarded as closely related, from all other groups. Moreover, no two Amerind language families exhibited homogeneous haplogroup distributions. Thus, our data do not support “the unity of Amerind” (Greenberg, 1987).
Except as noted above, 6 values decrease as the 30 tribes are lumped into more inclu-

MTDNA VARIATION AMONG NATIVE NORTH AMERICANS 319
sive linguistic taxa. However, the relative level of intergroup heterogeneity, as mea- sured by the frequencies of the four mtDNA haplogroups, is about the same whether the tribes are grouped conservatively into 20 lin- guistic taxa or into Greenberg’s (1987) nine major sublevels (when the southern Na- Dene are removed from the analysis). This indicates Greenberg’s linguistic taxonomy produces clusters that are just as genetically homogeneous as when they are clustered by a more conservative linguistic taxonomy. In a study of sequence variation in the mtDNA control region, Ward et al. (1993) found a lack of congruence between the linguistic taxonomy of three northwest coast tribes, the Haida, Bella Coola, and Nuu-Chah- Nulth, and the distribution of their mtDNA types (although the Haida exhibited less intratribal variation), suggesting a strong influence of geography but not language on genetic similarities in that region. The geo- graphic contribution t o genetic similarities in the present study is illustrated in Figure 1. Here, the geographic homogeneity among members of clusters I (triangles in the north- west) and IV (open circles in the southwest) and the Mexican tribes included in cluster I1 (squares in southern Mexico) is well defined. However, all four clusters in the phenogram of tribes in the present study (illustrated in Fig. 3) include tribes of different language and geographic origins. Although the pres- ent study shows that there is no clear clus- tering among most Amerind language taxa or geographic groups, there are some in- stances where either language or geography is more highly correlated with genetic dif- ferences.
The clustering of adjacent tribes whose languages are unrelated in clusters I and IV probably results from admixture. In con- trast, the tribes in cluster 111 are more geo- graphically diverse than those in any of the other three clusters. Language spreads among genetically unrelated (or only re- motely related) tribes might have been more influential in shaping linguistic diversity among tribes in cluster I11 than elsewhere. In contrast, the persistence of language in other regions, despite close intergroup con- tact, is reflected in the fact that the two southern Athabaskan tribes studied fall in
separate clusters, neither of which is identi- cal to that including northern Athabaskans. The geographic clustering of tribes of Mex- ico, representing three different language groups, in cluster I1 might reflect the greater importance of gene flow in shaping the haplogroup distribution in Mexico than in Amerind tribes to the north. All groups clas- sified by Greenberg (1987) as Hokan, with the exception of the SalinanlChumash of California, fall in cluster IV, suggesting re- stricted gene flow with other language groups. However, with the exception of the Cherokee, all tribes in cluster IV are located in the Southwest and surrounding areas (southern CalifornidGreat Basin and Baja California) reflecting a (less pronounced) geographic component to the distribution of the mtDNA haplogroups (Fig. 3). Paralleling the clustering of most Hokan-speaking groups with Uto-Aztecan-speaking groups in close proximity to them is their near exclu- sive sharing of AIMe, a rare mutation at the albumin locus (Schell and Blumberg, 1988; Smith et al., in preparation). The relative contributions of gene flow and common an- cestry to this close genetic relationship are currently under investigation using DNA se- quencing analysis (Lorenz and Smith, in preparation) and microsatellite (SSR) (see Morin and Smith, 1995) polymorphisms linked to the albumin locus (Smith et al., in preparation).
The present study concurs with that of Torroni et al. (1994b), which also found that the Maya and the Mixe, included by Greenberg (1987) in the Penutian sublevel, did not cluster together genetically. On the other hand, Torroni and Wallace (1994) and Torroni et al. (1994b) have argued that the mtDNA of Uto-Aztecans (represented by Pi- mas) and Oto-mangueans (represented by Zapotecs and Mixtecs) clusters together and thus lends genetic support to Greenberg’s (1987) hypothesis that the two (along with Kiowa-Tanoan) comprise the Central Amer- ind Stock. However, the present study shows that when data from additional Uto-Aztecan and Tanoan groups are included, genetic support for Greenberg‘s Central Amerind language taxonomy is not as strong. Figure 3 shows that although California Uto- Aztecans (as well as Kiowa-Tanoans, also

320 J.G. LORENZ AND D.G. SMITH
included by Greenberg in the Central Amer- ind language stock) do cluster with the Pima from the Southwest in group IV, the Nahua, a Uto-Aztecan-speaking group from Mexico, as well as the Oto-manguean groups, Zapo- tec and Mixtec, cluster with other Mexican (as well as non-Mexican) groups in group 11.
The Southwest area is interesting because the tribes in this region have the highest frequencies of haplogroup B in North America and are virtually lacking in haplo- group A, the most common haplogroup in North America. The groups in the Southwest with the highest frequencies of haplogroup A, which is nearly fixed in northern Na-Dene groups, are, not surprisingly, the southern representatives of Na-Dene, the Navajo and Apache. A recent study of a prehistoric southwestern population (Parr et al., 1996) suggests that haplogroups A and B were ab- sent and very common, respectively, in the US Southwest before the Navaho and Apache are believed to have arrived there. The Navajo and Apache also exhibit rela- tively high frequencies of haplogroups B and C which are very rare (though not completely absent [Merriwether e t al., 19951) in north- ern Na-Dene groups and, barring the loss of both haplogroups due to a severe bottleneck within the last millennium, were also very rare in the ancestors of the Na-Dene. Eth- nohistoric records document extensive trad- ing, raiding, and emigration among the Apache, Navajo, and other southwestern groups (Basso, 1983; Brugge, 1983). The dis- tribution of mtDNA haplogroups in the Southwest suggests that this contact was accompanied by extensive female migration among the groups. Let us assume that the presence of haplogroups B and C in the Nav- ajo and Apache is completely due to gene flow from the groups surrounding them in the Southwest and that the presence of haplogroup A in the southwestern groups is completely due to gene flow from the Navajo and Apache. The former assumption is based on the near absence of haplogroups B and C in northern Na-Dene and the recency of the split of NavahoIApache from Northern Na- Dene (Basso, 1983; Brugge, 1983); the latter assumption is justified by the apparent ab- sence of haplogroup A in the Southwest be- fore but not after the arrival of southern
Athabaskans (Pam et al., 1996). The rate of female gene flow (m) per generation required to produce the frequencies of haplogroups B and C observed in the southern Na-Dene and of haplogroup A observed in non-Na-Dene in the Southwest can be calculated by solv- ing for m given that (1 - m)" = qn - Q/ qo - Q. Here, n is the number of generations, qn is the frequency of the allele in the pres- ent-day recipient population, qo is the fre- quency of the allele in the ancestral recipient population, and Q is the frequency of the allele in the donor population (Workman, 1973). Assuming the Apache and Navajo have been in the Southwest for approxi- mately 500 years (Gunnerson, 1979) and 20 yearslgeneration (i.e., n = 251, approxi- mately 2.1% of the female breeding popula- tion each generation originated in the sur- rounding southwestern groups (for this calculation, based on the combined fre- quency of haplogroups B and C, qn = 0.412, qo = 0, and Q = 1). In contrast, assuming equal population size of both groups, only 0.2% of non-Na-Dene southwestern females per generation were derived from the south- ern Athabaskan tribes (based on the fre- quency of haplogroup A where qn = 0.052, qo = 0, and Q = 1). There has apparently been more female gene flow from the sur- rounding southwestern groups into the Apache and Navajo than from the Apache and Navajo into surrounding southwestern groups. Although either a small Apache/ Navajo population (relative to that from which they acquired the B and C haplo- groups) or a nonsouthwestern source for the B and C haplogroups (e.g., retention of prim- itive traits now lost in northern Na-Dene) rather than asymmetric mtDNA gene flow could be responsible, the latter explanation is in agreement with ethnohistorical records of gene flow of emigrants and captives from other southwestern groups into Navaho (Brugge, 1983) and Apache (Basso, 1983) groups. The hypothesis of asymmetric gene flow is also consistent with data on the distri- bution of albumin polymorphisms in the Southwest. The Apache and Navajo have both the Naskapi (AINa) and Mexico (AIMe) albumin variants, while most Pima and Yu- man groups in the Southwest (except in very rare instances) have only AIMe (Schell and
MTDNA VARIATION AMONG NATIVE NORTH AMERICANS 321
Blumberg, 1988; Smith et al., in prepara- tion). Since AINa originated in northern groups and was first introduced in the Southwest by southern Athabaskans and AIMe originated in indigenous southwestern groups, the direction of gene flow must have been principally as hypothesized above. Moreover, since north of Mexico AIMe is other- wise restricted to Uto-Aztecan- and/or Yu- man-speaking groups, they are likely sources for this admixture. That AN" is pres- ent, albeit very rare, in some Uto-Aztecan- speaking (e.g., Hopi) and Yuman-speaking (e.g., Maricopa and Mohave) tribes but in much lower frequencies than AIMe reaches in southern Athabaskans is also consistent with our hypothesis of asymmetric gene flow.
The presence of Cherokee in cluster IV seems enigmatic especially since the Sioux, to whom they are regarded as closely related based on comparative linguistic data (Camp- bell and Mithun, 1979), fall in group I11 with most Algonquian-speaking groups to whom Greenberg (1987) hypothesizes they are closely related. This difference is primarily due to the high frequency of haplogroup A (which is nearly fixed in Athabaskans and common in Algonquians) in Siouan tribes and its absence in the Cherokee. NNa, a marker found in most Athabaskan- and Al- gonquian-speaking tribes (Schell and Blum- berg, 1988; Smith et al., in preparation), is also often present, albeit in low frequencies, in Siouan but absent in Cherokee (as well as Mohawk, also speakers of an Iroquoian language) tribes, suggesting considerable admixture between Siouan but not Iro- quoian tribes and Algonquian-speaking tribes. Athabaskans are unlikely sources of AINa in Siouan groups, assuming admixture was reciprocal, since they completely lack haplogroup B which is common to both Siouan- and Algonquian-speaking groups. Such admixture must have postdated the di- vergence between Siouan-speaking and Iro- quoian-speaking (e.g., Cherokee and Mo- hawk) peoples and the migration of the latter eastward and could be associated with the migration of Algonquian speakers from the Columbia Plateau eastward through the Plains (Denny, 1991) or their subsequent expansion through, and out of, southern On-
tario (Siebert, 1967), which probably oc- curred within the last 3,000 years.
When data from the few archaeological populations in North America that have been studied for mtDNA variation are com- pared with that provided by the present study, continuity between ancient popula- tions in an area and present-day tribes can be assessed. Stone and Stoneking (1993) found that 49 out of 50 individuals from a cemetery at Norris Farms in central Illinois dating to AD 1300 belonged to one of the four haplogroups. The Norris Farms population clusters in group I11 with other tribes from the East and MidwesUGreat Plains. Inter- estingly, a Salt Lake Fremont population from Utah studied by Parr et al. (1996) lacks haplogroup A and exhibits a high frequency of haplogroup B which would place it in group IV where most present-day tribes in that region cluster. The distribution of haplogroups in prehistoric peoples in the western Great Basin do not differ from that of northern Uto-Aztecan-speaking peoples currently living in this region (Kaestle, 1995). These archaeological populations from three different regions suggest a long- term stability in the distribution of the four haplogroups, hence their utility in assessing ancestor-descendant relationships, in at least some regions of North America. The data provided in the present study might also make it possible to determine certain instances where lack of such stability sug- gests major population replacements.
CONCLUSIONS The results of this study indicate that
mtDNA haplogroup frequencies are not ho- mogeneous among Native American tribes. Similarity in the frequency of the four mtDNA haplogroups among North Ameri- can tribes is due both to shared ancestry as indicated by language affiliation (e.g., among Hokan-speaking groups) as well as gene flow between geographically proximate groups (e.g., between Siouan- and Algon- quian-speaking groups). In some cases, such as that of gene flow between Yuman and/or Uto-Aztecan-speaking tribes and the south- ern Athabaskans, the relative contributions of shared ancestry and geographic proximity can be estimated. In other cases, such as that
322 J.G. LORENZ AND D.G. SMITH
of the similarity between Hokan and some Uto-Aztecan-speaking groups, hypoth- eses about language spreads or genetic rela- tionships between languages based on com- parative linguistic, archaeological, or more detailed genetic analysis are plausible. In still other cases, groups with demonstrably unrelated languages (Eskimo-Aleut and Na- Dene) share similar mtDNAs. This study greatly expands our knowledge of the fre- quencies of the four founding mtDNA haplo- groups in North America and thus provides both an improved database for testing hypotheses regarding the overlap of linguis- tically defined cultural units and genetically defined groups and a baseline with which to compare samples collected from archaeologi- cal populations.
ACKNOWLEDGMENTS This study was supported by grants
RR00169, HD-8-2909, and RR05090 from the National Institutes of Health. We are indebted to numerous personnel of Indian Health Service Facilities and to all the peo- ple who have provided samples used in this study. Without their cooperation this study would not be possible. We also thank Dr. John Johnson (Santa Barbara Museum of Natural History) and Mr. David L. Schmidt (University College of Cape Breton, Nova Scotia) for providing hair samples.
LITERATURE CITED Anderson S, Bankier AT, Barrel1 BG, de Bruijn MH,
Coulson AFt, Drouin J, Eperon IC, Nierlich DP, Roe BA, Sanger F, Schreier PH, Smith AJ, Staden R, and Young IG (1981) Sequence and organization of the human mitochondrial genome. Nature 290:457465.
Bailliet G, Rothhammer F, Carnese FR, Bravi CM, and Bianchi NO (1994) Founder mitochondrial haplotypes in Amenndian populations. Am. J . Hum. Genet. 54:27-33.
Ballinger SW, Schurr TG, Torroni A, Gan YY, Hodge JA, Hassan K, Chen K-H, and Wallace DC (1992) South- east Asian mitochondrial DNA analysis reveals ge- netic continuity of ancient Mongoloid migrations. Ge- netics 130:139-152.
Basso KH (1983) Western Apache. In WC Sturtevant (ed.): Handbook of North American Indians: Volume 10 Southwest. Washington, DC: Smithsonian Institu- tion, pp. 462488.
Brugge DM (1983) Navaho prehistory and history to 1850. In WC Sturtevant (ed.): Handbook of North American Indians: Volume 10 Southwest. Washing- ton, DC: Smithsonian Institution, pp. 489-501.
Campbell L, and Mithun M (1979) North American In-
dian historical linguistics in current perspective. In L Campbell and M Mithun (eds.): The Languages of Native America: A Historical and Comparative As- sessment. Austin: University of Texas Press, pp. 3-69.
Cavalli-Sforza LL, and Edwards AW (1967) Phylogenetic analysis: Models and estimation procedures. Evolu- tion 32.550-570.
Chakraborty R, and Weiss K (1991) Genetic variation of the mitochondrial DNA genome in American Indi- ans is at mutation-drift equilibrium. Am. J . Phys. An- thropol. 86:497-506.
Denny JP (1991) The Algonquian Migration From Pla- teau to Midwest: Linguistics and Archaeology. Papers of the 22"d Algonquian Conference. Ottawa: Carle- ton University.
Felsenstein J (1993) PHYLIP (Phylogeny Inference Package), version 3 .5~ . Distributed by the author. De- partment of Genetics, University of Washington, Seattle.
Greenberg J H (1987) Language in the Americas. Stan- ford: Stanford University Press.
Greenberg JH, Turner CG 11, and Zegura SL (1986) The settlement of the Americas: A comparison of the lin- guistic, dental, and genetic evidence. Curr. Anthro- pol. 27:477497.
Gunnerson J H (1979) Southern Athapaskan Archeology. In WC Sturtevant (ed.): Handbook ofNorth American Indians: Volume 9 Southwest. Washington, DC: Smithsonian Institution, pp. 162-169.
Johnston FE, Blumberg BS, Aganvall SS, Melartin L, and Burch TA (1969) Alloalbuminemia in Southwest- ern U.S. Indians: Polymorphism of albumin Naskapi and albumin Mexico. Hum. Bid. 41:263-270.
Kaestle F (1995) Mitochondria1 DNA evidence for the identity of the descendants of the prehistoric Stillwa- ter Marsh population. In CS Larsen and RL Kelly (eds.): Bioarchaeology of the Stillwater Marsh: Prehis- toric Human Adaptation in the Western Great Basin. Anthropological Papers of the American Museum of Natural History, pp. 73-80.
Lorenz JG, and Smith DG (1994) Distribution of the 9 bp mitochondrial DNA region V deletion among North American Indians. Hum. Biol. 66:777-788.
Lorenz JG, and Smith DG (in preparation) Geographic and linguistic distribution of sequence variation in the mtDNA control region of native North American Indians.
Merriwether DA, Rothhammer F, and Ferrell RE (1995) Distribution of the four founding lineage haplotypes in Native Americans suggests a single wave of migra- tion for the New World. Am. J . Phys. Anthropol. 98:411-430.
Morin PA, and Smith DG (1995) Nonradioactive detec- tion of hypervariable simple sequence repeats in short polyacrylamide gels. Biotechniques 19:223-227.
Nichols J ( 1992) Linguistic Diversity in Space and Time. Chicago: The University of Chicago Press.
Parr RL, Carlyle SW, and ORourke DH 11996) Ancient DNA analysis of Fremont Amerindians of the Great Salt Lake wetlands. Am. J . Phys. Anthropol. 99507-5 18.
Schell LM, and Blumberg BS (1988) Alloalbuminemia and the migrations of Native Americans. Yrbk. Phys. Anthropol. 31:l-13.

MTDNA VARIATION AMONG NATIVE NORTH AMERICANS 323
Schurr TG, Ballinger SW, Gan Y-Y, Hodge JA, Merri- wether DA, Lawrence DN, Knowler WC, Weiss KM, and Wallace DC (1990) Amerindian mitochondrial DNAs have rare Asian mutations at high frequencies, suggesting they derived from four primary maternal lineages. Am. J. Hum. Genet. 46:613-623.
Shields GF, Hecker K, Voevoda MI, and Reed J K (1992) Absence of the Asian-specific region V mitochondrial marker in native Beringians. Am. J. Hum. Genet. 50:758-765.
Shields GF, Schmiechen AM, Frazier BL, Redd A, Voe- voda MI, Reed JK, and Ward RH (1993) mtDNA se- quences suggest a recent evolutionary divergence for Beringian and northern North American populations. Am. J . Hum. Genet. 53.549462.
Siebert FT Jr (1967) The original home of proto-Algon- kian people. Anthropological Series 78. Natl. Mus. Can. Bull. 214:1347.
Siege1 S (1956) Nonparametric Statistics for the Behav- ioral Sciences. New York: McGraw Hill Book Co., Inc.
Smith DG, Lorenz JG, Kanthaswamy S, Rolfs BK, and Bettinger RL (in preparation) Ethnohistorical impli- cations of the distributions of albumin Naskapi and albumin Mexico in North America.
Stone AC, and Stoneking M (1993) Ancient DNA From a pre-Columbian Amerindian population. Am. J . Phys. Anthropol. 92:463-471.
Szathmary EJE (1996) Ancient migrations from Asia to North America. In T Akazawa and EJE Szathmary (eds.): Prehistoric Mongoloid Dispersals. Oxford: Ox- ford University Press, pp. 149-164.
Szathmary EJE, and Ossenberg NS (1978) Are the bio- logical differences between North American Indians and Eskimos truly profound? Curr. Anthropol.
Torroni A, and Wallace DC (1994) Mitochondrial DNA variation in human populations and implications for detection of mitochondrial DNA mutations of patho- logical significance. J . Bioenerg. Biomembr. 26:
Torroni A, and Wallace DC (1995) Mitochondrial DNA haplogroups in Native Americans. Am. J . Hum. Genet. 56~1234-1236.
Torroni A, Schurr TG, Yang C-C, Szathmary EJ, Wil- liams RC, Schanfield MS, Troup GA, Knowler WC,
19:673-685.
261-271.
Lawrence DN, Weiss KM, and Wallace DC (1992) Na- tive American mitochondrial DNA analysis indicates that the Amerind and the Nadene populations were founded by two independent migrations. Genetics
Torroni A, Schurr TG, Cabell MF, Brown MD, Nee1 Jv, Larsen M, Smith DG, Vullo CM, and Wallace DC (1993a) Asian affinities and continental radiation of the four founding Native American mtDNAs. Am. J . Hum. Genet. 53.563-590.
Torroni A, Sukernik RI, Schurr TG, Starikovskaya YB, Cabell MF, Crawford MH, Comuzzie AG, and Wallace DC (199313) mtDNA variation of aboriginal Siberians reveals distinct genetic affinities with Native Ameri- cans Am. J. Hum. Genet. 53.591-608.
Torroni A, Miller JA, Moore LG, Zamudio S, Zhuang J , Droma T, and Wallace DC (1994a) Mitochondrial DNA analysis in Tibet. Implications for the origin of the Tibetan population and its adaptation to high altitude. Am. J. Phys. Anthropol. 93:189-199.
Torroni A, Chen Y-S, Semino 0, Santachiara-Beneceretti AS, Scott CR, Lott MT, Winter M, and Wallace DC (1994b) mtDNA and y-chromosome polymorphisms in four Native American populations from southern Mex- ico. Am. J. Hum. Genet. 54:303-318.
Wallace DC, Garrison K, and Knowler WC (1985) Dra- matic founder effects in Amerindian mitochondrial DNA. Am. J. Phys. Anthropol. 68:149-155.
Ward RH, Frazier BS, Dew K, and Paabo S (1991) Exten- sive mitochondrial diversity within a single Amerin- dian tribe. Proc. Natl. Acad. Sci. U.S.A. 88:8720-8724.
Ward RH, Redd A, Valencia D, Frazier B, and Paabo S (1993) Genetic and linguistic differentiation in the Americas. Proc. Natl. Acad. Sci. U.S.A. 90:10663- 10667.
Weir BS (1990) Intraspecific differentiation. In DM Hillis and C Moritz (eds.): Molecular Systematics. Sunderland, Massachusetts: Sinauer Assoc., Inc., pp. 373410.
Workman PL (1973) Genetic analysis of hybrid popula- tions. In MH Crawford and PL Workman (eds.): Meth- ods and Theories of Anthropological Genetics. Albu- querque: University of New Mexico Press, pp. 117-150.
130:153-162.