Embed Size (px)
Citation preview
Available online at www.worldscientificnews.com
WSN 66 (2017) 281-292 EISSN 2392-2192
Distribution of Marine Debris in Biawak Island, West Java, Indonesia
Noir P. Purba1,*, Mega L. Syamsuddin1, Rona Sandro2,
Isnan F. Pangestu2, M. Reza Prasetio2
1Department of Marine Science, Faculty of Fisheries and Marine Science, Padjadjaran University,
Jatinangor 45363, West Java, Indonesia
2KOMITMEN Research Group, Padjadjaran University, Jatinangor 45363, West Java, Indonesia
*E-mail address: [email protected]
ABSTRACT
Marine debris becomes a challenge to the ocean view especially in Indonesia as a maritime
country. This study investigates the distribution of marine debris in the Biawak Island, Indramayu
district, Indonesia. This study was conducted in November 2013 and 2014 by completing the standard
form of the global International Coastal Cleanup (ICC) Network. By doing this, we aim to establish
the condition and distribution of debris in the ecosystem area. The data collected from 7 stations along
the coast of the Biawak island. The results showed that the total weight of marine debris ranged from
3-26 kg in each station with the highest density located at the eastern part of Biawak Island. The total
weight of marine debris was 68 kg of 655 meters from total length 4.93 km of coastal line. Marine
debris that found in the region predominantly composed of waste rope, styrofoam, and plastics. Debris
from fishing activities also suggesting as a prevalent debris item found in the region. The result
indicates that sources of debris transported from other regions by the ocean currents.
Keywords: Biawak Island, plastics, fishing gear, tracking, mangrove ecosystem
1. INTRODUCTION
Marine debris as a global issue for this century [1]. This issue blow up by UNEP Report
in 2011, Rio +20 Conference in 2012, and World Economic Forum in 2016. The report
World Scientific News 66 (2017) 281-292
-282-
concluded that almost marine debris affected biodiversity of ocean. Especially in Indonesia,
marine debris becomes a serious problem for coastal areas and small islands, because this area
as habitat for marine life and ecosystems. Most of this waste comes from human activities
which transported by ocean currents to all areas depending on the oceanographic system.
Since Indonesia as the world’s largest archipelago (comprising 14.466 islands), the spread of
marine debris becomes more complex due to transported by the current system which is
locally and shifting [2]. The study about marine debris has been done in some coastal and
island area. Founded that marine debris from various continents was drifted by ocean currents
in Amami Island, Japan [3]. Marine debris distributed in the beach when the high tide ends
occurred [4]. The study on the island of Santa Catarina, Brazil, found that abundances of litter
ranging from 12.8 to 498 items/100 m2 [5].
There are many different types of debris enter the ocean. A study estimated that millions
of tons of plastics enter the ocean each year [6]. Furthermore, Ocean Conservancy stated that
the distribution of the top ten global garbage in coastal includes cigarettes, caps, plastic,
beverage bottles, plastic bags, food wrappers, cups/plates, glass, straws, beverage cans, and
paper bags [7]. Types of debris in the form of cigarettes and exhaust cutlery were the most
frequent debris encountered in the entire coast of the world, accounted for 32 % and 9 % of
the total debris, respectively. In some commercial beach in Indonesia, approximately 65 % of
the waste that located in the coast sourced from tourists [8]. A similar study showed the
portion of waste from land and sea is about 3:1 [9].
One of the isle that exist in the northern of West Java province is Biawak Island, which
is categorized as Marine Conservation Areas (MCA). This isle consists of three islands named
Biawak, Gosong, and Candikia. These islands are located in the Java Sea with characteristics
that resemble the "big river" with alternating currents system. Biawak Island has a long
coastline and located at 4.88 miles off the coast of Java Sea, ±40 km north coast of Indramayu
spanning between 05°56'002" S and 108°22'015" E, located 26 miles (50 km) north of fishing
base in Indramayu. The island is characterized by flat topography with some parts of the
island covered by mangrove inundated by sea water, especially at high tide. Biawak Island is
about ±120 Ha wide, consisting of 1 ±80 hectares of mangroves and coastal forests ± 40
ha/land [10]. Mangroves are scattered along the beach to be a perfect trap for the garbage that
comes from the sea due to the roots. Some survey of environmental conditions has been
conducted in the Biawak Island, namely the BIEXRE I & II (2012-2013), T-RAX (2013), and
MYSEA Project (2014). The survey results showed that the status of the ecosystem 80% was
in a good condition. The population of the island is only 1-2 people in charge to maintain the
lighthouse.
The importance of this study is because the marine debris, which almost inorganic
matters, can damage the ecosystem [11]. Marine debris impacts on environmental conditions
are less publicized than ingestion and involvement include the smothering of the ocean floor
sinks when marine litter [12]. In this study, a preliminary study was conducted to determine
the type and distribution pattern of debris in the Biawak island.
2. MATERIALS AND METHODS
A wide range of measurement methods have been applied to aquatic litter studies and a
selection is described below [4,8,13]. The method used in this study was follow the standards
World Scientific News 66 (2017) 281-292
-283-
of the International Union Conservancy of Nature (IUCN) with the supplied standard data
tables containing pollutants that found in the location of activities. The coastal cleaning type
was a shore cleanup [7] started from the area of the highest tides to a near dunes area that is
not affected by the tide. The filling forms consist of 39 items question with focus on weight
and distance sampling point.
2. 1. Preliminary Data
In 2012, the preliminary observations focus on the mangrove ecosystem area and
oceanographic have already done in the Biawak Island. Meanwhile, in this project, the
observations were conducted in November 2013 and 2014. The total stations were 4 stations
in 2013 and 3 stations in 2014 (Table 1).
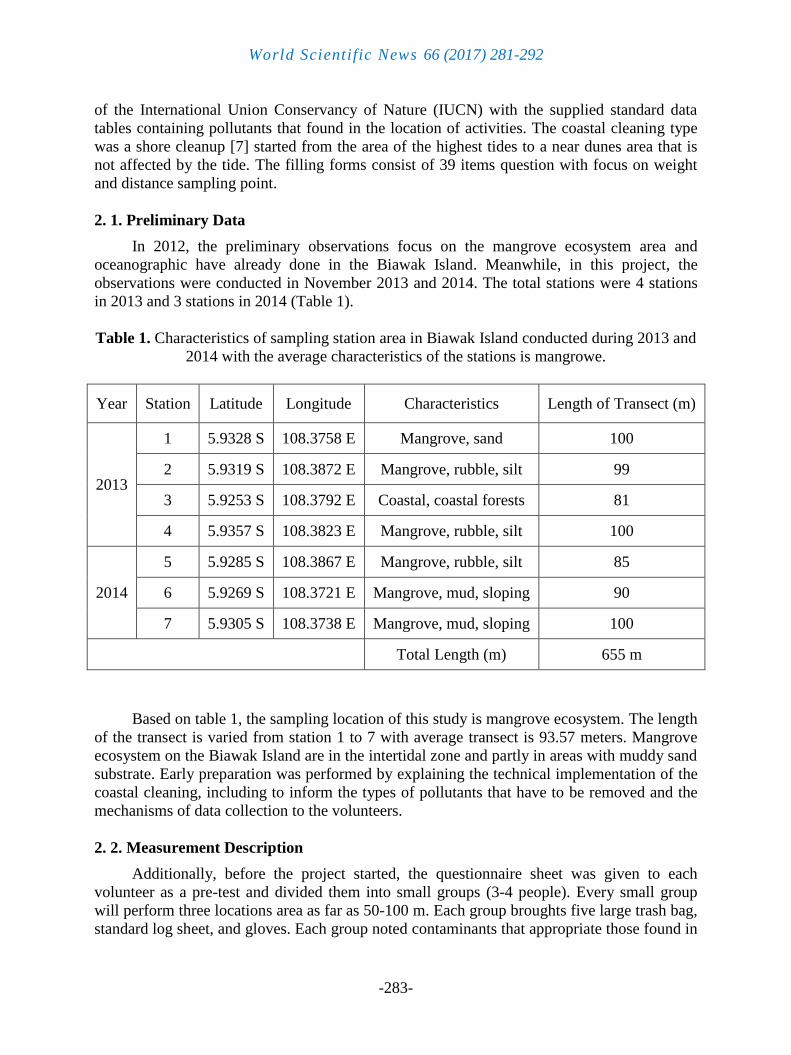
Table 1. Characteristics of sampling station area in Biawak Island conducted during 2013 and
2014 with the average characteristics of the stations is mangrowe.
Year Station Latitude Longitude Characteristics Length of Transect (m)
2013
1 5.9328 S 108.3758 E Mangrove, sand 100
2 5.9319 S 108.3872 E Mangrove, rubble, silt 99
3 5.9253 S 108.3792 E Coastal, coastal forests 81
4 5.9357 S 108.3823 E Mangrove, rubble, silt 100
2014
5 5.9285 S 108.3867 E Mangrove, rubble, silt 85
6 5.9269 S 108.3721 E Mangrove, mud, sloping 90
7 5.9305 S 108.3738 E Mangrove, mud, sloping 100
Total Length (m) 655 m
Based on table 1, the sampling location of this study is mangrove ecosystem. The length
of the transect is varied from station 1 to 7 with average transect is 93.57 meters. Mangrove
ecosystem on the Biawak Island are in the intertidal zone and partly in areas with muddy sand
substrate. Early preparation was performed by explaining the technical implementation of the
coastal cleaning, including to inform the types of pollutants that have to be removed and the
mechanisms of data collection to the volunteers.
2. 2. Measurement Description
Additionally, before the project started, the questionnaire sheet was given to each
volunteer as a pre-test and divided them into small groups (3-4 people). Every small group
will perform three locations area as far as 50-100 m. Each group broughts five large trash bag,
standard log sheet, and gloves. Each group noted contaminants that appropriate those found in
World Scientific News 66 (2017) 281-292
-284-
the standard log sheet. When all procedurs are completed, each group collects the debris in the
plastic bags that containing pollutant at each point of a predetermined area. Then, debris
quantities was measured for knowing its weight. Methods involving volunteer fairly effective
because it provides knowledge about the debris in the ecosystem and the beach [14];[15]. The
site selection is based on the amount of debris and it represents the characteristics of the
island. Additionally, interviews and determining the location of the fishing station also carried
out to provide an overview related to the source and type of debris in the waters.
3. RESULTS AND DISCUSSION
The sites of data collection located along the coast of the Biawak Island. Sampling sites
are mostly located in the region of mangrove ecosystems and on the sandy beach. Garbage
collection performed at different stations for each year. This section will show the type and
amount of waste and the dominance of species that exist in each of the station.
3. 1. Distribution of Debris
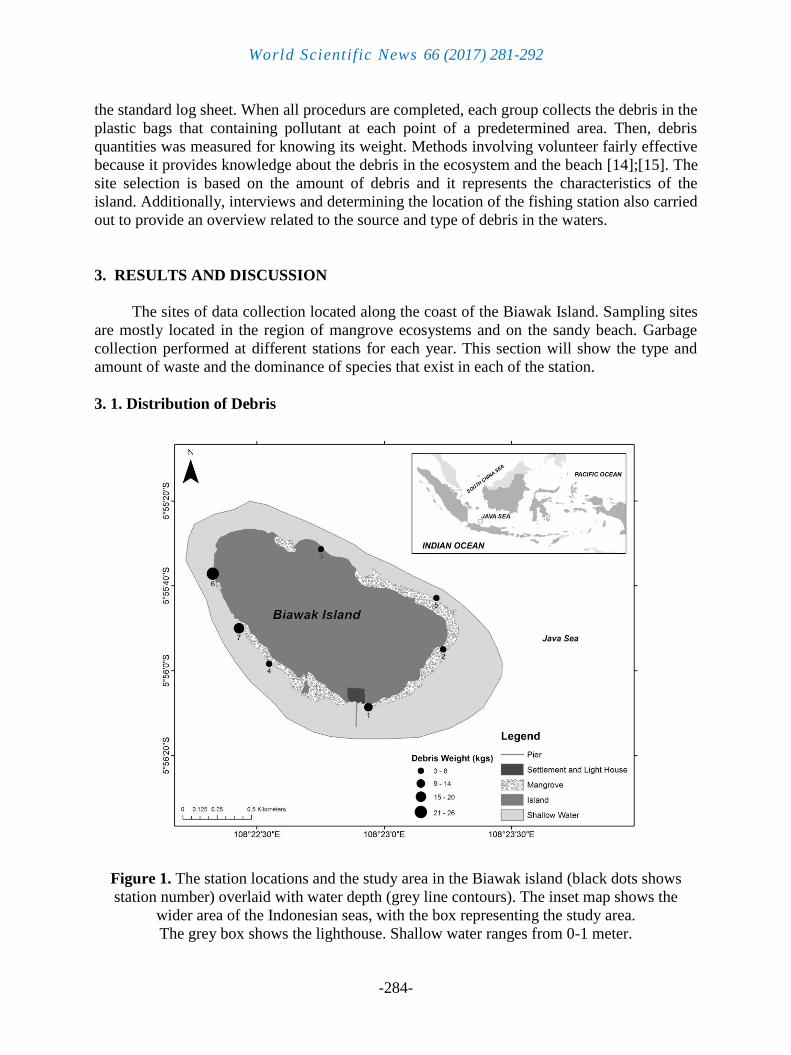
Figure 1. The station locations and the study area in the Biawak island (black dots shows
station number) overlaid with water depth (grey line contours). The inset map shows the
wider area of the Indonesian seas, with the box representing the study area.
The grey box shows the lighthouse. Shallow water ranges from 0-1 meter.
World Scientific News 66 (2017) 281-292
-285-
The location of debris found mostly in the mangrove ecosystem and only one site
located on the sandy beach (station 3) in north of the island. In the mangrove area, debris
found among the roots, while at the sandy beaches, in the line of highest tides. Litter weight
ranged from 3 to 26 kg, with stations 6 (east) is the location with the heaviest litter quantity
(21 to 26 kg), while the least weight is in around the pier (stations 1 and 4). East region
(stations 6 and 7) and south (station 4) have the greatest concentration of debris (Figure 1). In
these areas, mangrove Avicennia dominate the beach and its roots submerged at high tide and
low tide. At other stations, mangrove roots submerged only at the highest tide. Marine debris
commonly found at high tide [16]. This indicates that the mangrove roots have strong
influence as a trap of marine debris. Furthermore, based on the shores characteristics (Table
1), the marine debris were located in shore by wave breaking.
Preliminary analysis indicates that the debris in all the beach is not an endemic debris
but brought by ocean currents. It is indicated that all the debris have been transported far away
from the settlement. The results of interviews with people who lived in this island, showed
that the debris sourced from fishing vessels and also from other regions. Additionally,
residents in this island have its own landfill.
Based on the results of data collection and field survey, the marine debris was very hard
to take, especially plastic and rope that trapped in the mangrove roots. This garbage has been
trapped approximately one year (annual), because in the second year of monitoring conducted
in different places. Then, the cause of this condition probably occurs due to alternating current
system in the mangrove roots.
3. 2. Types of Debris
Other results showed that the most frequent type of debris found are nets, and ropes
around the mangrove ecosystem (Figure 2). Rope most widely found at almost every station.
The fishing net are not found in station 1 because the location quite close to human activities,
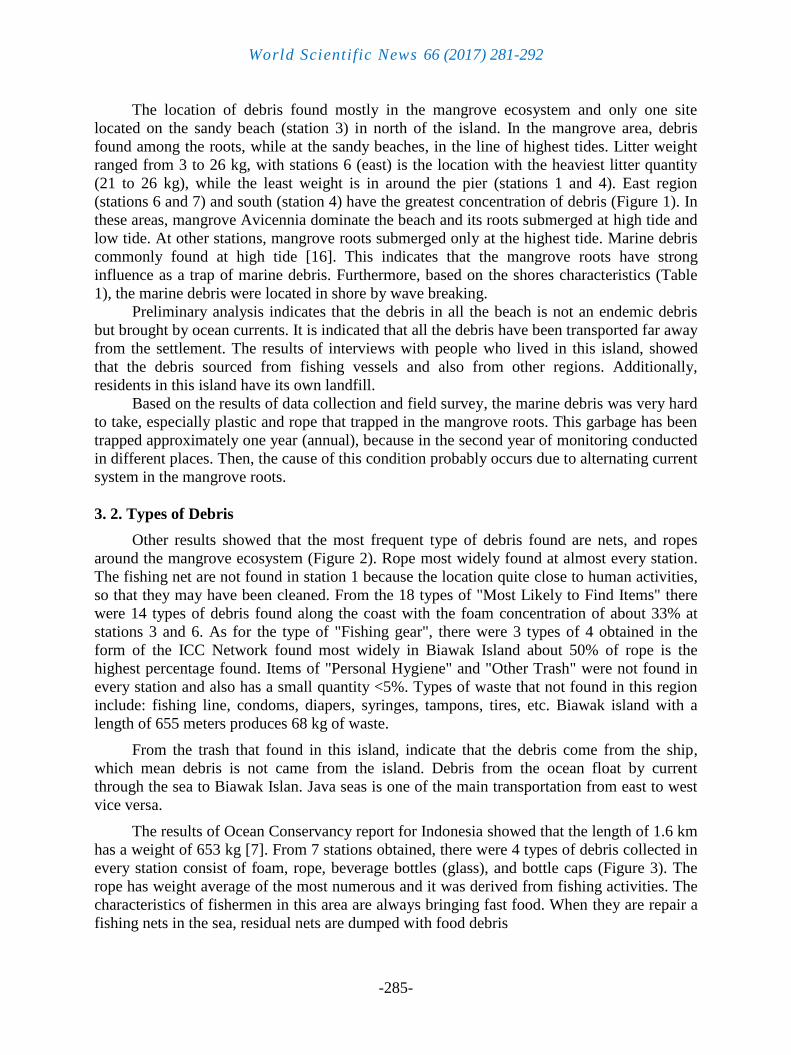
so that they may have been cleaned. From the 18 types of "Most Likely to Find Items" there
were 14 types of debris found along the coast with the foam concentration of about 33% at
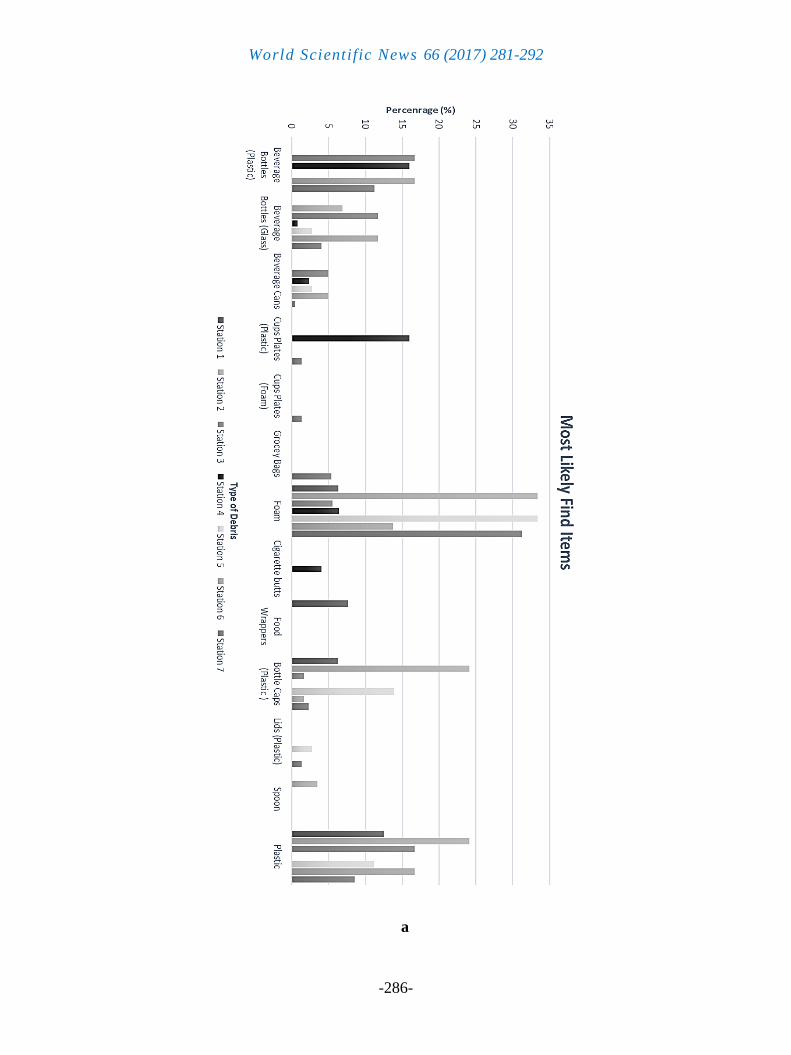
stations 3 and 6. As for the type of "Fishing gear", there were 3 types of 4 obtained in the
form of the ICC Network found most widely in Biawak Island about 50% of rope is the
highest percentage found. Items of "Personal Hygiene" and "Other Trash" were not found in
every station and also has a small quantity <5%. Types of waste that not found in this region
include: fishing line, condoms, diapers, syringes, tampons, tires, etc. Biawak island with a
length of 655 meters produces 68 kg of waste.
From the trash that found in this island, indicate that the debris come from the ship,
which mean debris is not came from the island. Debris from the ocean float by current
through the sea to Biawak Islan. Java seas is one of the main transportation from east to west
vice versa.
The results of Ocean Conservancy report for Indonesia showed that the length of 1.6 km
has a weight of 653 kg [7]. From 7 stations obtained, there were 4 types of debris collected in
every station consist of foam, rope, beverage bottles (glass), and bottle caps (Figure 3). The
rope has weight average of the most numerous and it was derived from fishing activities. The
characteristics of fishermen in this area are always bringing fast food. When they are repair a
fishing nets in the sea, residual nets are dumped with food debris
World Scientific News 66 (2017) 281-292
-286-
a
World Scientific News 66 (2017) 281-292
-287-
Figure 2. a) Debris which is often found in the whole station is foam and the second highest
is plastic; b) There is debris which is found in the form of fishing gear throughout the station,
rope, the presentation is about 50%; c) There is found Personal Hygiene in the form of two
types, namely, cloth /shirt by 3.2% and slipper by 3.4% which was in station 2 and 4. There
are three types of other trash which is found at the site, Lamp Tires and Balloons, which are
found at station 2 and 7 with the largest percentage obtained from tires and lights by 3.4%.
c
World Scientific News 66 (2017) 281-292
-288-
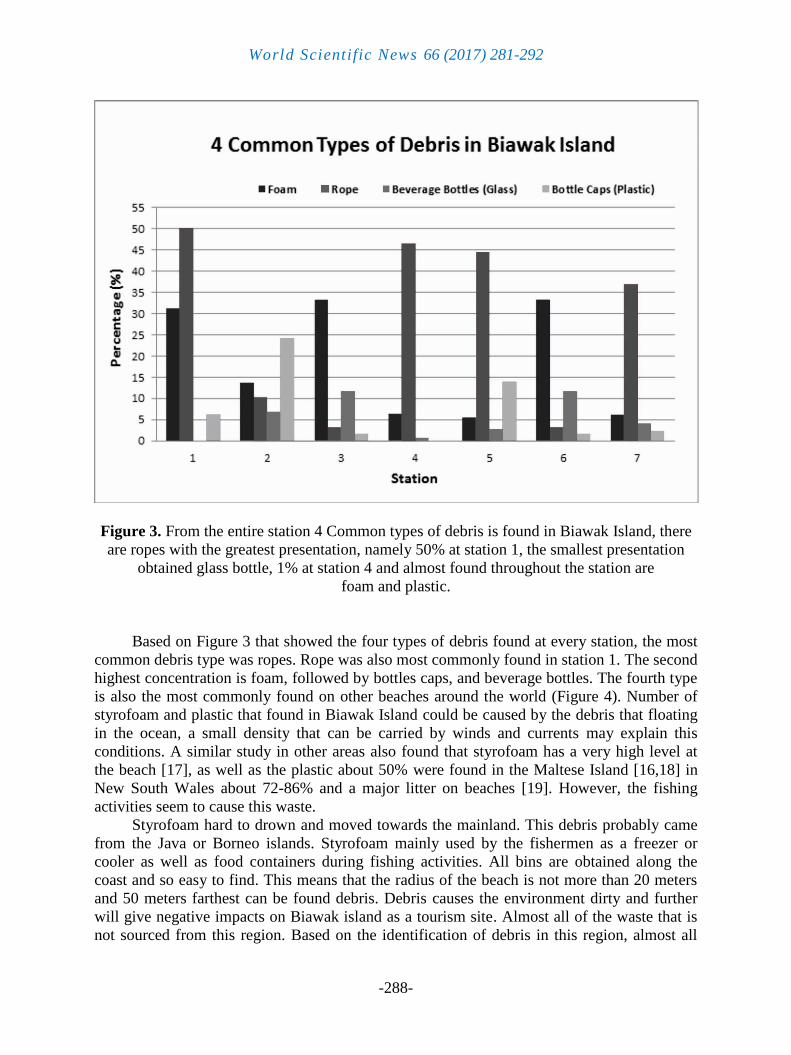
Figure 3. From the entire station 4 Common types of debris is found in Biawak Island, there
are ropes with the greatest presentation, namely 50% at station 1, the smallest presentation
obtained glass bottle, 1% at station 4 and almost found throughout the station are
foam and plastic.
Based on Figure 3 that showed the four types of debris found at every station, the most
common debris type was ropes. Rope was also most commonly found in station 1. The second
highest concentration is foam, followed by bottles caps, and beverage bottles. The fourth type
is also the most commonly found on other beaches around the world (Figure 4). Number of
styrofoam and plastic that found in Biawak Island could be caused by the debris that floating
in the ocean, a small density that can be carried by winds and currents may explain this
conditions. A similar study in other areas also found that styrofoam has a very high level at
the beach [17], as well as the plastic about 50% were found in the Maltese Island [16,18] in
New South Wales about 72-86% and a major litter on beaches [19]. However, the fishing
activities seem to cause this waste.
Styrofoam hard to drown and moved towards the mainland. This debris probably came
from the Java or Borneo islands. Styrofoam mainly used by the fishermen as a freezer or
cooler as well as food containers during fishing activities. All bins are obtained along the
coast and so easy to find. This means that the radius of the beach is not more than 20 meters
and 50 meters farthest can be found debris. Debris causes the environment dirty and further
will give negative impacts on Biawak island as a tourism site. Almost all of the waste that is
not sourced from this region. Based on the identification of debris in this region, almost all
World Scientific News 66 (2017) 281-292
-289-
debris were difficult to unravel. Globally, there were different results when we compared with
the results of the ICC, they found that cigarettes as the first rank, while in the island Biawak
dominated by rope, styrofoam, and plastic. But overall, this types of debris still include of the
10 ten types of trash found in the world.
Based on the type and distribution patterns of garbage derived from outside the Biawak
island and mostly fishing’s debris, then further analysis is needed to see the flows pattern and
consider the fishing position in the region. Biawak island is an area with a high intensity of
fishing and fishermen from Indramayu and from outside the region (Figure 4). The first
approximation of debris on the Biawak island is caused by several factors, that is the currents,
wind, bottom topography, and waves [20]. The flow pattern in this region is associated with
the tides and wind. Current dominance occurs always leads to the coast. As a result of the
dominance of tidal currents, wind direction different from the flow surface current 0,272 m/s
in the direction of the daily fluctuation [21]. The wind blows from north to south, while the
current is moving from east and west. Biawak region located between the islands of Borneo
and Java, which, seen as a largest "watershed". In Kuta beach, Bali, mostly debris found
during the west season [22,23].
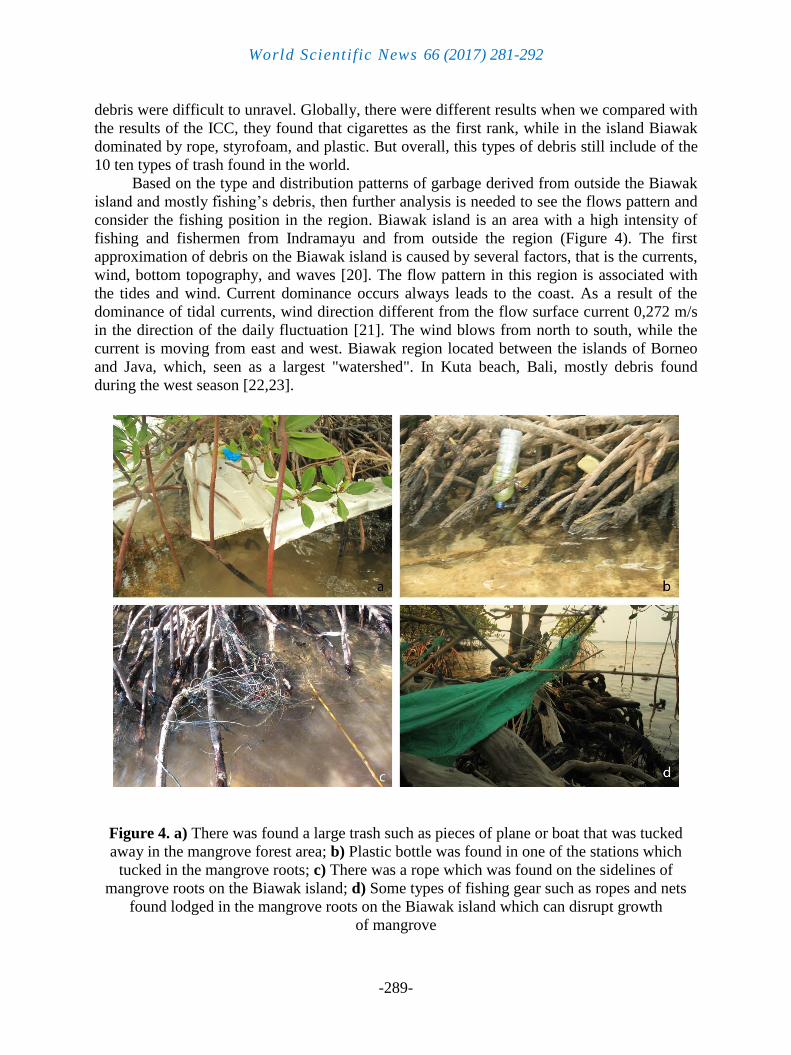
Figure 4. a) There was found a large trash such as pieces of plane or boat that was tucked
away in the mangrove forest area; b) Plastic bottle was found in one of the stations which
tucked in the mangrove roots; c) There was a rope which was found on the sidelines of
mangrove roots on the Biawak island; d) Some types of fishing gear such as ropes and nets
found lodged in the mangrove roots on the Biawak island which can disrupt growth
of mangrove
World Scientific News 66 (2017) 281-292
-290-
It was difficult to determine the flow pattern of specifically brand or types of marine
debris. This is due to the observation conducted in 2014 did not find the same trash on the
location of the previous survey in 2013. Further investigation through the use of long period
observation on distribution patterns of debris are needed in this region.
4. CONCLUSIONS
Marine debris were found on all coastal area of Biawak island and trapped by the ocean
currents. The weight of debris ranged from 3-26 kg with the total of 68 kg of 655 meters from
total length of 4.93 km. The majority of debris found in the mangroves area and mostly
consisted of fishing’s debris (ropes). Based on the stations sampling, there were 4 types of
debris collected in every station consisted of foam, rope, beverage bottles, and bottle caps. A
greater understanding of marine debris in island in Indonesia needs to be obtained by further
studies to know the source.
Acknowledgement
The authors would like to thank UNPAD which has funded these activities in the form of, BIEXRE I&II Project
(2012-2013), T-RAX-BOPTN Project 2013, MYSEA-BOPTN Project 2014, KOMITMEN Research Group
(Instrumentation and Marine Survey Community), academicians of FPIK-UNPAD who have participated in
activities of Coastal Cleaning.
References
[1] STAP, 2011. Marine Debris as a Global Environmental Problem: Introducing a
solutions based framework focused on plastic. A STAP Information Document. Global
Environment Facility, Washington, DC, 29 p.
[2] Purba, N. P., Kelvin, J., Widiarti, R., Syaidah, N., 2012. Inner Water Characteristics of
Anambas Island, Riau Province-Indonesia. International Journal of Science and
Research, 3(6), 2319-7064.
[3] Kei, K., 2005. Beach Litter in Amami Islands, Japan. Journal of South Pacific Studies,
26(1), 15-24.
[4] Attamimi, A.; Purba, N. P.; Anggraini, S. R., and Harahap, S. A., 2015. Investigation of
Marine Debris in Kuta Beach, Bali. In: Suhartanto, E., Juwono, P. T., WWS, A.,
Andawayanti, U., Hidayat, F., Susilo, G. E. (eds), Proceedings of Environmental
Engineering and Water Technology, Integrated Water System and Governance (Malang,
East Java, Indonesia), pp. C1-7.
[5] Widmer, W. M. and Mariana, C. H., 2010. Marine Debris in the Island of Santa
Catarina, South Brazil: Spatial Patterns, Composition, and Biological Aspects. Journal
of Coastal Research, 26(6), 993-1000. doi:10.2112/JCOASTRES-D-09-00072.1.
[6] Derraik, J. G. B., 2002. The pollution of the marine environment by plastic debris: a
review. Marine Pollution Bulletin, 44, 842-852.
World Scientific News 66 (2017) 281-292
-291-
[7] Ocean Conservacy, 2011. Tracking trash 25 years of action for the Ocean. Organisation
Report. ICC Report, 43 pp.
[8] Handaka, A. A.; Riyantini, I., and Awaluddin, M. Y., 2007. Public Awareness Against
Pollution in Coastal Areas of Pameungpeuk, Garut, Indonesia. Journal of Akuatika,
5(1), 12-18.
[9] Slavin, C.; Grage, A., and Campbell, M. L., 2012. Linking social drivers of marine
debris with actual marine debris on beaches. Journal of Marine Pollution Bulletin, 64,
1580-1588. doi:10.1016/j.marpolbul.2012.05.018.
[10] Ministry of Marine and Fisheries Affair (KKP). Conservation Area Data.
http://www.kkji.kp3k.kkp.go.id
[11] Hutabarat, S. and Evans S. M., 1985. Introduction to Oceaography. Jakarta: UI Press,
159 p.
[12] Trouwborst, A., 2011. Managing Marine Litter: Exploring the Evolving Role of
International and European Law in Confronting a Persistent Environmental Problem.
Merkorius, Utrecht Journal of International and European Law, 27(73), 04-18.
[13] Topçu, E. N.; Tonay, A. M.; Dede, A.; t r , . A., and t r , ., 0 . rigin and
abundance of marine litter along sandy beaches of the Turkish Western Black Sea
Coast. Journal of Environmental Research, 85, 21-28. doi:
10.1016/j.marenvres.2012.12.006
[14] Earl, R. C.; Williams, A. T.; Simmons, S. L., and Tudor, D. T., 2000. Aquatic litter,
management and prevention–the role of measurement. Journal of Coastal Conservation,
6, 67-78.
[15] Ohkura, Y. and Kojima, A., 2007. International Coastal Cleanup Campaign Coordinated
by JEAN in Japan Present state and future prospects. Proceedings The 2nd
NOWPAP
Workshop on Marine Litter (Toyama, Japan), 109-118.
[16] Taffs, K. H. and Cullen, M. C., 2005. The distribution and abundance of marine debris
on isolated beaches of northern New South Wales, Australia. Australasian Journal of
Environmental Management, 12(4), 244-250.
[17] Rosevelt, C.; Huertos, M. L.; Garza, C. and Nevins, H.M., 2013. Marine debris in
central California: Quantifying type and abundance of beach litter in Monterey Bay,
CA. Elsevier. Marine Pollution Bulletin, 71(1), 299-306. doi:10.10.16/j.marpolbul.
2013.01.015
[18] Mifsud, R.; Dimech, M., and Schembri, P. J., 2013. Marine litter from circalittoral and
deeper bottoms off the Maltese islands. Journal of Mediteranian Marine Science, 14(2),
298-308. doi:10.12681/mms.413.
[19] Silva-Cavalcanti, J. S.; arbosa de raújo, M. C., and Ferreira da Costa, M., 2009.
Plastic litter on an urban beach – a case study in Brazil. Journal of Waste Management
& Research, 27, 93-97. doi:10.1177/0734242X08088705.
World Scientific News 66 (2017) 281-292
-292-
[20] Bauer, L. J.; Kendall, M. S., and Jeffrey, C. F. G., 2008. Incidence of marine debris and
its relationships with benthic features in Gray’s Reef National Marine Sanctuary,
Southeast USA. Journal of Marine Pollution Bulletin, 56, 402-413.
[21] Purba, N. P; Kelvin, J.; Annisaa, M.; Teliandi, T.; Ghalib K. G.; Pratama, R. I., and
Damanik, F. S., 2013. Preliminary Research Of Using Ocean Currents And Wind
Energy To Support Lighthouse In Small Island, Indonesia. Elsevier Journal, Energy
Procedia, 47, 204-210.
[22] Farica, E. Y.; Radjawane, I. M., and Suprijo, T., 2012. Assesment of Marine Debris on
Kuta Bali beach. Proceedings of The 3rd International Workshop on Soft Computing
and Disaster Control (Bali, Indonesia).
[23] LPDSKP, 2014. Coastal Vulnerability Assesment in Bali, Indonesia. Padang, LPDSKP,
10 p.
( Received 16 January 2017; accepted 30 January 2017 )