Embed Size (px)
Citation preview
551
Distribution of Thermokarst Lakes and Ponds at Three Yedoma Sites in Siberia
Guido GrosseGeophysical Institute, University of Alaska Fairbanks, USA
Vladimir RomanovskyGeophysical Institute, University of Alaska Fairbanks, USA
Katey WalterInstitute of Northern Engineering / International Arctic Research Center, University of Alaska Fairbanks, USA
Anne MorgensternAlfred Wegener Institute for Polar and Marine Research, Potsdam, Germany
Hugues LantuitAlfred Wegener Institute for Polar and Marine Research, Potsdam, Germany
Sergei ZimovNortheast Science Station, Cherskii, Russia
AbstractThermokarst lake formation in ice-rich yedoma deposits in north Siberia has a major impact on regional landscape morphology, hydrology, and biogeochemistry. Detailed assessment of lake distribution characteristics is critical for understanding spatial and temporal lake dynamics and quantifying their impacts. The distribution of thermokarst ponds and lakes at three different sites with ice-rich permafrost (Bykovsky Peninsula, SW Lena Delta, and Cherskii) in northeast Siberia was analysed using high-resolution remote sensing and geographical information system (GIS) tools. Despite similarities in geocryological characteristics, the distribution of thermokarst lakes differs strongly among the study regions and is heavily influenced by the overall hydrological and geomorphologic situation as a result of past lake-landscape dynamics. By comparing our high-resolution water body dataset with existing lake inventories, we find major discrepancies in lake distribution and total coverage. The use of low-resolution lake inventories for upscaling of thermokarst lake-related environmental processes like methane emissions would result in a strong underestimation of the environmental impacts of thermokarst lakes and ponds in Arctic lowlands.
Keywords: lake distribution; remote sensing; Siberia; thermokarst lakes; yedoma.
IntroductionGlobal lake inventories currently used in Earth system
modeling contain only lakes larger than 10 ha (Lehner & Döll 2004, Downing et al. 2006). Most of these lakes are found in the Northern Hemisphere; that is, in permafrost-influenced or formerly glaciated regions. In permafrost regions with unconsolidated sediments most of the lakes are thermokarst lakes or ponds which formed due to the melting of massive or segregated ground ice and subsequent surface settlement. Thermokarst lakes are a major component of vast arctic and subarctic landscapes in Siberia, Alaska, and Canada. Thermokarst lakes and ponds can laterally expand by thermo-erosion and thaw slumping along shores. Usually a positive relation is established between thaw subsidence, horizontal basin extension, and water body growth, resulting in continued thawing of underlying permafrost and thermo-erosion on its margins. This runaway effect is mostly dependent on ground ice content in the underlying permafrost, and it continues going until thawed-out sediments form an insulating layer preventing further thawing and subsidence. Consequently, ice-rich unconsolidated permafrost deposits like those of the widespread Late Pleistocene Yedoma Suite in northeast Siberia (Schirrmeister et al. 2008) are especially vulnerable to thermokarst development initiated by natural
or anthropogenic environmental change. Regional medium-resolution studies aimed at the
classification and spatial analysis of thermokarst lakes in Arctic regions were mostly based on Landsat satellite imagery, which has proven valuable for water body detection (e.g., Frazier & Page 2000). Such studies were conducted for the North Alaska Coastal Plain (Sellmann et al. 1975, Frohn et al. 2005, Hinkel et al. 2005), the Siberian Lena Delta (Morgenstern et al. 2008), the Lena-Anabar Lowland (Grosse et al. 2006), and the Tuktoyaktuk Peninsula (Côté & Burn 2002). These and other works reveal a very large number of lakes and ponds between 1–10 ha for most permafrost lowland areas. Based on field experience and spatially limited aerial surveys, it is known that there is very likely an even larger number of thermokarst ponds smaller than 1 ha.
The lacking representation of small lakes and thus bias towards large lakes in existing global lake inventories might result in a strong underestimation of the environmental impact of thermokarst lakes, which would seriously hamper the understanding of their role in the Arctic hydrological cycle and global biogeochemical cycles. First qualitative and quantitative studies on the environmental impact of thermokarst lakes over both geological and historical time frames suggest a potentially large role of such lakes in the
552 NiNth iNterNatioNal CoNfereNCe oN Permafrost
arctic carbon cycle by unlocking vast amounts of permafrost-stored organic carbon and thus also for global climate dynamics (Zimov et al. 1997, Walter et al. 2006, Walter et al. 2007). Other studies indicate e.g., the impact of arctic wetland and lake distribution on atmospheric circulation patterns (Gutowski et al. 2007). Many studies also show that small water bodies in permafrost lowlands, e.g., polygonal ponds, are an important component for methane emissions from tundra wetlands (e.g., Wagner et al. 2003, Schneider et al. in review). To quantify the environmental impact of such arctic lakes and ponds it is necessary to have detailed information on their distribution and extent.
Several studies suggest a direct connection between thermokarst lake distribution and underlying permafrost characteristics, as well as between lake dynamics and permafrost dynamics. Widespread lake drainage in the discontinuous permafrost zone is related to a beginning disappearance of permafrost due to current climate warming (Yoshikawa & Hinzman 2003, Smith et al. 2005, Riordan et al. 2006). On the contrary, in the continuous permafrost zone an increase in lake area was observed in Western (Smith et al. 2005) and Eastern Siberia (Walter et al. 2006), but not on the Alaskan North Slope (Riordan et al. 2006, Hinkel et al. 2007). Most of these studies are based on the medium-resolution (30–80 m) Landsat satellite data record spanning about 35 years and some additionally involve historical aerial photography. However, although Landsat data may be sufficient to detect complete drainage and drying of some large lakes or the formation of new large lakes, it has serious limitations in detecting changes in lake extent due to thaw slumping and thermo-erosion. A high-resolution dataset
of recent lake and pond distribution in combination with historical imagery would form an excellent base for studying change in lake extent and link these changes to permafrost or climate dynamics.
In this study a dataset of recent thermokarst lake and pond distribution on ice-rich yedoma deposits is developed based on high-resolution (1–2.5 m) satellite remote sensing data for three sites in Northeast Siberia and then compared with data from the Global Lake and Wetland Database (GLWD: Lehner & Döll 2004).
Study RegionAll three study sites are situated in the continuous
permafrost region of northeast Siberia (Fig. 1). The size of the study areas, a set of basic environmental characteristics, and information about the geocryology are provided in Table 1. The Bykovsky Peninsula (BYK) is situated southeast of the Lena River Delta. The peninsula is surrounded on three sides by large bays and the Laptev Sea. It is an erosional remnant of a Late Pleistocene accumulation plain consisting predominantly of silty to sandy ice-rich permafrost deposits of the yedoma (Grosse et al. 2007). Lakes, predominantly of early Holocene thermokarstic origin, are abundant at BYK (Grosse et al. 2005). They are located either on the yedoma uplands or as lake remnants and polygonal ponds in drained lake basins. These basins were formed by large thermokarst lakes during the early Holocene climate warming. They subsequently shrunk or drained after the middle Holocene due to climate deterioration and coastal erosion, leaving behind lake remnants and drained lake basins, which upon freezing
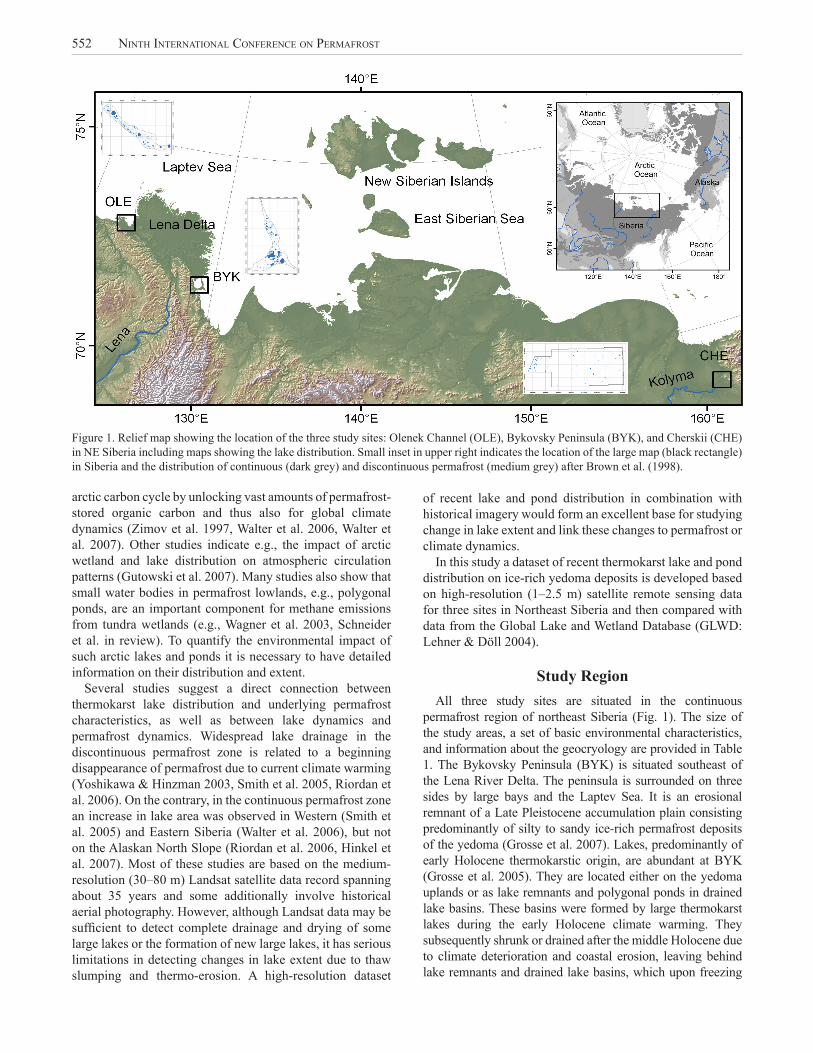
Figure 1. Relief map showing the location of the three study sites: Olenek Channel (OLE), Bykovsky Peninsula (BYK), and Cherskii (CHE) in NE Siberia including maps showing the lake distribution. Small inset in upper right indicates the location of the large map (black rectangle) in Siberia and the distribution of continuous (dark grey) and discontinuous permafrost (medium grey) after Brown et al. (1998).
Grosse et al. 553
could support formation of polygonal ponds (Grosse et al. 2007). The land surface at BYK ranges from 0–45 m a.s.l. The study area around Cherskii (CHE) is part of the Kolyma fluvial lowland and located in the surroundings of the Rodinka hill (351 m a.s.l.). The wide, undulating slopes of this hill are mantled by ice-rich deposits of the yedoma stretching down to the banks and flood plain of the Kolyma River.
The study area in the southwest Lena River Delta along the Olenek channel (OLE) is part of an erosional remnant of Late Pleistocene sediments incorporated into the Holocene river delta architecture. It has the form of a peninsula and is bordered by the Laptev Sea and the wide channels of the delta. The permafrost deposits consist of ice-poor fluvial sands (ca. 0–17 m a.s.l.) overlain by yedoma (Schirrmeister et al. 2003) (Table 1). The topography is dominated by a flat plain with some thermo-erosional valleys and thermokarst basins. Water bodies are abundant in sizes ranging from polygonal ponds to large thermokarst lakes.
Remote Sensing DataSpatially high-resolution recent satellite imagery was
acquired from all three study sites to study thermokarst lake distribution and extent (Table 2). All images are from the snow-free early summer period.
For the BYK and the OLE sites two Spot-5 images were georeferenced to topographic maps of scale 1:100,000, for CHE several Ikonos-2 images were ortho-rectified (Table 2). All imagery used in this study is panchromatic and showed excellent contrasts for land-water separation.
MethodsA simple density slice classification was applied to the
most recent images at each site to distinguish water and land in the panchromatic imagery. A threshold that best separated image pixel values (Digital Numbers, DN) of water from land was chosen. Usually, there is a strong difference in reflectance between water bodies (dark or black, low DN) and bare or vegetated land surfaces (bright, high DN). A visual comparison was conducted to verify the classification. The DN of some lakes was found to be influenced by either very shallow water levels (probably less than 1 m), resulting in higher DN due to reflectance of the lake bottom, or turbid water with high sediment suspension, resulting in higher DN from the sediment load. On some lakes remaining lake ice (highly reflective, very high DN) resulted in misclassification. Additional misclassifications occurred for pixels associated with deep thermo-erosional valleys and steep north-facing cliffs or slopes. In both cases shadows were misclassified as water. These misclassifications were corrected by applying manually generated masks in ArcGIS™ to either exclude pixel (shadows, stream water bodies, man made structures) or to include pixel (lake ice, turbid and shallow water) from the lake dataset. Based on our visual examination and manual correction the resulting datasets can be considered a conservative minimum of standing water bodies in the study areas.
Based on the ground resolution of the available imagery, a minimum of 5 pixels was considered acceptable for successful water body detection. For better comparison between all study areas we therefore only included and analyzed standing water bodies larger than 0.003 ha. Since our classification approach was conservative and aiming at open water surfaces, we assume to have missed especially small ponds overgrown by vegetation in our inventory. At BYK, three thermokarst lagoons were included in the dataset, since they morphologically belong to the peninsula. Eventually, ArcGIS™ was used to analyze the spatial distribution of water bodies in the resulting datasets. The resulting dataset was then compared with the GLWD dataset (Lehner & Doell 2004) for all study areas.
Parameter OLE BYK CHE
Location 72.94°N122.90°E
71.80°N129.30°E
68.75°N161.33°E
Study area (ha) 7982 17 009 28 897Permafrost depth (m) 200–600 500–600 400–500Active layer depth (m) 0.3–0.6 0.3–0.6 0.3–1.5Annual ground temperature (20 m depth) (°C) -9– -11 -9 – -11 -3 – -11
Climate data for closest weather station (Rivas-Martínez 2008):Station name Tiumyati Bukhta
TiksiNizhniye Kresty
Measurement period 1948–60 1984–94 1984–94Annual air temperature (°C) -14.5 -13.2 -11.6Annual precipitation (mm) 206 427 294
Vegetation zone Tundra Tundra Taiga / Tundra
Yedoma thickness (m) ~ 8d < 50b < 40Gravimetric ice content (%) 88c 116c < 80a
Ice wedge width / length (m) 3-5 / 9 6 / 40 3 / 40Organic carbon content (%) 3.0c 4.7c ~2a
a Zimov et al. 1997b Grosse et al. 2007
c Schirrmeister et al. 2003d Schirrmeister et al. 2008
Site Platform Date Ground ResolutionBYK Spot-5 2006-07-09 2.5mOLE Spot-5 2006-07-08 2.5mCHE Ikonos-2 2002-07-09 1.0m
Parameter OLE BYK CHENumber of water bodies N 15,012 13,001 1348Total water body area A (ha) 1059.6 2622.1 242.3Limnicity (%) 13.3 15.4 0.8Largest lake size (ha) 196.19 605.00 16.71Mean water body size (ha) 0.0706 0.2017 0.1797Median water body size (ha) 0.0088 0.0075 0.0115Normalized per 10 000 ha: Number of water bodies N 18,808 7644 466 Total water body area A (ha) 1327.6 1541.6 83.8
Table 1. General environmental characteristics of the study areas. Table 2. Satellite imagery used for mapping lake distribution.
Table 3. Main parameters of lakes and ponds in the study areas.
554 NiNth iNterNatioNal CoNfereNCe oN Permafrost
ResultsDespite similar basic geocryological conditions at all three
sites (ice-rich yedoma deposits), the distribution of thermokarst lakes strongly differs among them. A total number of 29,361 lakes >0.003 ha were classified in the study areas (Table 3). The highest lake cover by land area (limnicity) was found at BYK (15.4%), closely followed by OLE (13.3%). Though CHE is the largest study area, its lake portion is lower than at both other sites by more than one order of magnitude (0.8 %).
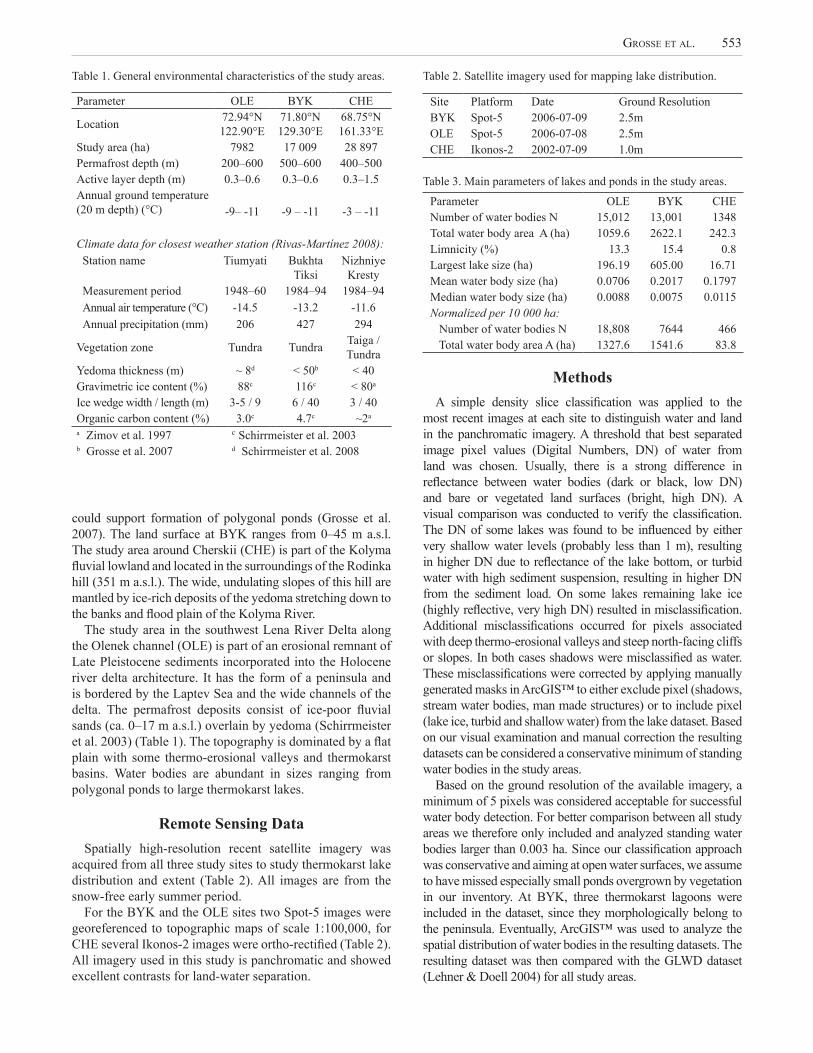
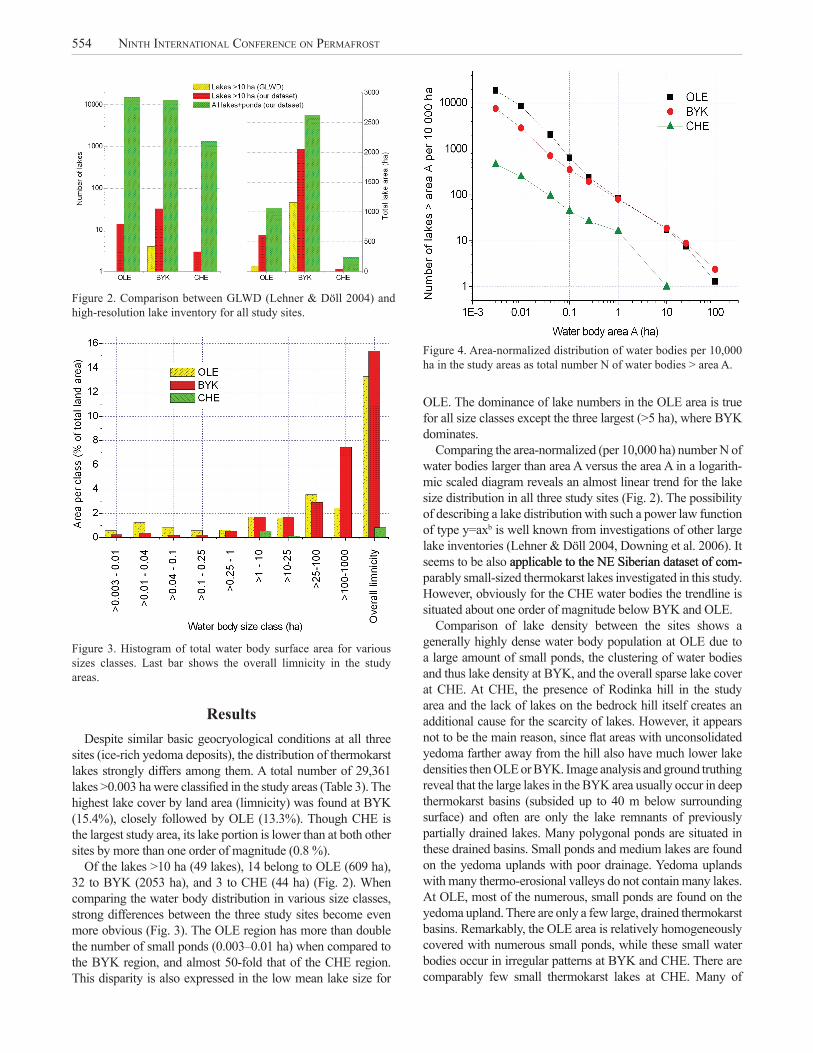
Of the lakes >10 ha (49 lakes), 14 belong to OLE (609 ha), 32 to BYK (2053 ha), and 3 to CHE (44 ha) (Fig. 2). When comparing the water body distribution in various size classes, strong differences between the three study sites become even more obvious (Fig. 3). The OLE region has more than double the number of small ponds (0.003–0.01 ha) when compared to the BYK region, and almost 50-fold that of the CHE region. This disparity is also expressed in the low mean lake size for
OLE. The dominance of lake numbers in the OLE area is true for all size classes except the three largest (>5 ha), where BYK dominates.
Comparing the area-normalized (per 10,000 ha) number N of water bodies larger than area A versus the area A in a logarith-mic scaled diagram reveals an almost linear trend for the lake size distribution in all three study sites (Fig. 2). The possibility of describing a lake distribution with such a power law function of type y=axb is well known from investigations of other large lake inventories (Lehner & Döll 2004, Downing et al. 2006). It seems to be also applicable to the NE Siberian dataset of com- applicable to the NE Siberian dataset of com-parably small-sized thermokarst lakes investigated in this study. However, obviously for the CHE water bodies the trendline is situated about one order of magnitude below BYK and OLE.
Comparison of lake density between the sites shows a generally highly dense water body population at OLE due to a large amount of small ponds, the clustering of water bodies and thus lake density at BYK, and the overall sparse lake cover at CHE. At CHE, the presence of Rodinka hill in the study area and the lack of lakes on the bedrock hill itself creates an additional cause for the scarcity of lakes. However, it appears not to be the main reason, since flat areas with unconsolidated yedoma farther away from the hill also have much lower lake densities then OLE or BYK. Image analysis and ground truthing reveal that the large lakes in the BYK area usually occur in deep thermokarst basins (subsided up to 40 m below surrounding surface) and often are only the lake remnants of previously partially drained lakes. Many polygonal ponds are situated in these drained basins. Small ponds and medium lakes are found on the yedoma uplands with poor drainage. Yedoma uplands with many thermo-erosional valleys do not contain many lakes. At OLE, most of the numerous, small ponds are found on the yedoma upland. There are only a few large, drained thermokarst basins. Remarkably, the OLE area is relatively homogeneously covered with numerous small ponds, while these small water bodies occur in irregular patterns at BYK and CHE. There are comparably few small thermokarst lakes at CHE. Many of
Figure 2. Comparison between GLWD (Lehner & Döll 2004) and high-resolution lake inventory for all study sites.
Figure 3. Histogram of total water body surface area for various sizes classes. Last bar shows the overall limnicity in the study areas.
Figure 4. Area-normalized distribution of water bodies per 10,000 ha in the study areas as total number N of water bodies > area A.
Grosse et al. 555
these were formed due to human activity in the area around the settlement of Cherskii, adding an artificial component to the natural lake distribution. Similar, at BYK human impact resulted in the drainage of several small lakes along vehicle tracks in the tundra. In contrary to CHE, the overall lake population is very high at BYK and therefore the human influence on the lake distribution characteristics is probably negligible here.
A comparison of our detailed water body dataset with the lakes in the GLWD (Lehner & Döll 2004) reveals large discrepancies in number and area of thermokarst lakes larger than 10 ha (mini-mum size GLWD) (Fig. 2). As a result, GLWD limnicity at OLE (1.1%), BYK (6.8%), and CHE (0.0%) is significantly lower than in our dataset for the same lake size category (7.6%, 12.1%, and 0.2% respectively). A large percentage of the total water body area (<10 ha) that is important for hydrological and biogeochemi-cal cycles is currently not inventoried and used in environmental modeling (not inventoried water body area per 10 000 ha land area at OLE: 42.7%, BYK: 21.6%, and CHE: 82.2%).
DiscussionThermokarst lake distribution in our study areas seems to
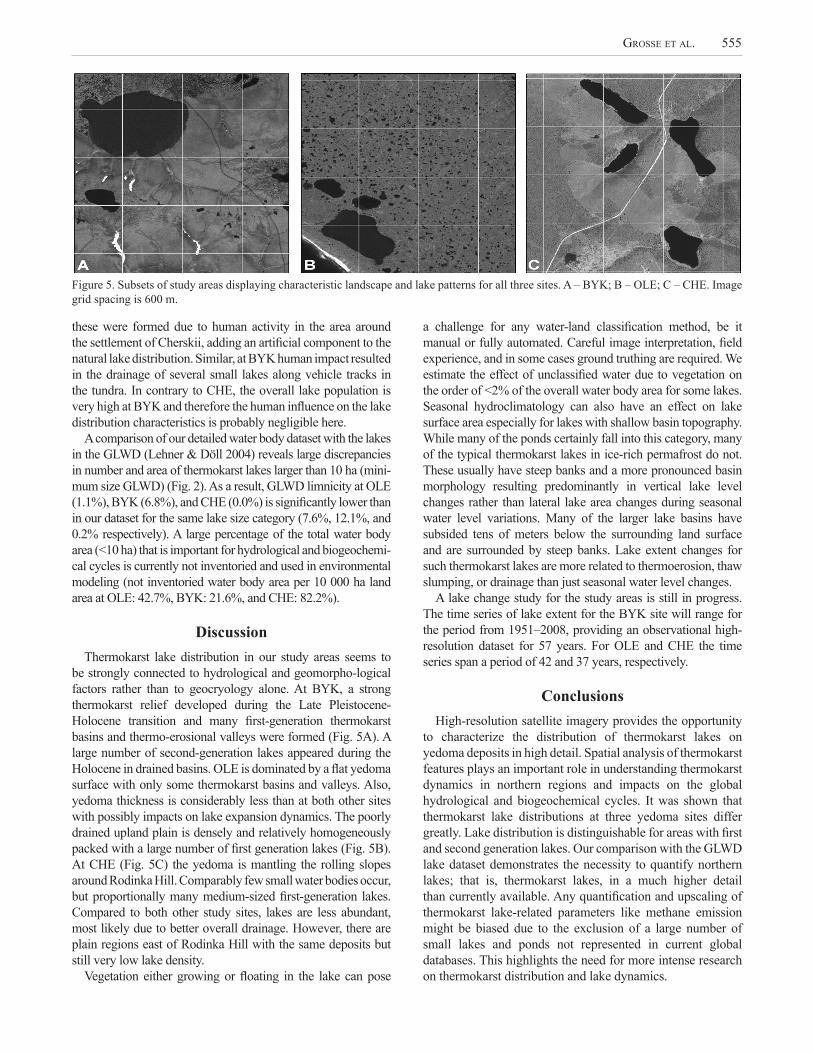
be strongly connected to hydrological and geomorpho-logical factors rather than to geocryology alone. At BYK, a strong thermokarst relief developed during the Late Pleistocene-Holocene transition and many first-generation thermokarst basins and thermo-erosional valleys were formed (Fig. 5A). A large number of second-generation lakes appeared during the Holocene in drained basins. OLE is dominated by a flat yedoma surface with only some thermokarst basins and valleys. Also, yedoma thickness is considerably less than at both other sites with possibly impacts on lake expansion dynamics. The poorly drained upland plain is densely and relatively homogeneously packed with a large number of first generation lakes (Fig. 5B). At CHE (Fig. 5C) the yedoma is mantling the rolling slopes around Rodinka Hill. Comparably few small water bodies occur, but proportionally many medium-sized first-generation lakes. Compared to both other study sites, lakes are less abundant, most likely due to better overall drainage. However, there are plain regions east of Rodinka Hill with the same deposits but still very low lake density.
Vegetation either growing or floating in the lake can pose
a challenge for any water-land classification method, be it manual or fully automated. Careful image interpretation, field experience, and in some cases ground truthing are required. We estimate the effect of unclassified water due to vegetation on the order of <2% of the overall water body area for some lakes. Seasonal hydroclimatology can also have an effect on lake surface area especially for lakes with shallow basin topography. While many of the ponds certainly fall into this category, many of the typical thermokarst lakes in ice-rich permafrost do not. These usually have steep banks and a more pronounced basin morphology resulting predominantly in vertical lake level changes rather than lateral lake area changes during seasonal water level variations. Many of the larger lake basins have subsided tens of meters below the surrounding land surface and are surrounded by steep banks. Lake extent changes for such thermokarst lakes are more related to thermoerosion, thaw slumping, or drainage than just seasonal water level changes.
A lake change study for the study areas is still in progress. The time series of lake extent for the BYK site will range for the period from 1951–2008, providing an observational high-resolution dataset for 57 years. For OLE and CHE the time series span a period of 42 and 37 years, respectively.
ConclusionsHigh-resolution satellite imagery provides the opportunity
to characterize the distribution of thermokarst lakes on yedoma deposits in high detail. Spatial analysis of thermokarst features plays an important role in understanding thermokarst dynamics in northern regions and impacts on the global hydrological and biogeochemical cycles. It was shown that thermokarst lake distributions at three yedoma sites differ greatly. Lake distribution is distinguishable for areas with first and second generation lakes. Our comparison with the GLWD lake dataset demonstrates the necessity to quantify northern lakes; that is, thermokarst lakes, in a much higher detail than currently available. Any quantification and upscaling of thermokarst lake-related parameters like methane emission might be biased due to the exclusion of a large number of small lakes and ponds not represented in current global databases. This highlights the need for more intense research on thermokarst distribution and lake dynamics.
Figure 5. Subsets of study areas displaying characteristic landscape and lake patterns for all three sites. A – BYK; B – OLE; C – CHE. Image grid spacing is 600 m.
556 NiNth iNterNatioNal CoNfereNCe oN Permafrost
AcknowledgmentsGrosse and Walter were partially funded by University of
Alaska IPY fellowships. Spot imagery for OLE and BYK was provided through the OASIS program. Ikonos imagery for CHE was provided through the NSF AON project.
ReferencesBrown, J., Ferrians, O.J., Jr., Heginbottom, J.A. & Melnikov, E.
1998. Circum-Arctic Map of Permafrost and Ground-Ice Conditions. In: M. Parsons & T. Zhang (eds.), International Permafrost Association Standing Committee on Data Infor-mation and Communication (comp.). 2003. Circumpolar Active-Layer Permafrost System, Version 2.0. Boulder, CO: National Snow and Ice Data Center/World Data Center for Glaciology. CD-ROM.
Côté, M.M. & Burn, C.R. 2002. The oriented lakes of Tuktoyak-tuk Peninsula, Western Arctic Coast, Canada: A GIS-based analysis. Permafrost and Periglacial Processes 13: 61–70.
Downing, J.A., Prairie, Y.T, Cole, J.J., Duarte, C.M., Tranvik, L.J., Striegl, R.G., McDowell, W.H., Kortelainen, P., Caraco, N.F., Melack, J.M. & Middelburg, J.J. 2006. The global abun-dance and size distribution of lakes, ponds, and impound-ments. Limnology and Oceanography 51(5): 2388–2397.
Frazier, P.S. & Page, K.J. 2000. Water Body Detection and Delinea-tion with Landsat TM Data. Photogrammetric Engineering & Remote Sensing 66(12): 1461-1467.
Frohn, R.C., Hinkel, K.M. & Eisner, W.R. 2005. Satellite remote sensing classification of thaw lakes and drained thaw lake basins on the North Slope of Alaska. Remote Sensing of En-vironment 97: 116-126.
Grosse, G., Schirrmeister, L., Kunitsky, V.V. & Hubberten, H.-W. 2005. The use of CORONA images in Remote Sensing of periglacial geomorphology: An illustration from the NE Sibe-rian coast. Permafrost & Periglacial Processes 16: 163-172.
Grosse, G., Schirrmeister, L., Malthus, T.J. 2006a. Application of Landsat-7 satellite data and a DEM for the quantification of thermokarst-affected terrain types in the periglacial Lena-Anabar coastal lowland, Polar Research 25(1): 51-67.
Grosse, G., Schirrmeister, L., Siegert, Ch., Kunitsky, V.V., Slagoda, E.A., Andreev, A.A. & Dereviagyn, A.Y. 2007. Geological and geomorphological evolution of a sedimentary periglacial landscape in Northeast Siberia during the Late Quaternary, Geomorphology 86(1-2): 25-51.
Gutowski, W.J., Wei, H., Vörösmarty, C.J. & Fekete, B.M. 2007. Influence of Arctic Wetlands on Arctic Atmospheric Circula-tion. Journal of Climate 20: 4243–4254.
Hinkel, K.M., Frohn, R.C., Nelson, F.E., Eisner, W.R. & Beck, R.A. 2005. Morphometric and Spatial analysis of thaw lakes and drained thaw lake basins in the western arctic coastal plain, Alaska. Permafrost & Periglacial Processes 16: 327-41.
Hinkel, K.M., Jones, B.M., Eisner, W.R., Cuomo, C.J., Beck, R.A. & Frohn, R. 2007. Methods to assess natural and anthropo-Methods to assess natural and anthropo-genic thaw lake drainage on the western arctic coastal plain of northern Alaska. Journal of Geophysical Research 112: F02S16.
Lehner, B. & Döll, P. 2004. Development and validation of a global database of lakes, reservoirs and wetlands. Journal of Hy-drology 296: 1–22.
Morgenstern, A., Grosse, G. & Schirrmeister, L. 2008. Genetical, Morphological, and Statistical Classification of Lakes in the Permafrost-dominated Lena Delta. Proceedings of the Ninth International Conference on Permafrost, Fairbanks, Alaska, June 29–July 3, 2008 (this proceedings).
Riordan, B., Verbyla, D. & McGuire, A.D. 2006. Shrinking ponds in subarctic Alaska based on 1950–2002 remotely sensed im-ages. Journal of Geophysical Research 111: G04002.
Rivas-Martínez, S. 2008. Worldwide Bioclimatic Classifi cation Sys-Worldwide Bioclimatic Classification Sys-tem. Phytosociological Research Center, Spain. Online data-base, http://www.globalbioclimatics.org
Schirrmeister, L., Kunitsky, V.V., Grosse, G., Kuznetsova, T., Meyer, H., Derevyagin, A., Wetterich, S. & Siegert, Ch. 2008. The Yedoma Suite of the northeastern Siberian shelf region – characteristics and concept of formation. Proceedings of the Ninth International Conference on Permafrost, Fairbanks, Alaska, June 29–July 3, 2008 (this proceedings).
Schirrmeister, L., Kunitsky, V.V., Grosse, G., Schwamborn, G., An-dreev, A.A., Meyer, H., Kuznetsova, T., Bobrov, A. & Oezen, D. 2003. Late Quaternary history of the accumulation plain north of the Chekanovsky Ridge (Lena Delta, Russia) - a multidisciplinary approach. Polar Geography 27: 277-319.
Schneider, J., Grosse, G. & Wagner, D. (in review). Land cover classification of tundra environments in the arctic Lena Delta based on Landsat 7 ETM+ data and its application for upscal-ing of methane emissions. Remote Sensing of Environment.
Sellmann, P.V., Brown, J., Lewellen, R.I., McKim, H. & Merry, C. 1975. The Classification and Geomorphic Implications of Thaw Lakes on the Arctic Coastal Plain, Alaska. United States Army, CRREL Research Report 344, 21 pp.
Smith, L.C., Sheng, Y., MacDonald, G.M. & Hinzman, L. D. 2005. Disappearing Arctic Lakes. Science 308: 1429.
Wagner, D., Kobabe, S., Pfeiffer, E.-M. & Hubberten, H.-W. 2003. Microbial controls on methane fluxes from a polygonal tun-dra of the Lena Delta, Siberia. Permafrost and Periglacial Processes 14: 173-185.
Walter, K.M., Edwards, M.E., Grosse, G., Zimov, S.A. & Chapin, F.S., III. 2007. Thermokarst lakes as a source of atmospheric CH4 during the last deglaciation. Science 318: 633-636.
Walter, K.M., Zimov, S.A., Chanton, J.P., Verbyla, D. & Chapin, F.S., III. 2006. Methane bubbling from Siberian thaw lakes as a positive feedback to climate warming. Nature 443: 71-75.
Yoshikawa, K. & Hinzman, L.D. 2003. Shrinking thermokarst ponds and groundwater dynamics in discontinuous permafrost near Council, Alaska. Permafrost & Periglacial Processes 14: 151-160.
Zimov, S.A., Voropaev, Y.V., Semiletov, I.P., Davidov, S.P., Prosian-nikov, S.F., Chapin, F.S., III, Chapin, M.C., Trumbore, S. & Tyler, S. 1997. North Siberian lakes: a methane source fueled by Pleistocene carbon. Science 277: 800-802.


![Factors influencing the distribution and abundance of Daphnia middendorffiana in alpine lakes of the Canadian Rockies [Janet Fischer]](https://img.pdfslide.net/doc/110x75/54038e158d7f72294d8b47a1/factors-influencing-the-distribution-and-abundance-of-daphnia-middendorffiana-in-alpine-lakes-of-the-canadian-rockies-janet-fischer.jpg)