Embed Size (px)
Citation preview

Species Distributions and Climate Change | February 22, 2018
Distributional changes of west coast species and impacts of climate change on species and species
groups
Elliott Hazen1
Ole Shelton2
Eric Ward21NOAA Southwest Fisheries Science Center2NOAA Northwest Fisheries Science Center

Species Distributions and Climate Change | February 22, 2018
Introduction: ContextReview part of Jacox et al. “What do we expect to happen in the California Current under
climate change?
Part 1: Chinook Salmon
Part 2: Groundfish
Part 3: Large Pelagic Species
OUTLINE

Species Distributions and Climate Change | February 22, 2018
CLIMATE PROJECTIONS: SEA SURFACE TEMPERATURE
Temperature Change
(Jacox et al. FEP Webinar 1)

Species Distributions and Climate Change | February 22, 2018
o Changes in upwelling?
o Changes in stratification?
o Changes in nutrient content of source waters?
o Increased hypoxia and ocean acidification?
Jacox et al. (2015)
ANTICIPATED CHANGES IN UPWELLING SYSTEMS
(Jacox et al. FEP Webinar 1)

Species Distributions and Climate Change | February 22, 2018
OCEANOGRAPHY WILL NOT SOLELYDETERMINE DISTRIBUTIONS
California sea lions: ~10,000 (1950s) >150,000 (current)
Harbor seals: <10,000 (1950s) > 50,000 (current)
Humpback whales: +6-7% annually in WA, OR, CA
(Carretta et al. 2015)
DISTRIBUTIONS ARE A FUNCTION OF FINDING PHYSIOLOGICALLY SUITABLE HABITATAND
SURVIVING IN THAT HABITAT.
Predators matter
Need to be better incorporated into distribution and survivorship models

Species Distributions and Climate Change | February 22, 2018
Part 1: Chinook SalmonOle Shelton
Part 2: GroundfishEric Ward
Part 3: Large Pelagic SpeciesElliott Hazen
USE AVAILABLE DATA TO TALK ABOUT OBSERVED SHIFTSIN SPECIES DISTRIBUTIONS OVER RECENT DECADES

Species Distributions and Climate Change | February 22, 2018
Fall Chinook salmon
Ole Shelton1, Will Satterthwaite2, Eric Ward1, Blake Feist1, Brian Burke1
1NOAA Northwest Fisheries Science Center2NOAA Southwest Fisheries Science Center

Species Distributions and Climate Change | February 22, 2018
Salmon are central to riverine and coastal ecosystems
Fisheries
Predators & Competitors Prey
Climate

Species Distributions and Climate Change | February 22, 2018
Where are fall Chinook in the ocean?- by stock, account for confounding factors
How do abundance and distribution change with shifts in climate?
What does this mean for fisheries and ecosystems?

Species Distributions and Climate Change | February 22, 2018
Builds on previous workWeitkamp 2010 Satterthwaite et al. 2014
Pacific Salmon Commission’s Chinook Technical Committee

Species Distributions and Climate Change | February 22, 2018
Coded Wire TagsReleases and Recoveries
Releases between 1977 - 2006 >50 hatcheries,>230 million released fall Chinook~ 900,000 fish recovered
Reliant on Fisheries recoveries
Focus on Summer distribution for:Central Valley, CaliforniaKlamath-Trinity RiverColumbia River

Species Distributions and Climate Change | February 22, 2018
Fishing Effort (commercial troll fishery)

Species Distributions and Climate Change | February 22, 2018
Marine Recoveries(commercial troll CPUE)
Sacramento River (origin=SFB)(Coleman NFH,1980)
Snake River (origin=SNAK)(Lyons Ferry,1984)

Species Distributions and Climate Change | February 22, 2018
Ocean Distribution (summer, avg. ocean)
Alaska
Canada
Washington
Oregon
California
Cape Falcon

Species Distributions and Climate Change | February 22, 2018
Ocean Distribution (summer; avg. ocean)
Alaska
Canada
Washington
Oregon
California

Species Distributions and Climate Change | February 22, 2018
There are strong seasonal patterns
Proportional Distribution (each row sums to 1)

Species Distributions and Climate Change | February 22, 2018
Do distributions change with sea surface temperature?

Species Distributions and Climate Change | February 22, 2018
Sea Surface Temperatures (Shelf, <400m depth, OISST)
AVERAGE19972008
North is not necessarily cooler

Species Distributions and Climate Change | February 22, 2018
What about ocean conditions?Sea Surface Temperature Deviations

Species Distributions and Climate Change | February 22, 2018
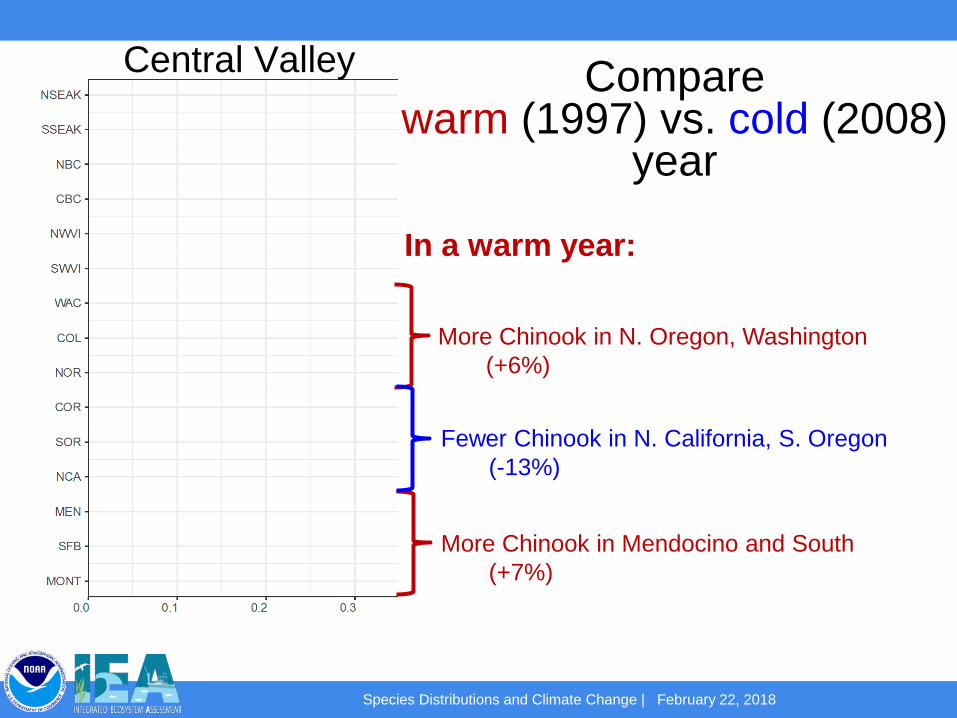
1997 2008Central Valley, California. Fall Chinook salmon
Species Distributions and Climate Change | February 22, 2018
Compare warm (1997) vs. cold (2008)
year
More Chinook in N. Oregon, Washington(+6%)
More Chinook in Mendocino and South(+7%)
Fewer Chinook in N. California, S. Oregon(-13%)
In a warm year:
Central Valley

Species Distributions and Climate Change | February 22, 2018
Compare warm (1997) vs. cold (2008)
year
More Chinook in Canada and Alaska(+3%)
Fewer Chinook in Washington, Oregon(-3%)
In a warm year:Upper Columbia

Species Distributions and Climate Change | February 22, 2018
Each region has a distinct response to SST
In general,Fish shift north in warm years, south in cool years
Multiple exceptions to this generality.
Magnitude of distributional shifts are relatively modest

Species Distributions and Climate Change | February 22, 2018
Next:
Combine information across stocks to project composition and total abundance
Incorporate climatic effects on salmon survival.

Species Distributions and Climate Change | February 22, 2018
Part 1: Chinook SalmonOle Shelton
Part 2: GroundfishEric Ward
Part 3: Large Pelagic SpeciesElliott Hazen
USE AVAILABLE DATA TO TALK ABOUT OBSERVED SHIFTSIN SPECIES DISTRIBUTIONS OVER RECENT DECADES
Species Distributions and Climate Change | February 22, 2018
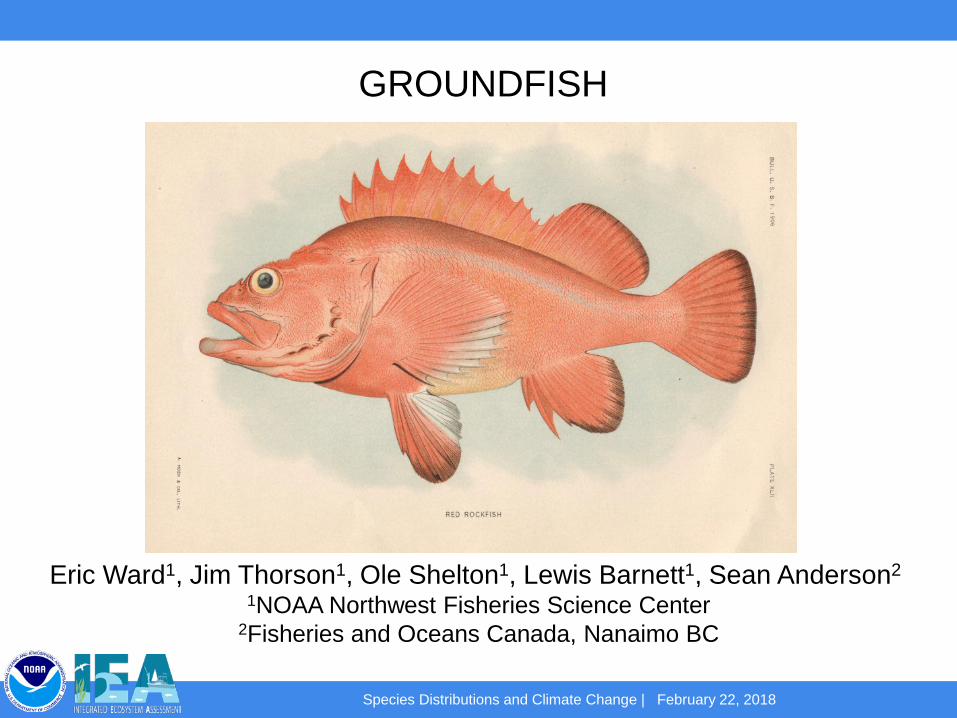
GROUNDFISH
Eric Ward1, Jim Thorson1, Ole Shelton1, Lewis Barnett1, Sean Anderson2
1NOAA Northwest Fisheries Science Center2Fisheries and Oceans Canada, Nanaimo BC
Species Distributions and Climate Change | February 22, 2018
Part 1: Spatially explicit modeling of fish biomass
Part 2: Associations with habitat, multispecies modeling
Part 3: Relationships between climate and forecasting
OUTLINE

Species Distributions and Climate Change | February 22, 2018
STRATA BASED ESTIMATION TO SPATIALLY EXPLICIT MODELS
TIME
EVO
LUTI
ON
2012
Strata-basedmodels
Spatiotemporalmodels
???

Species Distributions and Climate Change | February 22, 2018
STRATA BASED MODELS CAN PERFORM WELL
o DENSITY ASSUMED CONSTANT INEACH STRATUM
o SENSITIVE TO SHIFTS IN EFFORTOR MOVEMENT OF STOCK

Species Distributions and Climate Change | February 22, 2018
BUT QUANTIFYING CHANGE CAN BE DIFFICULT
o EFFORT INCREASESIN NORTH
o CHANGE INUNCERTAINTY

Species Distributions and Climate Change | February 22, 2018
CENTER OF GRAVITY:
COG = sum(lati x weighti)
Would suggest northwardmovement when it reallydidn’t occur

Species Distributions and Climate Change | February 22, 2018
SPATIALLY EXPLICIT MODELS

Species Distributions and Climate Change | February 22, 2018
SPATIAL MODELS YIELD SIMILAR TRENDS, HIGHER PRECISION
Strata modelSpatial model
Papers:Thorson et al. (2015)Shelton et al. (2014)

Species Distributions and Climate Change | February 22, 2018
VERY FLEXIBLE MODELS CAN ALSO BE APPLIED TOOTHER DATA OR QUESTIONS
Extreme spatial events: dissolved oxygen, chlorophyll blooms
New events: species invasions
Mechanisms: species interactions, density dependence

Species Distributions and Climate Change | February 22, 2018
2. IMPROVED UNDERSTANDING OF HABITAT RELATIONSHIPS
Shelton et al. 2014
- Fine scale depth and habitat featuresused as predictors of occurrence, density
- Improved precision of annual estimatesand trend for darkblotched rockfish
- Instead of moving northward, might certain species move deeper instead? Time or temperature: depth interactions

Species Distributions and Climate Change | February 22, 2018
MULTISPECIES MODELING IMPROVES UNDERSTANDINGOF HABITAT RELATIONSHIPS
Can biogenic habitat (corals, sponges) be a proxy for rockfish habitat
6 rockfish, 2 thornyheads, soft corals, sponges
Species Distributions and Climate Change | February 22, 2018
45
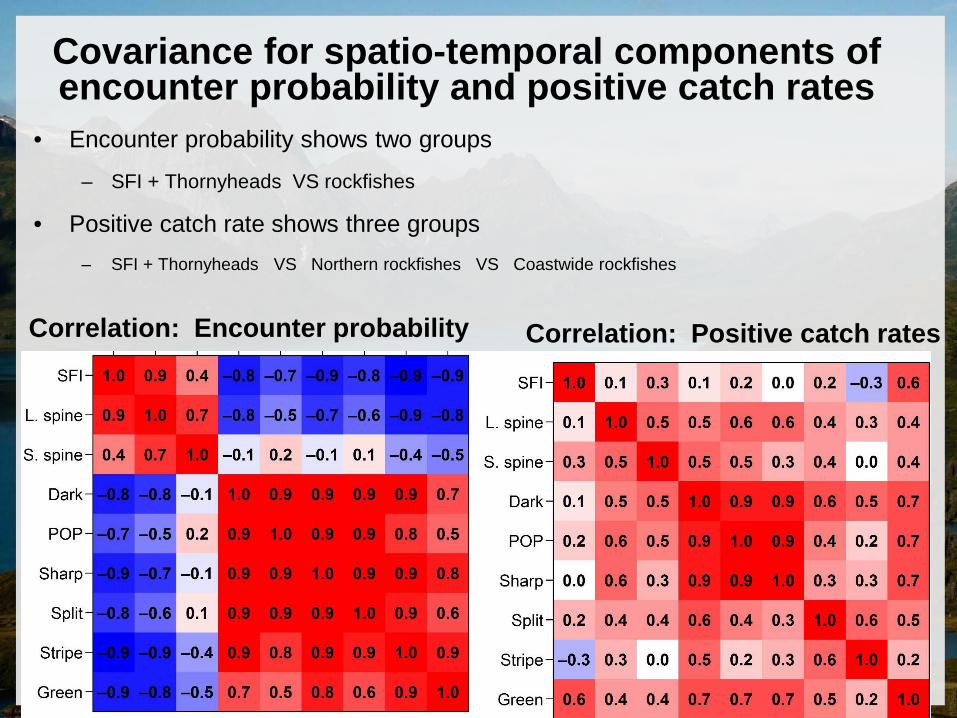
Covariance for spatio-temporal components of encounter probability and positive catch rates
• Encounter probability shows two groups
– SFI + Thornyheads VS rockfishes
• Positive catch rate shows three groups– SFI + Thornyheads VS Northern rockfishes VS Coastwide rockfishes
Correlation: Encounter probability Correlation: Positive catch rates

Species Distributions and Climate Change | February 22, 2018
MULTISPECIES MODELING IMPROVES FINE-SCALE PREDICTION

Species Distributions and Climate Change | February 22, 201847
Multispecies model is useful for…
1. Understanding covariation among species
• Useful information ecologically
2. Essential fish habitat designation
• Improves density predictions
Multispecies model is not useful for…
1. Index standardization for stock assessment
• Adds complexity without improvement in precision
Species Distributions and Climate Change | February 22, 2018
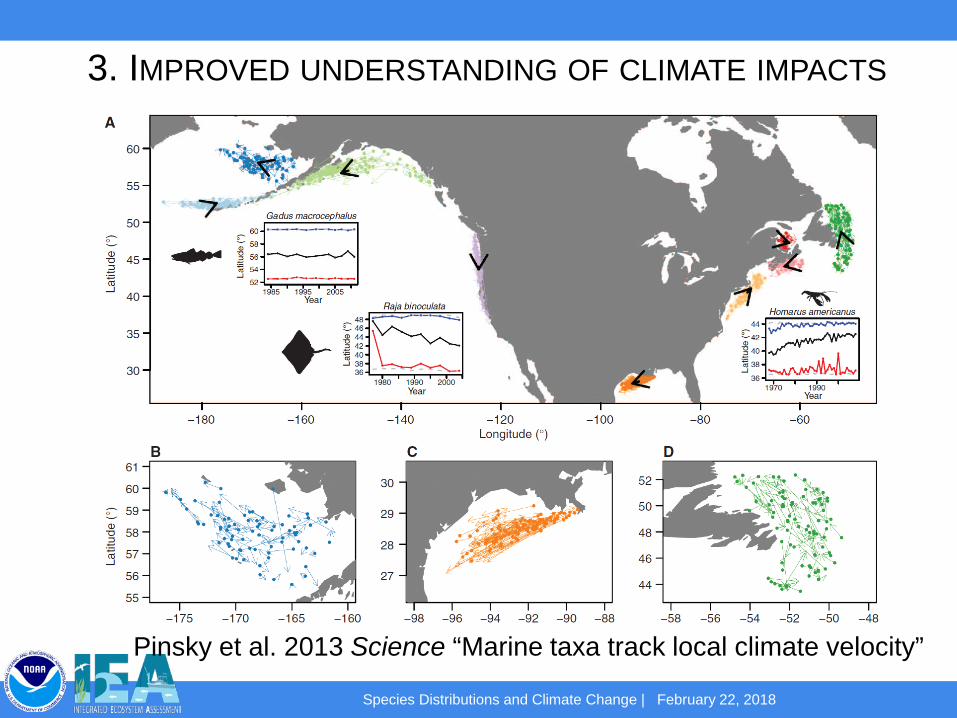
3. IMPROVED UNDERSTANDING OF CLIMATE IMPACTS
Pinsky et al. 2013 Science “Marine taxa track local climate velocity”

Species Distributions and Climate Change | February 22, 2018
BUT VELOCITIES ESTIMATED FROM CENTER OF GRAVITY
1. Applying spatiotemporal models, are there groundfishspecies that suggest a northward shift?
2. Have any species in the California Current increased or decreased their ranges?

Species Distributions and Climate Change | February 22, 2018
• Spatial model estimates northward shift in 7/18
• COG generally estimates more southward shift– Caused by
southward shift in sampling over time
50
Spatial modelCOG

Species Distributions and Climate Change | February 22, 2018
West coast results• Large differences
in trend from 1980-2004 vs. 2003-2013
• Highly variable for semi-pelagic species– Dogfish– Sablefish– Hake
51
Spatial modelCOG

Species Distributions and Climate Change | February 22, 2018
Range contraction• Decrease in area
occupied for several species– Darkblotched– Sharpchin– Greenstriped
• Possibly reduced density in southern region for these spp.
52

Species Distributions and Climate Change | February 22, 2018
Availability of fish to west coast communities
Log(
Bio
mas
s)
Km
Nor
thSelden, Samhouri, et al. in prep

Species Distributions and Climate Change | February 22, 2018
Shifts can mask or exacerbate declines
Selden, Samhouri, et al. in prep

Species Distributions and Climate Change | February 22, 2018
Part 1: Chinook SalmonOle Shelton
Part 2: GroundfishEric Ward
Part 3: Large Pelagic SpeciesElliott Hazen
USE AVAILABLE DATA TO TALK ABOUT OBSERVED SHIFTSIN SPECIES DISTRIBUTIONS OVER RECENT DECADES

Species Distributions and Climate Change | February 22, 2018
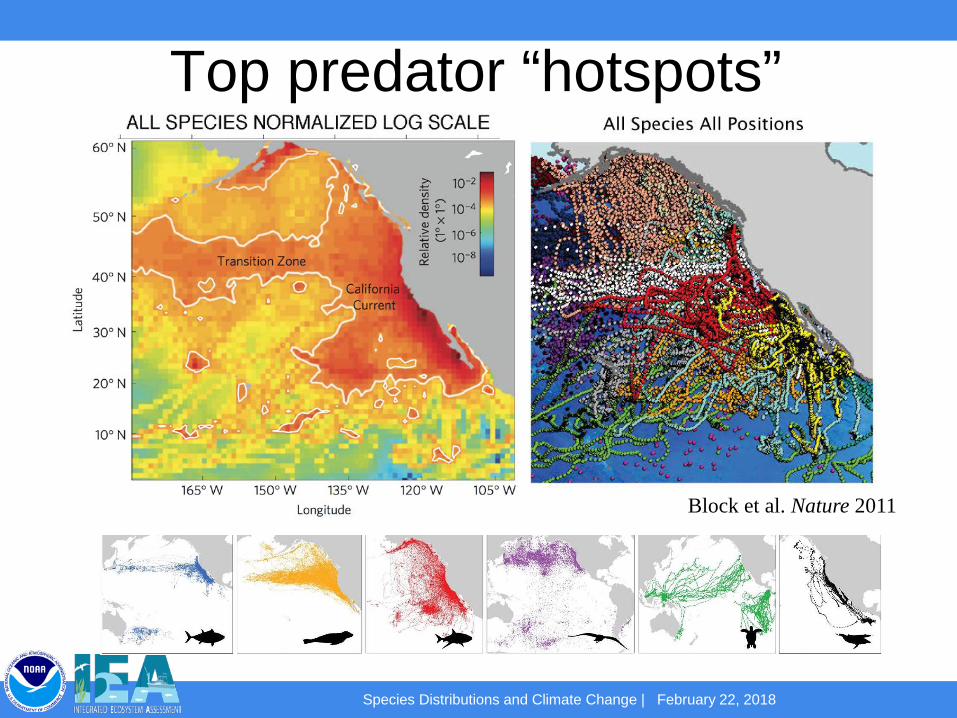
• 23 species; >4,300 tags; >1 Million profiles
Block et al. Nature 2011
Species Distributions and Climate Change | February 22, 2018
Top predator “hotspots”
Block et al. Nature 2011

Species Distributions and Climate Change | February 22, 2018
Top predator “hotspots”
Block et al. Nature 2011
Monterey Bay

Species Distributions and Climate Change | February 22, 2018
• SST structureshabitat
• Chl-a influencesuse
Block et al. Nature 2011
Physical structuring of hotspots

Species Distributions and Climate Change | February 22, 2018
Δ Species Richness: 2001 to 2100Winter Summer
2001-2020 vs 2081-2100Hazen et al. 2013 Nature Climate Change

Species Distributions and Climate Change | February 22, 2018
Δ Core habitat: 2001 to 2100

Species Distributions and Climate Change | February 22, 2018
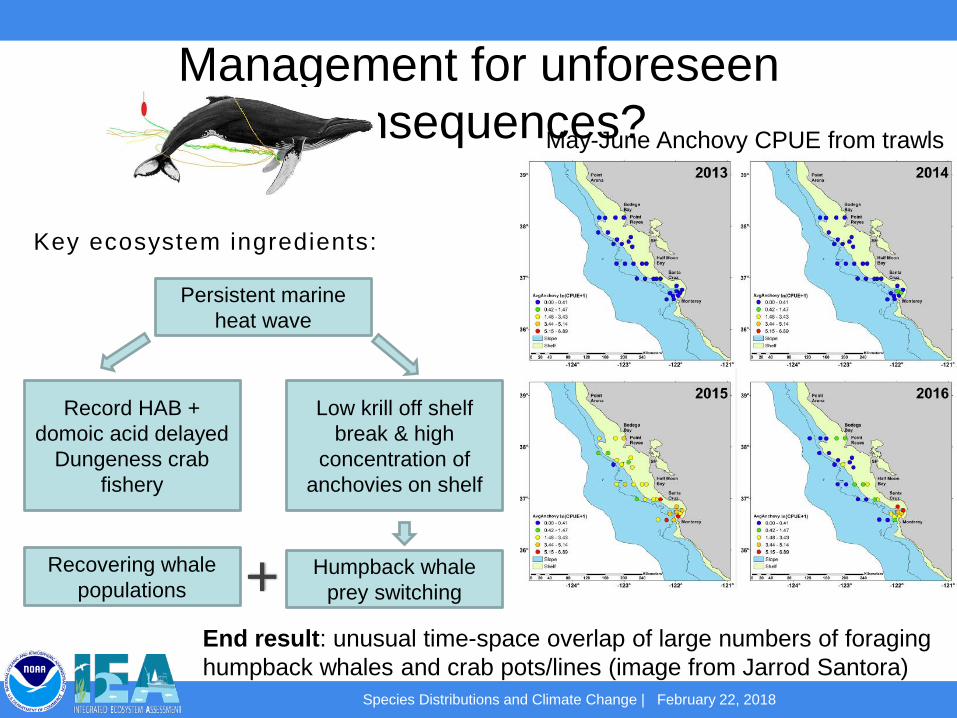
Management for unforeseen consequences?
Species Distributions and Climate Change | February 22, 2018
Management for unforeseen consequences?
Key ecosystem ingredients:
End result: unusual time-space overlap of large numbers of foraging humpback whales and crab pots/lines (image from Jarrod Santora)
May-June Anchovy CPUE from trawls
Persistent marine heat wave
Record HAB + domoic acid delayed
Dungeness crab fishery
Low krill off shelf break & high
concentration of anchovies on shelf
Humpback whale prey switching
Recovering whale populations +

Species Distributions and Climate Change | February 22, 2018
Management for unforeseen consequences?
Northward shift to less-stringent management areas

Species Distributions and Climate Change | February 22, 2018
Management for unforeseen consequences?
• Daily predictions with weightings set by management concern
http://oceanview.pfeg.noaa.gov/ecocast/