Embed Size (px)
Citation preview

Draft 2 NOT FOR CIRCULATION/ CITATION
Distributional Impact of Privatization: The Sri Lankan Experience
Malathy Knight-John
in collaboration with
P.P.A. Wasantha*
December 2002
* Research Fellow and Research Assistant, Institute of Policy Studies, Colombo, Sri Lanka. The views expressed in this paper are those of the authors and do not necessarily represent those of the Institute of Policy Studies. We are grateful to Dr. Saman Kelegama and our other colleagues at the Institute of Policy Studies for their valuable comments on previous drafts of this paper.
Abstract The literature on privatization suggests that its impacts on firm level efficiency have
generally been positive. However, privatization has not been a very popular reform in the
face of unfavorable real and perceived distributional effects. This study describes and
analyzes Sri Lanka’s privatization experience within a comprehensive conceptual
framework designed to capture the distributional impacts of the process. The study looks
at specific variables such as macroeconomic concerns, ownership issues, employment,
prices and access, and political economy factors and concludes that the welfare effects of
the privatization process have been less than satisfactory, that the relatively poor have
had little or no gain from the reform process, and that the government’s commitment to
distributional ends appears to be questionable with fiscal objectives being prioritized over
an equitable allocation of assets.
1
1. Introduction Ideologically, privatization in Sri Lanka is closely allied with the economic liberalization
process that was set in motion in 1977. It was only a decade later in 1987, however, that
privatization was announced as a state policy and it was only after 1989 that the sale of
public enterprises gathered momentum. As documented in Knight-John (1995), this slow
start to privatization is largely attributed to the continued use of state-owned enterprises
(SOEs) as vehicles of employment and political patronage owing to the high rate of
unemployment and the entrenched perception of a welfare state.
In addition, the period from 1977 to 1989 was characterized by macroeconomic
instability and political violence and was not conducive to any rigorous reform efforts. In
what is known as the First Wave of privatization, from 1989 to 1994, the government
divested1 43 commercial enterprises that could be typified as relatively less complex –
“the easy picks” – raising about Rs.11.6 billion. The corresponding figure in the Second
Wave of privatization, from 1995 to date, which has seen the divestiture and restructuring
of several public utilities and major ventures in the services sector, is around Rs. 46.2
billion.
More recently, the need for structural reforms, including privatization, has been
accentuated by the dismal performance of the Sri Lankan economy, stemming from a
series of adverse external shocks, domestic political uncertainties and entrenched
structural rigidities. In 2001, the economy recorded a negative real growth rate of 1.4
percent - the first economic contraction since Independence in 1948 - and the public
debt: GDP ratio reached 103.6 percent.2 While a Stand-By Arrangement (SBA) with the
IMF signed in April 2001 promises to ease some of the burden in terms of external
reserve losses, it is only strong policy commitment and intensive structural reforms that
can provide long-term economic relief. 3
1 The term divestiture, in the context of this paper, refers to both a partial and total sale of state assets to private parties. The one exception is the Public Enterprise Reform Commission (PERC) classification of the issue of six licenses to import and market finished lubricants in the lubricant industry, as divestiture. 2 Central Bank of Sri Lanka (2001a). 3 The government under the SBA in fact agreed to the deepening of the privatization process.
2
In the current context, where the Sri Lankan economy can conceivably be described as
being in crisis, the distributional impact of privatization requires policy prioritization. As
emphasized in the World Development Report 2002, the burden of macroeconomic crises
falls disproportionately on the poor. In an environment of slow or negative growth, high
inflation and high unemployment, issues such as who reaps the benefits of privatization
and how the government uses the proceeds from privatization become increasingly
pertinent. These distributional questions are especially important in light of the fact that
most of the remaining transactions and those completed during the Second Wave are in
the services and plantations4 sectors, where price, access and labor issues are particularly
significant. Moreover, given the ongoing political conflict, paying insufficient attention
to equity considerations is bound to have severe adverse economic, social and political
impacts on the country. 5
This paper documents and analyzes the privatization program in Sri Lanka from 1989 to
2002 from a distributional perspective. It aims to determine who gained and who lost
from the program, to look at the government’s role in devising the form of privatization
and in mitigating any adverse distributional effects, and to get a flavor of the political
economy forces that structure, condition and ultimately shape the outcome of the
privatization process.
The paper is structured according to the conceptual framework outlined in Birdsall and
Nellis (2002). The next section lays out the methodology and limitations of the study.
Section three provides a brief background on the socio-economic profile and income
distribution status of Sri Lanka, the evolution and current status of the privatization
program and the institutional, legal and regulatory framework associated with it. This
section also contains a sketch of some of the most pertinent literature on privatization in
Sri Lanka. In section four we analyze the impact of privatization on specific variables: 4 Sri Lanka’s plantation sector has a large resident labor population. 5 Even if privatization is not the cause of the economic and social problems that the deprived face, perceptions matter; and, if privatization is perceived to cause or exacerbate inequitable income distribution, there could be political opposition to the privatization process irrespective of its actual costs or benefits to society.
3
macroeconomic concerns, ownership issues, employment, prices and access, and political
economy factors. Section five concludes.
2. Methodology and Limitations The research for this study was conducted mainly by way of interviews with key
stakeholders from the eight selected companies and with policy makers from agencies
such as the Ministry of Finance, the Public Enterprise Reform Commission (PERC), and
the Colombo Stock Exchange (CSE). Annex 1 lists the target companies and the
interviewees, Annex 2 provides a brief description of each of the companies and Annex 3
contains the questionnaire used for the study.
Secondary data from sources such as the Central Bank, the World Bank and the CSE and
from academic publications by local experts on privatization were also used to
complement the interview data. The set of companies selected for the study does not
represent a random sample; the choice of companies was governed both by data
availability and by the need to ensure a suitable mix between entities in the
manufacturing, services/utilities and plantation sectors, and from the First and Second
Waves of privatization.
The paucity of data and the patchiness of the existing data present the biggest obstacle to
a rigorous analysis of the distributional impact of privatization in the country. A notable
feature, with likely adverse consequences on public policy, is the general unwillingness
on the part of those players involved in privatization transactions to divulge information
on the process. As a result of the absence of sufficient data, much of the study is based on
anecdotal information.
Moreover, some of the very vital bits such as, for example, the link between utility
privatization and the poor could not be fully evaluated owing to the lack of data sets on
relevant household level observations. The latest available household survey is based on
1996/97 year data and the two utilities selected for our study, Colombo Gas Company
4
and Sri Lanka Telecom, were privatized in 1995 and 1997, respectively. As such, only
household level data relating to the gas sector could be used in this study.
3. A Brief Background
Socio-economic profile 6 Sri Lanka is a lower-middle-income country with a per capita GDP of US$ 837 as of
2001. GDP growth since Independence has averaged 4 to 5 percent, with the North-East
conflict, since 1983, depressing growth by an estimated 2 percent per annum. 7
Calculations done by Arunatilake et al (2001) estimate the economic cost of the war from
1983 to 1996 to be approximately 168 percent of the 1996 GDP – the equivalent of US$
20.6 billion.
The mid-year population in 2001 was approximately 18.7 million persons and the
population growth rate is around 1.4 percent. Around 80 percent of the population resides
in the hinterland. In 2001, the labor force participation rate was 48.3 percent and the
unemployment rate was 7.8 percent. Approximately 32-35 percent of the labor force is
employed in the agriculture sector. A particularly disturbing phenomenon given the social
upheavals in the country is that the majority of the unemployed are youth; the
unemployment rate in the 14-18 age group is around 36 percent while the corresponding
rate in the 19-25 age group is around 30 percent. The unemployment rate among
educated youth is 24 percent.
Sri Lanka has a relatively advanced social development status when compared to other
countries at a similar level of development. Life expectancy is 73 years, the infant
mortality rate is 15 per thousand, the maternal mortality rate is 23 per hundred thousand
and the adult literacy rate is 93 percent. In spite of the relatively high level of social
development however, approximately 22 percent of the population lives below the
poverty line. 6 The information in this section draws largely from Central Bank of Sri Lanka (2001a) and from the Draft Poverty Reduction Strategy, April 2002. 7 Per capita GDP growth averaged around 5 percent per annum during the 1990s.
5
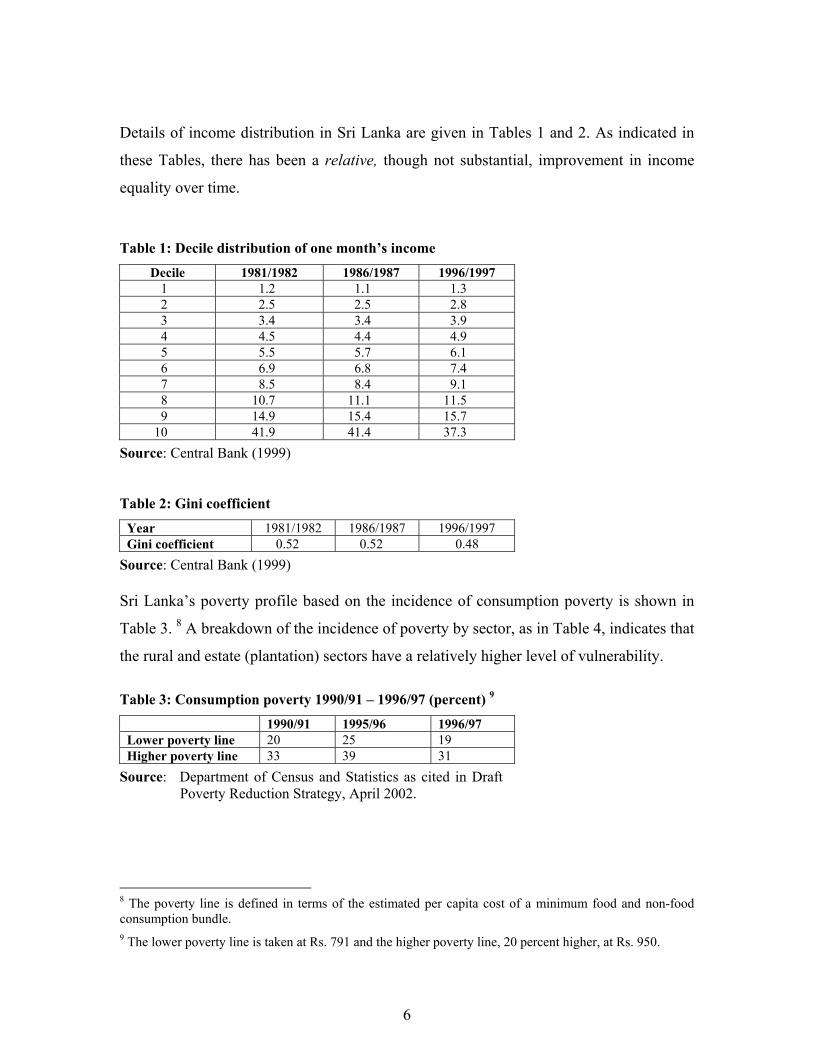
Details of income distribution in Sri Lanka are given in Tables 1 and 2. As indicated in
these Tables, there has been a relative, though not substantial, improvement in income
equality over time.
Table 1: Decile distribution of one month’s income
Decile 1981/1982 1986/1987 1996/1997 1 1.2 1.1 1.3 2 2.5 2.5 2.8 3 3.4 3.4 3.9 4 4.5 4.4 4.9 5 5.5 5.7 6.1 6 6.9 6.8 7.4 7 8.5 8.4 9.1 8 10.7 11.1 11.5 9 14.9 15.4 15.7
10 41.9 41.4 37.3 Source: Central Bank (1999) Table 2: Gini coefficient
Year 1981/1982 1986/1987 1996/1997 Gini coefficient 0.52 0.52 0.48
Source: Central Bank (1999) Sri Lanka’s poverty profile based on the incidence of consumption poverty is shown in
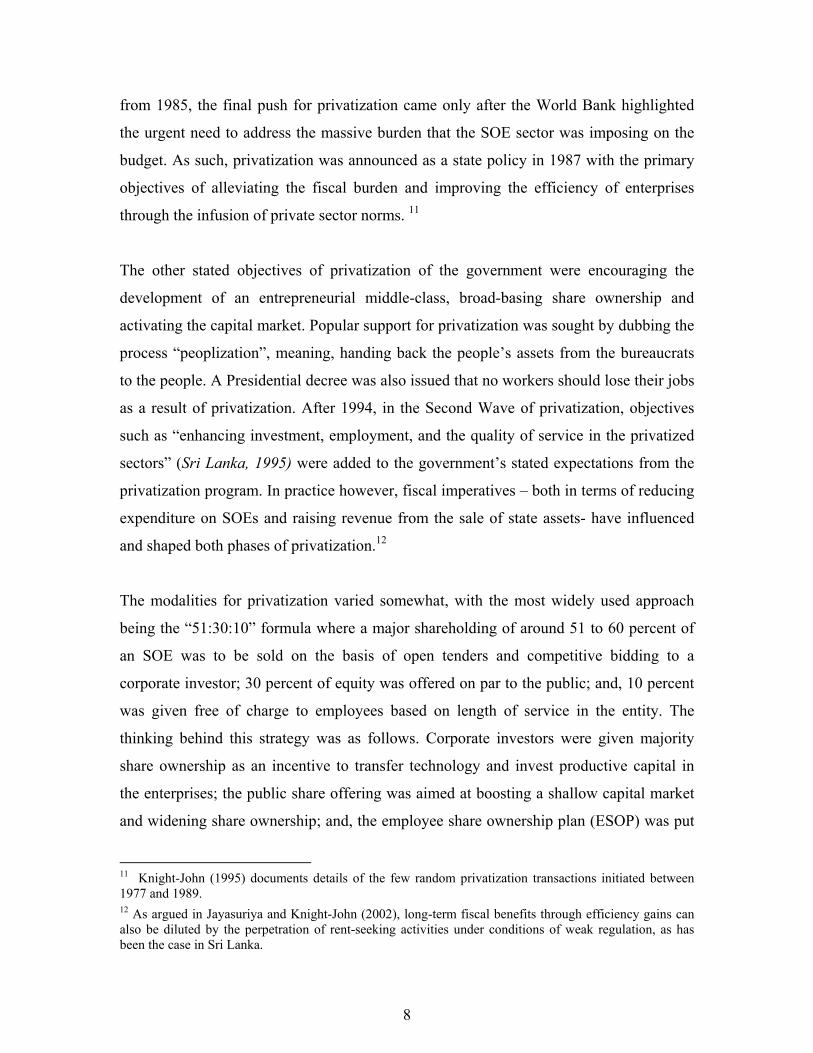
Table 3. 8 A breakdown of the incidence of poverty by sector, as in Table 4, indicates that
the rural and estate (plantation) sectors have a relatively higher level of vulnerability.
Table 3: Consumption poverty 1990/91 – 1996/97 (percent) 9
1990/91 1995/96 1996/97 Lower poverty line 20 25 19 Higher poverty line 33 39 31
Source: Department of Census and Statistics as cited in Draft Poverty Reduction Strategy, April 2002.
8 The poverty line is defined in terms of the estimated per capita cost of a minimum food and non-food consumption bundle. 9 The lower poverty line is taken at Rs. 791 and the higher poverty line, 20 percent higher, at Rs. 950.
6
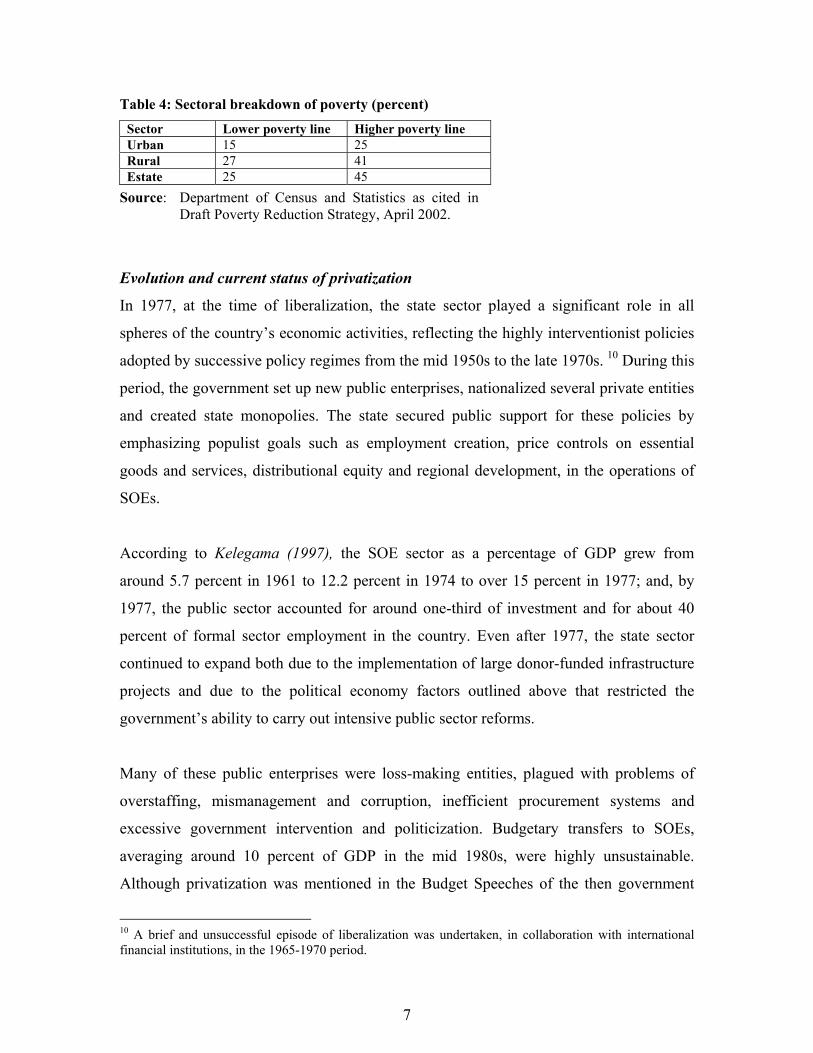
Table 4: Sectoral breakdown of poverty (percent)
Sector Lower poverty line Higher poverty line Urban 15 25 Rural 27 41 Estate 25 45
Source: Department of Census and Statistics as cited in Draft Poverty Reduction Strategy, April 2002.
Evolution and current status of privatization
In 1977, at the time of liberalization, the state sector played a significant role in all
spheres of the country’s economic activities, reflecting the highly interventionist policies
adopted by successive policy regimes from the mid 1950s to the late 1970s. 10 During this
period, the government set up new public enterprises, nationalized several private entities
and created state monopolies. The state secured public support for these policies by
emphasizing populist goals such as employment creation, price controls on essential
goods and services, distributional equity and regional development, in the operations of
SOEs.
According to Kelegama (1997), the SOE sector as a percentage of GDP grew from
around 5.7 percent in 1961 to 12.2 percent in 1974 to over 15 percent in 1977; and, by
1977, the public sector accounted for around one-third of investment and for about 40
percent of formal sector employment in the country. Even after 1977, the state sector
continued to expand both due to the implementation of large donor-funded infrastructure
projects and due to the political economy factors outlined above that restricted the
government’s ability to carry out intensive public sector reforms.
Many of these public enterprises were loss-making entities, plagued with problems of
overstaffing, mismanagement and corruption, inefficient procurement systems and
excessive government intervention and politicization. Budgetary transfers to SOEs,
averaging around 10 percent of GDP in the mid 1980s, were highly unsustainable.
Although privatization was mentioned in the Budget Speeches of the then government
10 A brief and unsuccessful episode of liberalization was undertaken, in collaboration with international financial institutions, in the 1965-1970 period.
7
from 1985, the final push for privatization came only after the World Bank highlighted
the urgent need to address the massive burden that the SOE sector was imposing on the
budget. As such, privatization was announced as a state policy in 1987 with the primary
objectives of alleviating the fiscal burden and improving the efficiency of enterprises
through the infusion of private sector norms. 11
The other stated objectives of privatization of the government were encouraging the
development of an entrepreneurial middle-class, broad-basing share ownership and
activating the capital market. Popular support for privatization was sought by dubbing the
process “peoplization”, meaning, handing back the people’s assets from the bureaucrats
to the people. A Presidential decree was also issued that no workers should lose their jobs
as a result of privatization. After 1994, in the Second Wave of privatization, objectives
such as “enhancing investment, employment, and the quality of service in the privatized
sectors” (Sri Lanka, 1995) were added to the government’s stated expectations from the
privatization program. In practice however, fiscal imperatives – both in terms of reducing
expenditure on SOEs and raising revenue from the sale of state assets- have influenced
and shaped both phases of privatization.12
The modalities for privatization varied somewhat, with the most widely used approach
being the “51:30:10” formula where a major shareholding of around 51 to 60 percent of
an SOE was to be sold on the basis of open tenders and competitive bidding to a
corporate investor; 30 percent of equity was offered on par to the public; and, 10 percent
was given free of charge to employees based on length of service in the entity. The
thinking behind this strategy was as follows. Corporate investors were given majority
share ownership as an incentive to transfer technology and invest productive capital in
the enterprises; the public share offering was aimed at boosting a shallow capital market
and widening share ownership; and, the employee share ownership plan (ESOP) was put
11 Knight-John (1995) documents details of the few random privatization transactions initiated between 1977 and 1989. 12 As argued in Jayasuriya and Knight-John (2002), long-term fiscal benefits through efficiency gains can also be diluted by the perpetration of rent-seeking activities under conditions of weak regulation, as has been the case in Sri Lanka.
8
in place to win the support of the trade unions, a group traditionally opposed to
privatization.
There were some deviations around this standard formula in the case of particular
enterprises. Examples of such variations include employee buy-outs (Buhari Hotel),
gifting of 50 percent of shares to workers in the bus transport sector, sale of assets of
public corporations with the state assuming the liabilities (Ceylon Plywood Corporation),
negotiated sale of shares (Thulhiriya Textile Mills to a South Korean company, Kabool)
and management contracts (plantation sector).
The short-term, five-year, management contracts in the plantation sector and the
principal-agent dynamics of this procedure were a disincentive to longer-term capital
investment in this industry. As such, in 1995 steps were taken to divest 51 percent of the
shares of profit-making plantation companies, with the initial offer for purchase being
made to the management company; 51 percent of the loss-making companies were later
sold on an all-or-nothing basis on the Colombo Stock Exchange. More recently, in
November this year, a 39 percent stake of six bus companies were sold on an all-or-
nothing basis on the CSE, with seven other companies in the pipeline for sale. A golden
share that carries special powers such as the approval of the golden shareholder for
activities such as procurement, leases, mortgages, investments in associated companies
etc. was also allotted to the Secretary of the Ministry of Finance.
In the First Wave of privatization, the choice of assets to be sold was based on four
principles: that the SOE had the potential to be turned around with an infusion of private
sector capital and technology, that the stock market had the capacity to absorb the
privatized enterprise, that the enterprise was not involved in an essential economic
activity and that it provided little revenue to, or required substantial transfers from, the
government. According to Crowe and de Soysa (1995), however, in reality, the SOEs that
were chosen for divestiture at that time actually received very few public transfers. In the
Second Wave, the privatization program has graduated to a stage where it has been able
9
to undertake reforms in sectors involved in core economic activities such as utilities and
plantations.
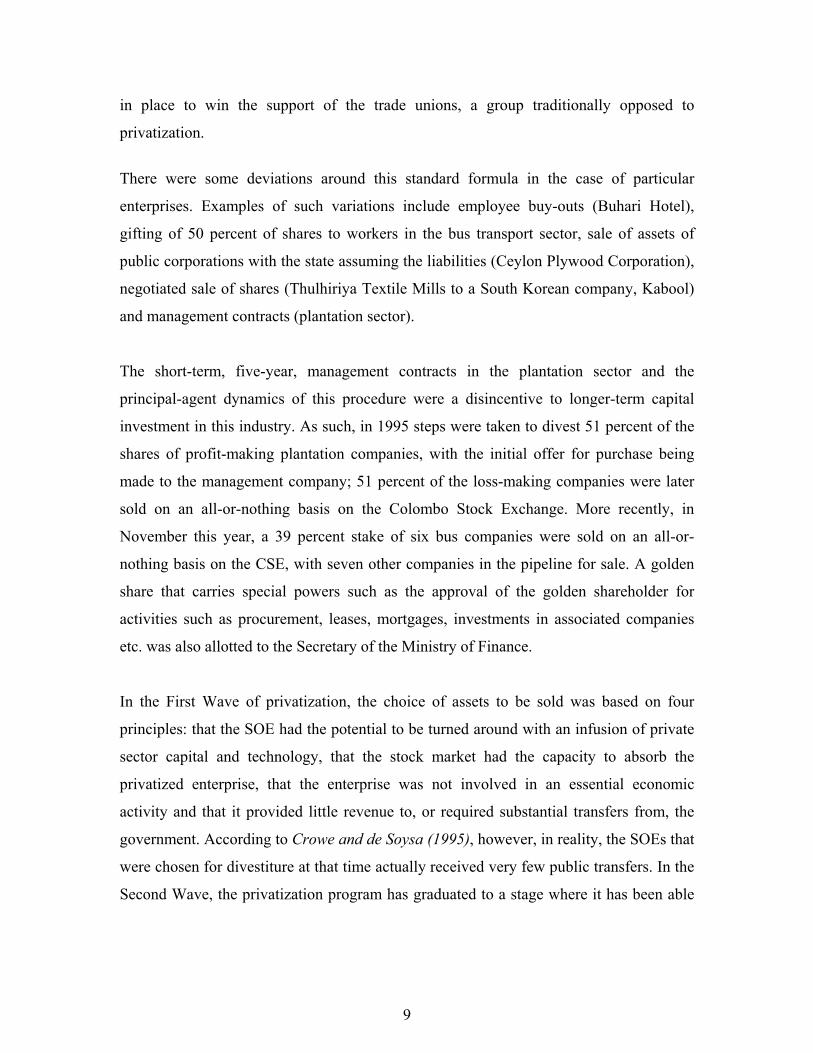
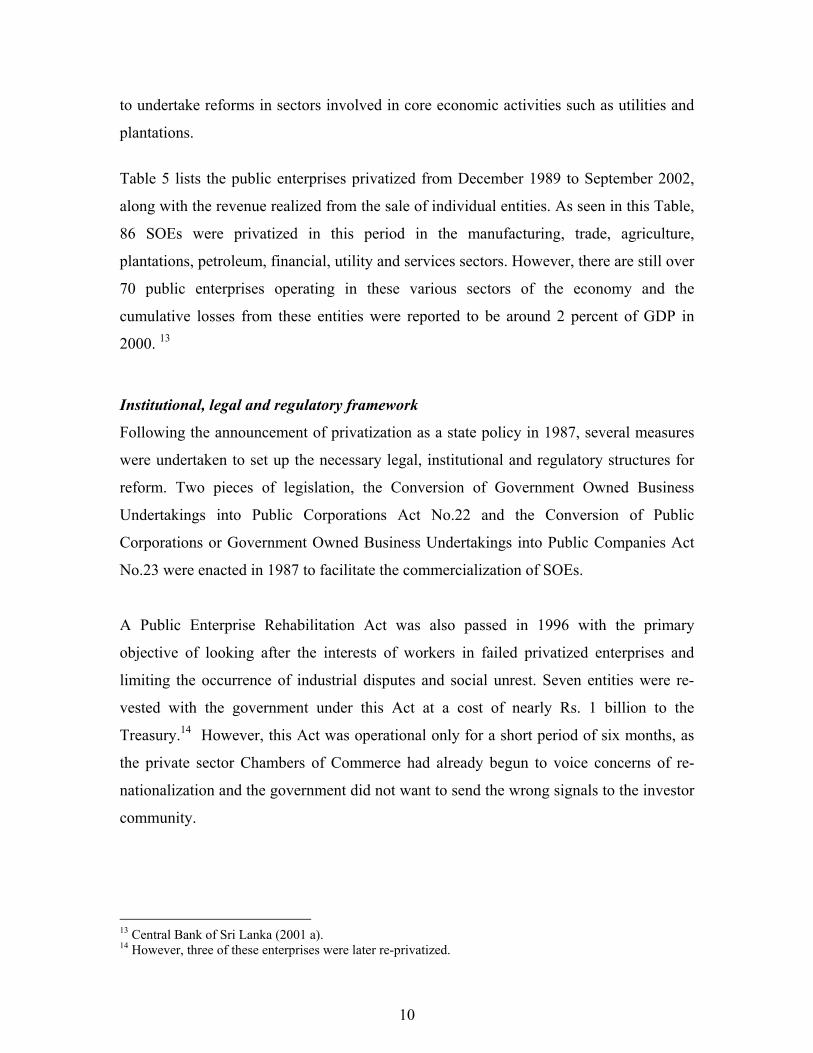
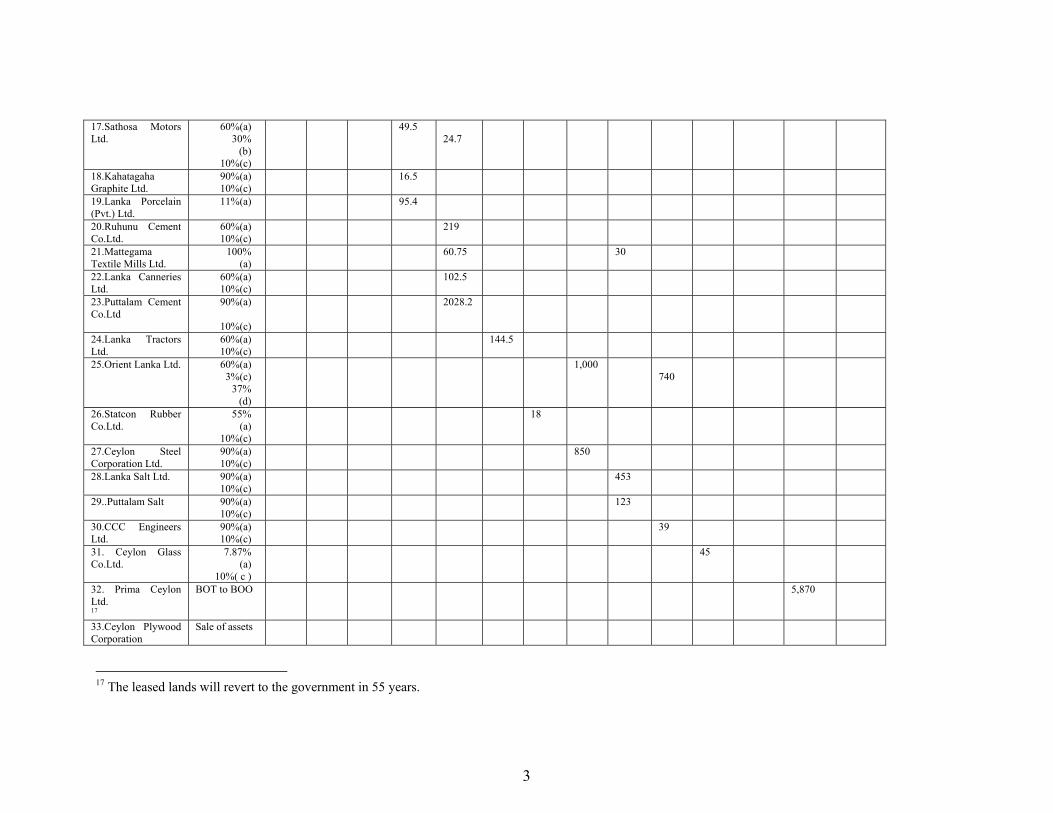
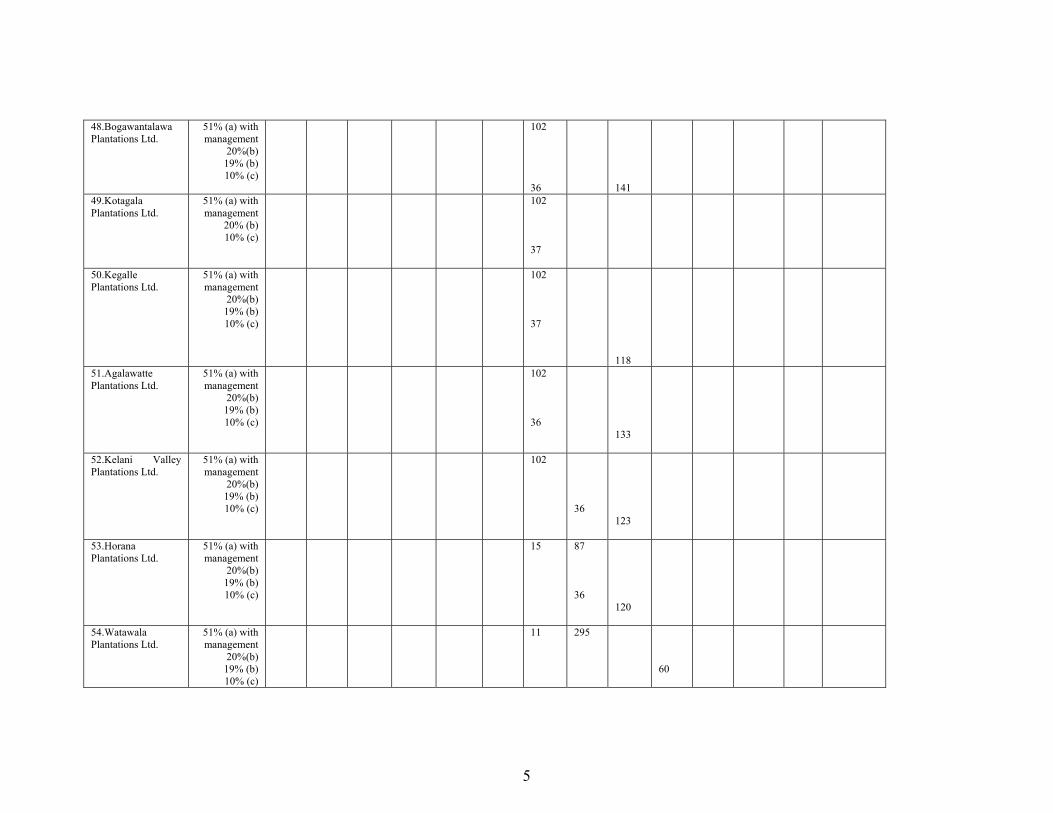
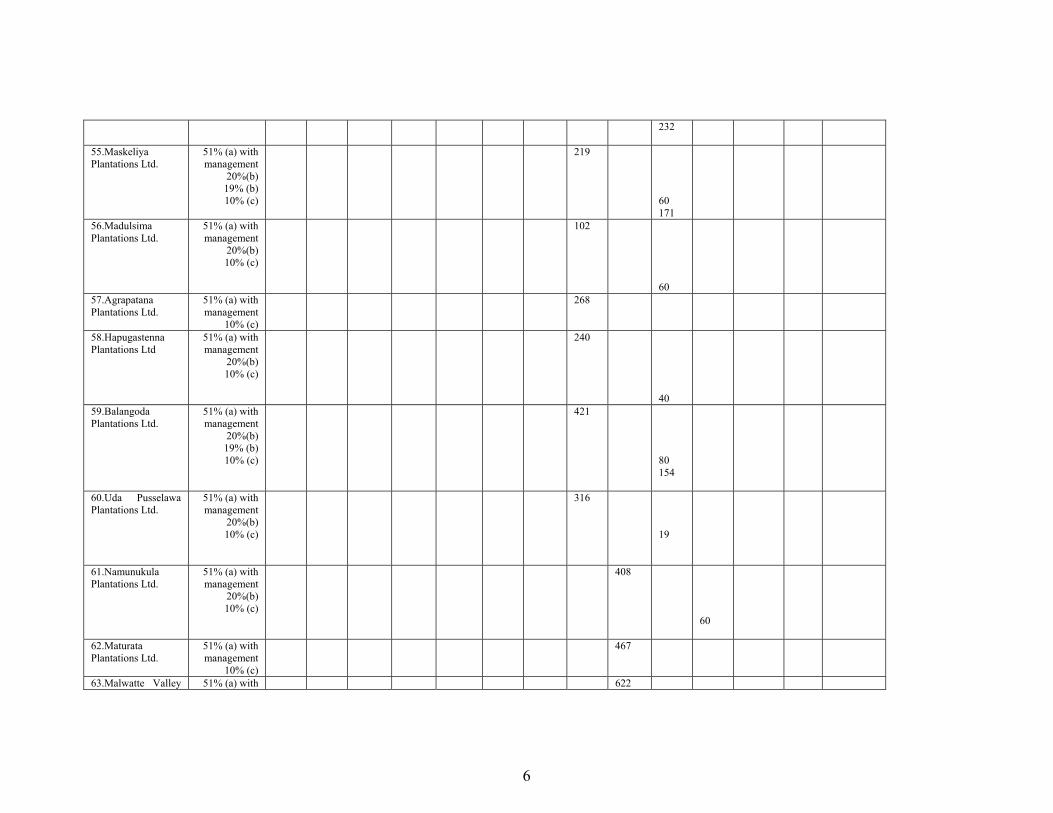
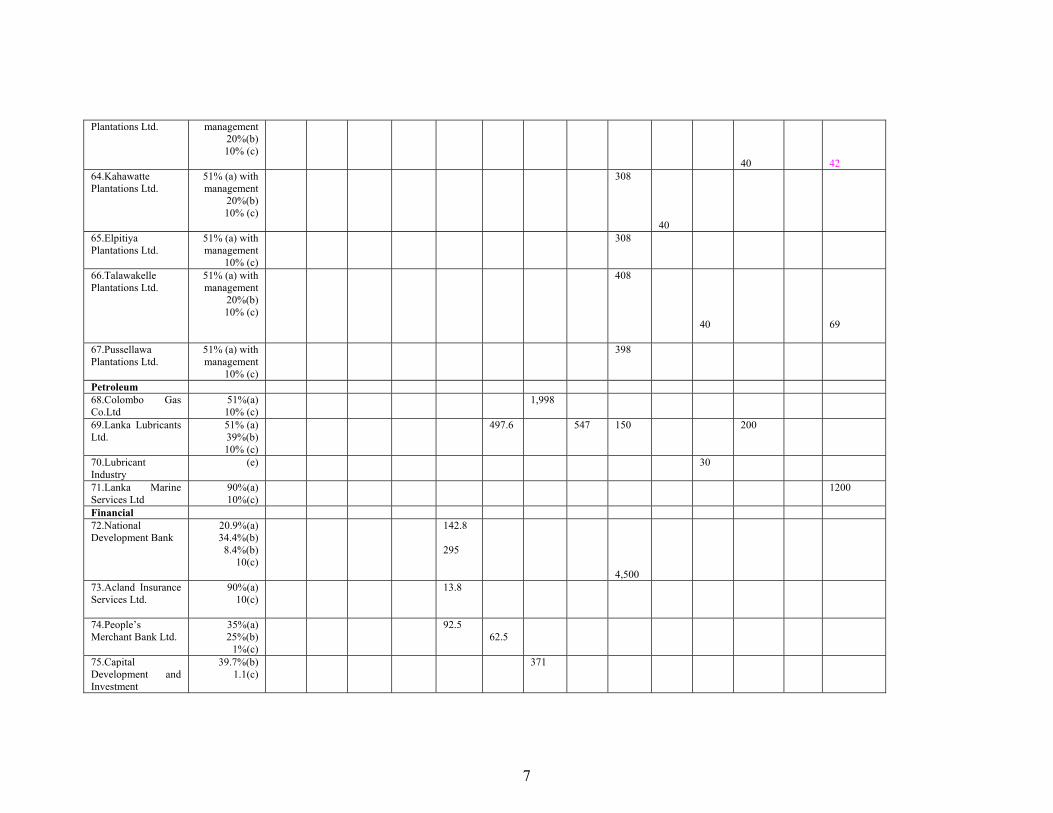
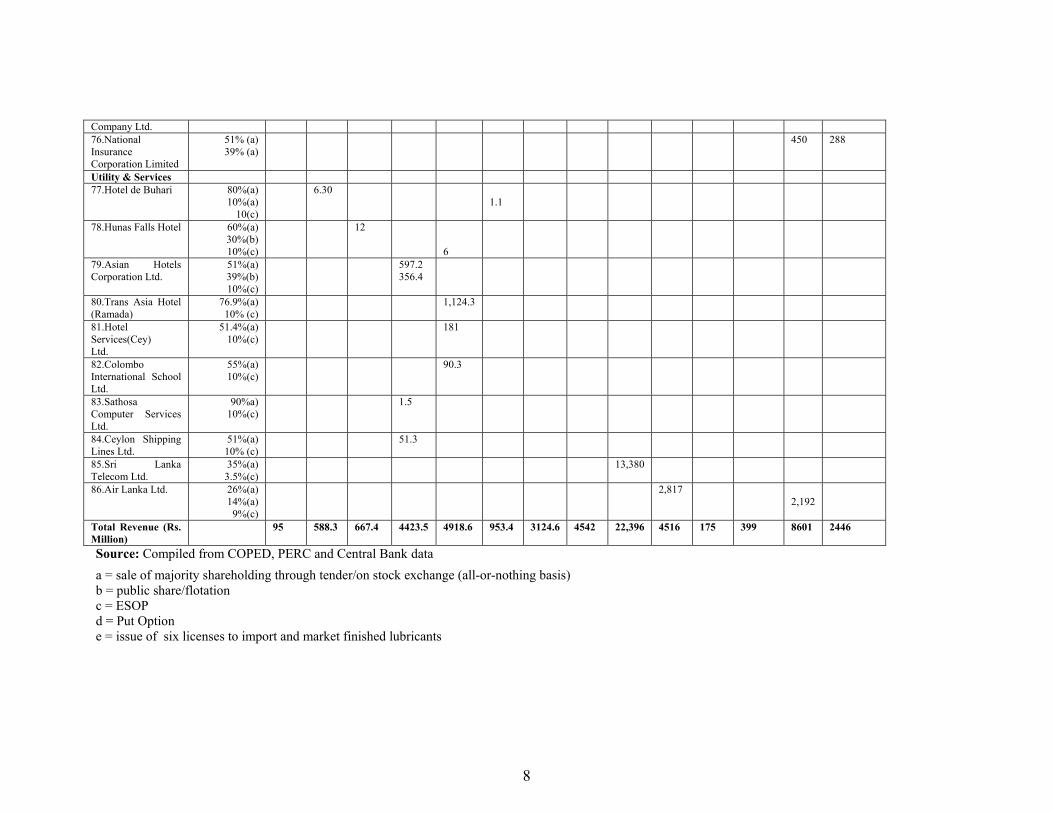
Table 5 lists the public enterprises privatized from December 1989 to September 2002,
along with the revenue realized from the sale of individual entities. As seen in this Table,
86 SOEs were privatized in this period in the manufacturing, trade, agriculture,
plantations, petroleum, financial, utility and services sectors. However, there are still over
70 public enterprises operating in these various sectors of the economy and the
cumulative losses from these entities were reported to be around 2 percent of GDP in
2000. 13
Institutional, legal and regulatory framework
Following the announcement of privatization as a state policy in 1987, several measures
were undertaken to set up the necessary legal, institutional and regulatory structures for
reform. Two pieces of legislation, the Conversion of Government Owned Business
Undertakings into Public Corporations Act No.22 and the Conversion of Public
Corporations or Government Owned Business Undertakings into Public Companies Act
No.23 were enacted in 1987 to facilitate the commercialization of SOEs.
A Public Enterprise Rehabilitation Act was also passed in 1996 with the primary
objective of looking after the interests of workers in failed privatized enterprises and
limiting the occurrence of industrial disputes and social unrest. Seven entities were re-
vested with the government under this Act at a cost of nearly Rs. 1 billion to the
Treasury.14 However, this Act was operational only for a short period of six months, as
the private sector Chambers of Commerce had already begun to voice concerns of re-
nationalization and the government did not want to send the wrong signals to the investor
community.
13 Central Bank of Sri Lanka (2001 a). 14 However, three of these enterprises were later re-privatized.
10
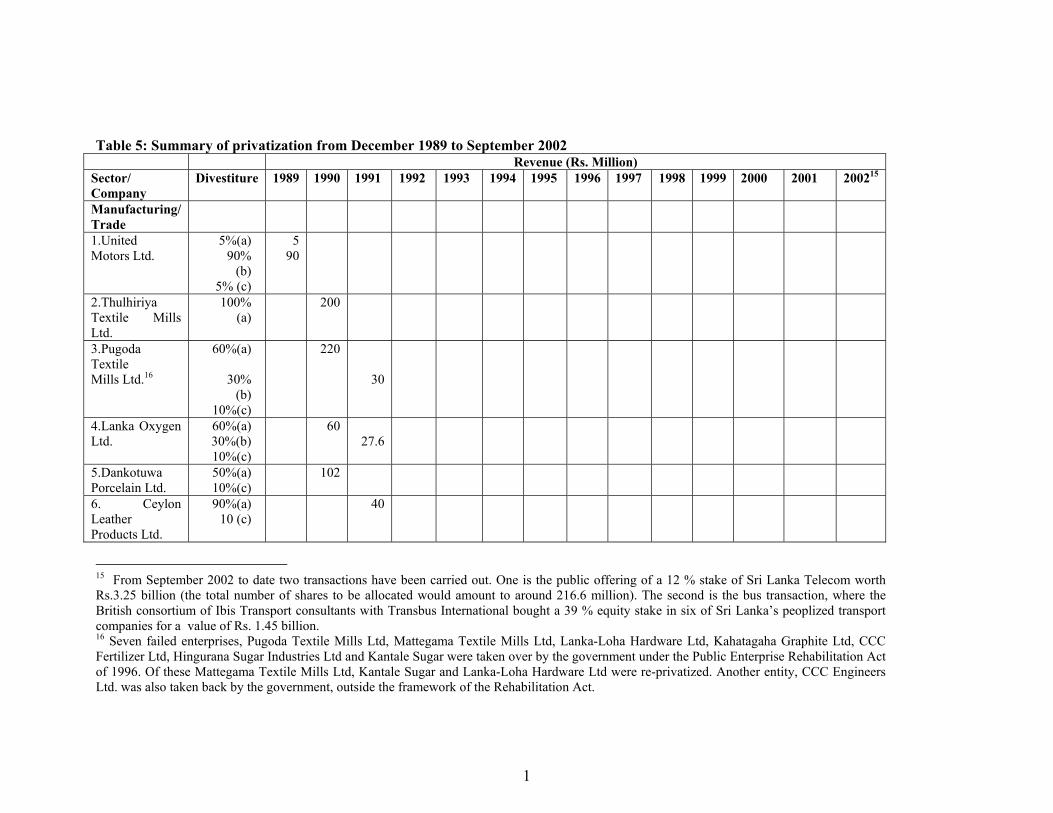
Table 5: Summary of privatization from December 1989 to September 2002
Revenue (Rs. Million) Sector/ Company
Divestiture 1989 1990 1991 1992 1993 1994 1995 1996 1997 1998 1999 2000 2001 200215
Manufacturing/ Trade
1.United Motors Ltd.
5%(a) 90%
(b) 5% (c)
5 90
2.Thulhiriya Textile Mills Ltd.
100% (a)
200
3.Pugoda Textile Mills Ltd.16
60%(a)
30% (b)
10%(c)
220
30
4.Lanka Oxygen Ltd.
60%(a) 30%(b) 10%(c)
60
27.6
5.Dankotuwa Porcelain Ltd.
50%(a) 10%(c)
102
6. Ceylon Leather Products Ltd.
90%(a) 10 (c)
40
15 From September 2002 to date two transactions have been carried out. One is the public offering of a 12 % stake of Sri Lanka Telecom worth Rs.3.25 billion (the total number of shares to be allocated would amount to around 216.6 million). The second is the bus transaction, where the British consortium of Ibis Transport consultants with Transbus International bought a 39 % equity stake in six of Sri Lanka’s peoplized transport companies for a value of Rs. 1.45 billion. 16 Seven failed enterprises, Pugoda Textile Mills Ltd, Mattegama Textile Mills Ltd, Lanka-Loha Hardware Ltd, Kahatagaha Graphite Ltd, CCC Fertilizer Ltd, Hingurana Sugar Industries Ltd and Kantale Sugar were taken over by the government under the Public Enterprise Rehabilitation Act of 1996. Of these Mattegama Textile Mills Ltd, Kantale Sugar and Lanka-Loha Hardware Ltd were re-privatized. Another entity, CCC Engineers Ltd. was also taken back by the government, outside the framework of the Rehabilitation Act.
1
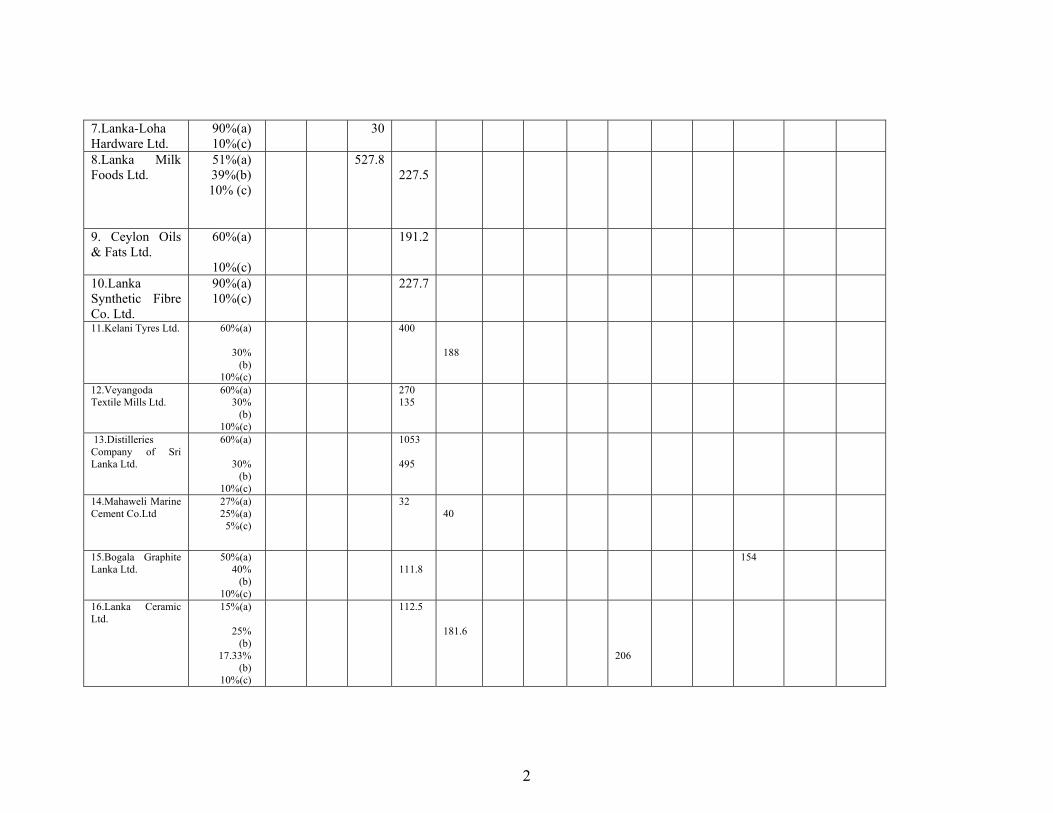
7.Lanka-Loha Hardware Ltd.
90%(a) 10%(c)
30
8.Lanka Milk Foods Ltd.
51%(a) 39%(b) 10% (c)
527.8227.5
9. Ceylon Oils & Fats Ltd.
60%(a)
10%(c)
191.2
10.Lanka Synthetic Fibre Co. Ltd.
90%(a) 10%(c)
227.7
11.Kelani Tyres Ltd. 60%(a)
30% (b)
10%(c)
400 188
12.Veyangoda Textile Mills Ltd.
60%(a) 30%
(b) 10%(c)
270135
13.Distilleries Company of Sri Lanka Ltd.
60%(a)
30% (b)
10%(c)
1053 495
14.Mahaweli Marine Cement Co.Ltd
27%(a) 25%(a)
5%(c)
3240
15.Bogala Graphite Lanka Ltd.
50%(a) 40%
(b) 10%(c)
111.8
154
16.Lanka Ceramic Ltd.
15%(a)
25% (b)
17.33% (b)
10%(c)
112.5
181.6 206
2
17.Sathosa Motors Ltd.
60%(a) 30%
(b) 10%(c)
49.5
24.7
18.Kahatagaha Graphite Ltd.
90%(a) 10%(c)
16.5
19.Lanka Porcelain (Pvt.) Ltd.
11%(a) 95.4
20.Ruhunu Cement Co.Ltd.
60%(a) 10%(c)
219
21.Mattegama Textile Mills Ltd.
100% (a)
60.75
30
22.Lanka Canneries Ltd.
60%(a) 10%(c)
102.5
23.Puttalam Cement Co.Ltd
90%(a)
10%(c)
2028.2
24.Lanka Tractors Ltd.
60%(a) 10%(c)
144.5
25.Orient Lanka Ltd. 60%(a) 3%(c)
37% (d)
1,000740
26.Statcon Rubber Co.Ltd.
55% (a)
10%(c)
18
27.Ceylon Steel Corporation Ltd.
90%(a) 10%(c)
850
28.Lanka Salt Ltd. 90%(a) 10%(c)
453
29..Puttalam Salt 90%(a) 10%(c)
123
30.CCC Engineers Ltd.
90%(a) 10%(c)
39
31. Ceylon Glass Co.Ltd.
7.87% (a)
10%( c )
45
32. Prima Ceylon Ltd. 17
BOT to BOO 5,870
33.Ceylon Plywood Corporation
Sale of assets
17 The leased lands will revert to the government in 55 years.
3
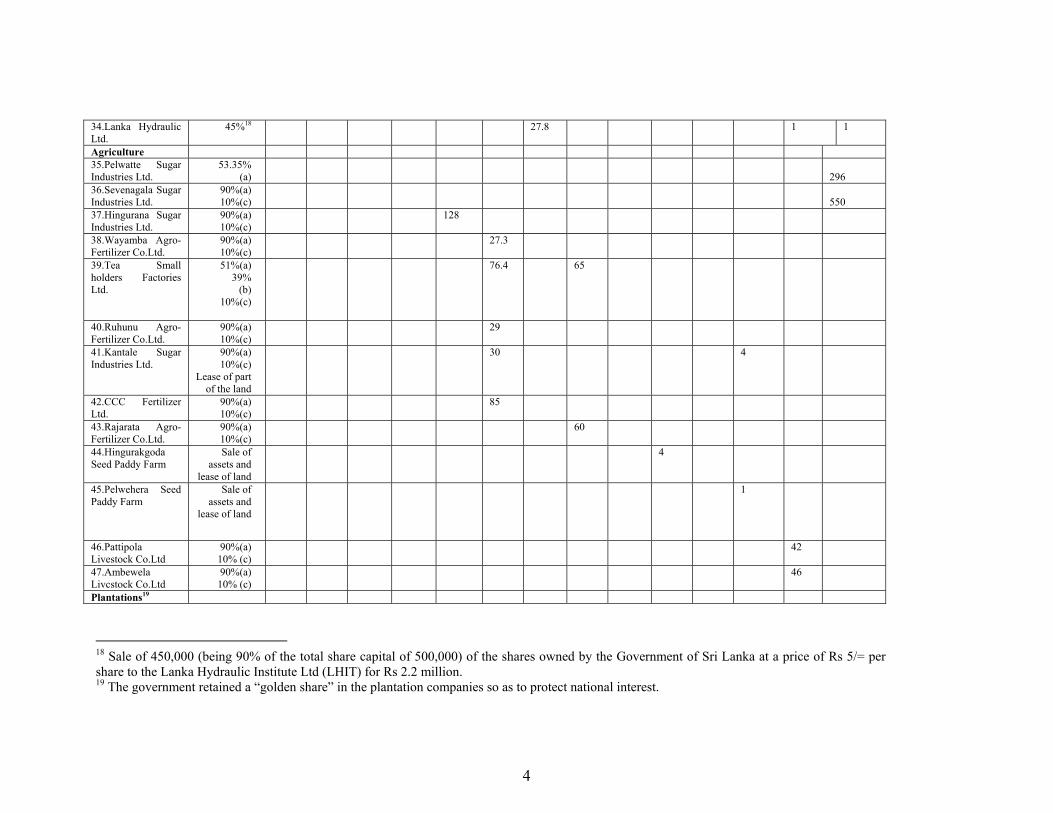
34.Lanka Hydraulic Ltd.
45%18 27.8 1 1
Agriculture 35.Pelwatte Sugar Industries Ltd.
53.35% (a)
296
36.Sevenagala Sugar Industries Ltd.
90%(a) 10%(c)
550
37.Hingurana Sugar Industries Ltd.
90%(a) 10%(c)
128
38.Wayamba Agro-Fertilizer Co.Ltd.
90%(a) 10%(c)
27.3
39.Tea Small holders Factories Ltd.
51%(a) 39%
(b) 10%(c)
76.4 65
40.Ruhunu Agro-Fertilizer Co.Ltd.
90%(a) 10%(c)
29
41.Kantale Sugar Industries Ltd.
90%(a) 10%(c)
Lease of part of the land
30 4
42.CCC Fertilizer Ltd.
90%(a) 10%(c)
85
43.Rajarata Agro-Fertilizer Co.Ltd.
90%(a) 10%(c)
60
44.Hingurakgoda Seed Paddy Farm
Sale of assets and
lease of land
4
45.Pelwehera Seed Paddy Farm
Sale of assets and
lease of land
1
46.Pattipola Livestock Co.Ltd
90%(a) 10% (c)
42
47.Ambewela Livcstock Co.Ltd
90%(a) 10% (c)
46
Plantations19
18 Sale of 450,000 (being 90% of the total share capital of 500,000) of the shares owned by the Government of Sri Lanka at a price of Rs 5/= per share to the Lanka Hydraulic Institute Ltd (LHIT) for Rs 2.2 million. 19 The government retained a “golden share” in the plantation companies so as to protect national interest.
4
48.Bogawantalawa Plantations Ltd.
51% (a) with management
20%(b) 19% (b) 10% (c)
102 36
141
49.Kotagala Plantations Ltd.
51% (a) with management
20% (b) 10% (c)
102 37
50.Kegalle Plantations Ltd.
51% (a) with management
20%(b) 19% (b) 10% (c)
102 37
118
51.Agalawatte Plantations Ltd.
51% (a) with management
20%(b) 19% (b) 10% (c)
102 36
133
52.Kelani Valley Plantations Ltd.
51% (a) with management
20%(b) 19% (b) 10% (c)
102 36
123
53.Horana Plantations Ltd.
51% (a) with management
20%(b) 19% (b) 10% (c)
15 87 36
120
54.Watawala Plantations Ltd.
51% (a) with management
20%(b) 19% (b) 10% (c)
11 295 60
5
232
55.Maskeliya Plantations Ltd.
51% (a) with management
20%(b) 19% (b) 10% (c)
219 60 171
56.Madulsima Plantations Ltd.
51% (a) with management
20%(b) 10% (c)
102 60
57.Agrapatana Plantations Ltd.
51% (a) with management
10% (c)
268
58.Hapugastenna Plantations Ltd
51% (a) with management
20%(b) 10% (c)
240 40
59.Balangoda Plantations Ltd.
51% (a) with management
20%(b) 19% (b) 10% (c)
421 80 154
60.Uda Pusselawa Plantations Ltd.
51% (a) with management
20%(b) 10% (c)
316
19
61.Namunukula Plantations Ltd.
51% (a) with management
20%(b) 10% (c)
408 60
62.Maturata Plantations Ltd.
51% (a) with management
10% (c)
467
63.Malwatte Valley 51% (a) with 622
6
Plantations Ltd. management 20%(b) 10% (c)
40
42
64.Kahawatte Plantations Ltd.
51% (a) with management
20%(b) 10% (c)
308 40
65.Elpitiya Plantations Ltd.
51% (a) with management
10% (c)
308
66.Talawakelle Plantations Ltd.
51% (a) with management
20%(b) 10% (c)
408 40
69
67.Pussellawa Plantations Ltd.
51% (a) with management
10% (c)
398
Petroleum 68.Colombo Gas Co.Ltd
51%(a) 10% (c)
1,998
69.Lanka Lubricants Ltd.
51% (a) 39%(b) 10% (c)
497.6 547 150 200
70.Lubricant Industry
(e) 30
71.Lanka Marine Services Ltd
90%(a) 10%(c)
1200
Financial 72.National Development Bank
20.9%(a) 34.4%(b)
8.4%(b) 10(c)
142.8 295
4,500
73.Acland Insurance Services Ltd.
90%(a) 10(c)
13.8
74.People’s Merchant Bank Ltd.
35%(a) 25%(b)
1%(c)
92.562.5
75.Capital Development and Investment
39.7%(b) 1.1(c)
371
7
Company Ltd. 76.National Insurance Corporation Limited
51% (a) 39% (a)
450 288
Utility & Services 77.Hotel de Buhari 80%(a)
10%(a) 10(c)
6.30 1.1
78.Hunas Falls Hotel 60%(a) 30%(b) 10%(c)
12 6
79.Asian Hotels Corporation Ltd.
51%(a) 39%(b) 10%(c)
597.2 356.4
80.Trans Asia Hotel (Ramada)
76.9%(a) 10% (c)
1,124.3
81.Hotel Services(Cey) Ltd.
51.4%(a) 10%(c)
181
82.Colombo International School Ltd.
55%(a) 10%(c)
90.3
83.Sathosa Computer Services Ltd.
90%a) 10%(c)
1.5
84.Ceylon Shipping Lines Ltd.
51%(a) 10% (c)
51.3
85.Sri Lanka Telecom Ltd.
35%(a) 3.5%(c)
13,380
86.Air Lanka Ltd. 26%(a) 14%(a)
9%(c)
2,817 2,192
Total Revenue (Rs. Million)
95 588.3 667.4 4423.5 4918.6 953.4 3124.6 4542 22,396 4516 175 399 8601 2446
Source: Compiled from COPED, PERC and Central Bank data
a = sale of majority shareholding through tender/on stock exchange (all-or-nothing basis) b = public share/flotation c = ESOP d = Put Option e = issue of six licenses to import and market finished lubricants
8
Several successive institutions such as the Presidential Commission on Privatization
(later renamed the Presidential Committee on Peoplization), the Public Investment
Management Board and the Commercialization of Public Enterprises Division (COPED)
in the Ministry of Finance were set up during the 1987 to 1995 period to facilitate the
privatization process. A Plantation Restructuring Unit was established to handle the
privatization of the plantation sector and a special unit in the Ministry of Industries was
put in charge of the privatization of industrial enterprises.
These changes in the institutional framework and the diversification of responsibility for
the privatization program to different institutions was largely due to the political climate
at the time, with the President facing an impeachment and coalition management being
the primary objective of the political leadership. Given the need for coalition building the
support of the different line ministries was vital and it was not politically feasible to
restrict the management of the privatization program to one umbrella institution. The
involvement of these various line ministries with their individual political agenda led to a
systemic politicization of the privatization process.
The politicization of the implementation network raised questions on transparency with
COPED, for instance, being subject to allegations of “closed door” deals by those
opposed to the sale of public assets. To some extent however, transparency was the price
for speed of execution, with policy makers wanting a relatively rapid sale of assets. This
need for a fast pace of privatization was influenced both by external donor pressure as
well as by the government’s own desire to prove its commitment to privatization.
The new government that came into power in 1994 had highlighted the alleged corruption
associated with the privatization program of its predecessor as one of the main issues in
their election campaign. As such, a new institution the Public Enterprise Reform
Commission was set up under an Act of Parliament in 1996 to undertake the sole
responsibility for the privatization program, with the stated intention of effecting
privatization in a structured and transparent environment.
13
Transparency and access to information with regard to the privatization program did
improve with the setting up of the new institution. The publication of Annual Reports and
other materials, the frequent press notices, and the posting of pertinent transaction details
on a PERC website have, to some extent, increased the public’s awareness of the
privatization process. However, allegations of questionable deals and of selling the
“family silver for a song” still prevail as will be discussed more thoroughly in the section
on the political economy aspects of privatization.
Several regulatory bodies have also been linked to the privatization program with the aim
of ensuring that privatization would bring about both allocative efficiency and
distributional equity. However, as will be discussed later on in this paper, weak
regulatory governance is perhaps one of the most significant obstacles to the realization
of positive distributional impacts from privatization.
Sri Lanka lacks a comprehensive competition policy framework, a prerequisite in an
economy moving towards greater private sector activity. Currently, issues relating to
monopolies, mergers and acquisitions and anti-competitive behavior are handled by the
Fair Trading Commission (FTC) set up in 1987 while the Department of Internal Trade
(DIT) established in 1979 takes up issues relating to consumer protection. The
institutional separation of these complementary functions has proved to be extremely
inefficient and the government is now in the process of integrating the two bodies and
setting up a new authority, to be named the Consumer Affairs Authority (CAA).
However, this process of instituting a competition policy framework has had to face
many a hurdle with no assurance that the new authority will have the necessary teeth to
address the challenges that come with increased private sector activity. As of now, the
new authority is to be stripped of its powers to look into monopolies and mergers and is
to function solely as a consumer protection agency. Although reports of a separate
Monopolies and Mergers Commission abound in the press, there has not been any overt
policy statement to this effect nor concrete measures to institutionalize such a body.
Whilst it is conceivable and justifiable that the government may want to do away with the
14
perception of a restrictive regulatory regime in order to attract investment and facilitate
efficiency enhancing mergers, the current lacuna in the competition policy framework is
a recipe for disaster.
As of now, sectoral regulation exists, more in nominal terms than in any effective sense,
in the case of services such as bus transport (National Transport Commission) and
telecommunications (Telecommunications Regulatory Authority).20 21 Links between the
competition policy and consumer protection authorities and these sectoral regulators,
essential for ensuring that competition and distributional goals are met, are few and far
between. However, relatively more effective regulation exists in the financial sector,
which is handled by the Bank and Non-Bank Supervision Division of the Central Bank,
the Securities and Exchange Commission (SEC) and by an Insurance Board that was set
up in 2001 with the specific aim of supervising the insurance industry.
A brief review of the literature on privatization in Sri Lanka
In this section we summarize some of the findings of the literature on privatization in Sri
Lanka, relevant to this paper. As of now, there are no studies that have looked at the
distributional impacts of privatization in Sri Lanka using formal empirical methods, such
as cost-benefit analyses or counterfactual models. The existing studies mostly employ a
case study-based approach because of the lack of data.
The seminal study on privatization and equity in Sri Lanka is that of Kelegama (1995),
which traces the distributional consequences of the privatization process from its
inception up to 1993 – the period we characterize as the First Wave. This paper looks,
inter alia, at the distributional implications of the modalities of divestiture, the pricing
and valuation of entities up for sale, the employment effects of privatization, the
utilization of sales proceeds, and the social effects of privatization such as its regional
20 See Jayasuriya and Knight-John (2002) for details on telecommunications regulation in Sri Lanka. 21 Plans are currently underway to establish a multi-sector regulatory framework encompassing the water and power and energy sectors.
15
impacts and the ramifications of removing state subsidies. Some of the salient findings
and speculations coming out of this study are as follows.
First, Kelegama (1995) concludes that the government under-priced the shares of entities
sold on the stock exchange so as to ensure accessibility to a larger proportion of the
population, to minimize the financial risk faced by new investors and to avoid
overburdening the domestic capital market. However, although the sales were a success
in that nearly all of the share issues were oversubscribed, most of these shares were
bought by the relatively wealthy. Also the continued under-pricing of SOEs apparently
came at a high cost to the state, given that the share price of a number of privatized
entities rose considerably after divesture.
Along with the deliberate effort on the part of the government to keep share prices low,
the sale prices of SOEs were also affected by capacity problems in the Valuation
Department and by the rapid pace of the divestiture program, as necessitated by the
World Bank and the International Monetary Fund in their recommendations for structural
adjustment. Another political economy consideration for the low sale prices was the quest
to attract foreign capital with the associated technological know-how. 22
A second important consideration raised in the study is the actual distributional impact of
the ESOP for workers in the entities being privatized. Three objectives governed the
policy decision to distribute free shares to these employees: to give workers a greater
incentive for dedicated work through the sharing of profits; to safeguard employee rights
by giving them a voice in decision-making; and, to make trade unions more receptive to
privatization. The study argues however, that only the last of these objectives was
realized – and that too to a limited extent- due to the fact that these workers tended to
quickly dispose of their shares to meet personal financial commitments.
22 The plantations sector privatization is a classic case of under-pricing, where the market clearing price for a 20% stake of the profit-making entities offered on the stock exchange was also the price set for the 51% majority stake.
16
Kelegama (1995) also notes that privatized entities are located predominately in the urban
areas and in the more developed provinces and districts in the country. This phenomenon,
it is argued, creates the possibility of worker discontent given the asymmetric and more
privileged position of the workers in privatized enterprises – with share ownership, wage
increases and long-term dividend payments – vis a vis those in other entities.
The analysis of the social effects of privatization in this paper posits that the goal of
public benefit – which was the driving force of SOEs – became secondary to that of
revenue maximization. Divestiture proceeds for instance were utilized primarily to
address the fiscal deficit resulting from high levels of debt servicing and defense
expenditure; investment of these monies in infrastructure or social welfare projects was at
best marginal. In addition, the removal of state subsidies and the consequent price
increases associated with the privatization program did not have a positive impact on the
general public, as was seen most clearly in the case of the privatization of bus transport.
A more recent study on the employment effects of privatization in Sri Lanka – more
specifically the experience with labor retrenchment – is that of Kelegama and Salih
(1998). The study focuses on three key issues: voluntary versus involuntary
retrenchment, using a compensation package as a safety net, and pre-versus post-
privatization retrenchment. The findings are that voluntary retirement packages have
tended to be undermined by the adverse selection problem, that fixed compensation
packages are superior to flexible ones given rent-seeking trade union behavior and
downwardly rigid compensation packages, and that pre-privatization retrenchment maybe
sub-optimal, given that they fail to take account of more efficient post-privatization
restructuring options.
An interesting insight on the political economy of the privatization process is given in
Kelegama (1997b) citing Jayawardena(1994):
“The Sri Lankan experience shows that the acts of divestiture defy enunciations of underlying rationale or orderly policy. As in the case of nationalization, privatization consisting of a series of political actions
17
which are guided by diverse, sometimes conflicting factors, implemented by different governments and people, discerning some order out of an essentially disorderly situation could be an academic exercise of little interest to the doers. Even if some enunciation of broad policy could be made, political expediency would compel the practitioners to choose the most feasible path of action, and yet be consistent, given the inevitably broad general character of the policy statement” (p.92)
Expanding on this argument, we could speculate that in choosing the most feasible path
of action in the face of the political economy constraints linked to privatization – for
instance, instituting a rapid divestiture program in an uncertain political milieu when
investor interest is minimal – maintaining transparency may not be the priority of
implementers, giving rise to allegations of questionable transactions, such as those
highlighted in Kelegama (1997b). The perception of shady deals was only enhanced by
the absence of an effective regulatory framework to support the privatization program in
the early years, due to the prevalent thinking at the time that regulatory intervention
would restrict the flexibility of the privatization exercise.
4. Evaluating the Distributional Impact of Privatization
Macroeconomic effects
The principal questions to be addressed here relate to the fiscal and investment impacts of
privatization and their link to distributional concerns. As indicated earlier on in the paper,
gross proceeds from privatization between 1989 and September 2002 amounts to over Rs.
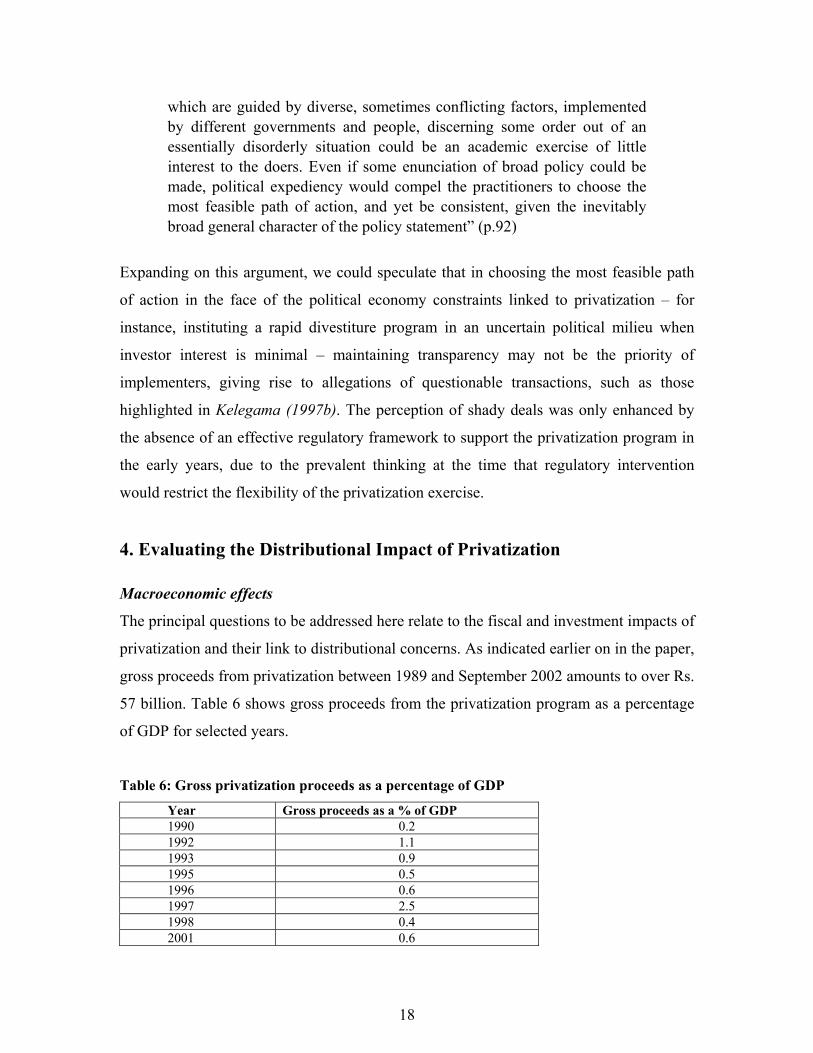
57 billion. Table 6 shows gross proceeds from the privatization program as a percentage
of GDP for selected years.
Table 6: Gross privatization proceeds as a percentage of GDP
Year Gross proceeds as a % of GDP 1990 0.2 1992 1.1 1993 0.9 1995 0.5 1996 0.6 1997 2.5 1998 0.4 2001 0.6
18
Source: Compiled from Central Bank and PERC Annual Reports and COPED data
An official figure for net proceeds over this period is not available, given that the various
pre-privatization expenses incurred by the government for administration, sale and
enterprise restructuring have not been systematically documented. However, we have
made an attempt in this paper to estimate these- in Table 7- on the basis of IMF (2000),
which found that on average, in a sample set of 18 countries, net proceeds were about
half of gross proceeds.
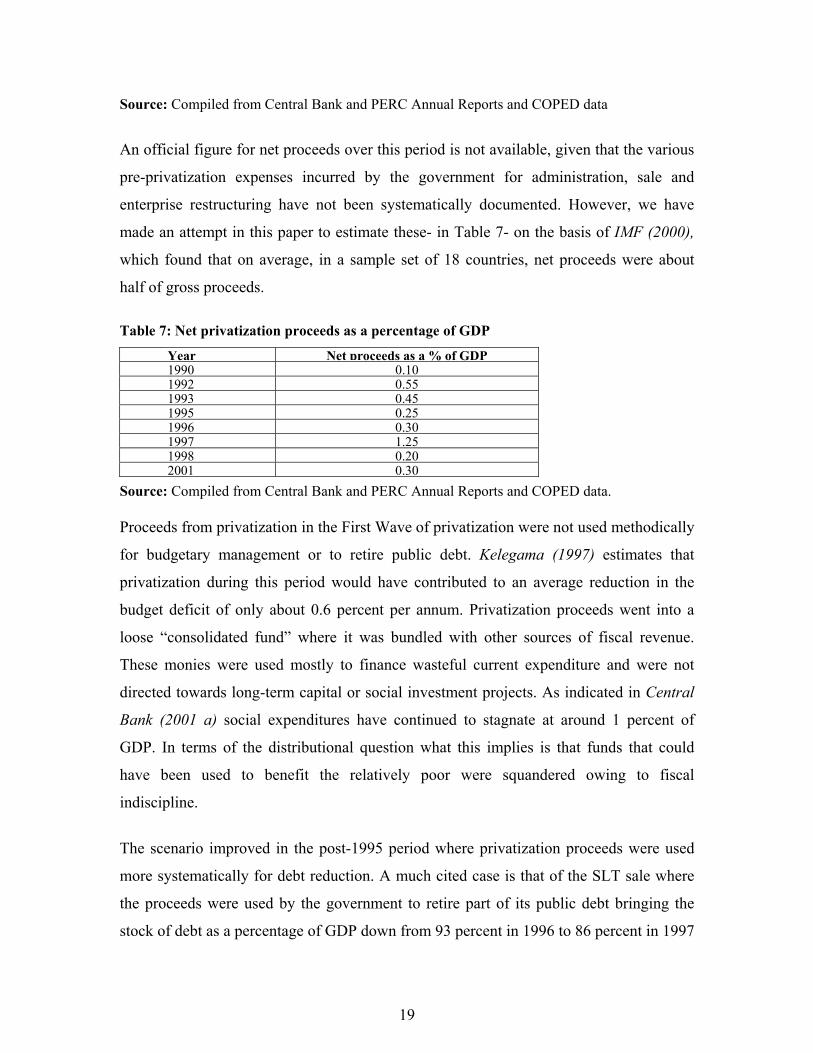
Table 7: Net privatization proceeds as a percentage of GDP
Year Net proceeds as a % of GDP1990 0.101992 0.551993 0.451995 0.251996 0.301997 1.251998 0.202001 0.30
Source: Compiled from Central Bank and PERC Annual Reports and COPED data. Proceeds from privatization in the First Wave of privatization were not used methodically
for budgetary management or to retire public debt. Kelegama (1997) estimates that
privatization during this period would have contributed to an average reduction in the
budget deficit of only about 0.6 percent per annum. Privatization proceeds went into a
loose “consolidated fund” where it was bundled with other sources of fiscal revenue.
These monies were used mostly to finance wasteful current expenditure and were not
directed towards long-term capital or social investment projects. As indicated in Central
Bank (2001 a) social expenditures have continued to stagnate at around 1 percent of
GDP. In terms of the distributional question what this implies is that funds that could
have been used to benefit the relatively poor were squandered owing to fiscal
indiscipline.
The scenario improved in the post-1995 period where privatization proceeds were used
more systematically for debt reduction. A much cited case is that of the SLT sale where
the proceeds were used by the government to retire part of its public debt bringing the
stock of debt as a percentage of GDP down from 93 percent in 1996 to 86 percent in 1997
19
and to reduce interest costs in a macroeconomic environment where high interest rates
were a major impediment to private sector activity.
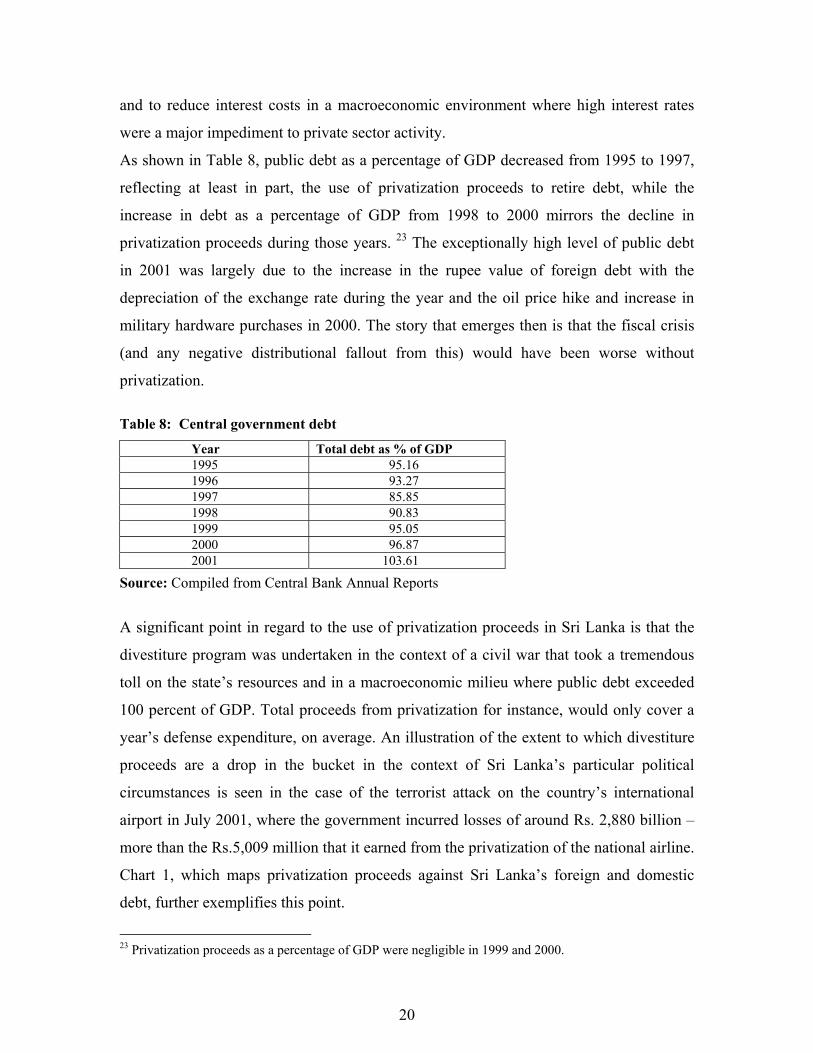
As shown in Table 8, public debt as a percentage of GDP decreased from 1995 to 1997,
reflecting at least in part, the use of privatization proceeds to retire debt, while the
increase in debt as a percentage of GDP from 1998 to 2000 mirrors the decline in
privatization proceeds during those years. 23 The exceptionally high level of public debt
in 2001 was largely due to the increase in the rupee value of foreign debt with the
depreciation of the exchange rate during the year and the oil price hike and increase in
military hardware purchases in 2000. The story that emerges then is that the fiscal crisis
(and any negative distributional fallout from this) would have been worse without
privatization.
Table 8: Central government debt
Year Total debt as % of GDP 1995 95.16 1996 93.27 1997 85.85 1998 90.83 1999 95.05 2000 96.87 2001 103.61
Source: Compiled from Central Bank Annual Reports
A significant point in regard to the use of privatization proceeds in Sri Lanka is that the
divestiture program was undertaken in the context of a civil war that took a tremendous
toll on the state’s resources and in a macroeconomic milieu where public debt exceeded
100 percent of GDP. Total proceeds from privatization for instance, would only cover a
year’s defense expenditure, on average. An illustration of the extent to which divestiture
proceeds are a drop in the bucket in the context of Sri Lanka’s particular political
circumstances is seen in the case of the terrorist attack on the country’s international
airport in July 2001, where the government incurred losses of around Rs. 2,880 billion –
more than the Rs.5,009 million that it earned from the privatization of the national airline.
Chart 1, which maps privatization proceeds against Sri Lanka’s foreign and domestic
debt, further exemplifies this point.
23 Privatization proceeds as a percentage of GDP were negligible in 1999 and 2000.
20

21
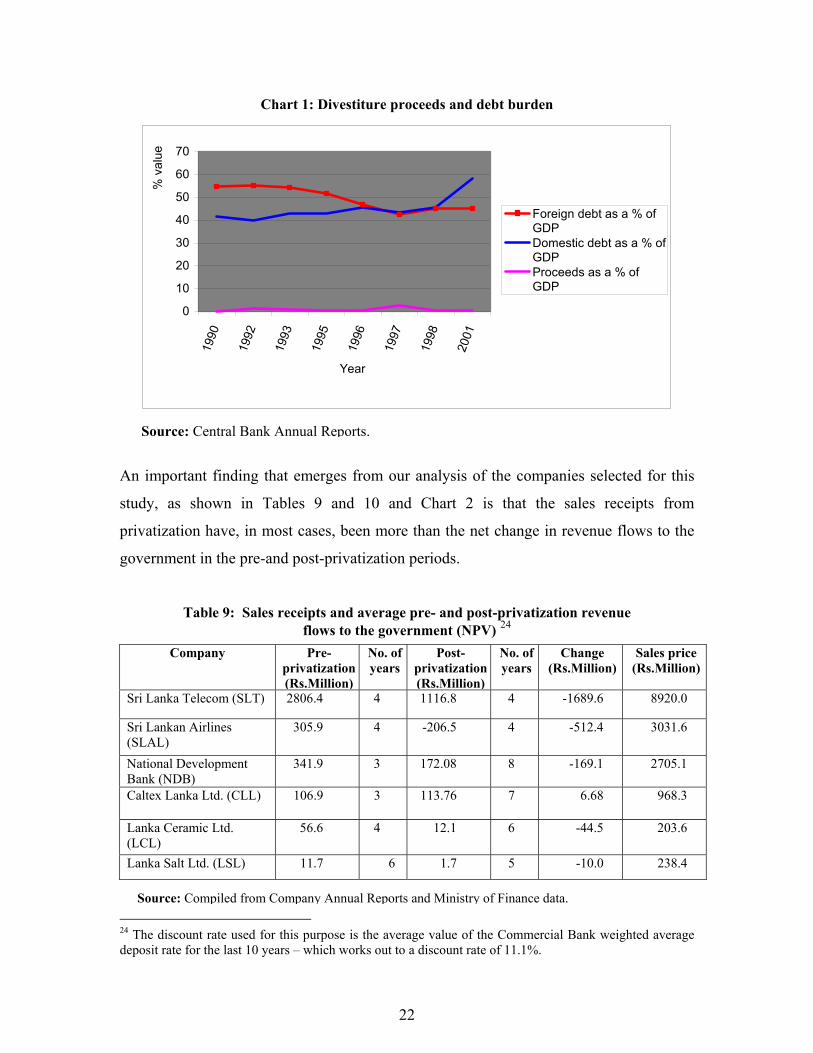
Chart 1: Divestiture proceeds and debt burden
0
10
20
30
40
50
60
70
1990
1992
1993
1995
1996
1997
1998
2001
Year
% v
alue
Foreign debt as a % ofGDPDomestic debt as a % ofGDPProceeds as a % ofGDP
An
stu
pr
go
S
S(SNBC
L(LL
24 Tdep
Source: Central Bank Annual Reports.
important finding that emerges from our analysis of the companies selected for this
dy, as shown in Tables 9 and 10 and Chart 2 is that the sales receipts from
ivatization have, in most cases, been more than the net change in revenue flows to the
vernment in the pre-and post-privatization periods.
Table 9: Sales receipts and average pre- and post-privatization revenue flows to the government (NPV) 24
Company Pre-privatization(Rs.Million)
No. of years
Post- privatization(Rs.Million)
No. of years
Change (Rs.Million)
Sales price (Rs.Million)
ri Lanka Telecom (SLT) 2806.4 4 1116.8 4 -1689.6 8920.0
ri Lankan Airlines LAL)
305.9 4 -206.5 4 -512.4 3031.6
ational Development ank (NDB)
341.9 3 172.08 8 -169.1 2705.1
altex Lanka Ltd. (CLL) 106.9 3 113.76 7 6.68 968.3
anka Ceramic Ltd. CL)
56.6 4 12.1 6 -44.5 203.6
anka Salt Ltd. (LSL) 11.7 6 1.7 5 -10.0 238.4
Source: Compiled from Company Annual Reports and Ministry of Finance data.
22
he discount rate used for this purpose is the average value of the Commercial Bank weighted average osit rate for the last 10 years – which works out to a discount rate of 11.1%.
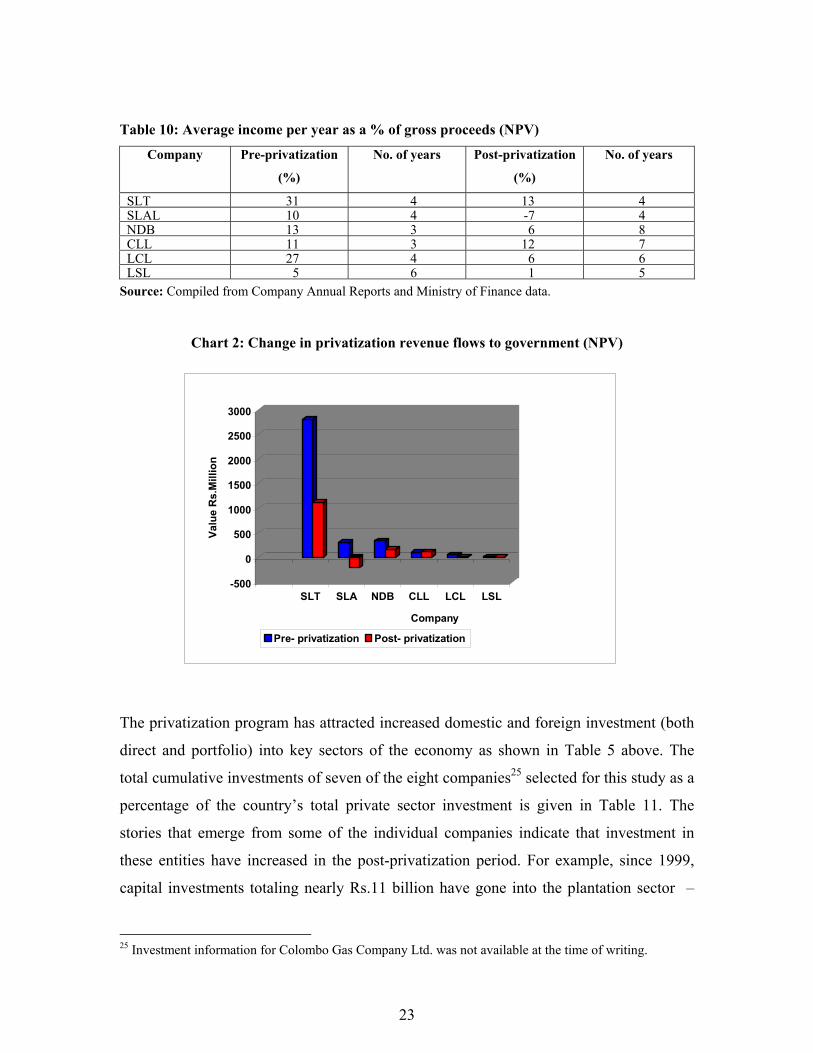
Table 10: Average income per year as a % of gross proceeds (NPV)
Company Pre-privatization
(%)
No. of years Post-privatization
(%)
No. of years
SLT 31 4 13 4 SLAL 10 4 -7 4 NDB 13 3 6 8 CLL 11 3 12 7 LCL 27 4 6 6 LSL 5 6 1 5
Source: Compiled from Company Annual Reports and Ministry of Finance data.
Chart 2: Change in privatization revenue flows to government (NPV)
-500
0
500
1000
1500
2000
2500
3000
Valu
e R
s.M
illio
n
SLT SLA NDB CLL LCL LSL
Company
Pre- privatization Post- privatization
The privatization program has attracted increased domestic and foreign investment (both
direct and portfolio) into key sectors of the economy as shown in Table 5 above. The
total cumulative investments of seven of the eight companies25 selected for this study as a
percentage of the country’s total private sector investment is given in Table 11. The
stories that emerge from some of the individual companies indicate that investment in
these entities have increased in the post-privatization period. For example, since 1999,
capital investments totaling nearly Rs.11 billion have gone into the plantation sector –
23
25 Investment information for Colombo Gas Company Ltd. was not available at the time of writing.
working out to an average of around Rs.550 million per company; over the past five years
SLT has invested over Rs.40 billion in developing a state-of –the-art communications
infrastructure; and, capital investment in the Colombo Gas Company Ltd. (CGCL)
(Shell) from 1996 to 2001 has been around Rs.7 billion (including investment on a
storage terminal).
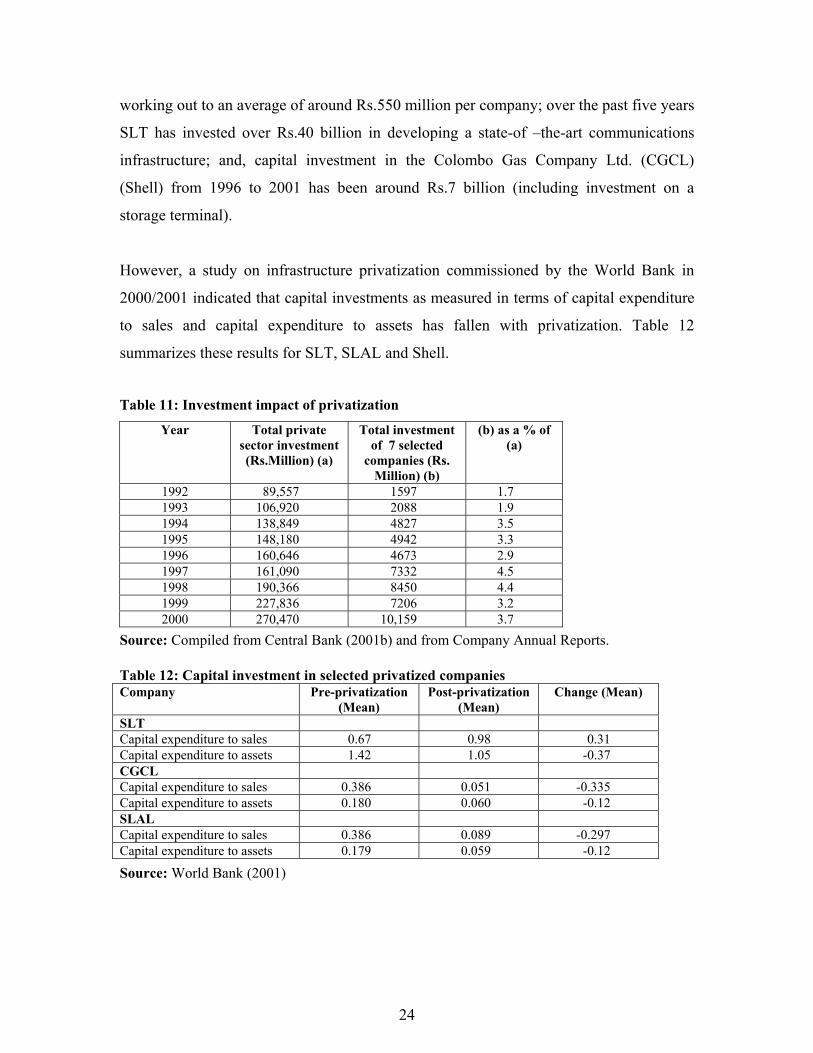
However, a study on infrastructure privatization commissioned by the World Bank in
2000/2001 indicated that capital investments as measured in terms of capital expenditure
to sales and capital expenditure to assets has fallen with privatization. Table 12
summarizes these results for SLT, SLAL and Shell.
Table 11: Investment impact of privatization
Year Total private sector investment (Rs.Million) (a)
Total investment of 7 selected
companies (Rs. Million) (b)
(b) as a % of (a)
1992 89,557 1597 1.7 1993 106,920 2088 1.9 1994 138,849 4827 3.5 1995 148,180 4942 3.3 1996 160,646 4673 2.9 1997 161,090 7332 4.5 1998 190,366 4.4 1999 227,836 7206 3.2 2000 270,470 10,159 3.7
8450
Source: Compiled from Central Bank (2001b) and from Company Annual Reports. Table 12: Capital investment in selected privatized companies Company Pre-privatization
(Mean) Post-privatization
(Mean) Change (Mean)
SLT Capital expenditure to sales 0.67 0.98 0.31 Capital expenditure to assets 1.42 1.05 -0.37 CGCL Capital expenditure to sales 0.386 0.051 -0.335 Capital expenditure to assets 0.180 0.060 -0.12 SLAL Capital expenditure to sales 0.386 0.089 -0.297 Capital expenditure to assets 0.179 0.059 -0.12
Source: World Bank (2001)
24
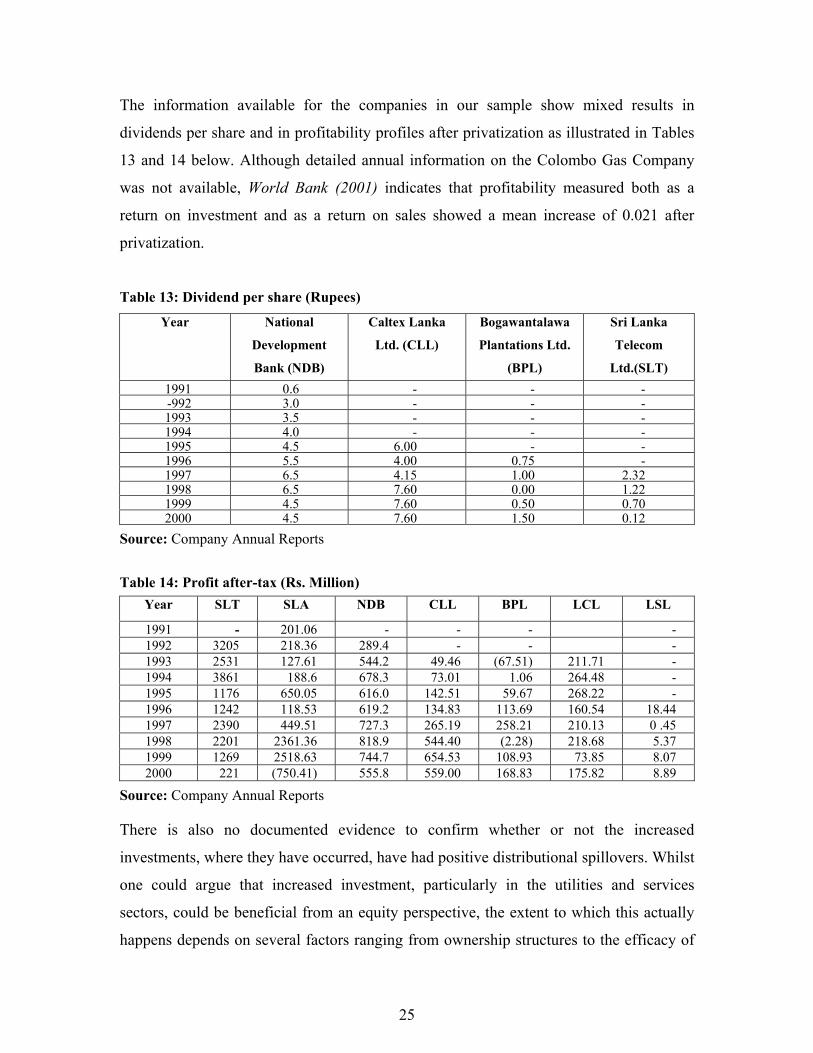
The information available for the companies in our sample show mixed results in
dividends per share and in profitability profiles after privatization as illustrated in Tables
13 and 14 below. Although detailed annual information on the Colombo Gas Company
was not available, World Bank (2001) indicates that profitability measured both as a
return on investment and as a return on sales showed a mean increase of 0.021 after
privatization.
Table 13: Dividend per share (Rupees)
Year National
Development
Bank (NDB)
Caltex Lanka
Ltd. (CLL)
Bogawantalawa
Plantations Ltd.
(BPL)
Sri Lanka
Telecom
Ltd.(SLT) 1991 0.6 - - - -992 3.0 - - - 1993 3.5 - - - 1994 4.0 - - - 1995 4.5 6.00 - - 1996 5.5 4.00 0.75 - 1997 6.5 4.15 1.00 2.32 1998 6.5 7.60 0.00 1.22 1999 4.5 7.60 0.50 0.70 2000 4.5 7.60 1.50 0.12
Source: Company Annual Reports
Table 14: Profit after-tax (Rs. Million)
Year SLT SLA NDB CLL BPL LCL LSL
1991 - 201.06 - - - - 1992 3205 218.36 289.4 - - - 1993 2531 127.61 544.2 49.46 (67.51) 211.71 - 1994 3861 188.6 678.3 73.01 1.06 264.48 - 1995 1176 650.05 616.0 142.51 59.67 268.22 - 1996 1242 118.53 619.2 134.83 113.69 160.54 18.44 1997 2390 449.51 727.3 265.19 258.21 210.13 0 .45 1998 2201 2361.36 818.9 544.40 (2.28) 218.68 5.37 1999 1269 2518.63 744.7 654.53 108.93 73.85 8.07 2000 221 (750.41) 555.8 559.00 168.83 175.82 8.89
Source: Company Annual Reports There is also no documented evidence to confirm whether or not the increased
investments, where they have occurred, have had positive distributional spillovers. Whilst
one could argue that increased investment, particularly in the utilities and services
sectors, could be beneficial from an equity perspective, the extent to which this actually
happens depends on several factors ranging from ownership structures to the efficacy of
25
regulatory institutions as will be discussed in later sections of this paper. For instance, as
dealt with in detail in Jayasuriya and Knight-John (2002), the privatization of SLT could
have had better results in terms of overall competition in the industry, prices and access,
in the absence of SLT’s monopoly on international telephony and with a more effective
regulatory regime.
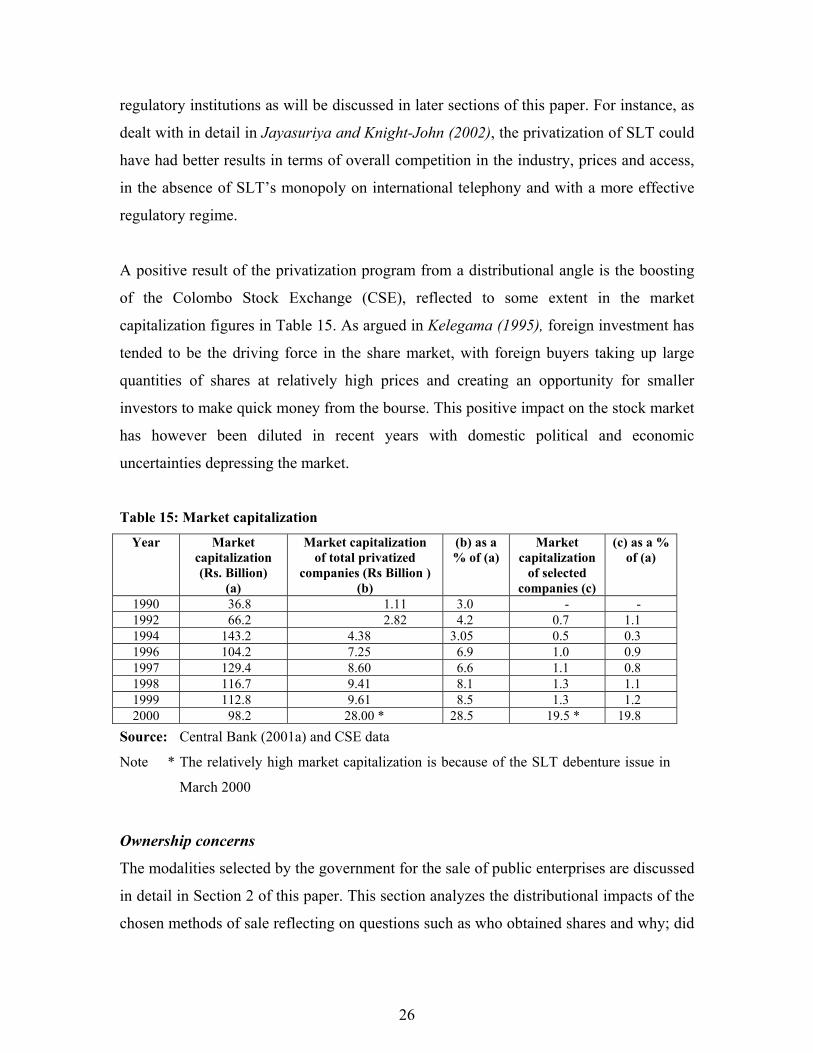
A positive result of the privatization program from a distributional angle is the boosting
of the Colombo Stock Exchange (CSE), reflected to some extent in the market
capitalization figures in Table 15. As argued in Kelegama (1995), foreign investment has
tended to be the driving force in the share market, with foreign buyers taking up large
quantities of shares at relatively high prices and creating an opportunity for smaller
investors to make quick money from the bourse. This positive impact on the stock market
has however been diluted in recent years with domestic political and economic
uncertainties depressing the market.
Table 15: Market capitalization
Year Market capitalization (Rs. Billion)
(a)
Market capitalization of total privatized
companies (Rs Billion ) (b)
(b) as a % of (a)
Market capitalization
of selected companies (c)
(c) as a % of (a)
1990 36.8 1.11 3.0 - - 1992 66.2 2.82 4.2 0.7 1.1 1994 143.2 4.38 3.05 0.5 0.3 1996 104.2 7.25 6.9 1.0 0.9 1997 129.4 8.60 6.6 1.1 0.8 1998 116.7 9.41 8.1 1.3 1.1 1999 112.8 9.61 8.5 1.3 1.2 2000 98.2 28.00 * 28.5 19.5 * 19.8
Source: Central Bank (2001a) and CSE data
Note * The relatively high market capitalization is because of the SLT debenture issue in
March 2000
Ownership concerns
The modalities selected by the government for the sale of public enterprises are discussed
in detail in Section 2 of this paper. This section analyzes the distributional impacts of the
chosen methods of sale reflecting on questions such as who obtained shares and why; did
26
share prices reflect the actual value of the entities; what measures, if any, were taken by
the government to ensure that a wide spectrum of stakeholders benefited from
privatization; and, was the sales process transparent.
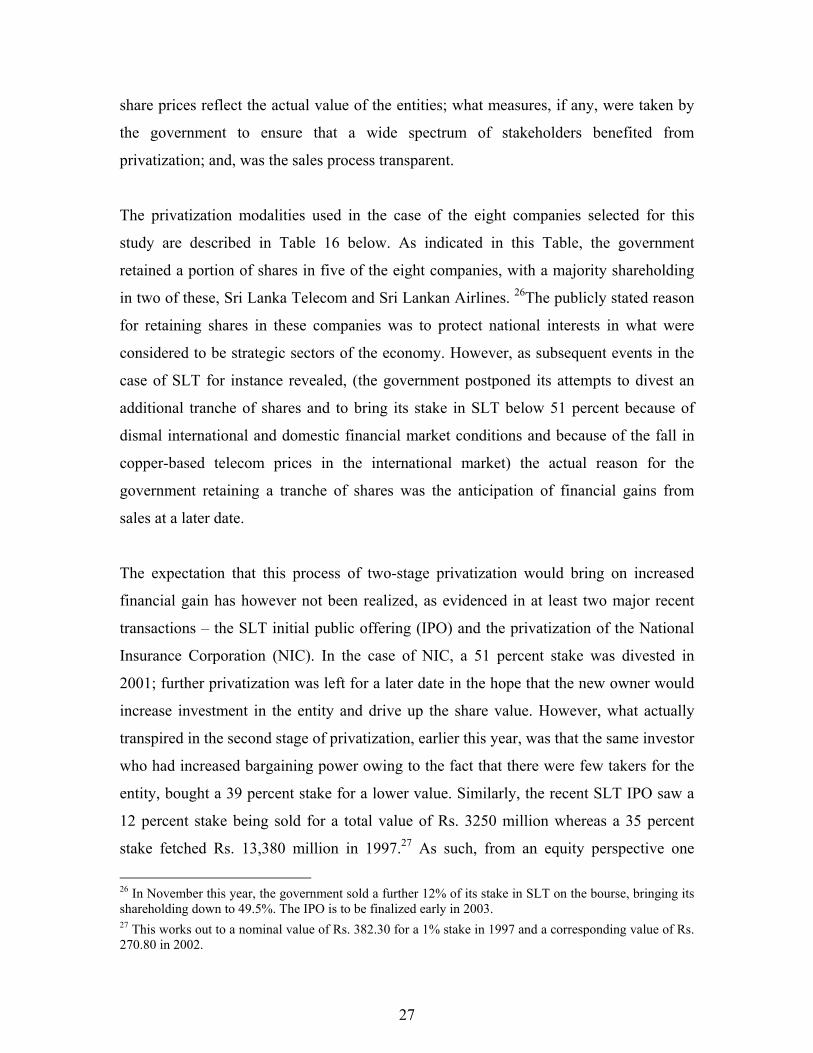
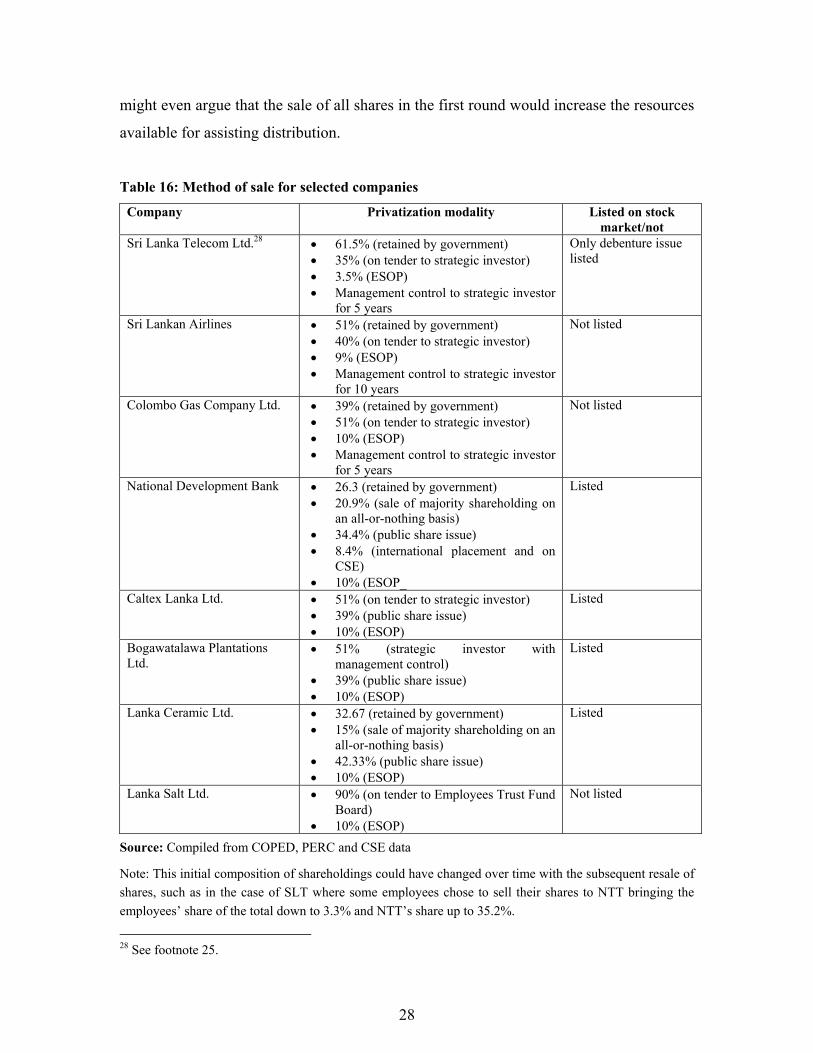
The privatization modalities used in the case of the eight companies selected for this
study are described in Table 16 below. As indicated in this Table, the government
retained a portion of shares in five of the eight companies, with a majority shareholding
in two of these, Sri Lanka Telecom and Sri Lankan Airlines. 26The publicly stated reason
for retaining shares in these companies was to protect national interests in what were
considered to be strategic sectors of the economy. However, as subsequent events in the
case of SLT for instance revealed, (the government postponed its attempts to divest an
additional tranche of shares and to bring its stake in SLT below 51 percent because of
dismal international and domestic financial market conditions and because of the fall in
copper-based telecom prices in the international market) the actual reason for the
government retaining a tranche of shares was the anticipation of financial gains from
sales at a later date.
The expectation that this process of two-stage privatization would bring on increased
financial gain has however not been realized, as evidenced in at least two major recent
transactions – the SLT initial public offering (IPO) and the privatization of the National
Insurance Corporation (NIC). In the case of NIC, a 51 percent stake was divested in
2001; further privatization was left for a later date in the hope that the new owner would
increase investment in the entity and drive up the share value. However, what actually
transpired in the second stage of privatization, earlier this year, was that the same investor
who had increased bargaining power owing to the fact that there were few takers for the
entity, bought a 39 percent stake for a lower value. Similarly, the recent SLT IPO saw a
12 percent stake being sold for a total value of Rs. 3250 million whereas a 35 percent
stake fetched Rs. 13,380 million in 1997.27 As such, from an equity perspective one
26 In November this year, the government sold a further 12% of its stake in SLT on the bourse, bringing its shareholding down to 49.5%. The IPO is to be finalized early in 2003. 27 This works out to a nominal value of Rs. 382.30 for a 1% stake in 1997 and a corresponding value of Rs. 270.80 in 2002.
27
might even argue that the sale of all shares in the first round would increase the resources
available for assisting distribution.
Table 16: Method of sale for selected companies
Company Privatization modality Listed on stock market/not
Sri Lanka Telecom Ltd.28 • 61.5% (retained by government) • 35% (on tender to strategic investor) • 3.5% (ESOP) • Management control to strategic investor
for 5 years
Only debenture issue listed
Sri Lankan Airlines • 51% (retained by government) • 40% (on tender to strategic investor) • 9% (ESOP) • Management control to strategic investor
for 10 years
Not listed
Colombo Gas Company Ltd. • 39% (retained by government) • 51% (on tender to strategic investor) • 10% (ESOP) • Management control to strategic investor
for 5 years
Not listed
National Development Bank • 26.3 (retained by government) • 20.9% (sale of majority shareholding on
an all-or-nothing basis) • 34.4% (public share issue) • 8.4% (international placement and on
CSE) • 10% (ESOP_
Listed
Caltex Lanka Ltd. • 51% (on tender to strategic investor) • 39% (public share issue) • 10% (ESOP)
Listed
Bogawatalawa Plantations Ltd.
• 51% (strategic investor with management control)
• 39% (public share issue) • 10% (ESOP)
Listed
Lanka Ceramic Ltd. • 32.67 (retained by government) • 15% (sale of majority shareholding on an
all-or-nothing basis) • 42.33% (public share issue) • 10% (ESOP)
Listed
Lanka Salt Ltd. • 90% (on tender to Employees Trust Fund Board)
• 10% (ESOP)
Not listed
Source: Compiled from COPED, PERC and CSE data
Note: This initial composition of shareholdings could have changed over time with the subsequent resale of shares, such as in the case of SLT where some employees chose to sell their shares to NTT bringing the employees’ share of the total down to 3.3% and NTT’s share up to 35.2%.
28 See footnote 25.
28
Further evidence of the government prioritizing fiscal considerations over distributional
concerns is seen in the case of the SLT privatization where Nippon Telegraph and
Telephone Corporation (NTT) was given a five-year monopoly in the provision of
international telephony and in the case of the Colombo Gas Company privatization where
the contract specified that Shell Overseas International BV/Royal Dutch (Shell) would be
the only company to undertake Liquefied Petroleum Gas (LPG) business for a five year
exclusive period. The justifications for exclusivity periods, as expanded on in the political
economy section of this paper, range from an attempt to attract “Fortune 500” type
companies in the face of hard budget constraints and poor investor appetite, to the need to
obtain a firm investment commitment from the new owners, to the need to make a
political choice between increased prices (particularly in the case of utilities) and time-
bound exclusivity.
However valid the reasons for exclusivity maybe given the political economy variables
that govern Sri Lanka’s privatization process, the absence of strong and effective
regulatory mechanisms have resulted in the abuse of these “monopoly provisions” with
negative distributional consequences. The numerous examples highlighted in Jayasuriya
and Knight-John (2002) point out the extent to which the monopoly in international
telephony granted to SLT, and its dominance therein, has had unfavorable spillover
effects on consumers and other operators in the industry, given a weak sector regulator.
SLT has for instance refused to acknowledge the Telecom Regulatory Commission
(TRC) decision on interconnection, has repeatedly engaged in call-blocking tactics and
has put obstacles in the way of implementing the numbering plan drawn up by the
Commission to facilitate number portability and remove a potential barrier to entry in the
industry.
The decision to bring in a strategic investor and to hand over management control in
several instances, was based on the premise that a single core investor would show
greater commitment to increasing profitability and efficiency and would also introduce
new technology (particularly in the case of foreign investors) and better management
practices in the privatized entities. However, the non-transparent nature of the tender
29
procedure adopted to select suitable candidates, undermined these positive objectives to a
considerable degree, with anecdotal evidence indicating that those who actually got a
chance to buy enterprises up for sale were the politically well-connected. As such, there
is a strong possibility that more competitive bidders could have been locked out, with
potentially beneficial distributional opportunities also lost in the process.
Two examples of “questionable deals” that have been repeatedly cited in the media and in
public fora are that of the Kotagala Plantation divestiture and the Prima flour milling
operation that spanned the regimes of successive governments from 1977.29 The
controversy in regard to the Kotagala transaction related to the fact that the party that
bought the estate was connected to the law firm retained by PERC to act on their behalf,
raising the possibility that the selected buyer was privy to insider information.
Prima stands out as a unique case of a monopoly where successive governments have
enhanced the concessions handed out by their predecessors. According to the agreement
signed between Prima and the government in 1977, the company was to set up a flour
milling operation and was given a 20-year lease period commencing from the date of
operation of the mill. This was the country’s first Build-Own-Transfer (BOT) project. In
1986, the validity period of this agreement was extended by a further five years and a
monopoly was also created in the flour trade by imposing an import ban on flour and
wheat until 2005 – requiring the government to get the concurrence of Prima to import
flour even in an emergency situation.
The company also had the benefit of a tax holiday during this entire period. According to
the PERC Annual Report 2000, even the personal effects of Prima’s expatriate employees
were exempt from income tax for a five-year period. The controversy regarding the
monopoly rights given to Prima became more complex when the company was found to
be engaging in anti-competitive business practices in the market for chicken feed – a by-
product of wheat grain. Although the new government that came into power in 1994 had
29 More illustrations of the non-transparent nature of the sales process in the First Wave are given in detail in Kelegama(1995).
30
spoken disparagingly of the monopoly rights of the Prima operation, this period saw the
conversion of the BOT project into a Build-Own-Operate (BOO) project and the sale of
the assets of the mill for a price that is considered to be below its market value.
In addition to the distributional bias in terms of opportunity to purchase entities up for
sale, the lack of openness in the sales process has created anti-privatization ripples
amongst the general public, particularly when strategic investors have been foreign
nationals. The case of Sri Lankan Airlines where the incumbent government made
desperate efforts to renegotiate the privatization agreement on the grounds that Emirates
Airlines, the strategic investor, has run down the entity is noteworthy in this regard.
Allegedly, the previous government closed the deal with Emirates in undue haste, paying
insufficient attention to the need to follow transparent divestiture guidelines.
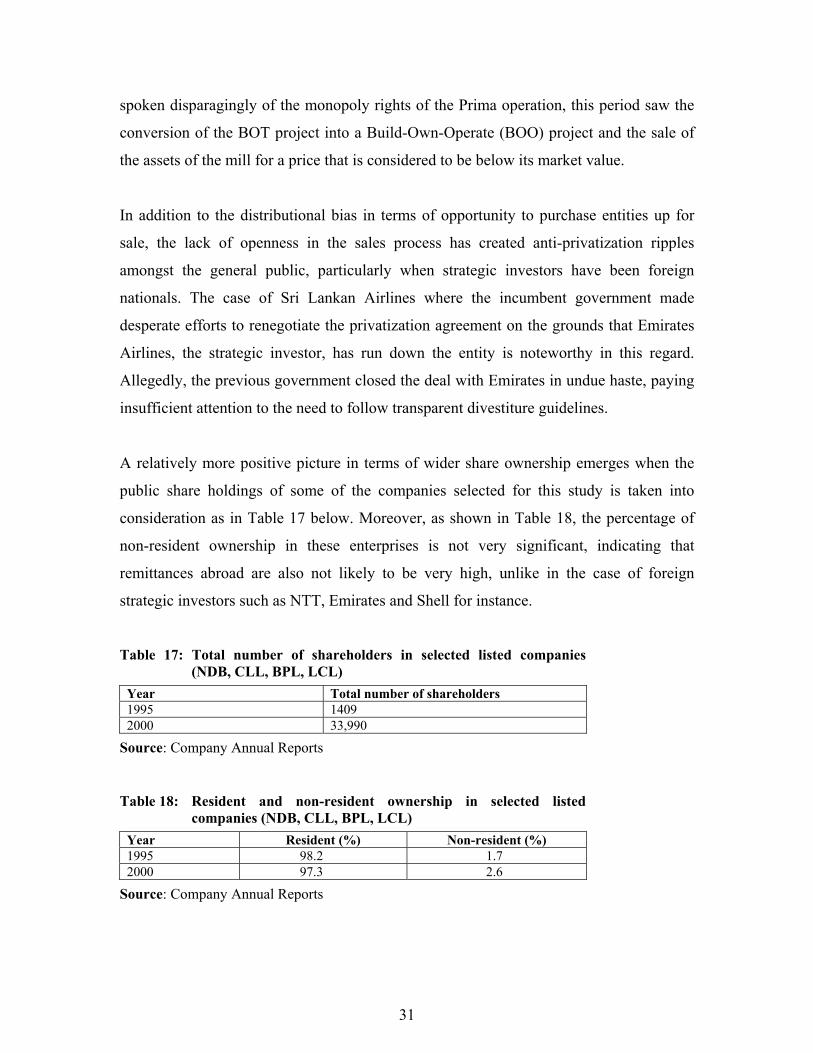
A relatively more positive picture in terms of wider share ownership emerges when the
public share holdings of some of the companies selected for this study is taken into
consideration as in Table 17 below. Moreover, as shown in Table 18, the percentage of
non-resident ownership in these enterprises is not very significant, indicating that
remittances abroad are also not likely to be very high, unlike in the case of foreign
strategic investors such as NTT, Emirates and Shell for instance.
Table 17: Total number of shareholders in selected listed companies (NDB, CLL, BPL, LCL)
Year Total number of shareholders 1995 1409 2000 33,990
Source: Company Annual Reports Table 18: Resident and non-resident ownership in selected listed
companies (NDB, CLL, BPL, LCL) Year Resident (%) Non-resident (%) 1995 98.2 1.7 2000 97.3 2.6
Source: Company Annual Reports
31
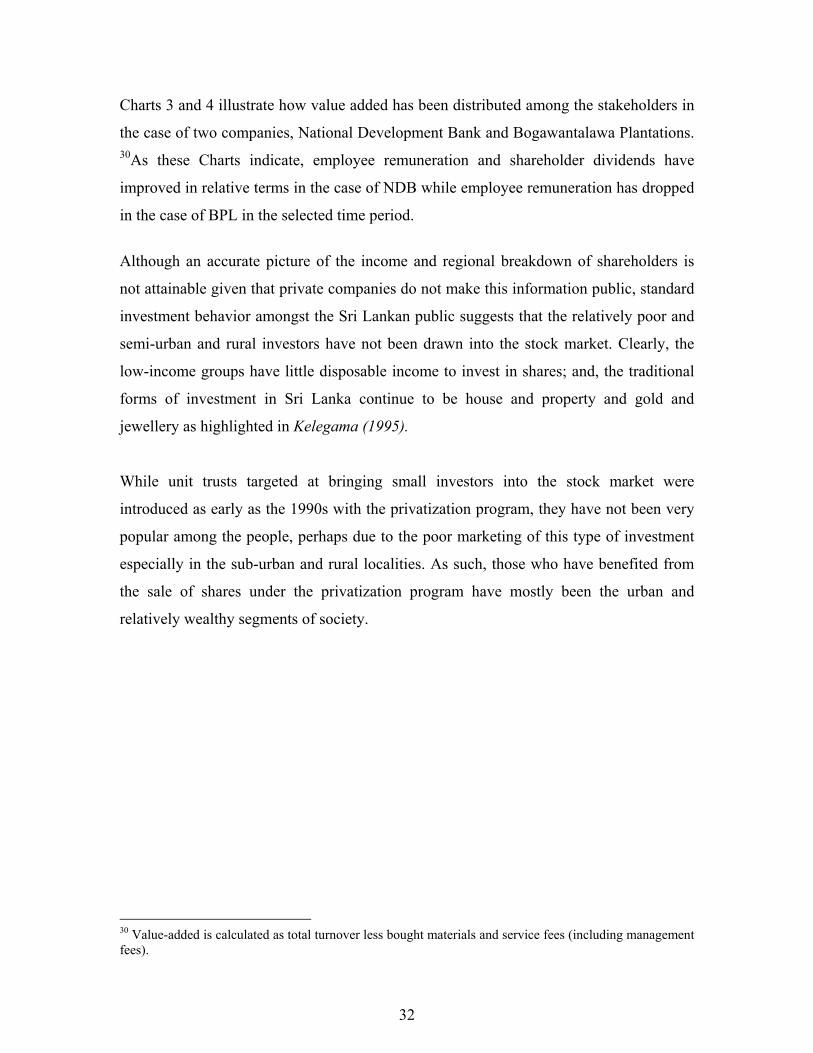
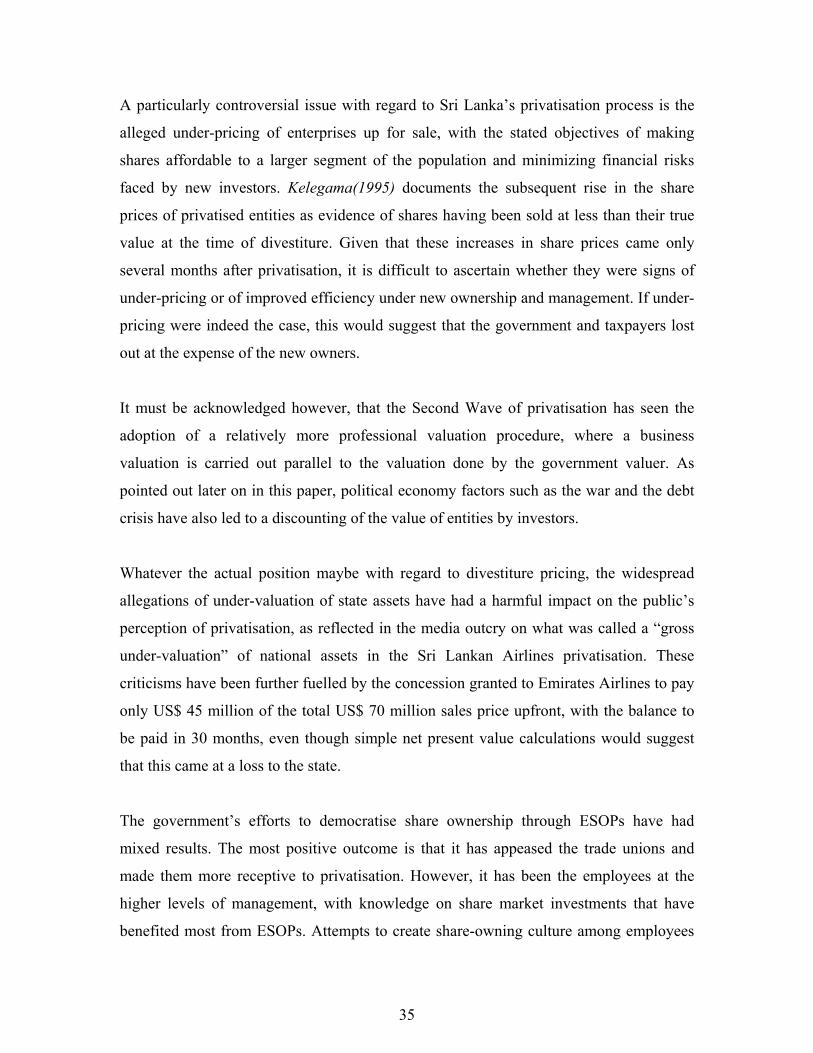
Charts 3 and 4 illustrate how value added has been distributed among the stakeholders in
the case of two companies, National Development Bank and Bogawantalawa Plantations. 30As these Charts indicate, employee remuneration and shareholder dividends have
improved in relative terms in the case of NDB while employee remuneration has dropped
in the case of BPL in the selected time period.
Although an accurate picture of the income and regional breakdown of shareholders is
not attainable given that private companies do not make this information public, standard
investment behavior amongst the Sri Lankan public suggests that the relatively poor and
semi-urban and rural investors have not been drawn into the stock market. Clearly, the
low-income groups have little disposable income to invest in shares; and, the traditional
forms of investment in Sri Lanka continue to be house and property and gold and
jewellery as highlighted in Kelegama (1995).
While unit trusts targeted at bringing small investors into the stock market were
introduced as early as the 1990s with the privatization program, they have not been very
popular among the people, perhaps due to the poor marketing of this type of investment
especially in the sub-urban and rural localities. As such, those who have benefited from
the sale of shares under the privatization program have mostly been the urban and
relatively wealthy segments of society.
30 Value-added is calculated as total turnover less bought materials and service fees (including management fees).
32
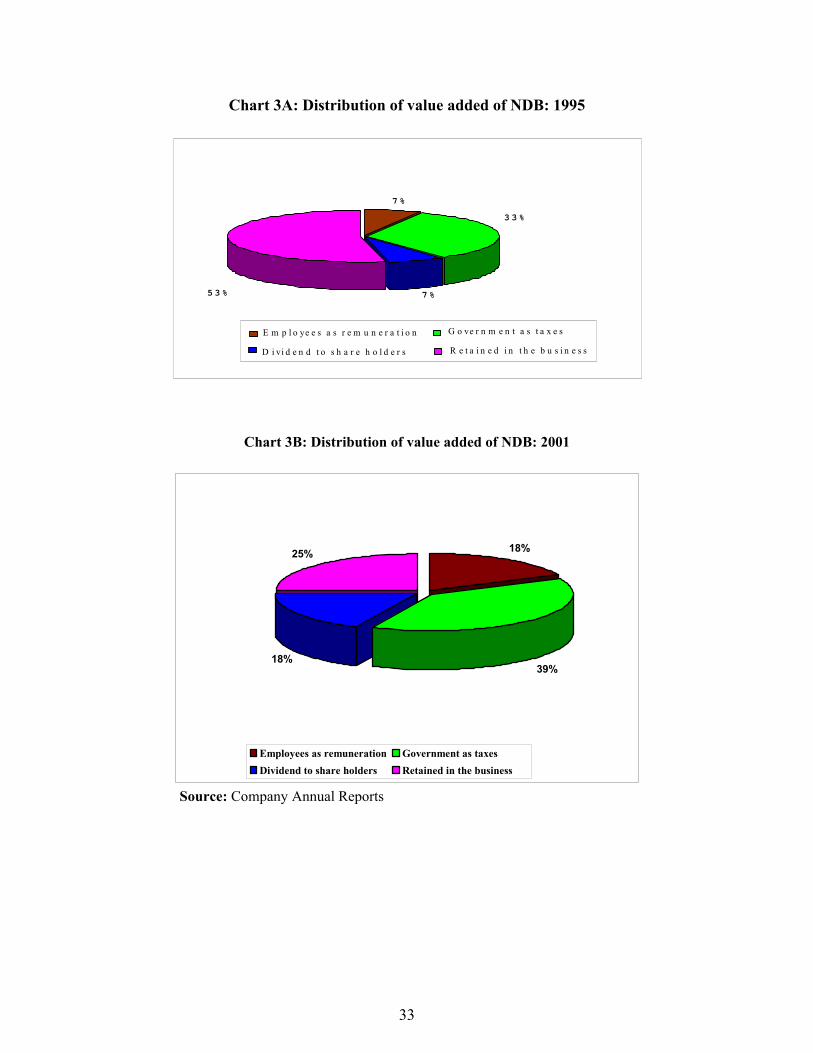
Chart 3A: Distribution of value added of NDB: 1995
7 %
3 3 %
7 % 5 3 %
E m p l o ye e s a s r e m u n e r a t i o n G o ve r n m e n t a s t a x e s
D i vi d e n d t o s h a r e h o l d e r s R e t a i n e d i n t h e b u s i n e s s
Chart 3B: Distribution of value added of NDB: 2001
18%
39%18%
25%
Employees as remuneration Government as taxesDividend to share holders Retained in the business
Source: Company Annual Reports
33
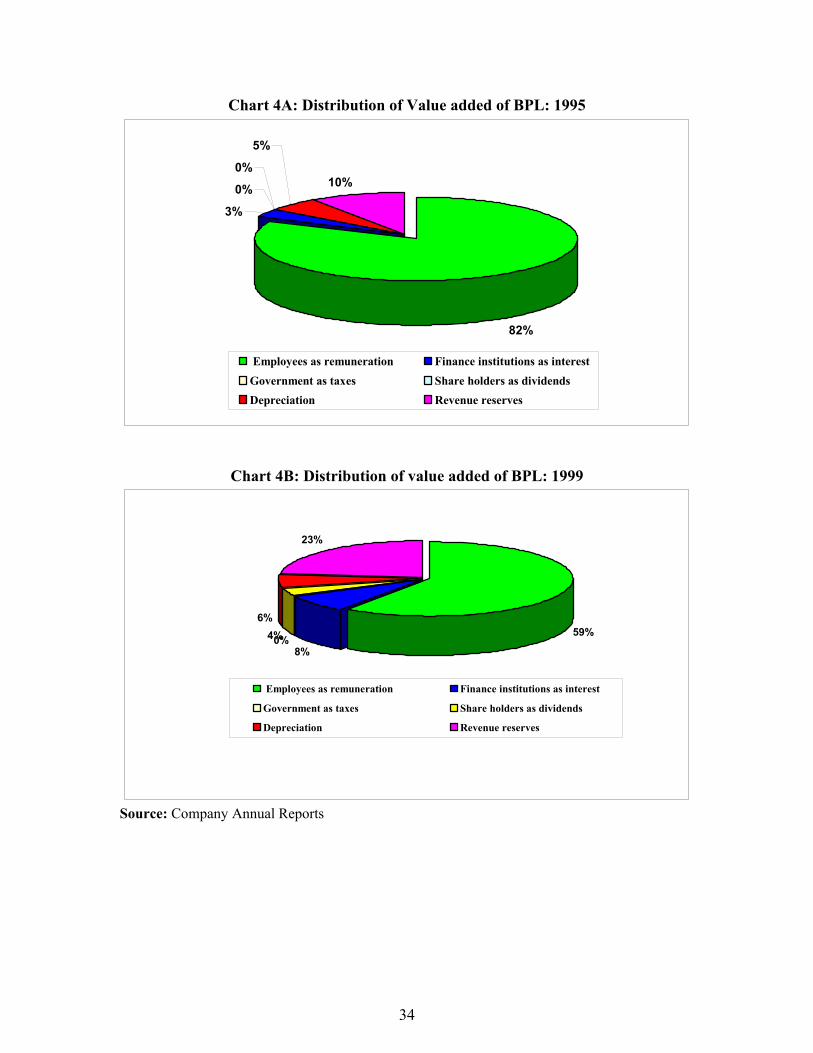
Chart 4A: Distribution of Value added of BPL: 1995
82%
3%
0%
5%
10%0%
Employees as remuneration Finance institutions as interestGovernment as taxes Share holders as dividendsDepreciation Revenue reserves
Chart 4B: Distribution of value added of BPL: 1999
59%
8%0%4%
23%
6%
Employees as remuneration Finance institutions as interest
Government as taxes Share holders as dividends
Depreciation Revenue reserves
Source: Company Annual Reports
34
A particularly controversial issue with regard to Sri Lanka’s privatisation process is the
alleged under-pricing of enterprises up for sale, with the stated objectives of making
shares affordable to a larger segment of the population and minimizing financial risks
faced by new investors. Kelegama(1995) documents the subsequent rise in the share
prices of privatised entities as evidence of shares having been sold at less than their true
value at the time of divestiture. Given that these increases in share prices came only
several months after privatisation, it is difficult to ascertain whether they were signs of
under-pricing or of improved efficiency under new ownership and management. If under-
pricing were indeed the case, this would suggest that the government and taxpayers lost
out at the expense of the new owners.
It must be acknowledged however, that the Second Wave of privatisation has seen the
adoption of a relatively more professional valuation procedure, where a business
valuation is carried out parallel to the valuation done by the government valuer. As
pointed out later on in this paper, political economy factors such as the war and the debt
crisis have also led to a discounting of the value of entities by investors.
Whatever the actual position maybe with regard to divestiture pricing, the widespread
allegations of under-valuation of state assets have had a harmful impact on the public’s
perception of privatisation, as reflected in the media outcry on what was called a “gross
under-valuation” of national assets in the Sri Lankan Airlines privatisation. These
criticisms have been further fuelled by the concession granted to Emirates Airlines to pay
only US$ 45 million of the total US$ 70 million sales price upfront, with the balance to
be paid in 30 months, even though simple net present value calculations would suggest
that this came at a loss to the state.
The government’s efforts to democratise share ownership through ESOPs have had
mixed results. The most positive outcome is that it has appeased the trade unions and
made them more receptive to privatisation. However, it has been the employees at the
higher levels of management, with knowledge on share market investments that have
benefited most from ESOPs. Attempts to create share-owning culture among employees
35
of the privatised enterprises have also been diluted to some extent, by the tendency on the
part of the employees to sell shares in the short term to meet pressing financial
commitments. For instance, as documented in the company Annual Reports, shares held
by employees in SLT and in SLAL stood at 3.3 percent and 5.37 percent, respectively, as
at 2001, in contrast to initial holdings of 3.5 percent and 9 percent, respectively.
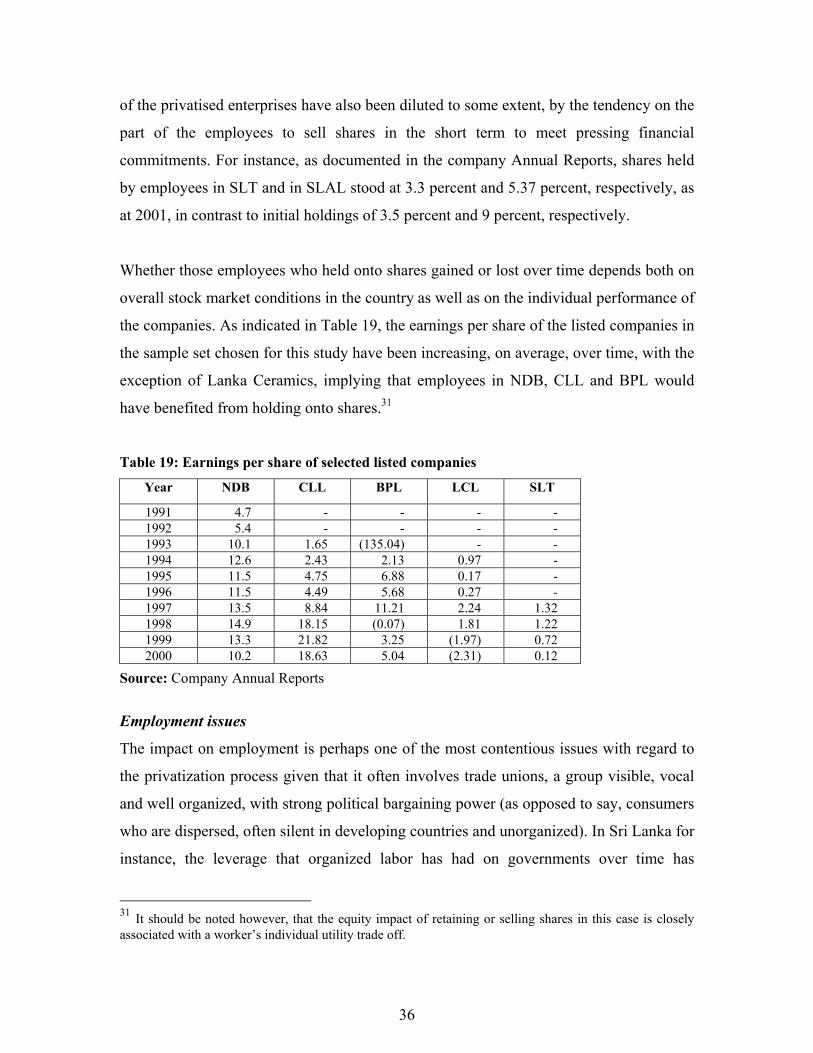
Whether those employees who held onto shares gained or lost over time depends both on
overall stock market conditions in the country as well as on the individual performance of
the companies. As indicated in Table 19, the earnings per share of the listed companies in
the sample set chosen for this study have been increasing, on average, over time, with the
exception of Lanka Ceramics, implying that employees in NDB, CLL and BPL would
have benefited from holding onto shares.31
Table 19: Earnings per share of selected listed companies
Year NDB CLL BPL LCL SLT
1991 4.7 - - - - 1992 5.4 - - - - 1993 10.1 1.65 (135.04) - - 1994 12.6 2.43 2.13 0.97 - 1995 11.5 4.75 6.88 0.17 - 1996 11.5 4.49 5.68 0.27 - 1997 13.5 8.84 11.21 2.24 1.32 1998 14.9 18.15 (0.07) 1.81 1.22 1999 13.3 21.82 3.25 (1.97) 0.72 2000 10.2 18.63 5.04 (2.31) 0.12
Source: Company Annual Reports
Employment issues
The impact on employment is perhaps one of the most contentious issues with regard to
the privatization process given that it often involves trade unions, a group visible, vocal
and well organized, with strong political bargaining power (as opposed to say, consumers
who are dispersed, often silent in developing countries and unorganized). In Sri Lanka for
instance, the leverage that organized labor has had on governments over time has
31 It should be noted however, that the equity impact of retaining or selling shares in this case is closely associated with a worker’s individual utility trade off.
36
contributed in no small way to the over-staffing of SOEs and to the postponement of
public enterprise reforms.
This section analyzes the actual costs and benefits to the labor force with the privatization
program. The principal questions addressed are what are the direct employment effects of
privatization in terms of job losses or gains, how have employees remaining in the
privatized entities benefited from ownership and management change, and what are the
distributional impacts of severance packages given to retrenched workers. We also
consider some of the indirect employment effects of privatization arising from the
location of privatized entities and the impacts of privatization on input suppliers.
Employment concerns are of particular importance in the current macroeconomic climate
in Sri Lanka, where, as outlined earlier on in this paper, there is a relatively high
unemployment rate and a potential social crisis looming ahead with 71 percent of the
unemployed being youth.32
The direct impact of privatization on employment in the eight companies selected for this
study is shown in Table 20 and in Chart 5 below. As indicated in this Table, there has
been a net average job loss of 5419 employees between the pre- and post-privatization
periods. According to the Annual Reports of these companies however, the gross job
reduction was 6432 employees, with only 2533 or 39 percent of these employees being
compensated for their loss.
Of the selected companies, pre-privatization over-employment was reported in the case of
CGCL, CLL, BPL, LCL and LSL. Average labor redundancy was also reported after
privatization in CGCL (55%), BPL (17%) and LCL (45%). Although SLAL did not
report problems of over-employment at the time of privatization, the loss of 50 percent of
its aircraft fleet due to the terrorist attack on Sri Lanka’s international airport in July 2001
led to a downsizing of 1016 employees in 2001 under two voluntary severance schemes.
32 Draft Poverty Reduction Strategy, April 2002.
37
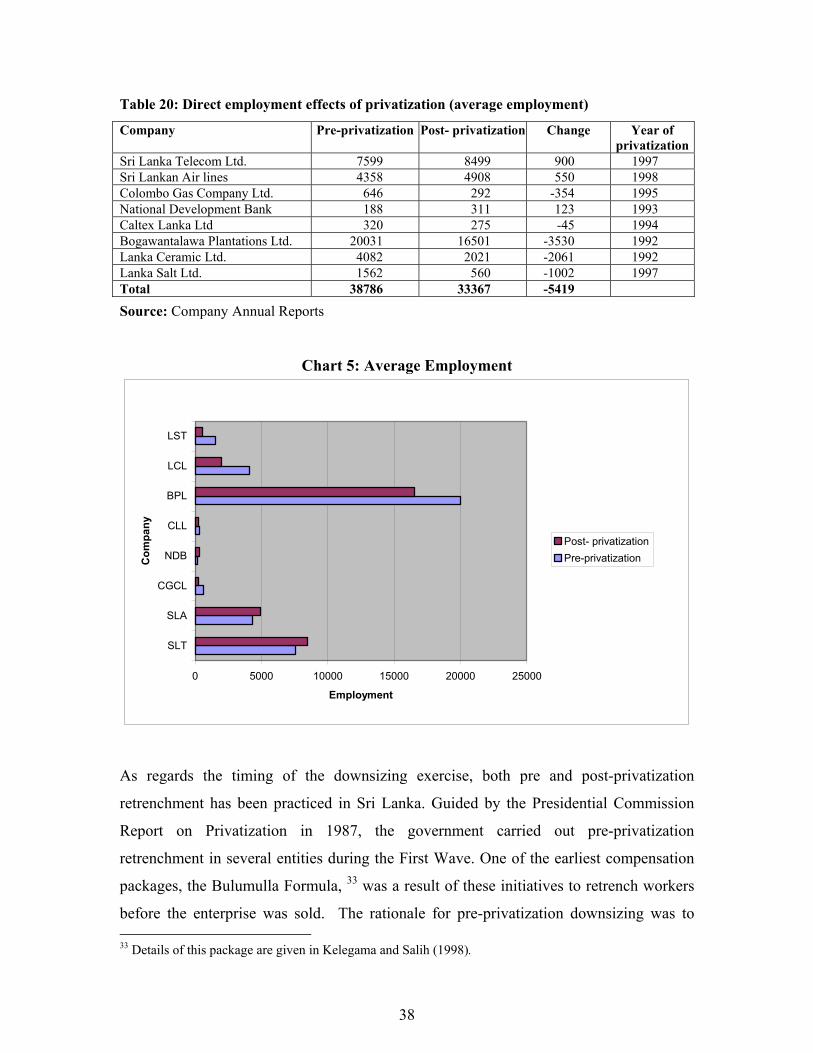
Table 20: Direct employment effects of privatization (average employment)
Company Pre-privatization Post- privatization Change Year of privatization
Sri Lanka Telecom Ltd. 7599 8499 900 1997 Sri Lankan Air lines 4358 4908 550 1998 Colombo Gas Company Ltd. 646 292 -354 1995 National Development Bank 188 311 123 1993 Caltex Lanka Ltd 320 275 -45 1994 Bogawantalawa Plantations Ltd. 20031 16501 -3530 1992 Lanka Ceramic Ltd. 4082 2021 -2061 1992 Lanka Salt Ltd. 1562 560 -1002 1997 Total 38786 33367 -5419
Source: Company Annual Reports
Chart 5: Average Employment
0 5000 10000 15000 20000 25000
SLT
SLA
CGCL
NDB
CLL
BPL
LCL
LST
Com
pany
Employment
Post- privatizationPre-privatization
As regards the timing of the downsizing exercise, both pre and post-privatization
retrenchment has been practiced in Sri Lanka. Guided by the Presidential Commission
Report on Privatization in 1987, the government carried out pre-privatization
retrenchment in several entities during the First Wave. One of the earliest compensation
packages, the Bulumulla Formula, 33 was a result of these initiatives to retrench workers
before the enterprise was sold. The rationale for pre-privatization downsizing was to 33 Details of this package are given in Kelegama and Salih (1998).
38
make the entities more attractive to private investors and to obtain a higher price for the
entity. However, the private owner also had the option of retrenching excess labor by
implementing compensation schemes with the approval of the Commissioner of Labor. In
recent years, the government has tended towards post-privatization retrenchment mainly
because it can no longer afford the large compensation demanded by trade unions.34
Both voluntary and involuntary retrenchment schemes were used prior to May 1992,
when the President pronounced that no worker should lose employment as a direct result
of privatization. After this pronouncement however, voluntary retirement became state
policy. According to Kelegama and Salih (1998), when voluntary retirement took place
before privatization, the government gave workers at least 3 months to make a decision
whereas workers had only 2 to 3 weeks to decide in the post-privatization scenario.
Moreover, anecdotal evidence suggests that involuntary dismissals after privatization
were common occurrences. A mitigating factor in this regard however, is the Termination
of Employment Act of 1971(TEA) which applies only to the private sector, and under
which an employer with 15 or more workers wishing to dismiss an employee with one or
more years of service on non-disciplinary grounds has to get the written consent of the
employee or the approval of the Labor Commissioner, often a time-consuming procedure.
Overall, employees that were retained in the privatized entities have benefited from
improved pay and from better working conditions, partly due to the fact that the
privatization agreements in the Second Wave required the investor to guarantee
employment on the same terms and conditions as before privatization and also because of
increased productivity in several of the entities.35 The companies selected for this study
34 According to Kelegama and Salih (1998), average compensation, excluding gratuity payments, increased from 17.5 months of salary to 53 months of salary for a 40-year-old worker with 20 years service, between 1987 and 1997. 35 However, a factor that needs to be taken into account when comparing the terms and conditions of workers in SOEs with those of workers in private companies is that SOE workers are given pensions after retirement which can be accessed on a monthly basis, while private company workers have provident fund schemes where the total amount can be withdrawn in one go. From a life-cycle (and smoothing out consumption over time) perspective, the option of one-time withdrawal may not be necessarily beneficial to the worker.
39
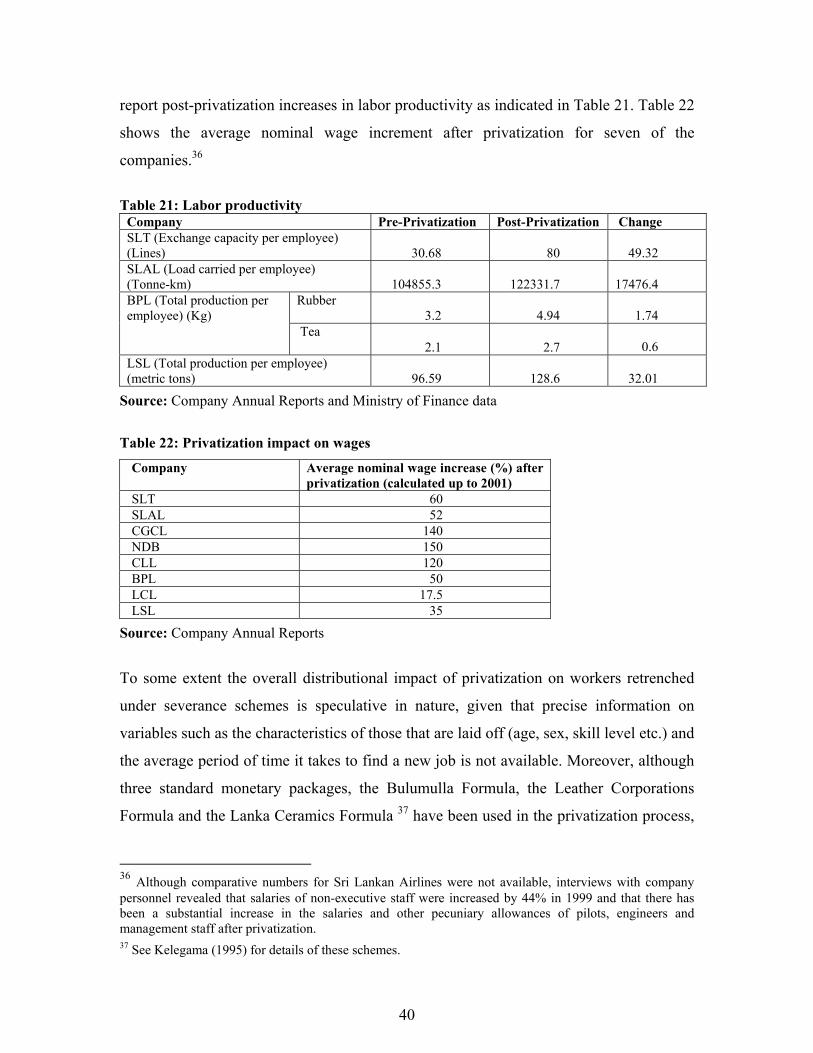
report post-privatization increases in labor productivity as indicated in Table 21. Table 22
shows the average nominal wage increment after privatization for seven of the
companies.36
Table 21: Labor productivity
Company Pre-Privatization Post-Privatization Change SLT (Exchange capacity per employee) (Lines) 30.68 80
49.32
SLAL (Load carried per employee) (Tonne-km) 104855.3 122331.7
17476.4
Rubber 3.2 4.94
1.74
BPL (Total production per employee) (Kg) Tea
2.1 2.7
0.6 LSL (Total production per employee) (metric tons) 96.59 128.6
32.01
Source: Company Annual Reports and Ministry of Finance data
Table 22: Privatization impact on wages
Company Average nominal wage increase (%) after privatization (calculated up to 2001)
SLT 60 SLAL 52 CGCL 140 NDB 150 CLL 120 BPL 50 LCL 17.5 LSL 35
Source: Company Annual Reports
To some extent the overall distributional impact of privatization on workers retrenched
under severance schemes is speculative in nature, given that precise information on
variables such as the characteristics of those that are laid off (age, sex, skill level etc.) and
the average period of time it takes to find a new job is not available. Moreover, although
three standard monetary packages, the Bulumulla Formula, the Leather Corporations
Formula and the Lanka Ceramics Formula 37 have been used in the privatization process,
36 Although comparative numbers for Sri Lankan Airlines were not available, interviews with company personnel revealed that salaries of non-executive staff were increased by 44% in 1999 and that there has been a substantial increase in the salaries and other pecuniary allowances of pilots, engineers and management staff after privatization. 37 See Kelegama (1995) for details of these schemes.
40
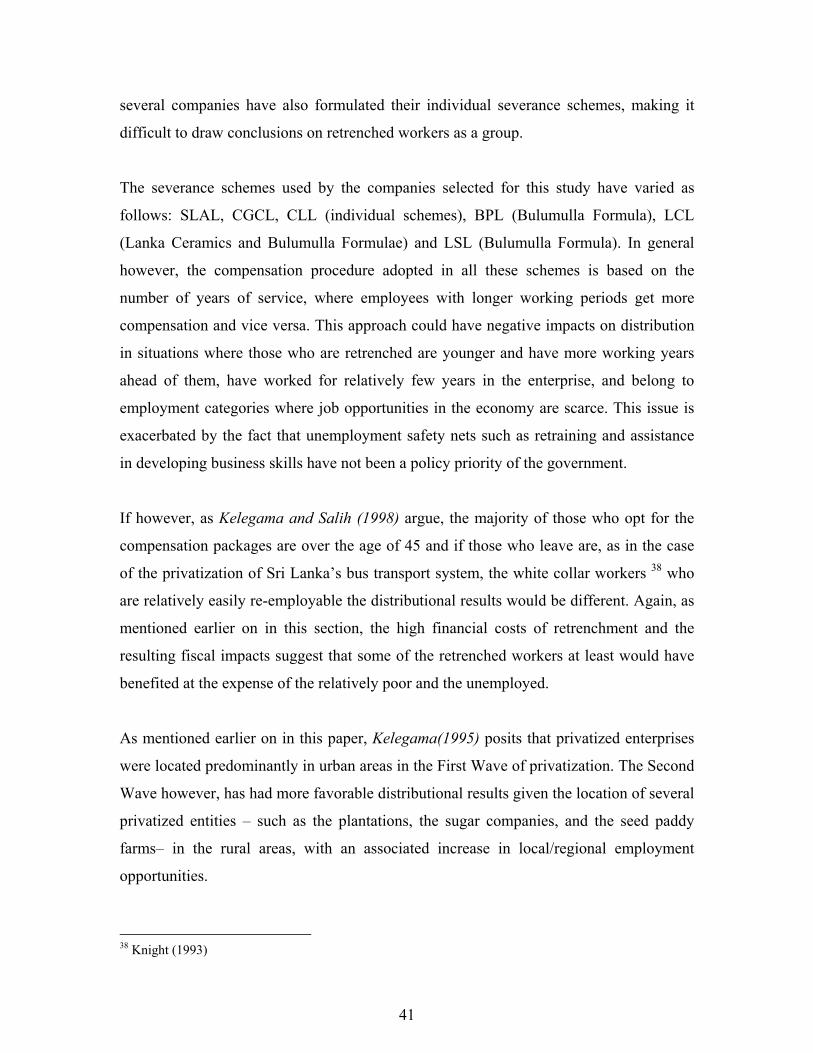
several companies have also formulated their individual severance schemes, making it
difficult to draw conclusions on retrenched workers as a group.
The severance schemes used by the companies selected for this study have varied as
follows: SLAL, CGCL, CLL (individual schemes), BPL (Bulumulla Formula), LCL
(Lanka Ceramics and Bulumulla Formulae) and LSL (Bulumulla Formula). In general
however, the compensation procedure adopted in all these schemes is based on the
number of years of service, where employees with longer working periods get more
compensation and vice versa. This approach could have negative impacts on distribution
in situations where those who are retrenched are younger and have more working years
ahead of them, have worked for relatively few years in the enterprise, and belong to
employment categories where job opportunities in the economy are scarce. This issue is
exacerbated by the fact that unemployment safety nets such as retraining and assistance
in developing business skills have not been a policy priority of the government.
If however, as Kelegama and Salih (1998) argue, the majority of those who opt for the
compensation packages are over the age of 45 and if those who leave are, as in the case
of the privatization of Sri Lanka’s bus transport system, the white collar workers 38 who
are relatively easily re-employable the distributional results would be different. Again, as
mentioned earlier on in this section, the high financial costs of retrenchment and the
resulting fiscal impacts suggest that some of the retrenched workers at least would have
benefited at the expense of the relatively poor and the unemployed.
As mentioned earlier on in this paper, Kelegama(1995) posits that privatized enterprises
were located predominantly in urban areas in the First Wave of privatization. The Second
Wave however, has had more favorable distributional results given the location of several
privatized entities – such as the plantations, the sugar companies, and the seed paddy
farms– in the rural areas, with an associated increase in local/regional employment
opportunities.
38 Knight (1993)
41
Privatization has not been very beneficial to input suppliers whose linkages with SOEs
were severed after divestiture. In instances where the new sourcing arrangements were
for reasons of efficiency however, one might argue that the broader distributional effects
of these shifts would be positive. Kelegama (1997 b) cites the cases of the Distilleries
Corporation, which shifted its purchase of sugar inputs from the Sevanagala Sugar
Corporation to imports from South Africa and Puttalam Cement, which stopped
purchasing sacks from Colombo sack makers after privatization as illustrations of this
point.
Prices and access impacts
This section focuses on how privatization has affected consumers in terms of
affordability, access and quality. Given that distributional issues are of particular
relevance in the utilities sector, questions such as what has happened to prices after
privatization and why and has there been service expansion and in which localities are
explored with regard to the telecommunications and LPG sector privatizations in Sri
Lanka.
As documented in Jayasuriya and Knight-John (2002), SLT’s international tariffs came
down by 8 percent in 1998 and in 1999 while a rate rebalancing agreement was arrived at
with the government to raise domestic tariffs so as to increase domestic revenue in five
stages between 1998 and 2002 as follows: 1998 and 1999: 25%; 2000: 20%; 2001 and
2002:15%. Behavior patterns in the fixed telecom market indicate that the other fixed
telephony operators also tend to follow the tariff rates set by SLT, the market leader
(which controls around 85 percent of the fixed access market).
Although there is a sound economic argument for rate rebalancing, the fact that most
fixed-access customers subscribe to domestic call services and that only a small
proportion (and that too the relatively wealthy) have access to international direct dialing
services implies that the distributional fallout of rate rebalancing is negative. Price issues
in the telecommunications market have been exacerbated by the five-year monopoly on
international telephony given to SLT under the privatization agreement, which has kept
42
tariff rates in the international segment above competitive rates and stifled the growth of
other sub-sectors, such as Internet services, that could have a positive impact on rural
connectivity.
Post-privatization price hikes have also been recorded in the LPG market where the
average unit price of LPG went from Rs.18 per kg before privatization to Rs.27.8 per kg
after privatization in 1995, an increase of around 54 percent. Unlike in the pre-
privatization period where global price increases were absorbed by the state entity, Shell
passed on these increases to the consumer. However, given that middle and high-income
groups account for around 92 percent of total LPG consumption in the country (and that
the penetration of LPG among Sri Lankan households is only around 20 percent, with 80
percent still using kerosene and firewood for cooking) the distributional impact of price
increases on the relatively poor is not very significant.
CGCL company representatives cite high import dependence (of almost 90 percent of
domestic LPG requirements), the increase in international LPG prices and the devaluation
of the rupee as the main reason for these price hikes. The cost components of the LPG
tariff include the following: product cost (FOB), freight and insurance, terminal
throughput fee, company recovery, distributor and dealer margin and taxes and duties to
the government. The cost of LPG is exogenous – based on the Saudi Aramco contract
that is indexed to spot prices of crude and other oil products.
However prices did come down with another player entering the market in 2001/2002,
consequent to the ending of the five-year exclusive period under the privatization
agreement where Shell had a monopoly on LPG business, raising concerns that the
absence of competition had played a significant role in the price increases.
Representatives of Shell argue, perhaps justifiably so, that its competitor is able to sell its
product at a lower price since it purchases LPG from the Ceylon Petroleum Corporation
(CPC) at subsidized rates. Whatever the actual case maybe with regard to the pricing
issue, there has been a public outcry with regard to this transaction with opponents of the
privatization process citing the Shell deal to defend their stance.
43
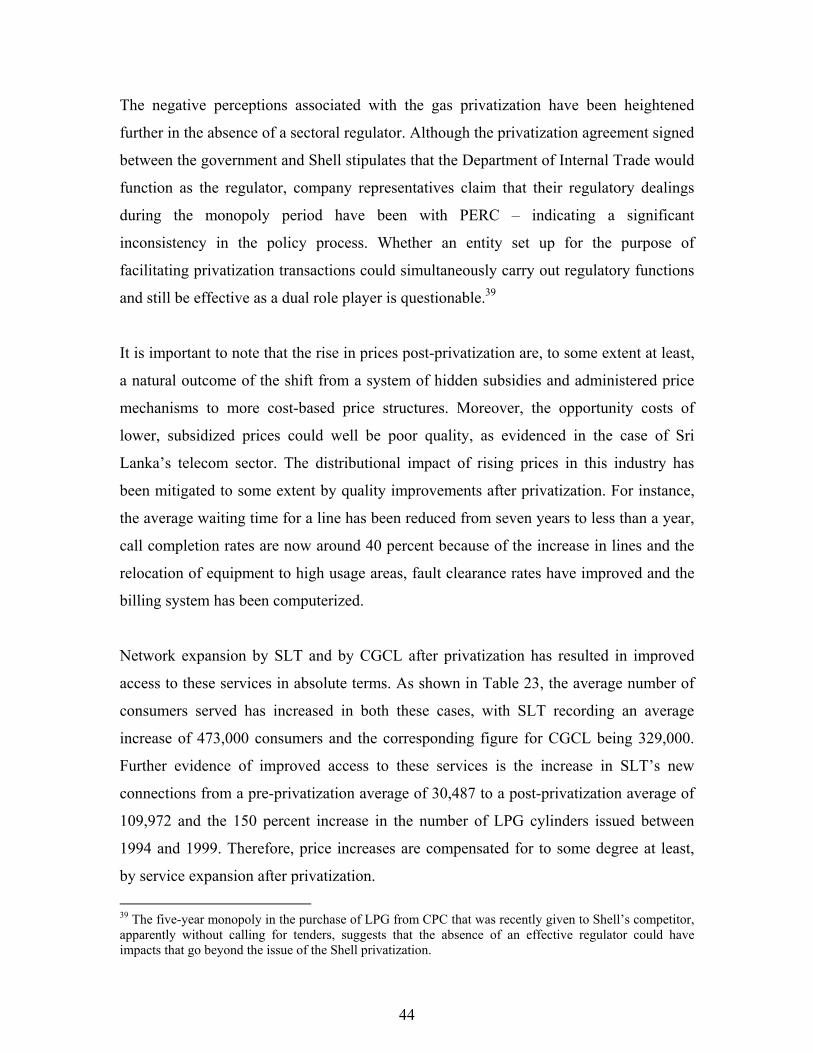
The negative perceptions associated with the gas privatization have been heightened
further in the absence of a sectoral regulator. Although the privatization agreement signed
between the government and Shell stipulates that the Department of Internal Trade would
function as the regulator, company representatives claim that their regulatory dealings
during the monopoly period have been with PERC – indicating a significant
inconsistency in the policy process. Whether an entity set up for the purpose of
facilitating privatization transactions could simultaneously carry out regulatory functions
and still be effective as a dual role player is questionable.39
It is important to note that the rise in prices post-privatization are, to some extent at least,
a natural outcome of the shift from a system of hidden subsidies and administered price
mechanisms to more cost-based price structures. Moreover, the opportunity costs of
lower, subsidized prices could well be poor quality, as evidenced in the case of Sri
Lanka’s telecom sector. The distributional impact of rising prices in this industry has
been mitigated to some extent by quality improvements after privatization. For instance,
the average waiting time for a line has been reduced from seven years to less than a year,
call completion rates are now around 40 percent because of the increase in lines and the
relocation of equipment to high usage areas, fault clearance rates have improved and the
billing system has been computerized.
Network expansion by SLT and by CGCL after privatization has resulted in improved
access to these services in absolute terms. As shown in Table 23, the average number of
consumers served has increased in both these cases, with SLT recording an average
increase of 473,000 consumers and the corresponding figure for CGCL being 329,000.
Further evidence of improved access to these services is the increase in SLT’s new
connections from a pre-privatization average of 30,487 to a post-privatization average of
109,972 and the 150 percent increase in the number of LPG cylinders issued between
1994 and 1999. Therefore, price increases are compensated for to some degree at least,
by service expansion after privatization.
39 The five-year monopoly in the purchase of LPG from CPC that was recently given to Shell’s competitor, apparently without calling for tenders, suggests that the absence of an effective regulator could have impacts that go beyond the issue of the Shell privatization.
44
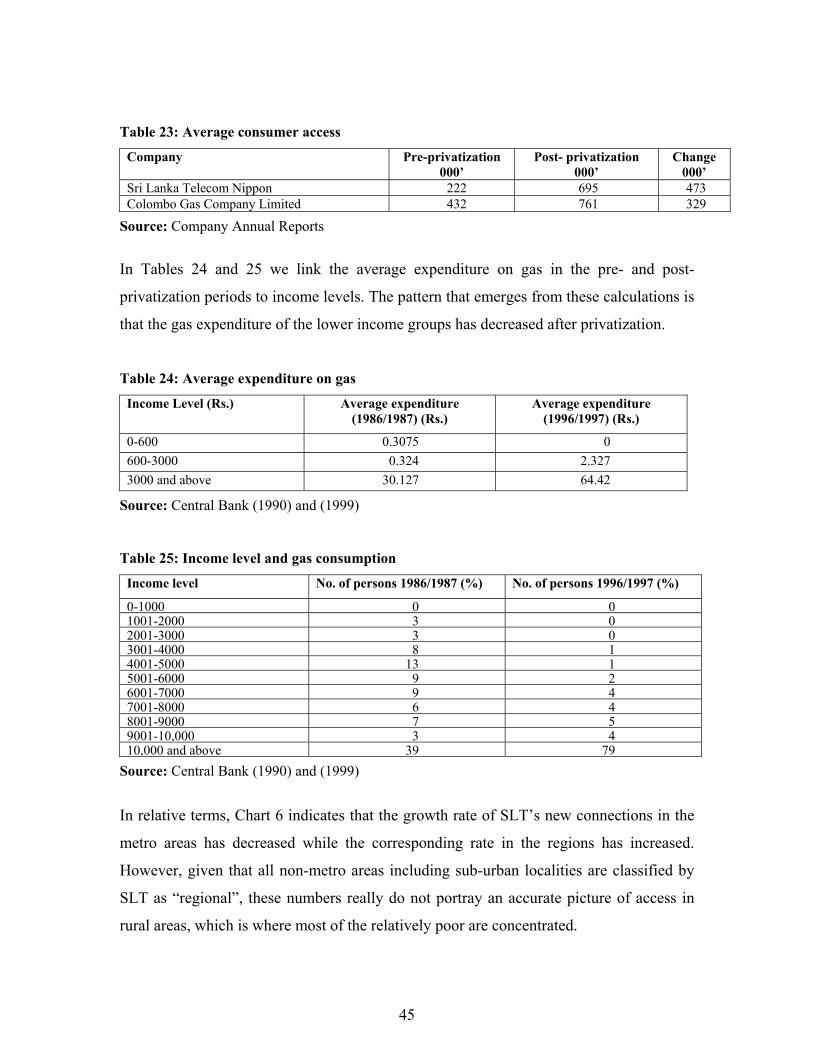
Table 23: Average consumer access
Company Pre-privatization 000’
Post- privatization 000’
Change 000’
Sri Lanka Telecom Nippon 222 695 473 Colombo Gas Company Limited 432 761 329
Source: Company Annual Reports
In Tables 24 and 25 we link the average expenditure on gas in the pre- and post-
privatization periods to income levels. The pattern that emerges from these calculations is
that the gas expenditure of the lower income groups has decreased after privatization.
Table 24: Average expenditure on gas
Income Level (Rs.) Average expenditure (1986/1987) (Rs.)
Average expenditure (1996/1997) (Rs.)
0-600 0.3075 0 600-3000 0.324 2.327 3000 and above 30.127 64.42
Source: Central Bank (1990) and (1999)
Table 25: Income level and gas consumption
Income level No. of persons 1986/1987 (%) No. of persons 1996/1997 (%)
0-1000 0 0 1001-2000 3 0 2001-3000 3 0 3001-4000 8 1 4001-5000 13 1 5001-6000 9 2 6001-7000 9 4 7001-8000 6 4 8001-9000 7 5 9001-10,000 3 4 10,000 and above 39 79
Source: Central Bank (1990) and (1999)
In relative terms, Chart 6 indicates that the growth rate of SLT’s new connections in the
metro areas has decreased while the corresponding rate in the regions has increased.
However, given that all non-metro areas including sub-urban localities are classified by
SLT as “regional”, these numbers really do not portray an accurate picture of access in
rural areas, which is where most of the relatively poor are concentrated.
45
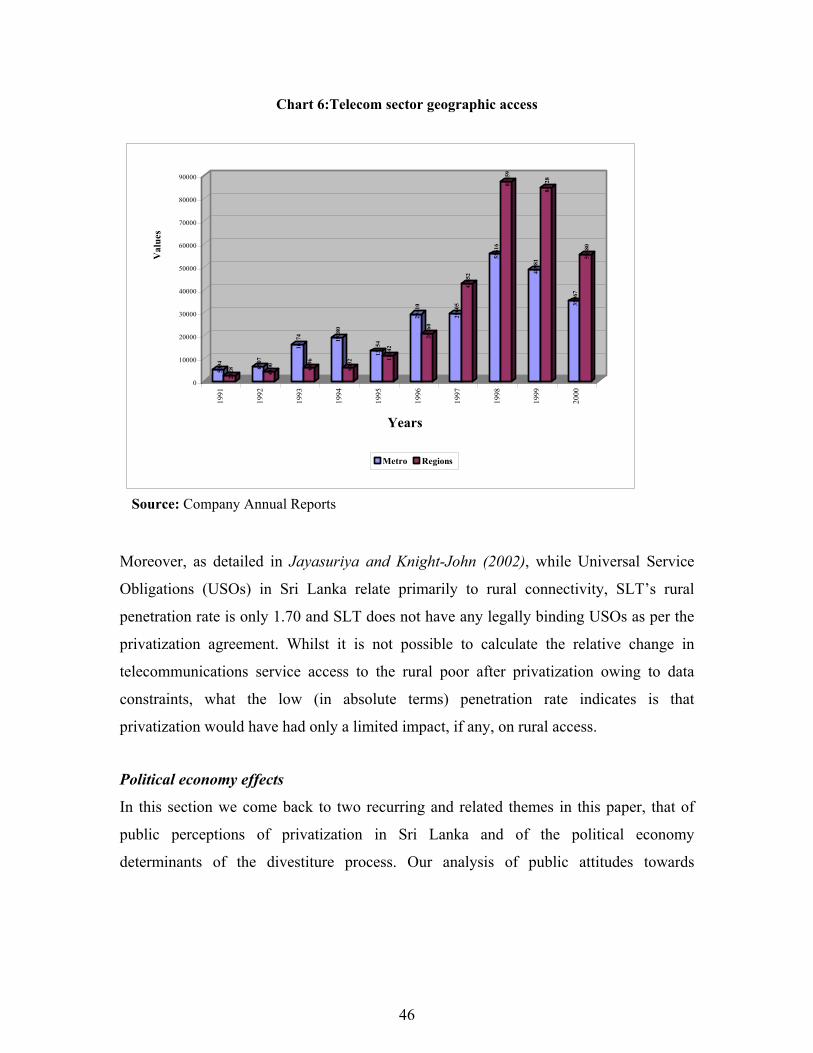
Chart 6:Telecom sector geographic access
Source: Company Annual Reports
5094
2328 65
07
4100
1617
4
6096
1928
0
6032
1315
4
1104
2
2941
0
2076
0
2960
5
4285
2
5561
6
8745
9
4898
1
8472
8
3506
7
5558
0
0
10000
20000
30000
40000
50000
60000
70000
80000
90000
Val
ues
1991
1992
1993
1994
1995
1996
1997
1998
1999
2000
Years
Metro Regions
Moreover, as detailed in Jayasuriya and Knight-John (2002), while Universal Service
Obligations (USOs) in Sri Lanka relate primarily to rural connectivity, SLT’s rural
penetration rate is only 1.70 and SLT does not have any legally binding USOs as per the
privatization agreement. Whilst it is not possible to calculate the relative change in
telecommunications service access to the rural poor after privatization owing to data
constraints, what the low (in absolute terms) penetration rate indicates is that
privatization would have had only a limited impact, if any, on rural access.
Political economy effects
In this section we come back to two recurring and related themes in this paper, that of
public perceptions of privatization in Sri Lanka and of the political economy
determinants of the divestiture process. Our analysis of public attitudes towards
46
privatization draws from a study commissioned by the World Bank in 2001. 40 Some of
the more salient findings that emerge from this study are summarized as follows.
The study claims that the opponents of privatization have figured more prominently in
the public debate and that there have been reservations with regard to the process –
particularly on issues such as the sales price of entities, exclusivity provisions, and labor
retrenchment – even amongst its supporters. Strong ideological feelings of national pride
combined with a lack of awareness about the program among the general public and a
lack of procedural transparency, provide an excellent opportunity for the politicization of
issues and for the whipping up of anti-privatization sentiments by vested interests. .
According to the survey results contained in the study, most people in the country had
heard of the term privatization but were very pessimistic about it – over 50 percent felt
that social life and economic stability had deteriorated with privatization and over 80
percent felt that privatization would have a negative impact on poverty and living
standards. While only about 60 percent and 50 percent of the respondents knew about the
telecom and bus privatizations, respectively, as many as 50 percent thought that the
electricity sector was already privatized. The only exception with regard to the level of
awareness was in the case of the gas privatization, of which over 80 percent of the
respondents were aware – perhaps because the controversial issue of Shell gas prices has
been constantly highlighted in the media since the divestiture of the entity.
The survey results on the rationale for privatization in Sri Lanka point to some interesting
conclusions. The reasons for privatization ranged from donor pressure (SLT), to the
government escaping from mismanagement and a loss-making situation (Sri Lankan
Airlines, Shell), to formulating an exercise in “peoplization” (buses). The telecom
privatization was seen to have brought about better service and access – thought to be a
fair trade-off for the increased prices. While the bus privatization was considered to have
improved service and access to some extent, it was also noted that service quality and
consumer welfare were affected by the lack of well-defined procedures and discipline in
40 “Communications for Privatization in Sri Lanka: Audit Report and Draft Strategy”, April 2001.
47
the sector. The privatization of Sri Lankan Airlines was thought to be disadvantageous to
the country. In general, price increases and loss of job security were viewed as the most
problematic outcomes of privatization.
With regard to future plans for privatization, over 60 percent of the respondents opposed
the sale of ports, banks; over 50 percent opposed that of the insurance sector; and, over
70 percent opposed the divestiture of electricity, water and railways. This is clearly not a
favorable scenario in view of the fact that all these sectors are included in the
government’s privatization pipeline in the immediate future.
The reasons for the viewpoints that come out of this very instructive study become
clearer as we explore the different reactions to privatization amongst the various
stakeholders involved in the process. In general, perceptions and reactions are shaped by
what one stands to gain or lose through the reform process. In this analysis we also
attempt to tease out the political economy factors that have influenced the privatization
process in one way or another.
Not surprisingly, the most enthusiastic promoters of privatization have been the relatively
well-connected with the opportunity to purchase (possibly under-priced) state assets in a
process, which, as highlighted in previous sections of this paper, has been tainted with a
lack of transparency. The promise of continued rents from the handing out of exclusivity
provisions under many privatization agreements in the Second Wave has further
strengthened support from this favored group.
In general, labor has not been very supportive of the privatization process, given the
guarantee of job security in SOEs and the perception, cultivated over years of heavy
government intervention in the economy, of a benefactor state. The presence of
vociferous trade unions with strong bargaining power and the ability to create industrial
unrest has prompted the government to introduce several measures, such as the ESOPs
48
and retrenchment packages discussed above, to placate workers, very often at high
financial costs to the state.41
Consumers tend to be perceived as the “silent majority” who lose out from privatization,
particularly in the services and utilities sectors. To the general public, price hikes after
privatization stand out as the most tangible impact of ownership change and as proof of a
relative decline in welfare. Although direct lobbying on the part of consumers has been
minimal in the absence of organized consumer groups, their case has often been taken up
by the media, a very strong critic of the privatization process in Sri Lanka
In spite of the adverse media coverage given to the privatization program, particularly in
the Second Wave, (which coincided with the time when media freedom also became
more of a reality in Sri Lanka), there appears to be little commitment towards making the
process less opaque or paying genuine attention to equity concerns. The apparent
willingness on the part of the government to sustain monopolies and impose regulatory
restrictions hindering post-privatization competition, as in the case of SLT and Shell,
might suggest that the huge prospects for rent extraction have not been lost on politicians
and their favored supporters.
Having said that however, it is also useful at this point to reflect on some of the
procedural political economy factors that have contributed to the handing out of
exclusivity provisions and to the under-pricing of entities to be privatized. Whilst such
deals cannot be considered optimal on an absolute scale, the following examples shed
some light on the ground realities and the political economy trade-offs that confront
implementers in the negotiation process. Both the Shell and the telecom transactions, for
instance, were negotiated at a time when terrorist attacks were rampant in the country;
there were only three takers for the national airline of which only one was a company that
actually ran an airline; and, it was mandatory for all new owners of all privatized
companies to provide ESOPs and retain all workers.
41 A unique (and successful in terms of worker cooperation) procedure was followed in the case of the SLT divestiture where PERC corresponded directly with the families of the workers informing them about the benefits of privatization.
49
As mentioned earlier on in this paper, multinational companies often drive a hard bargain
with developing country governments facing budget constraints and in dire need of
foreign investment, demanding various exclusivities, barriers to entry and pricing
practices. A case in point is that of the SLT privatization where NTT set out a political
choice of scenarios where, for instance, a three-year monopoly entailed an immediate
price hike and a five-year monopoly a phased out price hike.
A closer look at the history of weak regulation that has paralleled the privatization
process leads us to three conclusions: that the government took a deliberate decision to
adopt a hands-off policy in order to attract private investment; that weak regulation
allowed for rent-seeking behavior; and that the pace of privatization required by the IMF
and the World Bank did not allow for a proper sequencing of events where the setting up
of an effective regulatory framework would precede divestiture.
What is conspicuous in regard to Sri Lanka’s privatization program over time is that it
has lacked ownership, with the political leadership either reluctant to take tough decisions
due to other political priorities such as the need for coalition building, giving out
conflicting signals, or reversing or making ad hoc changes in the process entered into by
a predecessor government. Such conditions are fertile ground for vested interests out to
hijack the privatization process or engage in rent-seeking activities that deflect the
beneficial impacts of privatization. As of now, the most raucous opponents of the process
have largely been from the political parties outside of the government. In general
however, the program has not provoked widespread social opposition, perhaps because
those who stand to lose the most from privatization are also those who are least able to
voice their protests. The question is how long will it be before the process backfires and
widespread social turbulence makes reform no longer possible.
5. Conclusion
What emerges from this analysis of the divestiture program in Sri Lanka is that it has not
done enough to maximize distributional gains or minimize distributional losses that come
out of privatization. Overall, the relatively poor have had little or no access to the gains
50
from privatization while the well-connected (both local and foreign), who tend to be from
the higher income groups, have benefited from the increase in rent-seeking opportunities
under a non-transparent divestiture process.
The sincerity of the government’s commitment to distributional ends appears to be
questionable with fiscal objectives and the maximization of sales revenues through the
perpetuation of monopolies under privatization agreements being prioritized over an
equitable distribution of assets. Moreover, as seen in several instances recounted above,
the government has displayed little genuine concern with regard to the absence of
effective post-privatization regulation and the prevalence of poor regulatory governance
that have facilitated rent-seeking activities in privatized entities.
Clearly, it is time to rethink and reorient privatization in Sri Lanka. If the process
continues in the same vein as it has up to now, there is little doubt that the concept of
privatization per se (rather than the manner in which it has been implemented in Sri
Lanka) will be blamed for the socio-economic problems that the deprived face. This
would be rather unfortunate given that the alternative to privatization, a return to a state
controlled system, would not be an improvement in any sense with the high recorded
levels of inefficiency in state enterprises and the opportunities for rent-seeking that exist
within these entities.
The issue then is, how to make privatization work in an institutionally weak setting and
where competition polices are absent. More fundamental and related questions are, how
willing is the government to reorient the process and what are the political incentives to
do so. Up to now the political incentives to make privatization a more equitable process
have been absent and politicians have been able to put distributional concerns on the
back-burner. However, the worsening of macroeconomic conditions in the country and
the unstable social and political climate suggest that the day of reckoning may not be too
far off.
51
References Arunatilake, N. Jayasuriya, S. and Kelegama, S. 2001 . “The Economic Cost of the War in Sri Lanka”, World Development Vol 29, No.9. Birdsall, Nancy and Nellis,John. 2002. Winners and Losers: Assessing the Distributional Impact of Privatization. Washington D.C.: Center for Global Development. Bogawantalawa Plantations Ltd. Various years. Annual Report. Colombo: BPL. Caltex Lanka Ltd. Various years. Annual Report. Colombo: CLL. Central Bank of Sri Lanka. 2001a and various years. Annual Report. Colombo: Central Bank. Central Bank of Sri Lanka. 2001b. Economic and Social Statistics of Sri Lanka. Colombo: Central Bank. Central Bank of Sri Lanka. 1999.Report on Consumer Finances and Socio Economic Survey Sri Lanka 1996/1997. Colombo: Central Bank. Central Bank of Sri Lanka. 1990.Report on Consumer Finances and Socio Economic Survey Sri Lanka 1986/1987. Colombo: Central Bank. Central Bank of Sri Lanka. 1998. Economic Progress of Independent Sri Lanka 1948-1998. Colombo: Central Bank. Colombo Stock Exchange. Various years. A Hand Book of Listed Companies. Colombo: CSE.
Crowe, Paul and de Soysa, Aneela. 1995. Impact of Privatization in Sri Lanka, a study conducted for USAID. IMF. 2000. Fiscal and Macroeconomic Impact of Privatization. Washington DC: IMF Jayasuriya, Sisira and Knight-John, Malathy. 2002. Sri Lanka’s Telecommunications Industry: From Privatization to Anti-Competition? Working Paper No.14, Manchester: Centre on Regulation and Competition, University of Manchester. Kelegama, Saman. 1997a. “Privatization and the Public Exchequer: Some Observations from the Sri Lankan Experience”, Asia Pacific Development Journal, Vol. 4, No.1.
52
Kelegama, Saman.1997b. “Privatization: An Overview of the Process and Issues” in W.D.Lakshman (ed.) Dilemmas of Development: Fifty Years of Economic Change in Sri Lanka. Colombo: Sri Lanka Association of Economists. Kelegama, Saman. 1995. “The Impact of Privatization on Distributional Equity” in V.V.Ramanadham (ed.) Distributional Aspects of Privatization in Developing Countries. London: Routledge. Kelegama, Saman and Salih, Rozana. 1998. “Labour Retrenchment in a Privatization Programme: The Sri Lankan Experience”, Sri Lanka Journal of Social Sciences 1998, Vol. 21, No.1 & 2. Knight-John, Malathy. (ed.) 2002. Competition Policy and Utility Regulation in Sri Lanka: The Sri Lankan Experience. Colombo: Law & Society Trust. Knight-John, Malathy. 1995. Privatization in a Developing Country: The Sri Lankan Experience, paper presented at the Asian Productivity Organization symposium on Privatization, Bangkok, July 1995. Knight, Malathy. 1993. Privatization and Sri Lanka’s Bus Transport Policy, paper presented at the National Conference on Law and Economy, Law & Society Trust, Colombo, July 1993. Lanka Ceramics Ltd. Various years. Annual Report. Colombo: LCL. Lanka Salt Ltd. Various years. Annual Report. Colombo: LSL. Macedo, Roberto. 2000. Privatization and the Distribution of Assets and Income in Brazil. Working Paper No.14, Washington D.C.: Carnegie Endowment for International Peace. Ministry of Finance. A Handbook on Public Enterprises in Sri Lanka (1988-1993). Colombo: Department of Public Enterprises, Ministry of Finance. National Development Bank. Various years. Annual Report. Colombo: NDB. Nellis, John. 1999. Time to Rethink Privatization in Transition Economies. Discussion Paper No.38, Washington D.C.:International Finance Corporation. Public Enterprises Reform Commission of Sri Lanka. Various years. Annual Report. Colombo:PERC. Shell Gas Lanka Ltd. Various years. Annual Report. Colombo: SGLL.
53
Sri Lanka 1995. Policy Statement by Her Excellency Chandrika Bandaranaike Kumaratunga, President of the Democratic Socialist Republic of Sri Lanka. January 1995. Sri Lankan Airlines Ltd. Various years. Annual Report. Colombo: SLAL. Sri Lanka Telecom Ltd. Various years. Annual Report. Colombo: SLT. World Bank. 2002. World Development Report. Washington D.C.: World Bank. World Bank. 2001. Impact Study of Infrastructure Privatization in Sri Lanka. Washington D.C.:World Bank. Washington D.C.:World Bank. World Bank. 2001. “Communications for Privatization in Sri Lanka: Audit Report and Draft Strategy”. (mimeo)
54
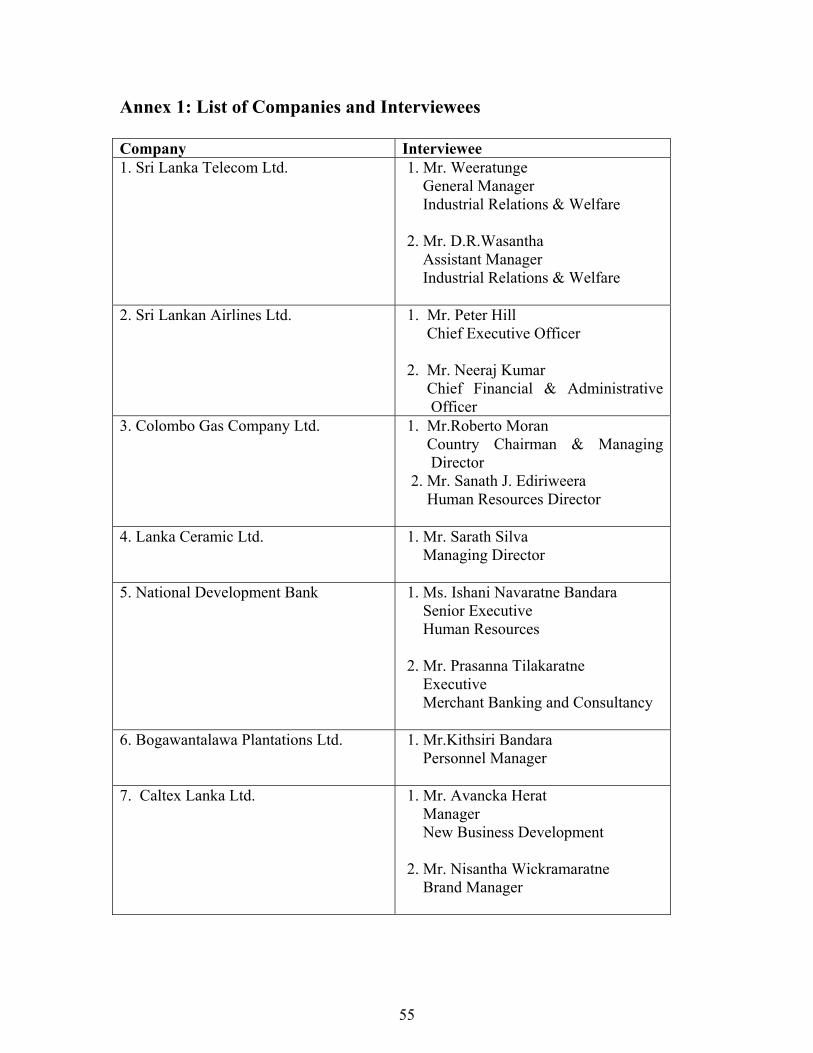
Annex 1: List of Companies and Interviewees Company Interviewee 1. Sri Lanka Telecom Ltd. 1. Mr. Weeratunge
General Manager Industrial Relations & Welfare 2. Mr. D.R.Wasantha Assistant Manager Industrial Relations & Welfare
2. Sri Lankan Airlines Ltd. 1. Mr. Peter Hill Chief Executive Officer 2. Mr. Neeraj Kumar Chief Financial & Administrative
Officer 3. Colombo Gas Company Ltd. 1. Mr.Roberto Moran
Country Chairman & Managing Director
2. Mr. Sanath J. Ediriweera Human Resources Director
4. Lanka Ceramic Ltd. 1. Mr. Sarath Silva Managing Director
5. National Development Bank 1. Ms. Ishani Navaratne Bandara Senior Executive Human Resources 2. Mr. Prasanna Tilakaratne Executive Merchant Banking and Consultancy
6. Bogawantalawa Plantations Ltd.
1. Mr.Kithsiri Bandara Personnel Manager
7. Caltex Lanka Ltd. 1. Mr. Avancka Herat Manager New Business Development 2. Mr. Nisantha Wickramaratne Brand Manager
55
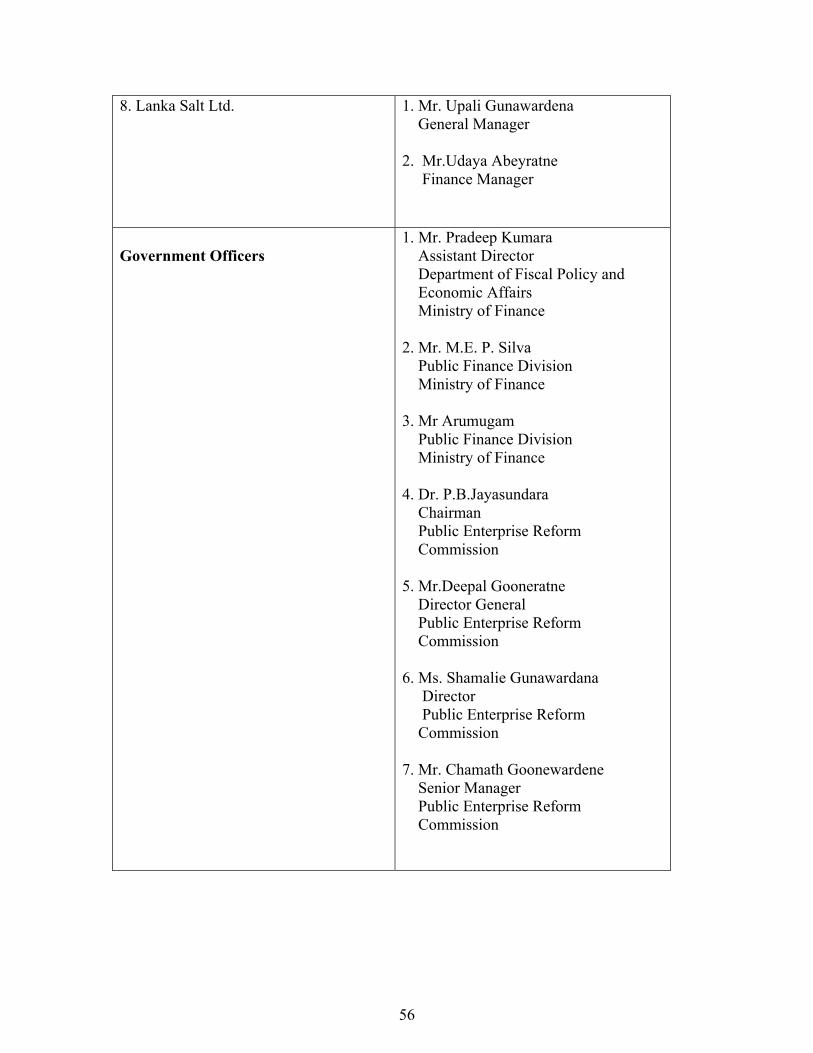
8. Lanka Salt Ltd. 1. Mr. Upali Gunawardena General Manager 2. Mr.Udaya Abeyratne Finance Manager
Government Officers
1. Mr. Pradeep Kumara Assistant Director Department of Fiscal Policy and Economic Affairs Ministry of Finance 2. Mr. M.E. P. Silva Public Finance Division Ministry of Finance 3. Mr Arumugam Public Finance Division Ministry of Finance 4. Dr. P.B.Jayasundara Chairman Public Enterprise Reform Commission 5. Mr.Deepal Gooneratne Director General Public Enterprise Reform Commission 6. Ms. Shamalie Gunawardana Director Public Enterprise Reform Commission 7. Mr. Chamath Goonewardene Senior Manager Public Enterprise Reform Commission
56
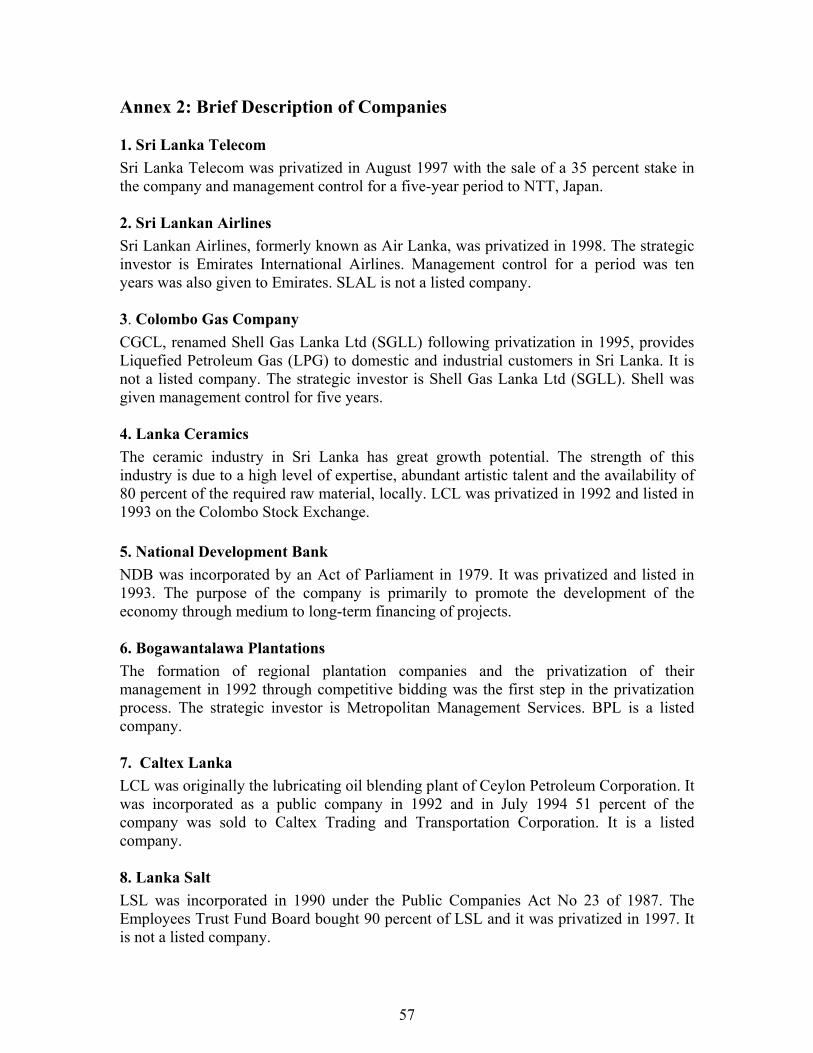
Annex 2: Brief Description of Companies 1. Sri Lanka Telecom
Sri Lanka Telecom was privatized in August 1997 with the sale of a 35 percent stake in the company and management control for a five-year period to NTT, Japan. 2. Sri Lankan Airlines
Sri Lankan Airlines, formerly known as Air Lanka, was privatized in 1998. The strategic investor is Emirates International Airlines. Management control for a period was ten years was also given to Emirates. SLAL is not a listed company. 3. Colombo Gas Company
CGCL, renamed Shell Gas Lanka Ltd (SGLL) following privatization in 1995, provides Liquefied Petroleum Gas (LPG) to domestic and industrial customers in Sri Lanka. It is not a listed company. The strategic investor is Shell Gas Lanka Ltd (SGLL). Shell was given management control for five years. 4. Lanka Ceramics
The ceramic industry in Sri Lanka has great growth potential. The strength of this industry is due to a high level of expertise, abundant artistic talent and the availability of 80 percent of the required raw material, locally. LCL was privatized in 1992 and listed in 1993 on the Colombo Stock Exchange. 5. National Development Bank
NDB was incorporated by an Act of Parliament in 1979. It was privatized and listed in 1993. The purpose of the company is primarily to promote the development of the economy through medium to long-term financing of projects. 6. Bogawantalawa Plantations
The formation of regional plantation companies and the privatization of their management in 1992 through competitive bidding was the first step in the privatization process. The strategic investor is Metropolitan Management Services. BPL is a listed company. 7. Caltex Lanka
LCL was originally the lubricating oil blending plant of Ceylon Petroleum Corporation. It was incorporated as a public company in 1992 and in July 1994 51 percent of the company was sold to Caltex Trading and Transportation Corporation. It is a listed company. 8. Lanka Salt
LSL was incorporated in 1990 under the Public Companies Act No 23 of 1987. The Employees Trust Fund Board bought 90 percent of LSL and it was privatized in 1997. It is not a listed company.
57
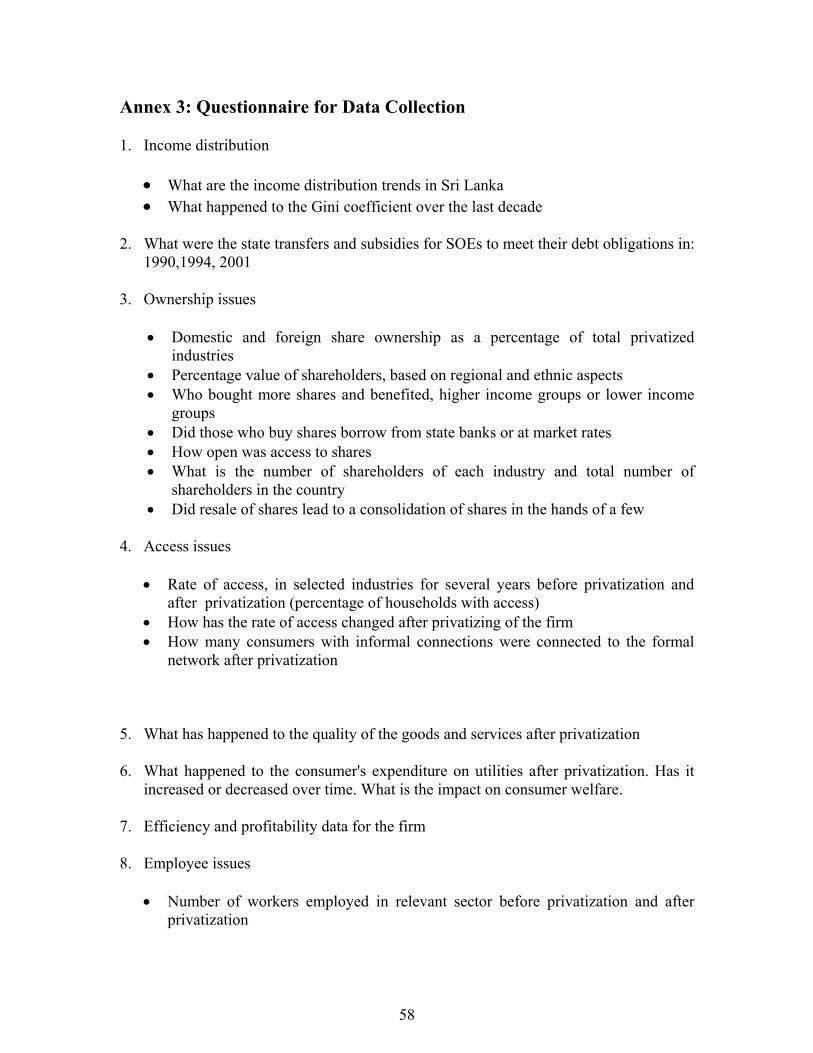
Annex 3: Questionnaire for Data Collection
1. Income distribution
• What are the income distribution trends in Sri Lanka • What happened to the Gini coefficient over the last decade
2. What were the state transfers and subsidies for SOEs to meet their debt obligations in: 1990,1994, 2001
3. Ownership issues
• Domestic and foreign share ownership as a percentage of total privatized industries
• Percentage value of shareholders, based on regional and ethnic aspects • Who bought more shares and benefited, higher income groups or lower income
groups • Did those who buy shares borrow from state banks or at market rates • How open was access to shares • What is the number of shareholders of each industry and total number of
shareholders in the country • Did resale of shares lead to a consolidation of shares in the hands of a few
4. Access issues
• Rate of access, in selected industries for several years before privatization and after privatization (percentage of households with access)
• How has the rate of access changed after privatizing of the firm • How many consumers with informal connections were connected to the formal
network after privatization
5. What has happened to the quality of the goods and services after privatization
6. What happened to the consumer's expenditure on utilities after privatization. Has it increased or decreased over time. What is the impact on consumer welfare.
7. Efficiency and profitability data for the firm
8. Employee issues
• Number of workers employed in relevant sector before privatization and after privatization
58
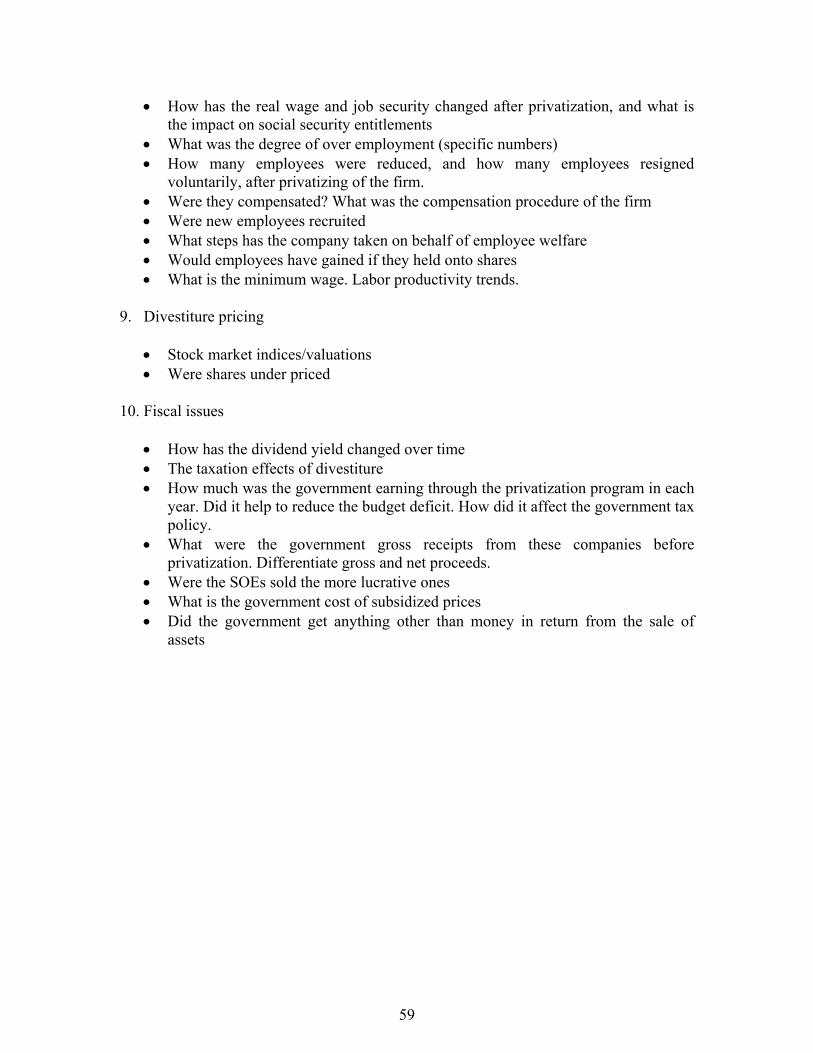
59
• How has the real wage and job security changed after privatization, and what is the impact on social security entitlements
• What was the degree of over employment (specific numbers) • How many employees were reduced, and how many employees resigned
voluntarily, after privatizing of the firm. • Were they compensated? What was the compensation procedure of the firm • Were new employees recruited • What steps has the company taken on behalf of employee welfare • Would employees have gained if they held onto shares • What is the minimum wage. Labor productivity trends.
9. Divestiture pricing
• Stock market indices/valuations • Were shares under priced
10. Fiscal issues
• How has the dividend yield changed over time • The taxation effects of divestiture • How much was the government earning through the privatization program in each
year. Did it help to reduce the budget deficit. How did it affect the government tax policy.
• What were the government gross receipts from these companies before privatization. Differentiate gross and net proceeds.
• Were the SOEs sold the more lucrative ones • What is the government cost of subsidized prices • Did the government get anything other than money in return from the sale of
assets