Embed Size (px)
Citation preview

Atmos. Chem. Phys., 12, 11555–11572, 2012www.atmos-chem-phys.net/12/11555/2012/doi:10.5194/acp-12-11555-2012© Author(s) 2012. CC Attribution 3.0 License.
AtmosphericChemistry
and Physics
Distributions and climate effects of atmospheric aerosols from thepreindustrial era to 2100 along Representative ConcentrationPathways (RCPs) simulated using the global aerosol modelSPRINTARS
T. Takemura
Research Institute for Applied Mechanics, Kyushu University, Fukuoka, Japan
Correspondence to:T. Takemura ([email protected])
Received: 21 July 2012 – Published in Atmos. Chem. Phys. Discuss.: 16 August 2012Revised: 21 November 2012 – Accepted: 30 November 2012 – Published: 4 December 2012
Abstract. Global distributions and associated climate ef-fects of atmospheric aerosols were simulated using a globalaerosol climate model, SPRINTARS, from 1850 to thepresent day and projected forward to 2100. Aerosol emis-sion inventories used by the Coupled Model Intercompar-ison Project Phase 5 (CMIP5) were applied to this study.Scenarios based on the Representative Concentration Path-ways (RCPs) were used for the future projection. Aerosolloading in the atmosphere has already peaked and is nowreducing in Europe and North America. However, in Asiawhere rapid economic growth is ongoing, aerosol loading isestimated to reach a maximum in the first half of this cen-tury. Atmospheric aerosols originating from the burning ofbiomass have maintained high loadings throughout the 21stcentury in Africa, according to the RCPs. Evolution of theadjusted forcing by direct and indirect aerosol effects overtime generally correspond to the aerosol loading. The prob-able future pathways of global mean forcing differ based onthe aerosol direct effect for different RCPs. Because aerosolforcing will be close to the preindustrial level by the end ofthe 21st century for all RCPs despite the continuous increasesin greenhouse gases, global warming will be accelerated withreduced aerosol negative forcing.
1 Introduction
Developed countries have experienced air pollution byaerosols throughout the 20th century and the situation is nowworsening in some developing countries. For example, smog
in Beijing and Shanghai, China, can still be severe althoughit did improve around the 2008 Olympic Games (Science,2012; Washington Post, 2012). Trans-boundary air pollutionfrom the Asian continent to Western Japan also continues tobe considerable (Yamaguchi and Takemura, 2011).
Aerosols also act as climate forcing agents through sev-eral different processes. The role of aerosol particles in al-tering the atmospheric radiation budget due to scattering andabsorption is termed the aerosol direct effect. The first indi-rect effect (cloud albedo effect) involves a decrease in clouddroplet and ice crystal effective radii as the number con-centration of aerosol particles acting as cloud condensationnuclei (CCN) and/or ice nuclei (IN), increases. If the liq-uid/ice water content is constant, this will lead to a highercloud albedo (e.g.Twomey, 1974). Changes in the amountsof CCN and IN can also affect the liquid/ice water content ofclouds, which is the second indirect effect (cloud lifetime ef-fect). A decrease in the cloud droplet size due to an increasein CCN results in an extension of cloud lifetime and thento an inhibition of precipitation (e.g.Albrecht, 1989). Onthe other hand,Lebsock et al.(2008) suggested from satel-lite observations that the higher aerosol concentration maylead to reduced liquid water path in nonprecipitating mixed-phase clouds. An increase in IN has the effect of both in-creasing and decreasing the ice water content. As with theliquid phase, a decrease in ice crystal size due to an increasein IN may prolong a cloud’s lifetime. In contrast, an increasein IN promotes the conversion of supercooled liquid waterto ice crystals in mixed phase clouds. It is easier to grow icecrystals to snow than to change supercooled droplets to rain,
Published by Copernicus Publications on behalf of the European Geosciences Union.

11556 T. Takemura: Atmospheric aerosols from preindustrial era to 2100
which leads to a decrease in the total cloud water (Lohmannand Feichter, 2005). There is also a semi-direct effect, inwhich aerosols, such as black carbon (BC) and soil dust par-ticles, absorb solar radiation and warm the surrounding at-mosphere, resulting in a change in liquid/ice water contentdue to a change in the saturated water vapour pressure andatmospheric stabilisation (Koch and Del Genio, 2010; Take-mura and Uchida, 2011). These aerosol effects cause changesin atmospheric general circulation through modifications tothe radiation budget, cloud distribution, and hydrological cy-cle. It is therefore essential to elucidate the time evolution ofglobal aerosol distributions to determine temporal changes inair pollution and climate change due to aerosol effects.
Radiative forcing (RF) is a measure of the change in the ra-diation budget by climate forcing agents (greenhouse gases,aerosols, land use change, etc.). It is useful because it allowsa comparison of the effects of various climate forcing agentson climate change even when the mechanisms affecting theclimate system differ. In previous reports of the Intergovern-mental Panel on Climate Change (IPCC), RF was definedas a change in net irradiance (solar plus thermal radiationin Wm−2) at the tropopause, after allowing for the strato-spheric temperature to readjust to radiative equilibrium butwith surface tropospheric temperatures and state held fixedat the unperturbed values (Forster et al., 2007). The RFs ofthe aerosol direct and first indirect effect relative to the prein-dustrial era were estimated to be−0.5 and−0.7 Wm−2 inthe Fourth Assessment Report (AR4) of the IPCC (Intergov-ernmental Panel on Climate Change, 2007). The uncertaintyin IPCC AR4 estimates of RF was only 10 % for long-livedgreenhouse gases, but was greater for the aerosol effects:from −0.1 to−0.9 Wm−2 for the aerosol direct effect and−0.3 to−1.8 Wm−2 for the aerosol first indirect effect. Theaerosol RFs of the second indirect and semi-direct effectscannot be calculated by strictly following the IPCC defini-tion, because these effects are changes in the troposphericstate. In the IPCC AR4, the change in the radiation budgetdue to anthropogenic aerosols, including the semi-direct andsecond indirect effects as well as the direct and first indirecteffects, was estimated to be−0.3 to −1.4 Wm−2 as a “to-tal aerosol effect”. This is referred to as an adjusted forcing(AF), defined as a change in the net irradiance after allowingfor atmospheric and land temperatures, water vapour, clouds,and land albedo to adjust to the prescribed sea surface tem-peratures and sea ice cover. The AF includes rapid responsesof the climate system to the radiation budget. It is impor-tant to evaluate the AF because it helps clarify the integratedaerosol effects on climate change. It also generally provides amethod for calculating the aerosol radiative effects in climatemodels.
Some previous studies have estimated historical time se-ries for the RF of several climate forcing agents.Myhre et al.(2001) compiled a time series from the preindustrial era to1995 using a radiative transfer model, andHansen et al.(2002) estimated RF from 1950 to 2000 using a general cir-
culation model from the Goddard Institute for Space stud-ies (GISS).Takemura et al.(2006) calculated RF at both thetropopause and surface from 1850 to 2000 using an atmo-spheric general circulation model, MIROC, which appliedthe historical meteorological field simulated for the CoupledModel Intercomparison Project Phase 3 (CMIP3) (Nozawaet al., 2005). RecentlySkeie et al.(2011) estimated the RFtime series from the preindustrial era to the present day forwell-mixed greenhouse gases, tropospheric and stratosphericozone, and aerosols. They calculated the RF for aerosols us-ing the historical emission inventories provided byLamar-que et al.(2010) and global aerosol distributions from anoff-line chemical transport model, OlsoCTM2. On project-ing future global aerosol distributions,Horowitz (2006) cal-culated them with the Special Report on Emissions Scenarios(SRES) which was used in the Third and Fourth AssessmentReports of IPCC. There are, however, no studies with the lat-est emission scenarios for estimating future aerosol radiativeforcings.
In the present study, the time series of changes in the ra-diation budget due to aerosols from the preindustrial era tothe present day and the present day to the end of the 21stcentury are estimated using an on-line global aerosol climatemodel, SPRINTARS (Takemura et al., 2000, 2002a, 2005,2009), and using the Representative Concentration Pathways(RCPs) (Moss et al., 2010) for the latest future emissionscenarios. The historical emissions database developed byLamarque et al.(2010) and the RCPs for future emissions areused in the Coupled Model Intercomparison Project Phase 5(CMIP5) in conjunction with the Fifth Assessment Report(AR5) of the IPCC. The simulation in this study is under-taken with a prescribed sea surface temperature and sea icecover, so the estimated change in the radiation budget is theAF. Section 2 of this paper describes the model and the con-ditions used for the simulation. Section 3 describes the emis-sion inventories for anthropogenic aerosols and the precur-sors and parameterisations of dust and sea salt emissions.Section 4 presents the changes in aerosol optical parametersas well as the atmospheric aerosol loadings and emissions ofnatural aerosols from the preindustrial era to the end of the21st century. Section 5 presents a time series of the AF re-sulting from the direct aerosol effect. Section 6 presents timeseries of some cloud parameters, including the AF resultingfrom the aerosol indirect effect. Finally, Sect. 7 presents theconclusions drawn from the study.
2 Model description
The SPRINTARS model calculates global distributions andclimate effects of the main tropospheric aerosols, and is cou-pled with a general circulation model, MIROC5 (Watanabeet al., 2010). It was developed by the Division of ClimateSystem Research in the Atmosphere and Ocean ResearchInstitute (AORI) at the University of Tokyo, the National
Atmos. Chem. Phys., 12, 11555–11572, 2012 www.atmos-chem-phys.net/12/11555/2012/
T. Takemura: Atmospheric aerosols from preindustrial era to 2100 11557
Asia
Oceania
North America
South America
Europe
Africa
Near/MiddleEast
Fig. 1.Definition of regions in this study.
Institute for Environmental Studies in Japan (NIES), and theResearch Institute for Global Change in the Japan Agencyfor Marine-Earth Science and Technology (JAMSTEC). Thehorizontal resolution used is T42 (approximately 2.8◦ by2.8◦ in latitude and longitude) and the vertical resolutionis 20 layers (sigma levels based on the surface pressure at0.995, 0.980, 0.950, 0.900, 0.830, 0.745, 0.650, 0.549, 0.454,0.369, 0.295, 0.230, 0.175, 0.124, 0.085, 0.060, 0.045, 0.035,0.025, and 0.008). The standard time step is 20 min, but be-comes shorter when the calculations are unstable. The datafor the prescribed sea surface temperature and sea ice coverare obtained from historical and future climate simulationsby MIROC and correspond to each emission scenario sub-mitted to CMIP5. Figure1 defines the regions used in thisstudy.
The SPRINTARS model predicts the mass mixing ratiosof black carbon (BC), particulate organic matter (POM), sul-phate, soil dust, and sea salt, and the precursor gases ofsulphate, i.e., sulphur dioxide (SO2) and dimethyl sulphide(DMS). The aerosol transport processes include emission,advection, diffusion, sulphur chemistry, wet deposition, drydeposition, and gravitational settling. The aerosol emissiondata used in this study are explained in detail in the next sec-tion. The other aerosol transport processes are described inTakemura et al.(2000).
The direct, semi-direct, and indirect effects of aerosols arecalculated in SPRINTARS, and are coupled with the radia-tion and cloud/precipitation processes of MIROC5. The two-stream discrete ordinate and adding methods are adoptedin the radiation scheme of MIROC5 (Sekiguchi and Naka-jima, 2008) and consider refractive indices, size distributions,and hygroscopic growth for each aerosol component to cal-culate the aerosol direct effect. The wavelength-dependentrefractive indices of dry aerosols and water are based onDeepak and Gerber(1983) andd’Almeida et al.(1991), re-spectively. This study does not include the deposition effectsof radiative-absorbing aerosols (i.e., BC and soil dust parti-cles) on the change of albedo for snow-covered surfaces. A
detailed description of the aerosol direct effect in SPRINT-ARS is provided byTakemura et al.(2002a, 2005).
The aerosol indirect effect processes are also incorporatedinto a bulk microphysical scheme (Watanabe et al., 2010)for both water and ice clouds in SPRINTARS. The clouddroplet and ice crystal number concentrations, as well as liq-uid/ice water mixing ratio, are treated as prognostic variables(see Eqs. (C1) and (C2) inTakemura et al., 2009). The massand number concentrations of cloud droplets and ice crys-tals vary due to the nucleation, accretion, riming, and aggre-gation processes. The nucleation of cloud droplets dependson the aerosol particle number concentrations, size distri-butions, curvature effect, and solute effect of each aerosolcomponent based on a parameterisation inAbdul-Razzak andGhan(2000). The cloud droplet effective radius and precip-itation rate, which are related to the first and second indi-rect effects, respectively change according to the prognosticcloud droplet number concentration. A detailed descriptionof the aerosol indirect effect for water clouds in SPRINT-ARS is provided byTakemura et al.(2005). For ice crys-tals, both homogeneous and heterogeneous nucleations areconsidered. The homogeneous process is based onKarcherand Lohmann(2002), and the heterogeneous process, whichincludes contact and immersion/condensation freezings, isbased onLohmann and Diehl(2006) andDiehl et al.(2006).BC and soil dust particles are potential aerosol components,which can act as ice nuclei in the model. The parameteri-sation of interactions between aerosols and ice crystals aredescribed in detail inTakemura et al.(2009).
This study includes the aerosol semi-direct effect process,because the radiation and cloud-precipitation processes in-teract in the model. The semi-direct effect due to BC inSPRINTARS is described inTakemura and Uchida(2011).
The past transient simulation from 1850 to 2005 and thefuture transient simulations with four RCPs from 2006 to2100 are carried out in this study, which are the standardexperiments (STD). The other experiments with continuouspreindustrial emissions for aerosols and transient changesin other conditions along RCPs (AEROPI) are also doneto analyse effects of changes in aerosol emissions on radi-ation and clouds by calculating differences with STD. TheAF for the aerosol direct effect is calculated as a compar-ison of a difference in net radiation fluxes with and with-out aerosols by a double call of the radiation code betweenSTD and AEROPI, i.e., ((STD with aerosols) – (STD withoutaerosols)) – ((AEROPI with aerosols) – (AEROPI withoutaerosols)). It is under the all-sky condition in this study. TheAF for the aerosol indirect effect is defined as a difference inthe cloud radiative forcing between STD and AEROPI.
3 Emissions and concentrations of aerosols
The natural aerosols and their precursors included inthis study are soil particles, sea salt, POM from the
www.atmos-chem-phys.net/12/11555/2012/ Atmos. Chem. Phys., 12, 11555–11572, 2012

11558 T. Takemura: Atmospheric aerosols from preindustrial era to 2100
0
20
40
60
80
100
120
1850 1900 1950 2000 2050 2100
POM emission (Global)
OM
em
issi
on (T
g/yr
)
Year
historical RCP2.6 RCP4.5RCP6.0 RCP8.5
0
2
4
6
8
10
1850 1900 1950 2000 2050 2100
BC emission (Global)
BC e
mis
sion
(Tg/
yr)
Year
historical RCP2.6 RCP4.5RCP6.0 RCP8.5
0
30
60
90
120
150
1850 1900 1950 2000 2050 2100
SO2 emission (Global)
SO2
emis
sion
(Tg/
yr)
Year
historical RCP2.6 RCP4.5RCP6.0 RCP8.5
(a) (b) (c)
Fig. 2. Time series of annual and global total emissions of(a) BC, (b) POM, and(c) SO2 according to the RCPs. The historical period isshown in black, and the four RCPs are shown in colors.
gas-to-particle conversion of volatile organic compounds,volcanic SO2, and DMS from oceanic phytoplankton andland. The emission flux of soil dust aerosols depends on thenear-surface wind speed, vegetation, leaf area index (LAI),soil moisture, and amount of snow (Takemura et al., 2009).Sea salt emissions depend on the near-surface wind speed,and emissions are not possible over areas covered by sea ice(Monahan et al., 1986; Takemura et al., 2009). For naturalPOM emissions, conversion rates from volatile organic com-pounds are assumed based onGriffin et al. (1999), and theemission inventories are those provided byGuenther et al.(1995). The Global Emissions Inventory Activity (GEIA)database is used to estimate SO2 emissions from continu-ously erupting volcanoes (Andres and Kasgnoc, 1998). DMSemissions depend on the downward surface solar radiationavailable for oceanic phytoplankton (Bates et al., 1987) andon the temperature and LAI as well as the downward sur-face solar radiation available for land vegetation (Spiro et al.,1992).
Historical and future emission inventories of annual meananthropogenic sources and monthly mean biomass burningfor BC, organic carbon (OC), and SO2 are based onLamar-que et al.(2010) and RCPs (Moss et al., 2010), respec-tively. The RCPs have four representative pathways, each ofwhich corresponds to a specific radiative forcing. RCP2.6has a peak in the global mean RF at 2.6 Wm−2 prior to2100, and then RF declines. In RCP4.5 and RCP6.0, theglobal mean RF stabilises, without overshooting, to 4.5 and6.0 Wm−2, respectively after 2100. In RCP8.5 the globalmean RF reaches 8.5 Wm−2 before 2100 and then contin-ues to increase. Conversion factors from OC to POM are setat 1.6 and 2.6 for anthropogenic sources and biomass burn-ing, respectively (Myhre et al., 2009). A time series of themonthly three-dimensional emission flux of BC from avia-tion sources is also included in the above database and is con-verted to POM and SO2 using factors of 1/3 and 8.0 × 10⁻⁴,respectively. Figure2 presents a time series for total emis-sions of BC, POM, and SO2 from 1850 to 2100.
The monthly mean concentrations of hydroxyl radical(OH), ozone (O3), and hydrogen peroxide (H2O2), all ofwhich are oxidisers of DMS and SO2, were determined us-
ing a global chemical climate model, CHASER (Sudo et al.,2002), which is driven by the same general circulation model,(MIROC) as the SPRINTARS model. In CHASER, valuesare calculated as time slices for every decade using the sameemission inventories as those used in this study, and interpo-lated linearly for the intermediate years. Concentrations oflong-lived greenhouse gases (carbon dioxide, methane, ni-trous oxide, chlorofluorocarbons, etc.) are also determinedaccording to the RCPs.
4 Long-term trends of atmospheric aerosols
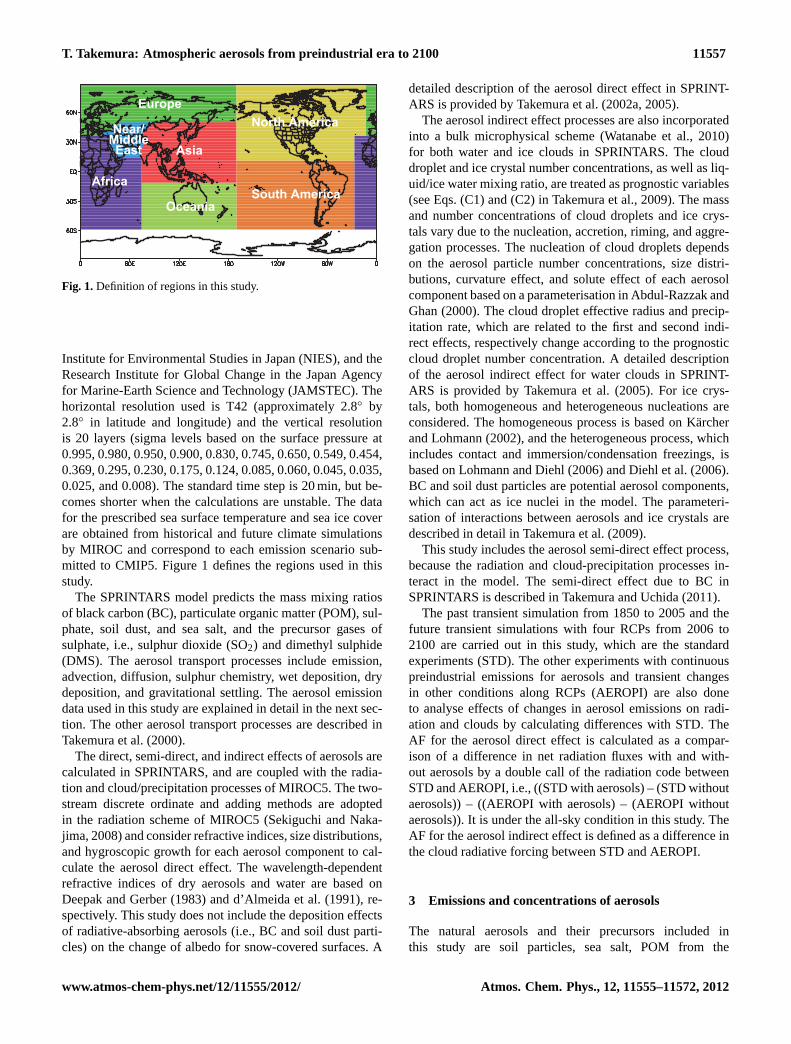
Figure3 presents the annual mean distributions of the masscolumn loading for each aerosol component in 2000. BC andPOM are concentrated over Central and Southern Africa, theAmazon, and Southeast Asia, mainly due to emissions frombiomass burning in the dry season of each region. Concen-trations are also high over the populous and industrialisedregions of East and South Asia, Europe, and North Amer-ica, due to fossil and bio fuel consumption. Sulphate aerosolshave high concentrations not only over East and South Asia,Europe, and North America, but also over the Arabian Penin-sula due to oil production and surrounding volcanic regions.Unlike BC and POM, sulphate aerosol is also distributedover remote oceans, because of the emission of its precursor(DMS) from oceanic phytoplankton. Large amounts of soilaerosol appear over the Saharan, Arabian, Asian, and Aus-tralian regions. Sea salt aerosols have a more homogeneousdistribution over oceans than other aerosols, although theirconcentration is high in the mid- and high-latitudes of bothhemispheres due to the storm track.
The simulated aerosol distributions have been confirmedto generally agree with various aerosol observations by satel-lites and ground-based measurements, in terms of both cli-matology and short-term variations (Takemura et al., 2002b,2003). They are also reasonably comparable with data fromsome satellite retrievals and ground-based observational net-works for aerosols used in the aerosol model intercomparisonproject, AeroCom (Kinne et al., 2003; Textor et al., 2006).The AeroCom Phase II Interface, which provides com-parisons of various aerosol parameters among models and
Atmos. Chem. Phys., 12, 11555–11572, 2012 www.atmos-chem-phys.net/12/11555/2012/
T. Takemura: Atmospheric aerosols from preindustrial era to 2100 11559
(a) (b) (c)
(d) (e)
Fig. 3. Global distributions of mass column loadings of(a) BC, (b) POM, (c) sulphate,(d) soil dust, and(e) sea salt in 2000 (averaged overthe period 1998–2002) simulated by SPRINTARS.
observations, is available athttp://aerocom.met.no/cgi-bin/AEROCOM/aerocom/surfobsannualrs.pl.
Figure4 presents the simulated time evolution of annualmean mass column loadings for BC, POM, and sulphate from1850 to 2100 dividing into several regions. The values inthe hindcast simulation from 1850 to 2005 are the same forall scenarios in each component. All components have al-ready decreased in Europe and North America, particularlysulphate, and they are predicted to continue decreasing to-ward the end of the 21st century. In contrast, the mass col-umn loadings in Asia have not yet reached their maximumvalues for all components, with the exception of POM withRCP4.5. This is mainly because anthropogenic aerosol emis-sions are estimated to continue increasing until at least 2030due to rapid economic growth in some countries. In RCP6.0,all aerosol components maintain high loadings until the mid-21st century in Asia, although they are predicted to decreaseby the end of the century for all RCPs. Biomass burningin Africa is predicted to ensure a high aerosol mass load-ing throughout the 21st century in all RCPs, particularly forBC and POM, although it is difficult to provide a quantita-tive estimate of future emissions from biomass burning. TheBC and POM loadings from Africa are approximately halfof the global total in the latter half of the 21st century. Sul-phate aerosols originating from the Near and Middle Eastbegan to increase from the end of the 20th century, mainlybecause of oil production and economic growth, and this situ-ation continues toward the mid-21st century, with the excep-tion of RCP2.6.Horowitz (2006) using the SRES estimated
that atmospheric BC and OC monotonically increase towardthe end of the 21st century except in the scenario which hasthe smallest emission amounts (SRES B1) although burdensof sulfate aerosols have peaks in the mid-21st century in allscenarios. The future projections of atmospheric burdens andconsequent radiative forcings and climate effects of aerosolsare greatly different between applied emission scenarios.
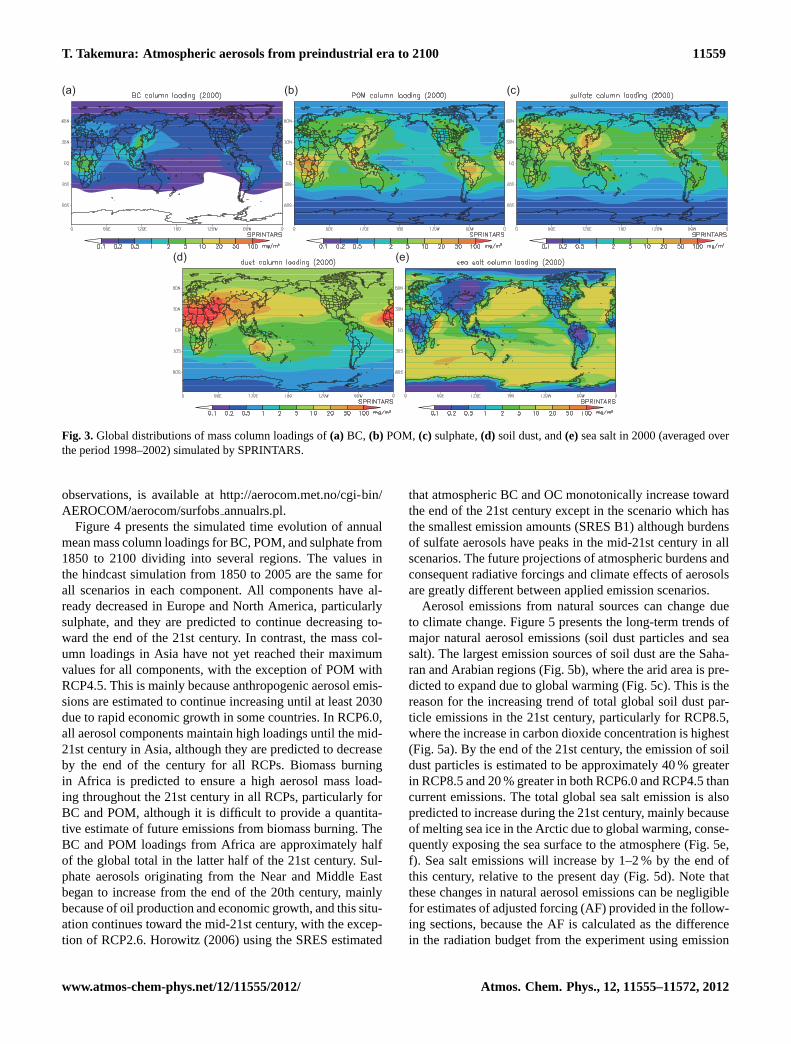
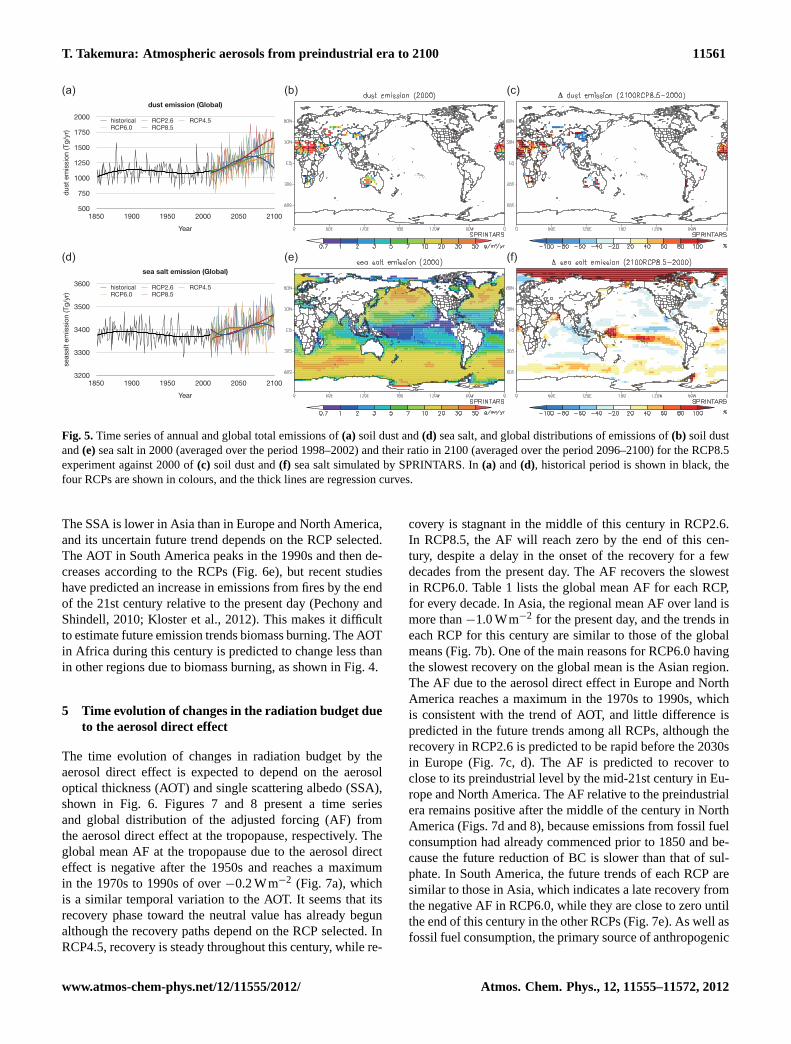
Aerosol emissions from natural sources can change dueto climate change. Figure5 presents the long-term trends ofmajor natural aerosol emissions (soil dust particles and seasalt). The largest emission sources of soil dust are the Saha-ran and Arabian regions (Fig.5b), where the arid area is pre-dicted to expand due to global warming (Fig.5c). This is thereason for the increasing trend of total global soil dust par-ticle emissions in the 21st century, particularly for RCP8.5,where the increase in carbon dioxide concentration is highest(Fig. 5a). By the end of the 21st century, the emission of soildust particles is estimated to be approximately 40 % greaterin RCP8.5 and 20 % greater in both RCP6.0 and RCP4.5 thancurrent emissions. The total global sea salt emission is alsopredicted to increase during the 21st century, mainly becauseof melting sea ice in the Arctic due to global warming, conse-quently exposing the sea surface to the atmosphere (Fig.5e,f). Sea salt emissions will increase by 1–2 % by the end ofthis century, relative to the present day (Fig.5d). Note thatthese changes in natural aerosol emissions can be negligiblefor estimates of adjusted forcing (AF) provided in the follow-ing sections, because the AF is calculated as the differencein the radiation budget from the experiment using emission
www.atmos-chem-phys.net/12/11555/2012/ Atmos. Chem. Phys., 12, 11555–11572, 2012

11560 T. Takemura: Atmospheric aerosols from preindustrial era to 2100
0
0.5
1.0
1.5
2.0
2.5
3.0
1850 1900 1950 2000 2050 2100
POM column loading (RCP8.5)
PO
M c
olum
n lo
adin
g (T
g)
Year
Asia Europe N America S AmericaOceania Africa Near/Middle East
0
0.5
1.0
1.5
2.0
2.5
3.0
1850 1900 1950 2000 2050 2100
POM column loading (RCP6.0)
PO
M c
olum
n lo
adin
g (T
g)
Year
Asia Europe N America S AmericaOceania Africa Near/Middle East
0
0.5
1.0
1.5
2.0
2.5
3.0
1850 1900 1950 2000 2050 2100
POM column loading (RCP4.5)
PO
M c
olum
n lo
adin
g (T
g)
Year
Asia Europe N America S AmericaOceania Africa Near/Middle East
0
0.5
1.0
1.5
2.0
2.5
3.0
1850 1900 1950 2000 2050 2100
POM column loading (RCP2.6)
PO
M c
olum
n lo
adin
g (T
g)
Year
Asia Europe N America S AmericaOceania Africa Near/Middle East
0
0.05
0.10
0.15
0.20
0.25
0.30
1850 1900 1950 2000 2050 2100
BC column loading (RCP2.6)
BC
col
umn
load
ing
(Tg)
Year
Asia Europe N America S AmericaOceania Africa Near/Middle East
0
0.05
0.10
0.15
0.20
0.25
0.30
1850 1900 1950 2000 2050 2100
BC column loading (RCP4.5)
BC
col
umn
load
ing
(Tg)
Year
Asia Europe N America S AmericaOceania Africa Near/Middle East
0
0.05
0.10
0.15
0.20
0.25
0.30
1850 1900 1950 2000 2050 2100
BC column loading (RCP6.0)
BC
col
umn
load
ing
(Tg)
Year
Asia Europe N America S AmericaOceania Africa Near/Middle East
0
0.05
0.10
0.15
0.20
0.25
0.30
1850 1900 1950 2000 2050 2100
BC column loading (RCP8.5)
BC
col
umn
load
ing
(Tg)
Year
Asia Europe N America S AmericaOceania Africa Near/Middle East
0
0.5
1.0
1.5
2.0
1850 1900 1950 2000 2050 2100
sulfate column loading (RCP2.6)
sulfa
te c
olum
n lo
adin
g (T
g)
Year
Asia Europe N America S AmericaOceania Africa Near/Middle East
0
0.5
1.0
1.5
2.0
1850 1900 1950 2000 2050 2100
sulfate column loading (RCP4.5)
sulfa
te c
olum
n lo
adin
g (T
g)
Year
Asia Europe N America S AmericaOceania Africa Near/Middle East
0
0.5
1.0
1.5
2.0
1850 1900 1950 2000 2050 2100
sulfate column loading (RCP6.0)
sulfa
te c
olum
n lo
adin
g (T
g)Year
Asia Europe N America S AmericaOceania Africa Near/Middle East
0
0.5
1.0
1.5
2.0
1850 1900 1950 2000 2050 2100
sulfate column loading (RCP8.5)
sulfa
te c
olum
n lo
adin
g (T
g)
Year
Asia Europe N America S AmericaOceania Africa Near/Middle East
(a)
(d)
(b) (c)
(e) (f)
(g) (h) (i)
(j) (k) (l)
Fig. 4. Time series of regional total mass column loadings of (left) BC, (middle) POM, and (right) sulphate for (top to bottom) RCP2.6,4.5, 6.0, and 8.5 simulated by SPRINTARS. Blue: Asia, green: Europe, orange: North America, red: South America, purple: Oceania, grey:Africa, light blue: Near and Middle East.
inventories of anthropogenic aerosols for 1850 with the samesea surface temperature, sea ice cover, and concentrations ofgreenhouse gases data as the standard transient experiment.
Figure 6 presents a time series of aerosol optical thick-ness (AOT) and single scatting albedo (SSA) simulated bySPRINTARS. The global mean AOT rapidly increases afterthe 1950s and reached a maximum in the 1970s to 1990s(Fig. 6a). From this point it gradually decreases toward theend of the 21st century in the simulations for all RCPs, al-though the decrease temporally ceases in the mid-21st cen-tury in RCP6.0. The minimum SSA is delayed in comparisonwith the maximum AOT because the reduction of SO2 emis-sion precedes that of BC, due to the adoption of inexpen-
sive desulphurisers and because BC emissions from biomassburning regions remain high (see Figs.2 and4). The regionalAOT in Europe and North America (Fig.6c, d) peaks in the1970s to 1980s, which is synchronised with the global mean.The SSA decreases until early this century in RCP4.5 forNorth America and in RCP2.6 for both North America andEurope, due to the rapid reduction of SO2 emissions, before itlater recoveres. In Asia, the AOT increases after the SecondWorld War and reaches a maximum in the 2010s, with theexception of RCP6.0, where anthropogenic aerosols remainat high levels until the mid-21st century (Fig.4). Althoughemissions of anthropogenic aerosols are declining in Japan,as in Europe, those in other Asian countries are increasing.
Atmos. Chem. Phys., 12, 11555–11572, 2012 www.atmos-chem-phys.net/12/11555/2012/
T. Takemura: Atmospheric aerosols from preindustrial era to 2100 11561
500
750
1000
1250
1500
1750
2000
1850 1900 1950 2000 2050 2100
dust emission (Global)
dus
t em
issi
on (T
g/yr
)
Year
historical RCP2.6 RCP4.5RCP6.0 RCP8.5
3200
3300
3400
3500
3600
1850 1900 1950 2000 2050 2100
sea salt emission (Global)
seas
alt
emis
sion
(Tg/
yr)
Year
historical RCP2.6 RCP4.5RCP6.0 RCP8.5
(a) (b) (c)
(d) (e) (f)
Fig. 5.Time series of annual and global total emissions of(a) soil dust and(d) sea salt, and global distributions of emissions of(b) soil dustand(e) sea salt in 2000 (averaged over the period 1998–2002) and their ratio in 2100 (averaged over the period 2096–2100) for the RCP8.5experiment against 2000 of(c) soil dust and(f) sea salt simulated by SPRINTARS. In(a) and(d), historical period is shown in black, thefour RCPs are shown in colours, and the thick lines are regression curves.
The SSA is lower in Asia than in Europe and North America,and its uncertain future trend depends on the RCP selected.The AOT in South America peaks in the 1990s and then de-creases according to the RCPs (Fig.6e), but recent studieshave predicted an increase in emissions from fires by the endof the 21st century relative to the present day (Pechony andShindell, 2010; Kloster et al., 2012). This makes it difficultto estimate future emission trends biomass burning. The AOTin Africa during this century is predicted to change less thanin other regions due to biomass burning, as shown in Fig.4.
5 Time evolution of changes in the radiation budget dueto the aerosol direct effect
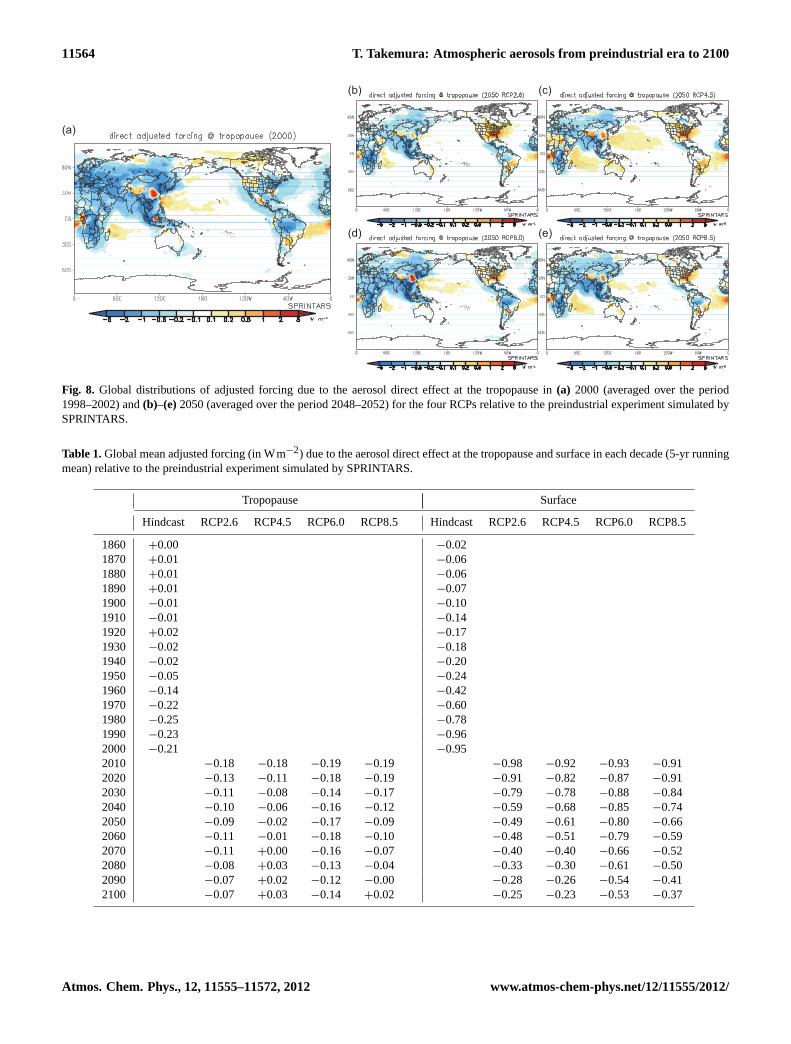
The time evolution of changes in radiation budget by theaerosol direct effect is expected to depend on the aerosoloptical thickness (AOT) and single scattering albedo (SSA),shown in Fig. 6. Figures 7 and 8 present a time seriesand global distribution of the adjusted forcing (AF) fromthe aerosol direct effect at the tropopause, respectively. Theglobal mean AF at the tropopause due to the aerosol directeffect is negative after the 1950s and reaches a maximumin the 1970s to 1990s of over−0.2 Wm−2 (Fig. 7a), whichis a similar temporal variation to the AOT. It seems that itsrecovery phase toward the neutral value has already begunalthough the recovery paths depend on the RCP selected. InRCP4.5, recovery is steady throughout this century, while re-
covery is stagnant in the middle of this century in RCP2.6.In RCP8.5, the AF will reach zero by the end of this cen-tury, despite a delay in the onset of the recovery for a fewdecades from the present day. The AF recovers the slowestin RCP6.0. Table 1 lists the global mean AF for each RCP,for every decade. In Asia, the regional mean AF over land ismore than−1.0 Wm−2 for the present day, and the trends ineach RCP for this century are similar to those of the globalmeans (Fig.7b). One of the main reasons for RCP6.0 havingthe slowest recovery on the global mean is the Asian region.The AF due to the aerosol direct effect in Europe and NorthAmerica reaches a maximum in the 1970s to 1990s, whichis consistent with the trend of AOT, and little difference ispredicted in the future trends among all RCPs, although therecovery in RCP2.6 is predicted to be rapid before the 2030sin Europe (Fig.7c, d). The AF is predicted to recover toclose to its preindustrial level by the mid-21st century in Eu-rope and North America. The AF relative to the preindustrialera remains positive after the middle of the century in NorthAmerica (Figs.7d and8), because emissions from fossil fuelconsumption had already commenced prior to 1850 and be-cause the future reduction of BC is slower than that of sul-phate. In South America, the future trends of each RCP aresimilar to those in Asia, which indicates a late recovery fromthe negative AF in RCP6.0, while they are close to zero untilthe end of this century in the other RCPs (Fig.7e). As well asfossil fuel consumption, the primary source of anthropogenic
www.atmos-chem-phys.net/12/11555/2012/ Atmos. Chem. Phys., 12, 11555–11572, 2012

11562 T. Takemura: Atmospheric aerosols from preindustrial era to 2100
0
0.1
0.2
0.3
0.4
0.5
0.6
1850 1900 1950 2000 2050 21000.94
0.95
0.96
0.97
0.98
0.99
1.00
aerosol optical properties (Asia (land))
optic
al t
hick
ness
(AO
T) (5
50nm
)
Year
sing
le s
catt
erin
g al
bed
o (S
SA
) (55
0nm
)
AOT historical SSA historicalAOT RCP2.6 SSA RCP2.6AOT RCP4.5 SSA RCP4.5AOT RCP6.0 SSA RCP6.0AOT RCP8.5 SSA RCP8.5
0
0.1
0.2
0.3
0.4
0.5
0.6
1850 1900 1950 2000 2050 21000.94
0.95
0.96
0.97
0.98
0.99
1.00
aerosol optical properties (Europe (land))
optic
al t
hick
ness
(AO
T) (5
50nm
)
Year
sing
le s
catt
erin
g al
bed
o (S
SA
) (55
0nm
)
AOT historical SSA historical AOT RCP2.6SSA RCP2.6 AOT RCP4.5 SSA RCP4.5AOT RCP6.0 SSA RCP6.0 AOT RCP8.5SSA RCP8.5
(b) (c)
0
0.1
0.2
0.3
0.4
0.5
0.6
1850 1900 1950 2000 2050 21000.94
0.95
0.96
0.97
0.98
0.99
1.00
aerosol optical properties (North America (land))
optic
al t
hick
ness
(AO
T) (5
50nm
)
Year
sing
le s
catt
erin
g al
bed
o (S
SA
) (55
0nm
)
AOT historical SSA historical AOT RCP2.6SSA RCP2.6 AOT RCP4.5 SSA RCP4.5AOT RCP6.0 SSA RCP6.0 AOT RCP8.5SSA RCP8.5
(d)
0
0.1
0.2
0.3
0.4
0.5
0.6
1850 1900 1950 2000 2050 21000.94
0.95
0.96
0.97
0.98
0.99
1.00
aerosol optical properties (South America (land))
optic
al t
hick
ness
(AO
T) (5
50nm
)
Year
sing
le s
catt
erin
g al
bed
o (S
SA
) (55
0nm
)
AOT historical SSA historicalAOT RCP2.6 SSA RCP2.6AOT RCP4.5 SSA RCP4.5AOT RCP6.0 SSA RCP6.0AOT RCP8.5 SSA RCP8.5
0
0.1
0.2
0.3
0.4
0.5
0.6
1850 1900 1950 2000 2050 21000.94
0.95
0.96
0.97
0.98
0.99
1.00
aerosol optical properties (Oceania (land))
optic
al t
hick
ness
(AO
T) (5
50nm
)
Year
sing
le s
catt
erin
g al
bed
o (S
SA
) (55
0nm
)
AOT historical SSA historicalAOT RCP2.6 SSA RCP2.6AOT RCP4.5 SSA RCP4.5AOT RCP6.0 SSA RCP6.0AOT RCP8.5 SSA RCP8.5
0
0.1
0.2
0.3
0.4
0.5
0.6
1850 1900 1950 2000 2050 21000.94
0.95
0.96
0.97
0.98
0.99
1.00
aerosol optical properties (Africa (land))
optic
al t
hick
ness
(AO
T) (5
50nm
)
Yearsi
ngle
sca
tter
ing
alb
edo
(SS
A) (
550n
m)
AOT historical SSA historicalAOT RCP2.6 SSA RCP2.6AOT RCP4.5 SSA RCP4.5AOT RCP6.0 SSA RCP6.0AOT RCP8.5 SSA RCP8.5
0
0.1
0.2
0.3
0.4
0.5
0.6
1850 1900 1950 2000 2050 21000.94
0.95
0.96
0.97
0.98
0.99
1.00
aerosol optical properties (Near/Middle East (land))
optic
al t
hick
ness
(AO
T) (5
50nm
)Year
sing
le s
catt
erin
g al
bed
o (S
SA
) (55
0nm
)
AOT historical SSA historicalAOT RCP2.6 SSA RCP2.6AOT RCP4.5 SSA RCP4.5AOT RCP6.0 SSA RCP6.0AOT RCP8.5 SSA RCP8.5
0
0.05
0.10
0.15
1850 1900 1950 2000 2050 21000.97
0.98
0.99
1.00
aerosol optical properties (Global)
optic
al t
hick
ness
(AO
T) (5
50nm
)
Yearsi
ngle
sca
tter
ing
alb
edo
(SS
A) (
550n
m)
AOT historical SSA historical AOT RCP2.6 SSA RCP2.6AOT RCP4.5 SSA RCP4.5 AOT RCP6.0 SSA RCP6.0AOT RCP8.5 SSA RCP8.5
(a)
(e)
(f) (g) (h)
Fig. 6. Time series of annual and(a) global or(b)–(h) regional mean optical thickness (thick lines) and single scattering albedo (thin lines)simulated by SPRINTARS. The regional mean values are only over land. The historical period is shown in black, and the four RCPs areshown in colors.
aerosols in South America is biomass burning, which mainlyreleases BC and POM, hence the AF due to the aerosol di-rect effect at the tropopause can become positive. Figure4shows that in Africa, the future aerosol emissions in this cen-tury in all RCPs will keep high relative to present-day levels,so the AF will retain large negative values (Fig.7g). The AFtrend for the Near and Middle East corresponds to a changein sulphate loading, as shown in Fig.4.
The forcing at the surface is also important to clarifychanges in the atmospheric radiation budget and in the mete-orological conditions near the surface. For example, BC hasa positive forcing at the tropopause and the top of the atmo-sphere, while it has a negative forcing at the surface. Thisimplies that BC absorbs solar and thermal radiation in theatmosphere.Takemura et al.(2006) reported that the totalsurface negative forcing due to major climate forcing agentsrapidly increased after 1955, mainly due to the strong neg-ative forcing of the aerosol direct effect. Figure9 presentsa time series of the AF at the surface from 1850 to 2100,and Fig.10 presents the global distribution. The trend of theglobal mean AF at the surface (Fig.9a) is similar to that atthe tropopause (Fig.7), while the maximum value at the sur-
face (−1.0 Wm−2) is much larger than that at the tropopause.The AF at the surface in 2000 is negative virtually all overthe globe (Fig.10a). The difference in the AF between thetropopause and the surface is due to aerosols absorbing so-lar and thermal radiation, which is enhanced by the absorp-tion of multi-scattered radiation in the cloud layers below theaerosols (Haywood and Ramaswamy, 1998; Takemura et al.,2002a). In Asia, the maximum negative AF is more than−5 Wm−2 for the present day (Fig.10), and the recoveryis delayed in RCP6.0, as well as at the tropopause (Fig.9b).In North America, the AF at the surface is predicted to shiftto a positive value after the 2020s (Figs.9d and10), which isconsistent with the values shown in Fig.7d. This is primarilybecause the aerosol emissions from Eastern North Americaafter the 2020s are almost equal to or less than those in 1850in all RCPs. In Africa, the AF at the surface is not expectedto recover during the 21st century (Fig.9g). The high BCconcentration is maintained throughout this century (Fig.4),and is emitted to high altitudes due to the heat of the firesfrom which it originates. This enhances the absorption of themulti-scattered radiation by cloud layers, as described above.
Atmos. Chem. Phys., 12, 11555–11572, 2012 www.atmos-chem-phys.net/12/11555/2012/

T. Takemura: Atmospheric aerosols from preindustrial era to 2100 11563
-0.4
-0.3
-0.2
-0.1
0
0.1
1850 1900 1950 2000 2050 2100
direct adjusted forcing (Global; tropopause)
adjus
ted
forc
ing (W
/m2)
Year
historical RCP2.6 RCP4.5 RCP6.0 RCP8.5
-1.2
-0.9
-0.6
-0.3
0
0.3
1850 1900 1950 2000 2050 2100
direct adjusted forcing (Asia (land); tropopause)
adjus
ted
forc
ing (W
/m2)
Year
historical RCP2.6 RCP4.5 RCP6.0 RCP8.5
-1.2
-0.9
-0.6
-0.3
0
0.3
1850 1900 1950 2000 2050 2100
direct adjusted forcing (Europe (land); tropopause)
adj
uste
d fo
rcing
(W/m
2)
Year
historical RCP2.6 RCP4.5 RCP6.0 RCP8.5
-1.2
-0.9
-0.6
-0.3
0
0.3
1850 1900 1950 2000 2050 2100
direct adjusted forcing (North America (land); tropopause)
adjus
ted
forc
ing (W
/m2)
Year
historical RCP2.6 RCP4.5 RCP6.0 RCP8.5-1.2
-0.9
-0.6
-0.3
0
0.3
1850 1900 1950 2000 2050 2100
direct adjusted forcing (South America (land); tropopause)
adjus
ted
forc
ing (W
/m2)
Year
historical RCP2.6 RCP4.5 RCP6.0 RCP8.5-1.2
-0.9
-0.6
-0.3
0
0.3
1850 1900 1950 2000 2050 2100
direct adjusted forcing (Oceania (land); tropopause)
adj
uste
d fo
rcing
(W/m
2)Year
historical RCP2.6 RCP4.5 RCP6.0 RCP8.5
-1.2
-0.9
-0.6
-0.3
0
0.3
1850 1900 1950 2000 2050 2100
direct adjusted forcing (Africa (land); tropopause)
adj
uste
d fo
rcing
(W/m
2)
Year
historical RCP2.6 RCP4.5 RCP6.0 RCP8.5-1.2
-0.9
-0.6
-0.3
0
0.3
1850 1900 1950 2000 2050 2100
direct adjusted forcing (Near/Middle East (land); tropopause)
adjus
ted
forc
ing (W
/m2)
Year
historical RCP2.6 RCP4.5 RCP6.0 RCP8.5
(g)
(b)
(h)
(a)
(c)
(d) (e) (f)
Fig. 7.Time series of annual and(a) global or(b)–(h) regional mean adjusted forcing due to the aerosol direct effect at the tropopause relativeto the preindustrial experiment simulated by SPRINTARS. The regional mean values are only over land. The historical period is shown inblack, and the four RCPs are shown in colours.
Figure11 presents the global mean AF due to the aerosoldirect effect for each aerosol component until 2010, both atthe tropopause and the surface. These separations are expe-dient because many aerosol components interact each otherin the real atmosphere. The components that have the largestnegative and positive AF at the tropopause are sulphate andBC from fossil fuel consumption, respectively. POM fromfossil fuel is also an important forcing agent, generating anegative forcing at the tropopause mainly in the Asian region(not shown). The AF from biomass burning includes both BCand POM components, so the respective positive and nega-tive forcing cancel each other out. The contribution towardsthe negative AF at the surface is estimated to be almost equal
among sulphate and BC from fossil fuel consumption andaerosols from biomass burning.
6 Time evolution of changes in the cloud parametersand radiation budget due to the aerosol indirect effect
As described in Sect. 2, MIROC5-SPRINTARS includes pa-rameterisations of the aerosol indirect effect both for clouddroplets and ice crystals, which are treated as two-momentschemes by predicting their mass mixing ratio and numberconcentration. A sensitivity of a change in the cloud dropletnumber concentration which is a basic parameter to estimateits radius to a change in AOT in the SPRINTARS are close to
www.atmos-chem-phys.net/12/11555/2012/ Atmos. Chem. Phys., 12, 11555–11572, 2012
11564 T. Takemura: Atmospheric aerosols from preindustrial era to 2100
(a)
(b) (c)
(d) (e)
Fig. 8. Global distributions of adjusted forcing due to the aerosol direct effect at the tropopause in(a) 2000 (averaged over the period1998–2002) and(b)–(e) 2050 (averaged over the period 2048–2052) for the four RCPs relative to the preindustrial experiment simulated bySPRINTARS.
Table 1.Global mean adjusted forcing (in Wm−2) due to the aerosol direct effect at the tropopause and surface in each decade (5-yr runningmean) relative to the preindustrial experiment simulated by SPRINTARS.
Tropopause Surface
Hindcast RCP2.6 RCP4.5 RCP6.0 RCP8.5 Hindcast RCP2.6 RCP4.5 RCP6.0 RCP8.5
1860 +0.00 −0.021870 +0.01 −0.061880 +0.01 −0.061890 +0.01 −0.071900 −0.01 −0.101910 −0.01 −0.141920 +0.02 −0.171930 −0.02 −0.181940 −0.02 −0.201950 −0.05 −0.241960 −0.14 −0.421970 −0.22 −0.601980 −0.25 −0.781990 −0.23 −0.962000 −0.21 −0.952010 −0.18 −0.18 −0.19 −0.19 −0.98 −0.92 −0.93 −0.912020 −0.13 −0.11 −0.18 −0.19 −0.91 −0.82 −0.87 −0.912030 −0.11 −0.08 −0.14 −0.17 −0.79 −0.78 −0.88 −0.842040 −0.10 −0.06 −0.16 −0.12 −0.59 −0.68 −0.85 −0.742050 −0.09 −0.02 −0.17 −0.09 −0.49 −0.61 −0.80 −0.662060 −0.11 −0.01 −0.18 −0.10 −0.48 −0.51 −0.79 −0.592070 −0.11 +0.00 −0.16 −0.07 −0.40 −0.40 −0.66 −0.522080 −0.08 +0.03 −0.13 −0.04 −0.33 −0.30 −0.61 −0.502090 −0.07 +0.02 −0.12 −0.00 −0.28 −0.26 −0.54 −0.412100 −0.07 +0.03 −0.14 +0.02 −0.25 −0.23 −0.53 −0.37
Atmos. Chem. Phys., 12, 11555–11572, 2012 www.atmos-chem-phys.net/12/11555/2012/

T. Takemura: Atmospheric aerosols from preindustrial era to 2100 11565
-1.2
-0.9
-0.6
-0.3
0
0.3
1850 1900 1950 2000 2050 2100
direct adjusted forcing (Global; surface)
adjus
ted
forc
ing (W
/m2)
Year
historical RCP2.6 RCP4.5 RCP6.0 RCP8.5
-4.0
-3.0
-2.0
-1.0
0
1.0
1850 1900 1950 2000 2050 2100
direct adjusted forcing (Asia (land); surface)
adjus
ted
forc
ing (W
/m2)
Year
historical RCP2.6 RCP4.5 RCP6.0 RCP8.5
-4.0
-3.0
-2.0
-1.0
0
1.0
1850 1900 1950 2000 2050 2100
direct adjusted forcing (Europe (land); surface)
adjus
ted
forc
ing (W
/m2)
Year
historical RCP2.6 RCP4.5 RCP6.0 RCP8.5
-4.0
-3.0
-2.0
-1.0
0
1.0
1850 1900 1950 2000 2050 2100
direct adjusted forcing (North America (land); surface)
adjus
ted
forc
ing (W
/m2)
Year
historical RCP2.6 RCP4.5 RCP6.0 RCP8.5-4.0
-3.0
-2.0
-1.0
0
1.0
1850 1900 1950 2000 2050 2100
direct adjusted forcing (South America (land); surface)
adjus
ted
forc
ing (W
/m2)
Year
historical RCP2.6 RCP4.5 RCP6.0 RCP8.5-4.0
-3.0
-2.0
-1.0
0
1.0
1850 1900 1950 2000 2050 2100
direct adjusted forcing (Oceania (land); surface)
adjus
ted
forc
ing (W
/m2)
Year
historical RCP2.6 RCP4.5 RCP6.0 RCP8.5
-4.0
-3.0
-2.0
-1.0
0
1.0
1850 1900 1950 2000 2050 2100
direct adjusted forcing (Africa (land); surface)
adjus
ted
forc
ing (W
/m2)
Year
historical RCP2.6 RCP4.5 RCP6.0 RCP8.5
-4.0
-3.0
-2.0
-1.0
0
1.0
1850 1900 1950 2000 2050 2100
direct adjusted forcing (Near/Middle East (land); surface)
adjus
ted
forc
ing (W
/m2)
Year
historical RCP2.6 RCP4.5 RCP6.0 RCP8.5
(g)
(b)
(h)
(a)
(c)
(d) (e) (f)
Fig. 9. Time series of annual and(a) global or(b)–(h) regional mean adjusted forcing due to the aerosol direct effect at the surface relativeto the preindustrial experiment simulated by SPRINTARS. The regional mean values are only over land. The historical period is shown inblack, and the four RCPs are shown in colours.
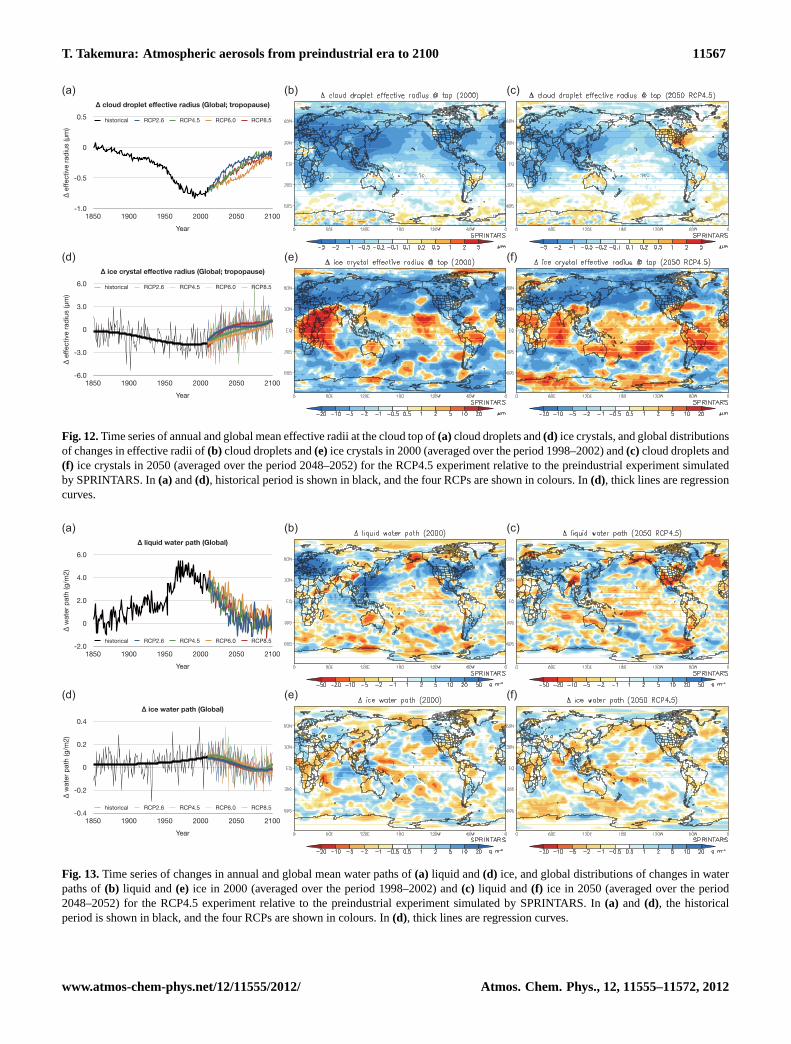
that from the satellite retrieval (Quaas et al., 2009). Figure12presents changes in the effective radii of cloud droplets andice crystals at the cloud top. The cloud droplets are smallerin the present day than in the preindustrial era almost allover the globe, particularly the high aerosol concentrationregions in the Northern Hemisphere (Fig.12b, c). The max-imum global mean change relative to the preindustrial era is−0.8 µm around 1990 (Fig.12a). The ratio of the change is−7 %, which is close to the value reported in a previous study(Takemura et al., 2005). Few differences are estimated in thecloud droplet effective radius in the different RCPs for thefuture projection, although it is slightly smaller in RCP6.0in the mid-21st century, which is consistent with the change
in aerosol loading (Figs.4 and6). The size of present-dayice crystals at the cloud top is estimated to be smaller than inpreindustrial era over mid- and high-latitudes of the NorthernHemisphere, whereas it is larger over the tropics (Fig.12e,f). Small ice crystals are mainly the result of an increase inBC concentration (Lohmann, 2001). The number concentra-tion of ice crystals produced via homogeneous nucleation bywhich tropical cirrus clouds are mainly formed decreases dueto an increase in the temperature in this study using a param-eterization ofKarcher and Lohmann(2002), so that the sizeof each ice crystal increases in the tropics. The global meanchange reaches a maximum around 1990, and the ratio of thischange is estimated to be−4 %.
www.atmos-chem-phys.net/12/11555/2012/ Atmos. Chem. Phys., 12, 11555–11572, 2012

11566 T. Takemura: Atmospheric aerosols from preindustrial era to 2100
(a)
(b) (c)
(d) (e)
Fig. 10.Global distributions of adjusted forcing due to the aerosol direct effect at the surface in(a)2000 (averaged over the period 1998–2002)and(b)–(e)2050 (averaged over the period 2048–2052) for the four RCPs relative to the preindustrial experiment simulated by SPRINTARS.
-0.4
-0.2
0
0.2
0.4
1850 1870 1890 1910 1930 1950 1970 1990 2010
direct adjusted forcing (Global; tropopause)
adju
sted
forc
ing
(W/m
2)
Year
Total Fossil fuel BC Fossil fuel POMFossil fuel sulfate biomass burning
-1.2
-0.9
-0.6
-0.3
0
0.3
1850 1870 1890 1910 1930 1950 1970 1990 2010
direct adjusted forcing (Global; surface)
adju
sted
forc
ing
(W/m
2)
Year
Total Fossil fuel BC Fossil fuel POMFossil fuel sulfate biomass burning
(b)(a)
Fig. 11.Time series of annual and global mean adjusted forcing due to the direct effect by aerosols from fossil fuel (BC, POM, and sulphate)and from biomass burning at the(a) tropopause and(b) surface relative to the preindustrial experiment simulated by SPRINTARS.
A trend for the liquid water path to increase from the prein-dustrial era to the present day is prominent over Europe, EastAsia, and North America, where aerosol concentrations arehigh (Fig. 13b). In the other regions, however, this trend isnot obvious, because an analysis of changes in parametersbetween the years concerned and the preindustrial era in-cludes a rapid response of the climate system to the aerosoleffects, which may not result in simple trends in areas whereaerosol concentrations are not high. In the mid-21st century,the increasing trend of the liquid water path is predicted to beless distinct than for the present day, although it is still largerthan in the preindustrial era in Eurasia and East Asia and lessthan parts of North America (Fig.13c), which correspondsto the variations of AOT (Fig.6). Changes in the liquid waterpath with changes in AOT are quantitatively similar to satel-
lite retrievals in SPRINTARS (Quaas et al., 2009). The icewater path is estimated to increase slightly from the prein-dustrial era to the present day and to decrease in the future,although the spatial pattern is not clear (Fig.13d–f). Few dif-ferences are estimated in the liquid and ice water paths in thedifferent RCPs for the future projection.
Based on the above analyses of changes in the aerosolloading, and the size and water path of cloud droplets andice crystals, forcing by the indirect aerosol effect can be con-sidered. Figures14 and15 present a time series and globaldistribution of the adjusted forcing (AF) due to the aerosolindirect effect at the tropopause, respectively. The global andregional trends are generally similar to those of the aerosoldirect effect (Fig.7). The year-to-year variations are, how-ever, much larger than the variations due to the direct effect
Atmos. Chem. Phys., 12, 11555–11572, 2012 www.atmos-chem-phys.net/12/11555/2012/
T. Takemura: Atmospheric aerosols from preindustrial era to 2100 11567
-1.0
-0.5
0
0.5
1850 1900 1950 2000 2050 2100
cloud droplet effective radius (Global; tropopause)
effe
ctive
radi
us (µ
m)
Year
historical RCP2.6 RCP4.5 RCP6.0 RCP8.5
-6.0
-3.0
0
3.0
6.0
1850 1900 1950 2000 2050 2100
ice crystal effective radius (Global; tropopause)
effe
ctive
radi
us (µ
m)
Year
historical RCP2.6 RCP4.5 RCP6.0 RCP8.5
(a) (b) (c)
(d) (e) (f)
Fig. 12.Time series of annual and global mean effective radii at the cloud top of(a) cloud droplets and(d) ice crystals, and global distributionsof changes in effective radii of(b) cloud droplets and(e) ice crystals in 2000 (averaged over the period 1998–2002) and(c) cloud droplets and(f) ice crystals in 2050 (averaged over the period 2048–2052) for the RCP4.5 experiment relative to the preindustrial experiment simulatedby SPRINTARS. In(a) and(d), historical period is shown in black, and the four RCPs are shown in colours. In(d), thick lines are regressioncurves.
-2.0
0
2.0
4.0
6.0
1850 1900 1950 2000 2050 2100
liquid water path (Global)
wat
er p
ath
(g/m
2)
Year
historical RCP2.6 RCP4.5 RCP6.0 RCP8.5
-0.4
-0.2
0
0.2
0.4
1850 1900 1950 2000 2050 2100
ice water path (Global)
wat
er p
ath
(g/m
2)
Year
historical RCP2.6 RCP4.5 RCP6.0 RCP8.5
(a) (b) (c)
(d) (e) (f)
Fig. 13.Time series of changes in annual and global mean water paths of(a) liquid and(d) ice, and global distributions of changes in waterpaths of(b) liquid and(e) ice in 2000 (averaged over the period 1998–2002) and(c) liquid and(f) ice in 2050 (averaged over the period2048–2052) for the RCP4.5 experiment relative to the preindustrial experiment simulated by SPRINTARS. In(a) and (d), the historicalperiod is shown in black, and the four RCPs are shown in colours. In(d), thick lines are regression curves.
www.atmos-chem-phys.net/12/11555/2012/ Atmos. Chem. Phys., 12, 11555–11572, 2012
11568 T. Takemura: Atmospheric aerosols from preindustrial era to 2100
-3.0
-2.0
-1.0
0
1.0
1850 1900 1950 2000 2050 2100
indirect adjusted forcing (Global; tropopause)
adjus
ted
forc
ing (W
/m2)
Year
historical RCP2.6 RCP4.5 RCP6.0 RCP8.5
-8.0
-6.0
-4.0
-2.0
0
2.0
4.0
1850 1900 1950 2000 2050 2100
indirect adjusted forcing (Asia (land); tropopause)
adjus
ted
forc
ing (W
/m2)
Year
historical RCP2.6 RCP4.5 RCP6.0 RCP8.5
-8.0
-6.0
-4.0
-2.0
0
2.0
4.0
1850 1900 1950 2000 2050 2100
indirect adjusted forcing (Europe (land); tropopause)
adjus
ted
forc
ing (W
/m2)
Year
historical RCP2.6 RCP4.5 RCP6.0 RCP8.5
-8.0
-6.0
-4.0
-2.0
0
2.0
4.0
1850 1900 1950 2000 2050 2100
indirect adjusted forcing (North America (land); tropopause)
adjus
ted
forc
ing (W
/m2)
Year
historical RCP2.6 RCP4.5 RCP6.0 RCP8.5-8.0
-6.0
-4.0
-2.0
0
2.0
4.0
1850 1900 1950 2000 2050 2100
indirect adjusted forcing (South America (land); tropopause)
adjus
ted
forc
ing (W
/m2)
Year
historical RCP2.6 RCP4.5 RCP6.0 RCP8.5-8.0
-6.0
-4.0
-2.0
0
2.0
4.0
1850 1900 1950 2000 2050 2100
indirect adjusted forcing (Oceania (land); tropopause)
adjus
ted
forc
ing (W
/m2)
Year
historical RCP2.6 RCP4.5 RCP6.0 RCP8.5
-8.0
-6.0
-4.0
-2.0
0
2.0
4.0
1850 1900 1950 2000 2050 2100
indirect adjusted forcing (Africa (land); tropopause)
adjus
ted
forc
ing (W
/m2)
Year
historical RCP2.6 RCP4.5 RCP6.0 RCP8.5 -8.0
-6.0
-4.0
-2.0
0
2.0
1850 1900 1950 2000 2050 2100
indirect adjusted forcing (Near/Middle East (land); tropopause)
adjus
ted
forc
ing (W
/m2)
Year
historical RCP2.6 RCP4.5 RCP6.0 RCP8.5
(g)
(b)
(h)
(a)
(c)
(d) (e) (f)
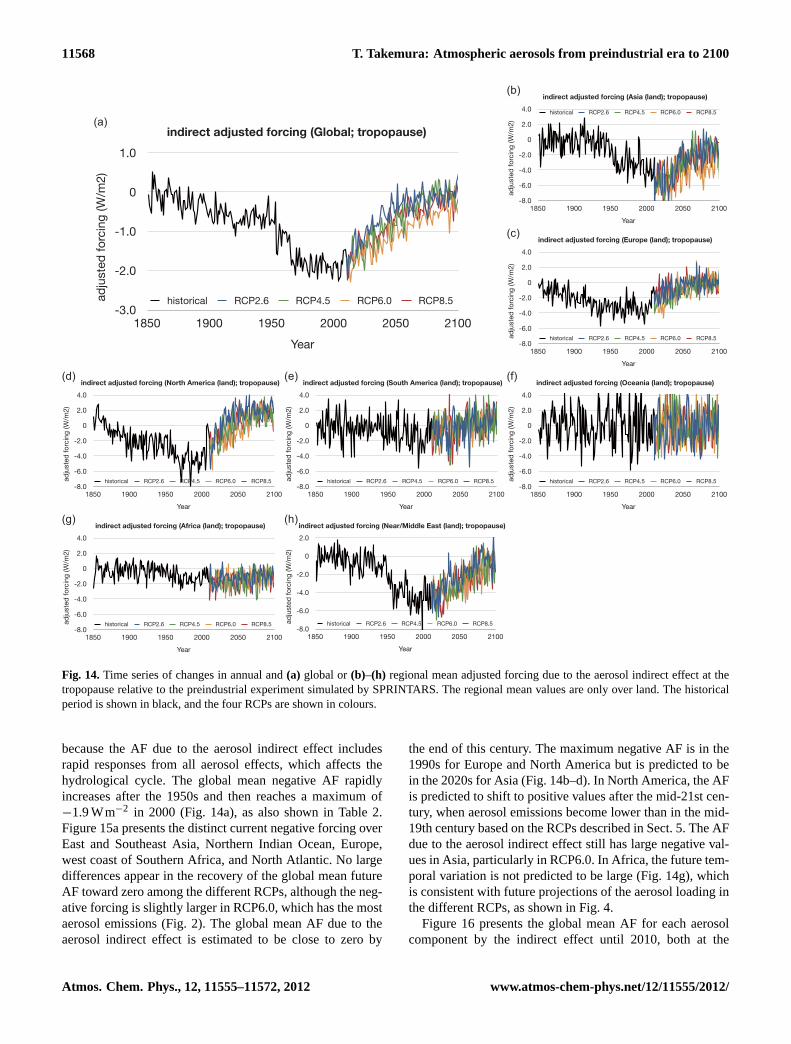
Fig. 14.Time series of changes in annual and(a) global or(b)–(h) regional mean adjusted forcing due to the aerosol indirect effect at thetropopause relative to the preindustrial experiment simulated by SPRINTARS. The regional mean values are only over land. The historicalperiod is shown in black, and the four RCPs are shown in colours.
because the AF due to the aerosol indirect effect includesrapid responses from all aerosol effects, which affects thehydrological cycle. The global mean negative AF rapidlyincreases after the 1950s and then reaches a maximum of−1.9 Wm−2 in 2000 (Fig.14a), as also shown in Table 2.Figure15a presents the distinct current negative forcing overEast and Southeast Asia, Northern Indian Ocean, Europe,west coast of Southern Africa, and North Atlantic. No largedifferences appear in the recovery of the global mean futureAF toward zero among the different RCPs, although the neg-ative forcing is slightly larger in RCP6.0, which has the mostaerosol emissions (Fig.2). The global mean AF due to theaerosol indirect effect is estimated to be close to zero by
the end of this century. The maximum negative AF is in the1990s for Europe and North America but is predicted to bein the 2020s for Asia (Fig.14b–d). In North America, the AFis predicted to shift to positive values after the mid-21st cen-tury, when aerosol emissions become lower than in the mid-19th century based on the RCPs described in Sect. 5. The AFdue to the aerosol indirect effect still has large negative val-ues in Asia, particularly in RCP6.0. In Africa, the future tem-poral variation is not predicted to be large (Fig.14g), whichis consistent with future projections of the aerosol loading inthe different RCPs, as shown in Fig.4.
Figure16 presents the global mean AF for each aerosolcomponent by the indirect effect until 2010, both at the
Atmos. Chem. Phys., 12, 11555–11572, 2012 www.atmos-chem-phys.net/12/11555/2012/

T. Takemura: Atmospheric aerosols from preindustrial era to 2100 11569
(a)
(b) (c)
(d) (e)
Fig. 15. Global distributions of adjusted forcing due to the aerosol indirect effect at the tropopause in(a) 2000 (averaged over the period1998–2002) and(b)–(e) 2050 (averaged over the period 2048–2052) for the four RCPs relative to the preindustrial experiment simulated bySPRINTARS.
-3.0
-2.0
-1.0
0
1.0
1850 1870 1890 1910 1930 1950 1970 1990 2010
indirect adjusted forcing (Global; tropopause)
adju
sted
forc
ing
(W/m
2)
Year
Total Fossil fuel BC Fossil fuel POMFossil fuel sulfate biomass burning
Fig. 16. Time series of annual and global mean adjusted forcingdue to the indirect effect by aerosols from fossil fuel (BC, POM,and sulphate) and from biomass burning at the tropopause relativeto the preindustrial experiment simulated by SPRINTARS.
tropopause and the surface. The total AF is almost equal tothe AF due to sulphate particles which act as cloud conden-sation nuclei. POM from fossil fuel consumption is a minorcontributor to the AF of the aerosol indirect effect. In thepresent MIROC-SPRINTARS simulation, BC particles aretreated as ice nuclei. If BC emissions increase, the total (liq-uid + ice) cloud water decreases because of the freezing ofsupercooled water, which promotes growth to precipitation.In contrast, reducing the size of ice crystals can result in anobstruction of their growth if the number of ice nuclei in-creases. Based on the time series shown in Fig.13e, f, it isdifficult to determine which processes are dominant.
Table 2. Global mean adjusted forcing (in Wm−2) due to theaerosol indirect effect at the tropopause in each decade (5-yr run-ning mean) relative to the preindustrial experiment simulated bySPRINTARS.
Year Hindcast RCP2.6 RCP4.5 RCP6.0 RCP8.5
1860 −0.151870 −0.051880 −0.401890 −0.431900 −0.571910 −0.551920 −0.851930 −0.711940 −0.701950 −0.781960 −1.091970 −1.741980 −1.851990 −1.752000 −1.872010 −1.69 −1.65 −1.63 −1.712020 −1.35 −1.48 −1.62 −1.372030 −0.90 −1.09 −1.39 −1.362040 −0.48 −0.88 −1.36 −1.002050 −0.30 −0.67 −0.97 −0.602060 −0.24 −0.40 −0.88 −0.322070 −0.04 −0.17 −0.70 −0.482080 −0.07 +0.05 −0.62 −0.242090 −0.17 −0.05 −0.28 −0.232100 +0.09 −0.23 −0.36 −0.15
www.atmos-chem-phys.net/12/11555/2012/ Atmos. Chem. Phys., 12, 11555–11572, 2012
11570 T. Takemura: Atmospheric aerosols from preindustrial era to 2100
7 Conclusions
In this study, the global distributions and adjusted forc-ing (AF) of atmospheric aerosols from the year 1850 to2100 were simulated using the global aerosol climate model,SPRINTARS. The emission inventories of anthropogenicBC, POM, and SO2 used in the simulation were based onLamarque et al.(2010) for the historical period and theRepresentative Concentration Pathways (RCPs) (Moss et al.,2010) for the future projections, which were obtained fromthe standard database in the Coupled Model Intercompari-son Project Phase 5 (CMIP5) in conjunction with the FifthAssessment Report (AR5) of the Intergovernmental Panel onClimate Change (IPCC). Natural aerosol emissions for soildust particles and sea salt were calculated with parameters in-side the model, which were then influenced by global warm-ing. The regional mean aerosol loading and optical thicknessreached a maximum in the 1970s to 1980s in Europe andNorth America, which is consistent with the global mean. Incontrast, in Asia they were estimated to remain at high levelsuntil the mid-21st century in RCP6.0 and to reach a maxi-mum in the 2010s. A large amount of aerosols from biomassburning will be released throughout this century, accordingto the RCPs. Soil dust particles and sea salt emissions werepredicted to increase because of the expansion of arid areasand the melting of sea ice over the Arctic region, respectivelyboth of which are a consequence of global warming.
The AF includes the rapid response of the climate systemto changes in climate forcing agents calculated for the pre-scribed sea surface temperature and sea ice cover. Time evo-lution of the AF by the aerosol direct and indirect effectstypically correspond to the aerosol loading. The global meannegative AF, both at the tropopause and the surface, rapidlyincreased due to the aerosol direct effect after the 1950s andpeaked in the 1970s to 1990s, a similar temporal variationto that in Europe and North America. Asia was predicted toretain a high negative AF due to the direct effect until themid-21st century in RCP6.0, which affects the time seriesfor the global mean. The maximum negative AF due to theaerosol indirect effect was in the 1990s for Europe and NorthAmerica, but was predicted to be in the 2020s for Asia. Bythe end of the 21st century, aerosol forcing will be close tozero, relative to the preindustrial era, for all RCPs, and globalwarming is likely to accelerate under conditions of reducedaerosol negative forcing with continuous increases in green-house gases.
Acknowledgements.We would like to thank the developers ofboth SPRINTARS and MIROC. The simulation in this study waspartly executed on the NEC SX-8R of the National Institute forEnvironmental Studies, Japan. This study was supported by theFunding Program for Next Generation World-Leading Researchersby the Cabinet Office, Government of Japan (GR079).
Edited by: A. Laaksonen
References
Abdul-Razzak, H. and Ghan, S. J.: A parameterization of aerosolactivation: 2. multiple aerosol type, J. Geophys. Res., 105, 6837–6844, 2000.
Albrecht, B. A.: Aerosols, cloud microphysics, and fractionalcloudiness, Science, 245, 1227–1230, 1989.
d’Almeida, G. A., Koepke, P., and Shettle, E.: AtmosphericAerosols: Global Climatology and Radiative Forcing, A. Deepak,Hampton, VA, USA, 561 pp., 1991.
Andres, R. J. and Kasgnoc, A. D.: A time-averaged inventoryof subaerial volcanic sulfur emissions, J. Geophys. Res., 103,25251–25261, 1998.
Bates, T. S., Charlson, R. J., and Gammon, R. H.: Evidence for theclimate role of marine biogenic sulphur, Nature, 329, 319–321,1987.
Bellouin, N., Rae, J., Jones, A., Johnson, C., Haywood, J., andBoucher, O.: Aerosol forcing in the Climate Model Intercom-parison Project (CMIP5) simulations by HadGEM2-ES and therole of ammonium nitrate, J. Geophys. Res., 116, D20206,doi:10.1029/2011JD016074, 2011.
Deepak, A. and Gerber, H. G. (Eds.): Report of the experts meetingon aerosols and their climatic effects, World Meteorological Or-ganization, Geneva, Switzerland, Rep. WCP-55, 107 pp., 1983.
Diehl, K., Simmel, M., and Wurzler, S.: Numerical sensitivity stud-ies on the impact of aerosol properties and drop freezing modeson the glaciation, microphysics, and dynamics of clouds, J. Geo-phys. Res., 111, D07202, doi:10.1029/2005JD005884, 2006.
Forster, P., Ramaswamy, V., Artaxo, P., Berntsen, T., Betts, R., Fa-hey, D. W., Haywood, J., Lean, J., Lowe, D. C., Myhre, G.,Nganga, J., Prinn, R., Raga, G., Schulz, M., and Van Dorland, R.:Changes in atmospheric constituents and in radiative forcing, in:Climate Change 2007: The Physical Science Basis, Contributionof Working Group I to the Fourth Assessment Report of the Inter-governmental Panel on Climate Change, edited by: Solomon, S.,Qin, D., Manning, M., Chen, Z., Marquis, M., Averyt, K. B., Tig-nor, M., and Miller, H. L., Cambridge University Press, Cam-bridge, UK and New York, NY, USA, 129–234, 2007.
Griffin, R. J., Cocker III, D. R., Seinfeld, J. H., and Dabdub, D.:Estimate of global atmospheric organic aerosol from oxidationof biogenic hydrocarbons, Geophys. Res. Lett., 26, 2721–2724,1999.
Guenther, A., Hewitt, C. N., Erickson, D., Fall, R., Geron, C.,Graedel, T., Harley, P., Klinger, L., Lerdau, M., McKay, W. A.,Pierce, T., Scholes, B., Steinbrecher, R., Tallamraju, R., Tay-lor, J., and Zimmerman, P.: A global model of natural volatileorganic compound emissions, J. Geophys. Res., 100, 8873–8892,1995.
Hansen, J., Sato, M., Nazarenko, L., Ruedy, R., Lacis, A., Koch, D.,Tegen, I., Hall, T., Shindell, D., Santer, B., Stone, P., Novakov, T.,Thomason, L., Wang, R., Wang, Y., Jacob, D., Hollandsworth, S.,Bishop, L., Logan, J., Thompson, A., Stolarski, R., Lean, J.,Willson, R., Levitus, S., Antonov, J., Rayner, N., Parker, D.,and Christy, J.: Climate forcings in Goddard Institute forSpace Studies SI2000 simulations, J. Geophys. Res., 107, 4347,doi:10.1029/2001JD001143, 2002.
Haywood, J. M. and Ramaswamy, V.: Global sensitivity studiesof the direct radiative forcing due to anthropogenic sulfate andblack carbon aerosols, J. Geophys. Res., 103, 6043–6058, 1998.
Atmos. Chem. Phys., 12, 11555–11572, 2012 www.atmos-chem-phys.net/12/11555/2012/

T. Takemura: Atmospheric aerosols from preindustrial era to 2100 11571
Horowitz, L. W.: Past, present, and future concentrations of tro-pospheric ozone and aerosols: Methodology, ozone evaluation,and sensitivity to aerosol wet removal, J. Geophys. Res., 111,D22211, doi:10.1029/2005JD006937, 2006.
Intergovernmental Panel on Climate Change: Climate Change2007: The Physical Science Basis, Contribution of WorkingGroup I to the Fourth Assessment Report of the Intergovernmen-tal Panel on Climate Change, edited by: Solomon, S., Qin, D.,Manning, M., Chen, Z., Marquis, M., Averyt, K. B., Tignor, M.,and Miller, H. L., Cambridge University Press, Cambridge, UKand New York, NY, USA, 996 pp., 2007.
Karcher, B. and Lohmann, U.: A parameterization of cirrus cloudformation: Homogeneous freezing of supercooled aerosols, J.Geophys. Res., 107, 4010, doi:10.1029/2001JD000470, 2002.
Kinne, S., Lohmann, U., Feichter, J., Schulz, M., Timmreck, C.,Ghan, S., Easter, R., Chin, M., Ginoux, P., Takemura, T.,Tegen, I., Koch, D., Herzog, M., Penner, J., Pitari, G., Holben, B.,Eck, T., Smirnov, A., Dubovik, O., Slutsker, I., Tanre, D., Tor-res, O., Mishchenko, M., Geogdzhayev, I., Chu, A., and Kauf-man, Y.: Monthly averages of aerosol properties: a global com-parison among models, satellite data and AERONET grounddata, J. Geophys. Res., 108, 4634, doi:10.1029/2001JD001253,2003.
Kloster, S., Mahowald, N. M., Randerson, J. T., and Lawrence, P. J.:The impacts of climate, land use, and demography on fires duringthe 21st century simulated by CLM-CN, Biogeosciences, 9, 509–525, doi:10.5194/bg-9-509-2012, 2012.
Koch, D. and Del Genio, A. D.: Black carbon semi-direct effectson cloud cover: review and synthesis, Atmos. Chem. Phys., 10,7685–7696, doi:10.5194/acp-10-7685-2010, 2010.
Lamarque, J.-F., Bond, T. C., Eyring, V., Granier, C., Heil, A.,Klimont, Z., Lee, D., Liousse, C., Mieville, A., Owen, B.,Schultz, M. G., Shindell, D., Smith, S. J., Stehfest, E., Van Aar-denne, J., Cooper, O. R., Kainuma, M., Mahowald, N., Mc-Connell, J. R., Naik, V., Riahi, K., and van Vuuren, D. P.: Histor-ical (1850???2000) gridded anthropogenic and biomass burningemissions of reactive gases and aerosols: methodology and ap-plication, Atmos. Chem. Phys., 10, 7017–7039, doi:10.5194/acp-10-7017-2010, 2010.
Lebsock, M. D., Stephens, G. L., and Kummerow, C.: Multisensorsatellite observations of aerosol effects on warm clouds, J. Geo-phys. Res., 113, D15205, doi:10.1029/2008JD009876, 2008.
Lohmann, U.: A glaciation indirect aerosol effect causedby soot aerosols, Geophys. Res. Lett., 29, 1052,doi:10.1029/2001GL014357, 2001.
Lohmann, U. and Diehl, K.: Sensitivity studies of the importance ofdust ice nuclei for the indirect aerosol effect on stratiform mixed-phase clouds, J. Atmos. Sci., 63, 968–982, 2006.
Lohmann, U. and Feichter, J.: Global indirect aerosol effects: a re-view, Atmos. Chem. Phys., 5, 715–737, doi:10.5194/acp-5-715-2005, 2005.
Monahan, E. C., Spiel, D. E., and Davidson, K. L.: A model ofmarine aerosol generation via whitecaps and wave disruption, in:Oceanic Whitecaps, edited by: Monahan, E., Niocaill, G. M., andReidel, D., Norwell, Mass., USA, 167–174, 1986.
Moss, R. H., Edmonds, J. A., Hibbard, K. A., Manning, M. R.,Rose, S. K., van Vuuren, D. P., Carter, T. R., Emori, S.,Kainuma, M., Kram, T., Meehl, G. A., MItchell, F. B., Nakicen-ovic, N., Riahi, K., Smith, S. J., Stouffer, R. J., Thomson, A. M.,
Weyant, J. P., and Wilbanks, T. J.: The next generation of sce-narios for climate change research and assessment, Nature, 463,747–756, doi:10.1038/nature08823, 2010.
Myhre, G., Myhre, A., and Stordal, F.: Historical evolution of radia-tive forcing of climate, Atmos. Environ., 35, 2361–2373, 2001.
Myhre, G., Berglen, T. F., Johnsrud, M., Hoyle, C. R.,Berntsen, T. K., Christopher, S. A., Fahey, D. W., Isak-sen, I. S. A., Jones, T. A., Kahn, R. A., Loeb, N., Quinn, P.,Remer, L., Schwarz, J. P., and Yttri, K. E.: Modelled radiativeforcing of the direct aerosol effect with multi-observation eval-uation, Atmos. Chem. Phys., 9, 1365–1392, doi:10.5194/acp-9-1365-2009, 2009.
Nozawa, T., Nagashima, T., Shiogama, H., and Crooks, S. A.: De-tecting natural influence on surface air temperature change inthe early twentieth century, Geophys. Res. Lett., 32, L20719,doi:10.1029/2005GL023540, 2005.
Pechony, O., and Shindell, D. T.: Driving forces of global wild-fires over the past millennium and the forthcoming century, Proc.Natl. A. Sci., 107, 19167–19170, doi:10.1073/pnas.1003669107,2010.
Quaas, J., Ming, Y., Menon, S., Takemura, T., Wang, M.,Penner, J. E., Gettelman, A., Lohmann, U., Bellouin, N.,Boucher, O., Sayer, A. M., Thomas, G. E., McComiskey, A.,Feingold, G., Hoose, C., Kristjansson, J. E., Liu, X., Balkan-ski, Y., Donner, L. J., Ginoux, P. A., Stier, P., Grandey, B., Fe-ichter, J., Sednev, I., Bauer, S. E., Koch, D., Grainger, R. G.,Kirkevag, A., Iversen, T., Seland,O., Easter, R., Ghan, S. J.,Rasch, P. J., Morrison, H., Lamarque, J.-F., Iacono, M. J.,Kinne, S., and Schulz, M.: Aerosol indirect effects – generalcirculation model intercomparison and evaluation with satellitedata, Atmos. Chem. Phys., 9, 8697–8717, doi:10.5194/acp-9-8697-2009, 2009.
Science: U. S. Tweets Chinese Air Quality, Science, 336, p. 787,2012.
Sekiguchi, M. and Nakajima, T.: Ak-distribution-based radiationcode and its computational optimization for an atmospheric gen-eral circulation model, J. Quant. Spectrosc. Ra., 109, 2779–2793,2008.
Skeie, R. B., Berntsen, T. K., Myhre, G., Tanaka, K.,Kvalevag, M. M., and Hoyle, C. R.: Anthropogenic radia-tive forcing time series from pre-industrial times until 2010,Atmos. Chem. Phys., 11, 11827–11857, doi:10.5194/acp-11-11827-2011, 2011.
Spiro, P. A., Jacob, D. J., and Logan, J. A.: Global inventory ofsulfur emissions with 1◦ × 1◦ resolution, J. Geophys. Res., 97,6023–6036, 1992.
Sudo, K., Takahashi, M., Kurokawa, J., and Akimoto, H.:CHASER: a global chemical model of the troposphere:1. model description, J. Geophys. Res., 107, 4339,doi:10.1029/2001JD001113, 2002.
Takemura, T., Okamoto, H., Maruyama, Y., Numaguti, A., Hig-urashi, A., and Nakajima, T.: Global three-dimensional simula-tion of aerosol optical thickness distribution of various origins, J.Geophys. Res., 105, 17853–17873, 2000.
Takemura, T., Nakajima, T., Dubovik, O., Holben, B. N., andKinne, S.: Single-scattering albedo and radiative forcing of var-ious aerosol species with a global three-dimensional model, J.Climate, 15, 333–352, 2002a.
www.atmos-chem-phys.net/12/11555/2012/ Atmos. Chem. Phys., 12, 11555–11572, 2012

11572 T. Takemura: Atmospheric aerosols from preindustrial era to 2100
Takemura, T., Uno, I., Nakajima, T., Higurashi, A., and Sano, I.:Modeling study of long-range transport of Asian dust and an-thropogenic aerosols from East Asia, Geophys. Res. Lett., 29,2158,doi:10.1029/2002GL016251, 2002b.
Takemura, T., Nakajima, T., Higurashi, A., Ohta, S., and Sugi-moto, N.: Aerosol distributions and radiative forcing over theAsian-Pacific region simulated by spectral radiation-transportmodel for aerosol species (SPRINTARS), J. Geophys. Res., 108,8659, doi:10.1029/2002JD003210, 2003.
Takemura, T., Nozawa, T., Emori, S., Nakajima, T. Y., and Naka-jima, T.: Simulation of climate response to aerosol direct and in-direct effects with aerosol transport-radiation model, J. Geophys.Res., 110, D02202, doi:10.1029/2004JD005029, 2005.
Takemura, T., Tsushima, Y., Yokohata, T., Nozawa, T., Na-gashima, T., and Nakajima, T.: Time evolutions of variousradiative forcings for the past 150 yr estimated by a gen-eral circulation model, Geophys. Res. Lett., 33, L19705,doi:10.1029/2006GL026666, 2006.
Takemura, T., Egashira, M., Matsuzawa, K., Ichijo, H., O’ishi, R.,and Abe-Ouchi, A.: A simulation of the global distribution andradiative forcing of soil dust aerosols at the Last Glacial Max-imum, Atmos. Chem. Phys., 9, 3061–3073, doi:10.5194/acp-9-3061-2009, 2009.
Takemura, T. and Uchida, T.: Global climate modeling of regionalchanges in cloud, precipitation, and radiation budget due to theaerosol semi-direct effect of black carbon, SOLA, 7, 181–184,doi:10.2151/sola.2011-046, 2011.
Textor, C., Schulz, M., Guibert, S., Kinne, S., Balkanski, Y.,Bauer, S., Berntsen, T., Berglen, T., Boucher, O., Chin, M.,Dentener, F., Diehl, T., Easter, R., Feichter, H., Fillmore, D.,Ghan, S., Ginoux, P., Gong, S., Grini, A., Heqndricks, J.,Horowitz, L., Huang, P., Isaksen, I., Iversen, I., Kloster, S.,Koch, D., Kirkevag, A., Kristjansson, J. E., Krol, M., Lauer, A.,Lamarque, J. F., Liu, X., Montanaro, V., Myhre, G., Penner, J.,Pitari, G., Reddy, S., Seland, Ø., Stier, P., Takemura, T., andTie, X.: Analysis and quantification of the diversities of aerosollife cycles within AeroCom, Atmos. Chem. Phys., 6, 1777–1813,doi:10.5194/acp-6-1777-2006, 2006.
Twomey, S.: Pollution and the planetary albedo, Atmos. Environ.,8, 1251–1256, 1974.
Washington Post: Beijing makes rare concession on pollutionmeasure, http://www.washingtonpost.com/world/asiapacific/beijing-makes-rare-concession-on-pollution-measure/2012/01/19/gIQApsI6BQstory.html, by: Richburg, K. B., last access: 4December 2012.
Watanabe, M., Suzuki, T., O’ishi, R., Komuro, Y., Watanabe, S.,Emori, S., Takemura, T., Chikira, M., Ogura, T., Sekiguchi, M.,Takata, K., Yamazaki, D., Yokohata, T., Nozawa, T., Hasumi, H.,Tatebe, H., and Kimoto, M.: Improved climate simulation byMIROC5: mean states, variability, and climate sensitivity, J. Cli-mate, 23, 6312–6335, doi:10.1175/2010JCLI3679.1, 2010.
Yamaguchi, Y. and Takemura, T.: Time evolution of integrated ob-servational times of smog and Asian dust, Tenki (in Japanese),58, 965–968, available at:http://www.metsoc.jp/tenki/pdf/2011/201111 0029.pdf, 2011.
Atmos. Chem. Phys., 12, 11555–11572, 2012 www.atmos-chem-phys.net/12/11555/2012/