Embed Size (px)
Citation preview
District Continuous Improvement Team
December 10, 2013
AGENDA
• Clarifying and Probing Questions• Roles and Responsibilities• Monitoring the Plan(s)• Instructional Rounds• 4 Types of Data
Norms
• Be present• Limit technology
to the work• Ask clarifying
questions• Honor time
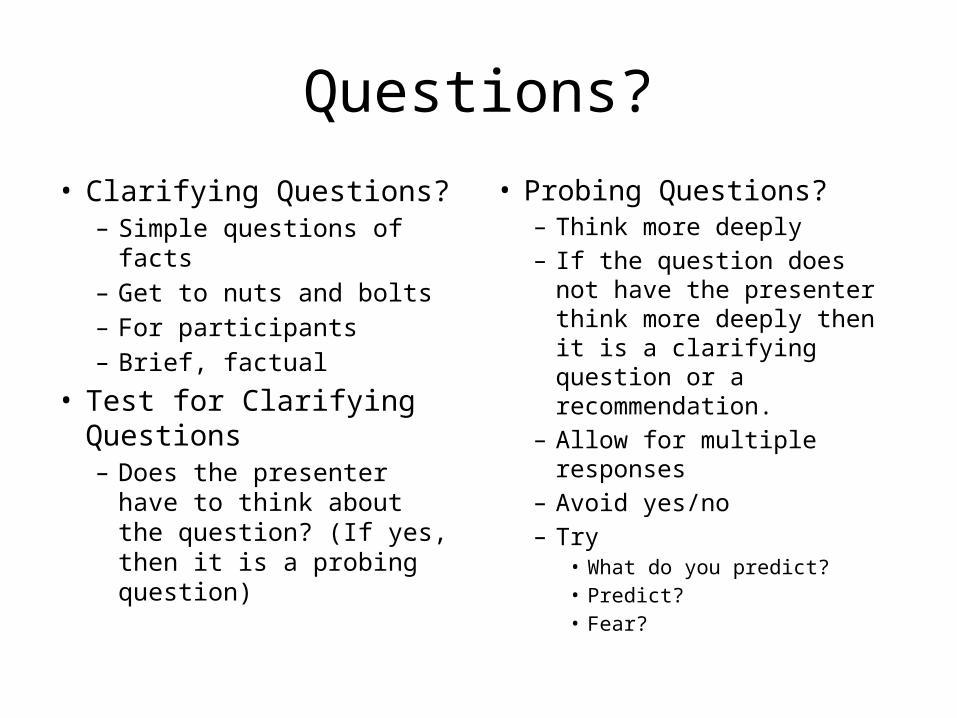
Questions?
• Clarifying Questions?– Simple questions of facts– Get to nuts and bolts– For participants– Brief, factual
• Test for Clarifying Questions– Does the presenter have
to think about the question? (If yes, then it is a probing question)
• Probing Questions?– Think more deeply– If the question does not have
the presenter think more deeply then it is a clarifying question or a recommendation.
– Allow for multiple responses– Avoid yes/no– Try
• What do you predict?• Predict?• Fear?
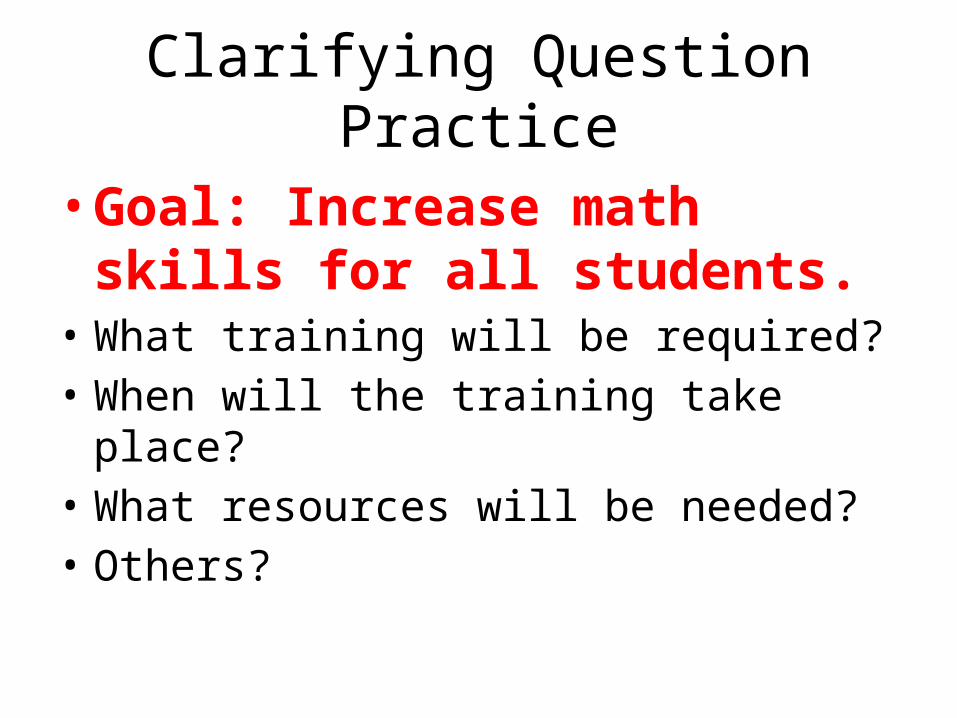
Clarifying Question Practice
• Goal: Increase math skills for all students.
• What training will be required?• When will the training take place?• What resources will be needed?• Others?
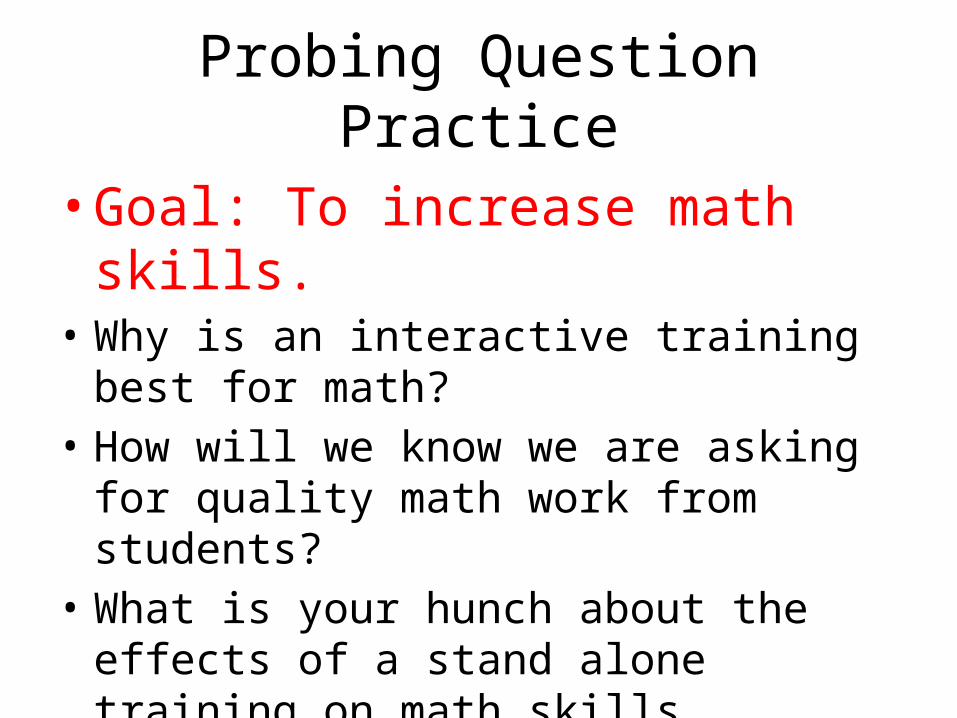
Probing Question Practice
• Goal: To increase math skills.• Why is an interactive training best for math?• How will we know we are asking for quality
math work from students?• What is your hunch about the effects of a
stand alone training on math skills.
WHY DIFFERENTIATE BETWEEN CLARIFYING AND PROBING QUESTIONS?
Consider
ROLES AND RESPONSIBILITIES
Roles and Responsibilities (RR)
• Read over• What clarifying questions do you have?• What probing questions do you have?• In your group, generate both types after
reading the RR• Be ready to share out by group
MAKING MEANINGRead: Unmistakable Impact
MONITORING THE SCHOOL IMPROVEMENT PLANS
Taking a look at each school plan….
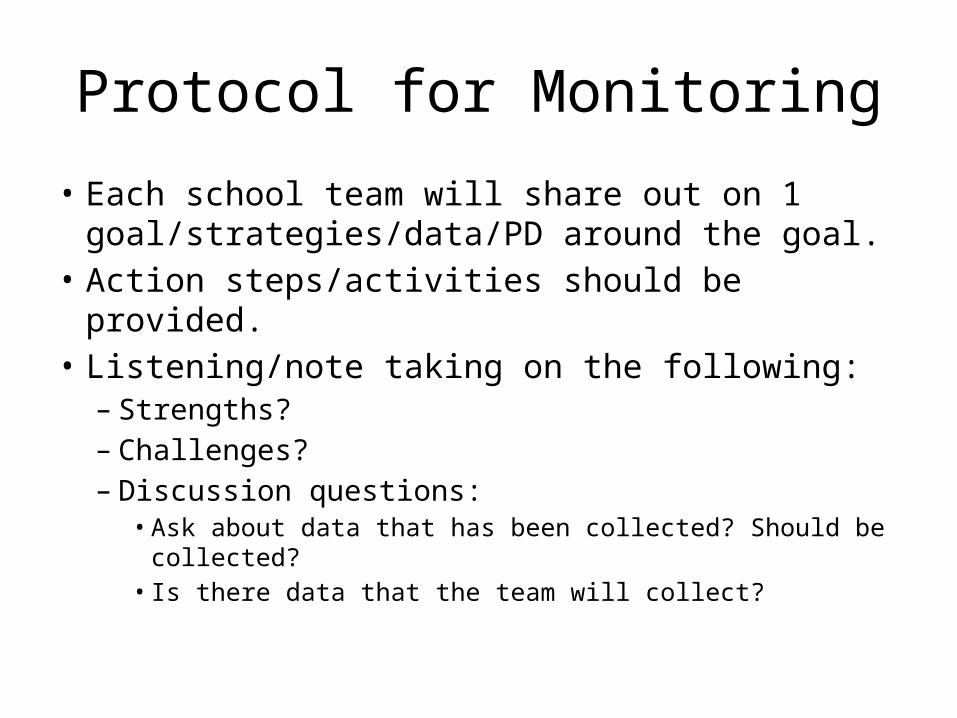
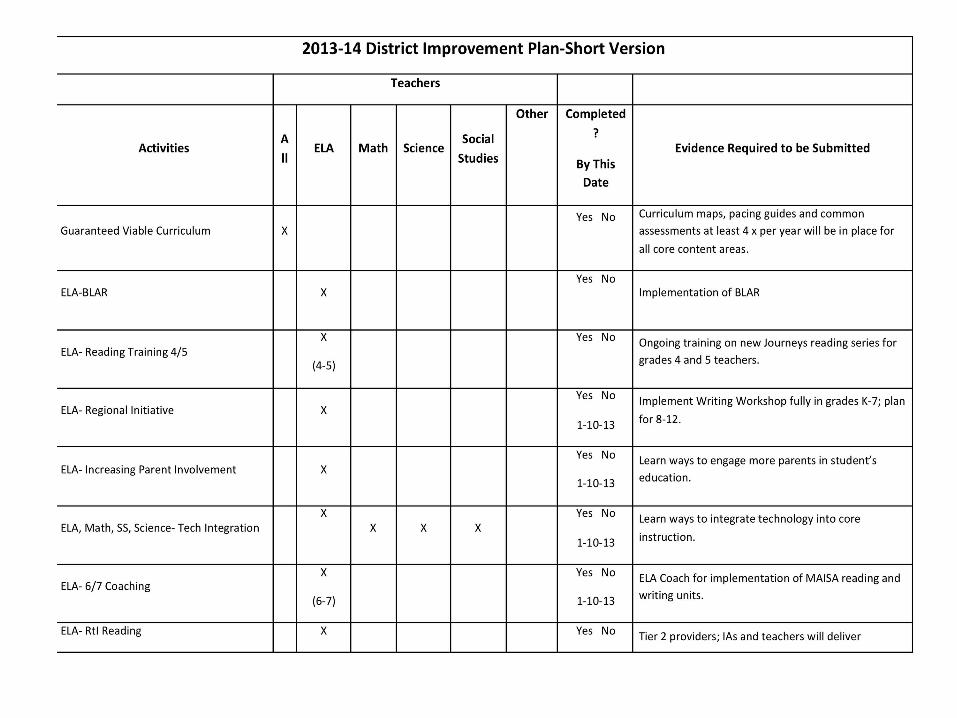
Protocol for Monitoring
• Each school team will share out on 1 goal/strategies/data/PD around the goal.
• Action steps/activities should be provided.• Listening/note taking on the following:– Strengths?– Challenges?– Discussion questions:
• Ask about data that has been collected? Should be collected?
• Is there data that the team will collect?
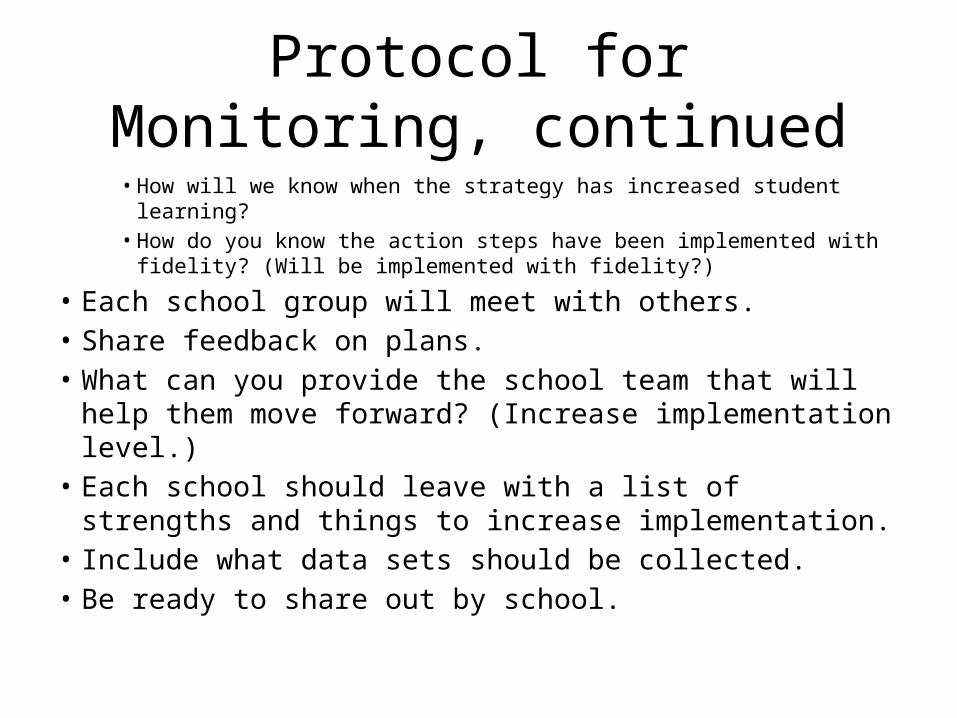
Protocol for Monitoring, continued• How will we know when the strategy has increased student learning?• How do you know the action steps have been implemented with
fidelity? (Will be implemented with fidelity?)
• Each school group will meet with others.• Share feedback on plans. • What can you provide the school team that will help them
move forward? (Increase implementation level.)• Each school should leave with a list of strengths and things
to increase implementation. • Include what data sets should be collected.• Be ready to share out by school.
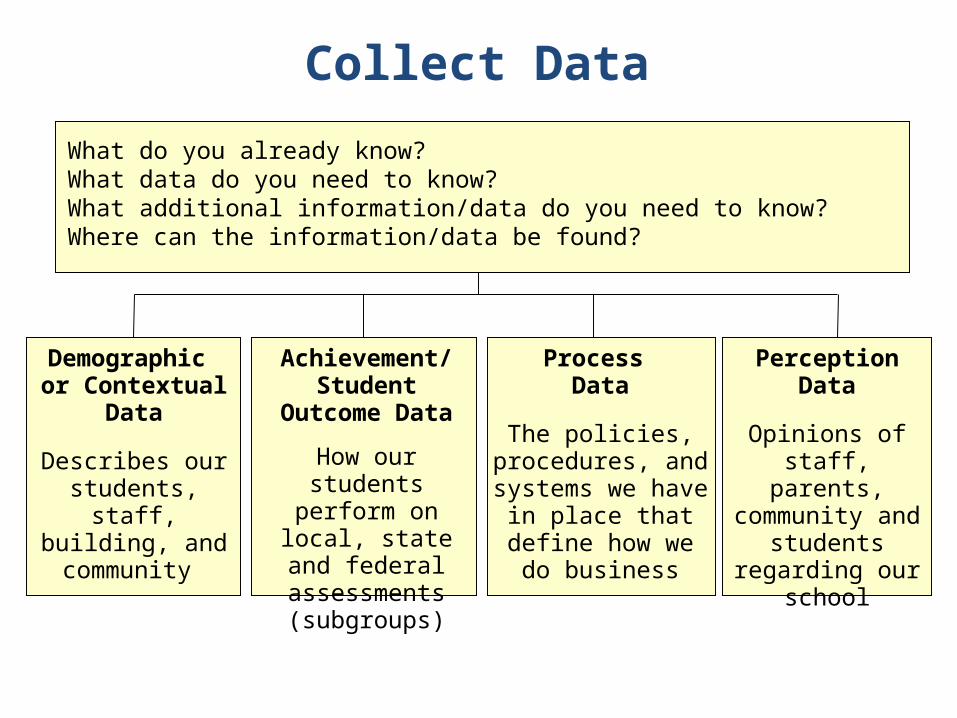
What do you already know?What data do you need to know?What additional information/data do you need to know?Where can the information/data be found?
Achievement/ Student
Outcome Data
How our students perform on local, state and federal
assessments (subgroups)
Demographic or Contextual
Data
Describes our students, staff, building, and community
Process Data
The policies, procedures, and systems we have
in place that define how we do
business
Perception Data
Opinions of
staff, parents, community and
students regarding our
school
Collect Data
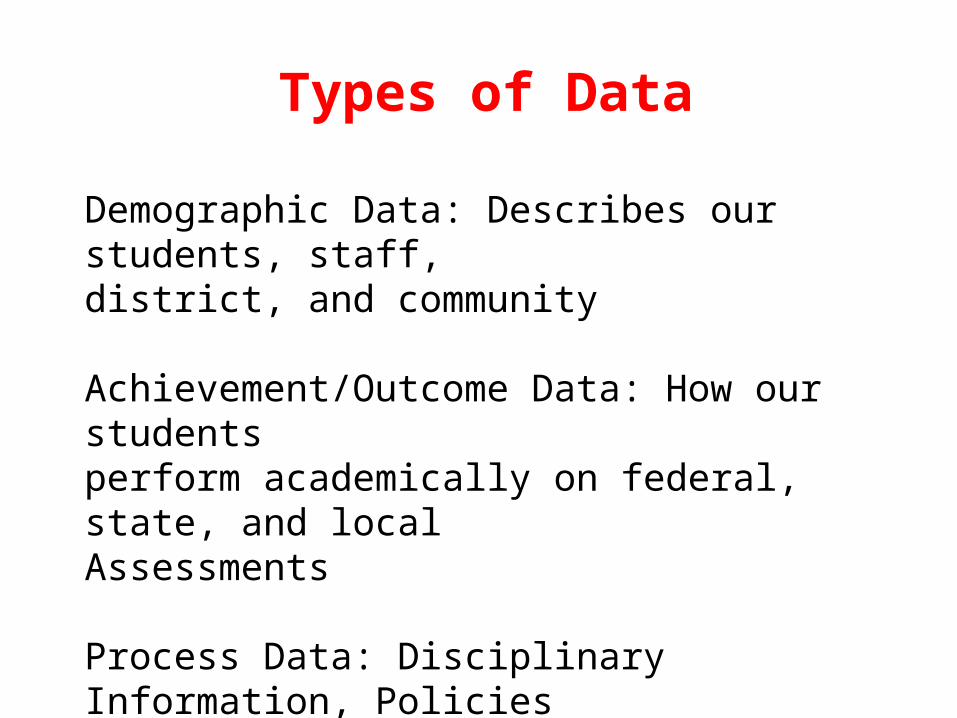
Types of Data
Demographic Data: Describes our students, staff,district, and community
Achievement/Outcome Data: How our studentsperform academically on federal, state, and localAssessments
Process Data: Disciplinary Information, Policiesand Procedures, School Process Rubrics
Perception Data: Survey Data, Opinion
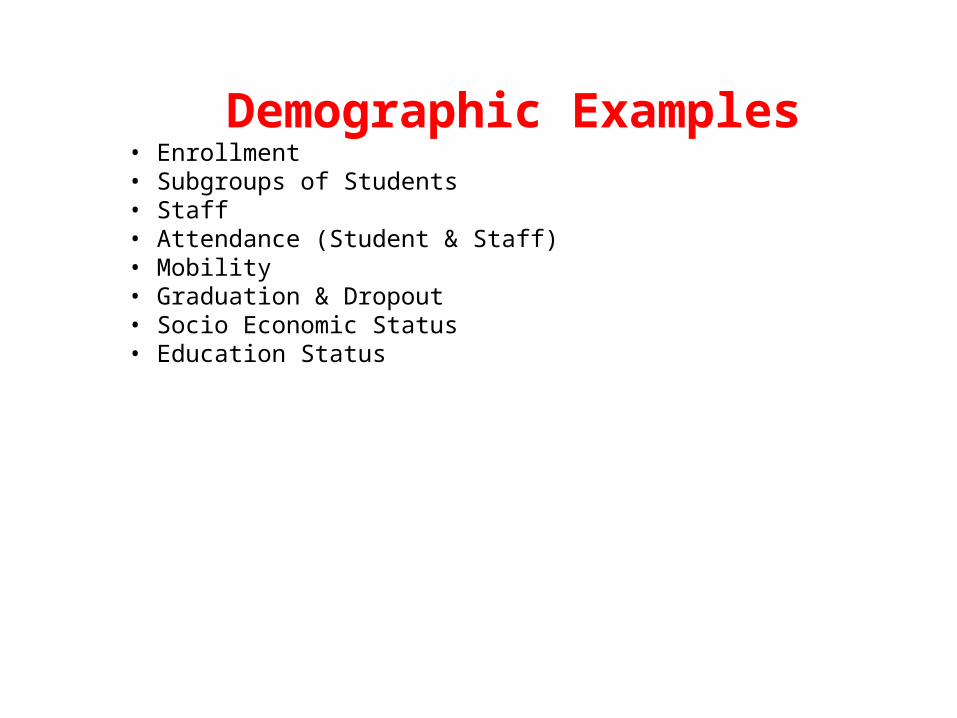
Demographic Examples• Enrollment• Subgroups of Students• Staff• Attendance (Student & Staff)• Mobility• Graduation & Dropout• Socio Economic Status• Education Status
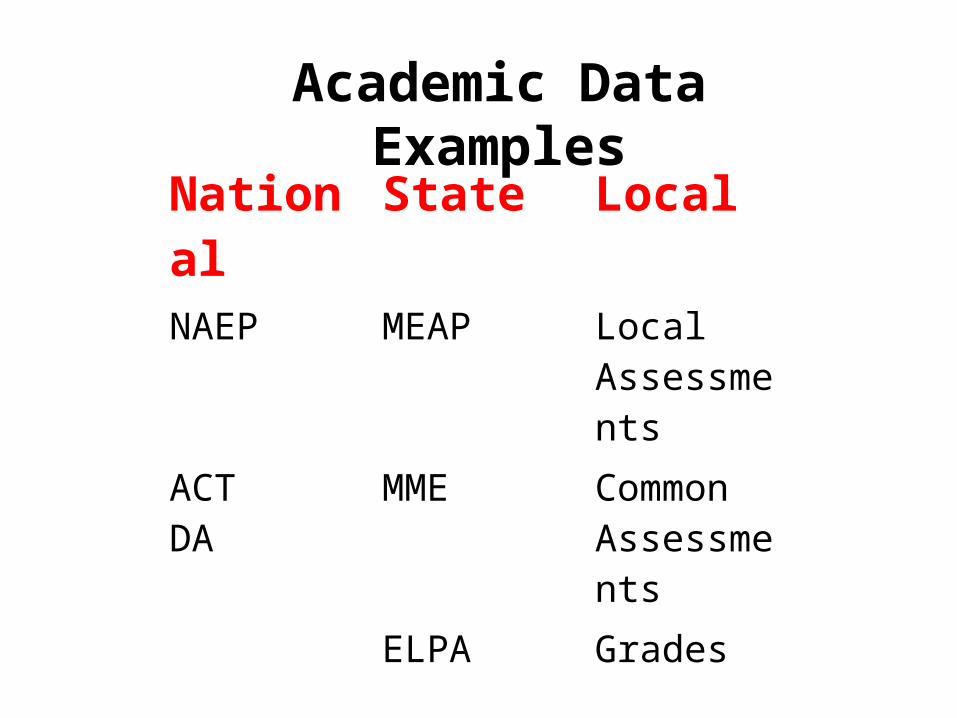
National State LocalNAEP MEAP Local
AssessmentsACTDA
MME Common Assessments
ELPA Grades
Academic Data Examples
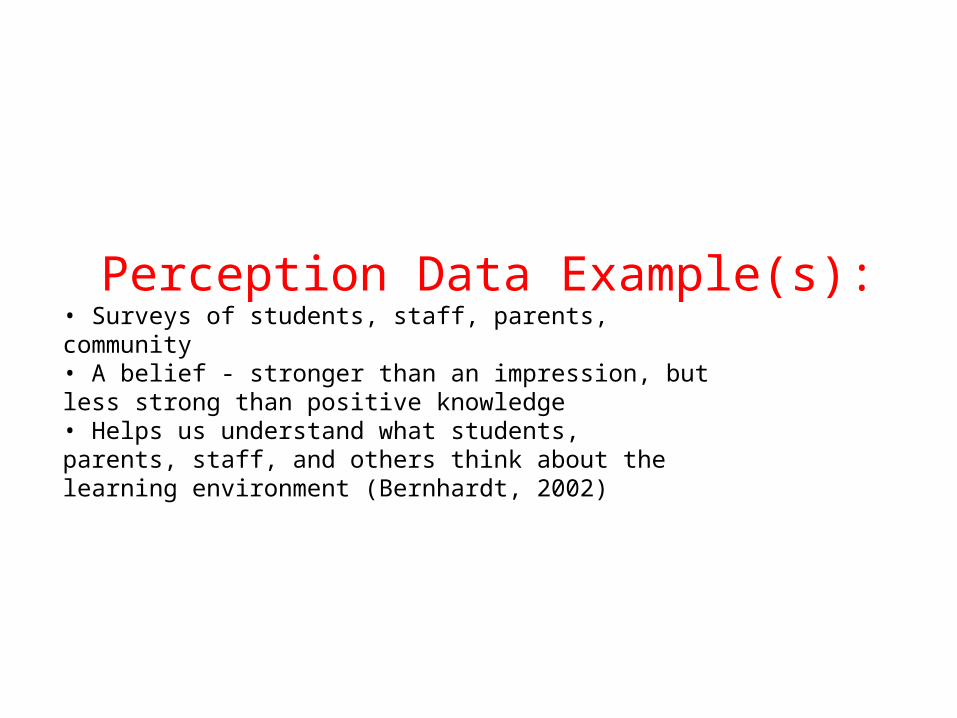
Perception Data Example(s):• Surveys of students, staff, parents,community• A belief - stronger than an impression, butless strong than positive knowledge• Helps us understand what students,parents, staff, and others think about thelearning environment (Bernhardt, 2002)
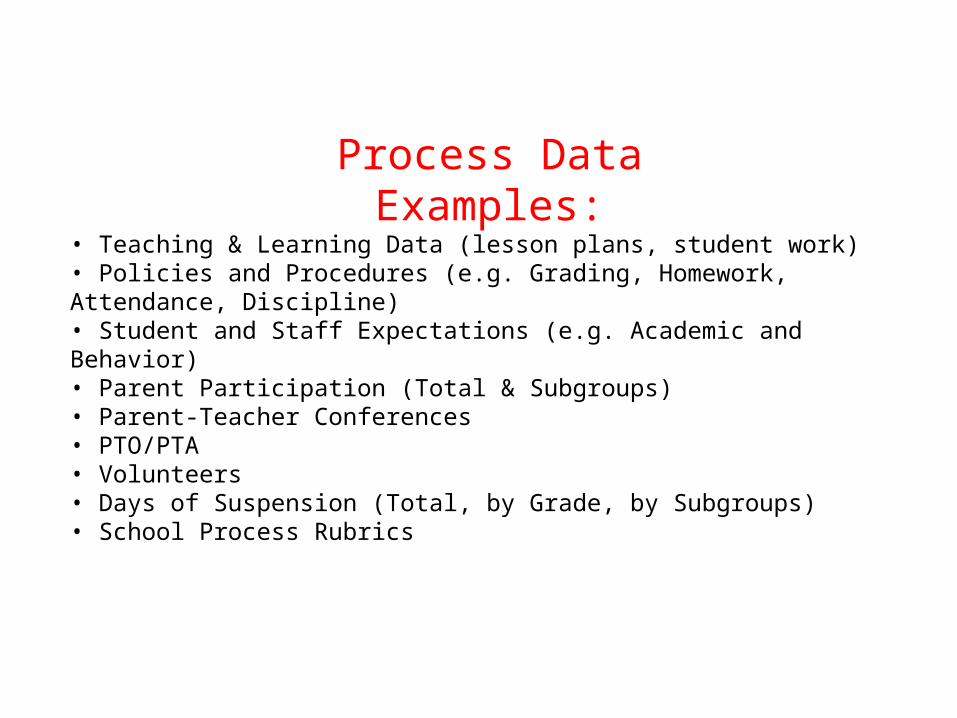
Process DataExamples:
• Teaching & Learning Data (lesson plans, student work)• Policies and Procedures (e.g. Grading, Homework,Attendance, Discipline)• Student and Staff Expectations (e.g. Academic andBehavior)• Parent Participation (Total & Subgroups)• Parent-Teacher Conferences• PTO/PTA• Volunteers• Days of Suspension (Total, by Grade, by Subgroups)• School Process Rubrics
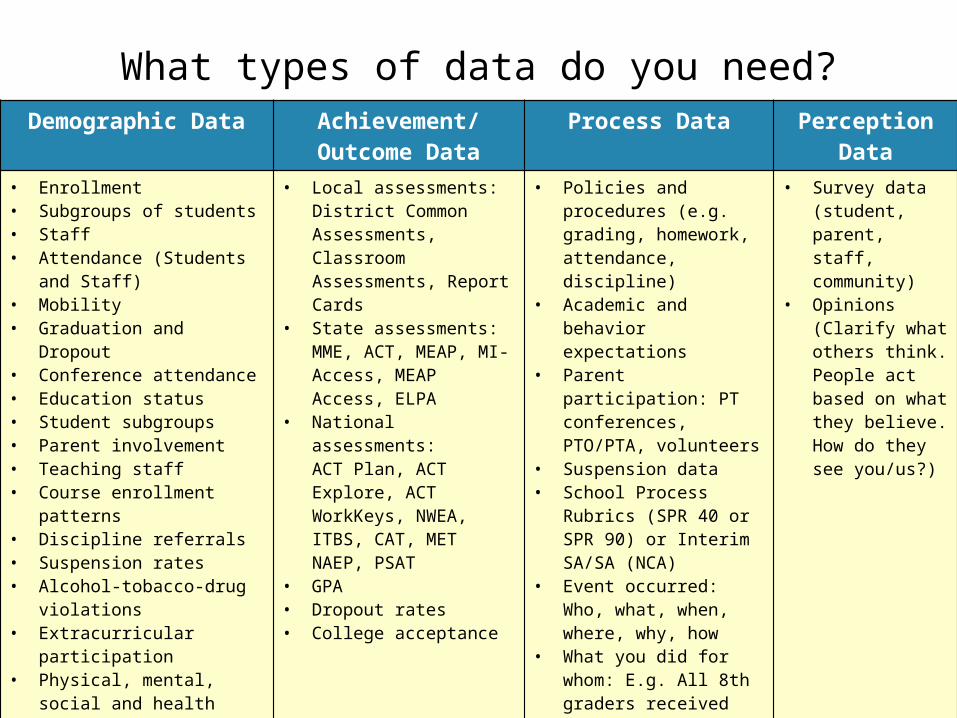
What types of data do you need?Demographic Data Achievement/
Outcome DataProcess Data Perception
Data• Enrollment• Subgroups of students• Staff• Attendance (Students and
Staff)• Mobility• Graduation and Dropout• Conference attendance• Education status• Student subgroups• Parent involvement• Teaching staff• Course enrollment
patterns• Discipline referrals• Suspension rates• Alcohol‐tobacco‐drug
violations• Extracurricular
participation• Physical, mental, social
and health
• Local assessments: District Common Assessments, Classroom Assessments, Report Cards
• State assessments:MME, ACT, MEAP, MI-Access, MEAP Access, ELPA
• National assessments:ACT Plan, ACT Explore, ACT WorkKeys, NWEA, ITBS, CAT, MET NAEP, PSAT
• GPA• Dropout rates• College acceptance
• Policies and procedures (e.g. grading, homework, attendance, discipline)
• Academic and behavior expectations
• Parent participation: PT conferences, PTO/PTA, volunteers
• Suspension data• School Process Rubrics
(SPR 40 or SPR 90) or Interim SA/SA (NCA)
• Event occurred: Who, what, when, where, why, how
• What you did for whom: E.g. All 8th graders received violence prevention
• Survey data (student, parent, staff, community)
• Opinions (Clarify what others think. People act based on what they believe. How do they see you/us?)
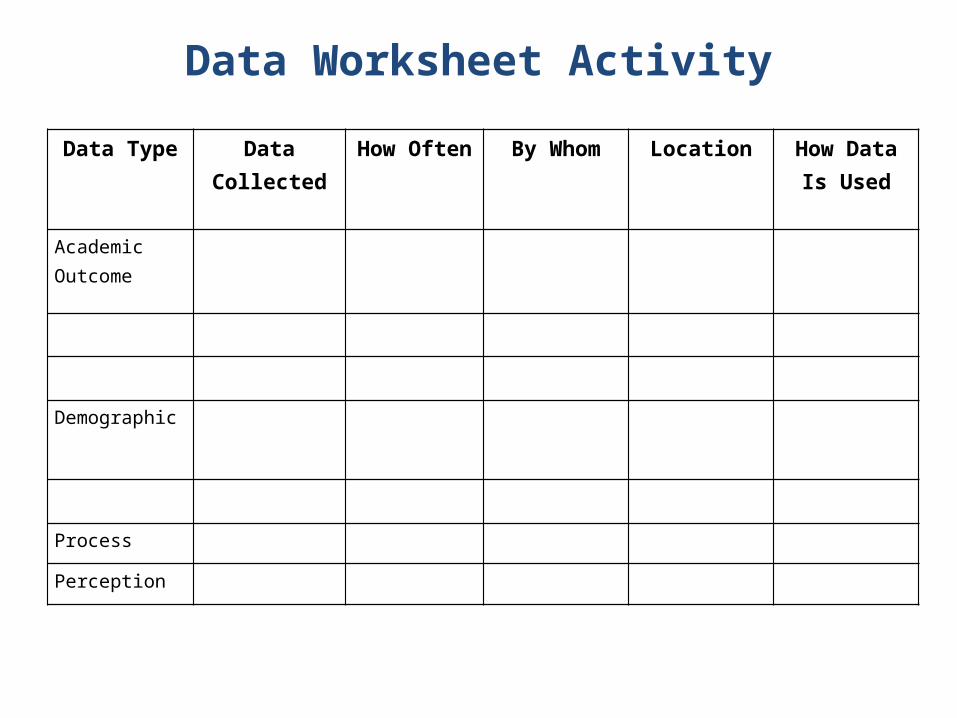
Data Type Data Collected
How Often
By Whom Location How Data Is Used
Academic Outcome
Demographic
Process
Perception
Data Worksheet Activity
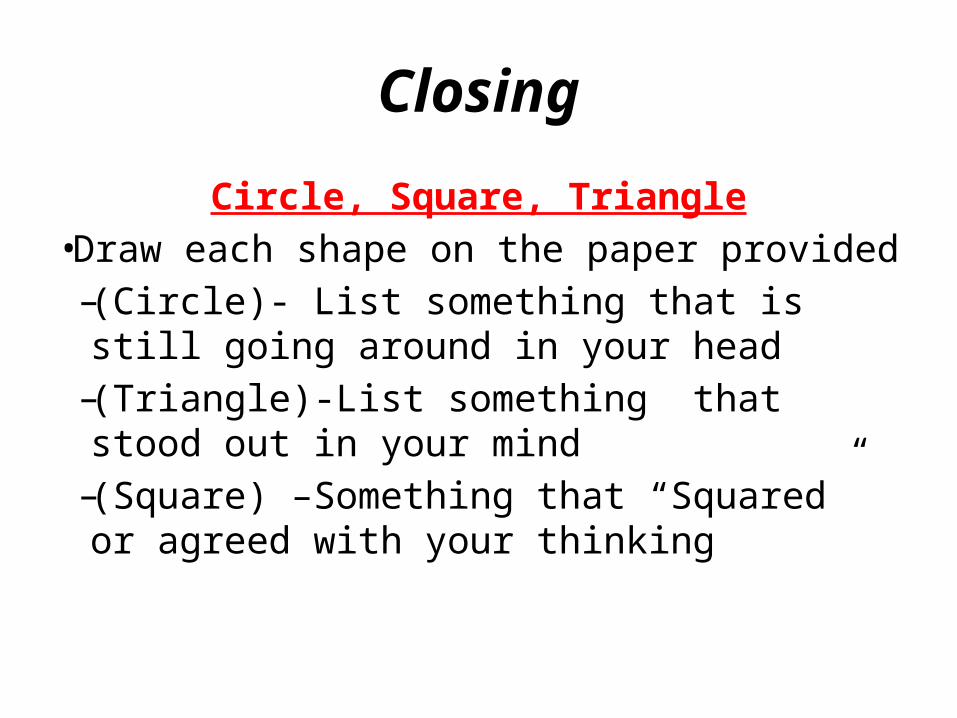
ClosingCircle, Square, Triangle
• Draw each shape on the paper provided–(Circle)- List something that is still going
around in your head–(Triangle)-List something that stood out
in your mind–(Square) –Something that “Squared” or
agreed with your thinking