Embed Size (px)
Citation preview

District Heatingthe
Grundfos Way
“We are providingpumps and solutions
which can moveenergy
in an efficient way”
District Heating the Grundfos Way
Energy Audit in
District Heating
Distribution
Distribution of energy in a efficient wayand thereby saving energy and cost

Focus on reduced pump operation costand improved system operation
Energy Audit in District Heating Distribution
Energy audit procedure:1. Evaluation of existing data2. On site registration of system and pumps3. Measuring to get exact figures at the present situation
• Flow/Dp/temperatures/kW (data locking)4. Evaluation of the measurements5. Selection of new pump systems6. Calculation of Life Cycle Cost and Pay-back time7. Proposals for new strategies/system upgrading8. Installation of new pump systems9. Commissioning of the system10. Instruction of the operation manager
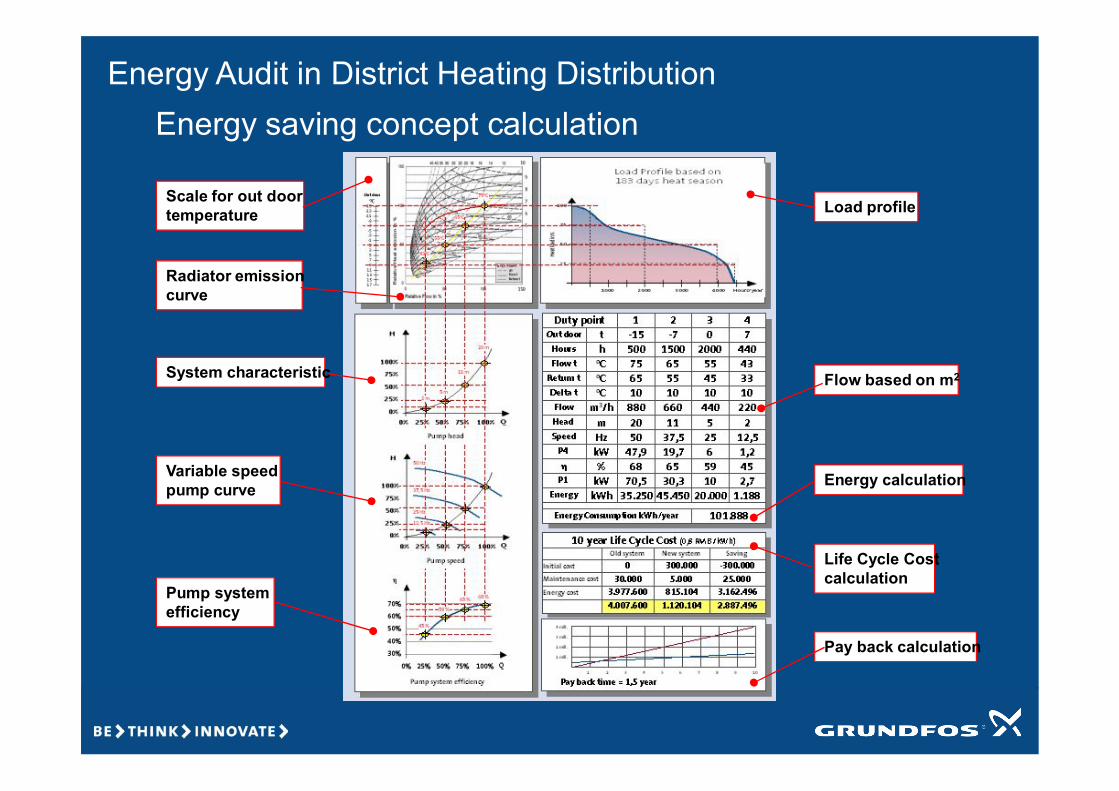
Scale for out doorScale for out doortemperature
Radiator emissionRadiator emissioncurve
System characteristicSystem characteristic
Variable speedpump curve
Pump systemefficiency
Load profile
Energy calculationEnergy calculation
Life Cycle CostLife Cycle Costcalculation
Pay back calculationPay back calculation
Energy saving concept calculation
2Flow based on m2
Energy Audit in District Heating Distribution
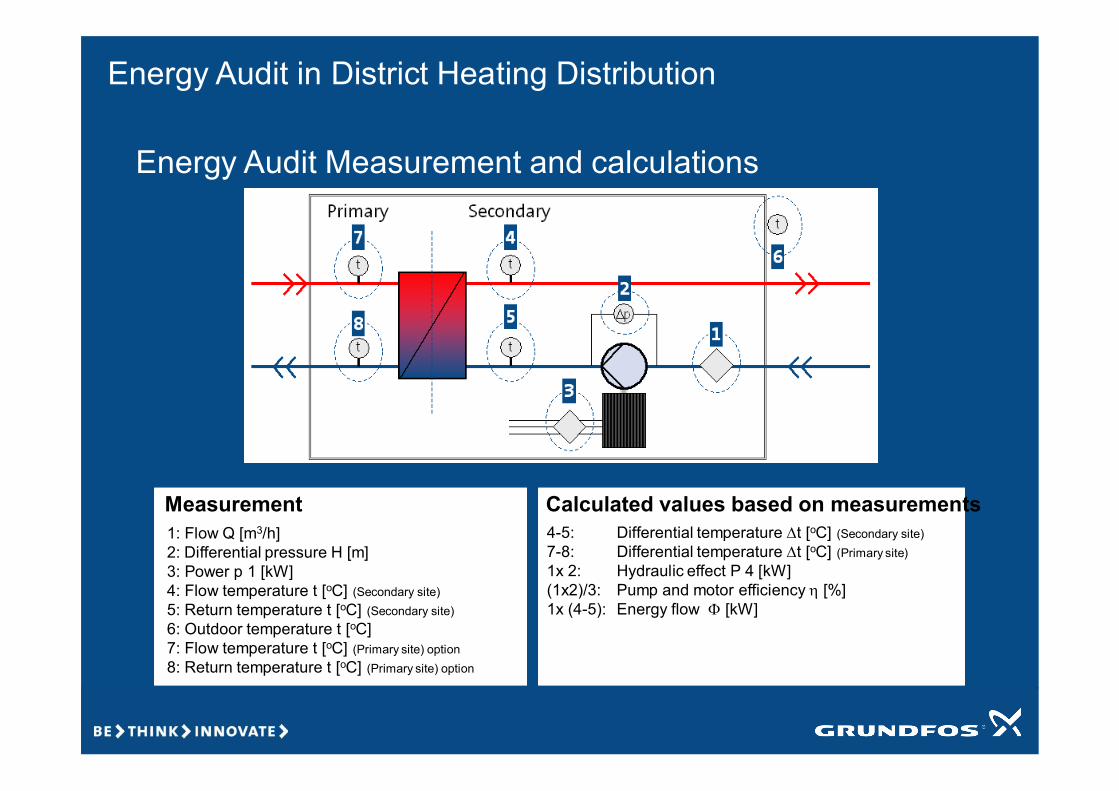
1: Flow Q [m3/h]2: Differential pressure H [m]3: Power p 1 [kW]4: Flow temperature t [oC] (Secondary site)5: Return temperature t [oC] (Secondary site)6: Outdoor temperature t [oC]7: Flow temperature t [oC] (Primary site) option8: Return temperature t [oC] (Primary site) option
Measurement Calculated values based on measurements4-5: Differential temperature Dt [oC] (Secondary site)7-8: Differential temperature Dt [oC] (Primary site)1x 2: Hydraulic effect P 4 [kW](1x2)/3: Pump and motor efficiency h [%]1x (4-5): Energy flow F [kW]
Energy Audit Measurement and calculations
Energy Audit in District Heating Distribution

0
10
20
30
40
50
60
70
80
90
100
Tem
pera
ture
[deg
C]
Flow Temperature Return Temperature DT Primary Flow Temperature
0
1000
2000
3000
4000
5000
6000
7000
8000
9000
10000
Hea
t Loa
d [k
W]
-12
-10
-8
-6
-4
-2
0
Tem
pera
ture
[deg
C]
Heat Output Outdoor Temperature
0
200
400
600
800
1000
1200
Flow
[m3/
h]
0
5
10
15
20
25
30
35
Hea
d [m
]
Flow Head
0
20
40
60
80
100
120
17:17 22:05 02:53 07:41 12:29 17:17 22:05 02:53 07:41Time
Pow
er C
onsu
mpt
ion
[kW
]
0
0,1
0,2
0,3
0,4
0,5
0,6
0,7
0,8
0,9
1
Effic
ienc
y
Power Consumption Efficiency
0
5
10
15
20
25
30
35
40
0 200 400 600 800 1000 1200
Flow [m3/h]
Hea
d [m
]
Medium temperature
Heat load andOut door temperature
The graphic view of the measurements which is used for the analyze of thesystem.
Heat emission curve
Flow and head
Power and efficiency
System characteristics
Data available from customer:Energy consumption per year 342.000 kWhCost of energy 0,7 RMB/kWhHeating season 183 days (3350 hours)3 pumps installed (incl. 1 standby)Data on nameplate is :800 m3/h x 20 m, motor size 55 kWCO2 emission 0,9 kg/kWh
Energy Audit in District Heating Distribution

An important equation in an Audit:F = Q x Dt or F/Dt = Q
And also the heat emission curve for a systemshowing the link between F Q Ft and Rt:
=Flow temperature (Ft)
=Return temperature (Rt)
Energy Audit in District Heating Distribution
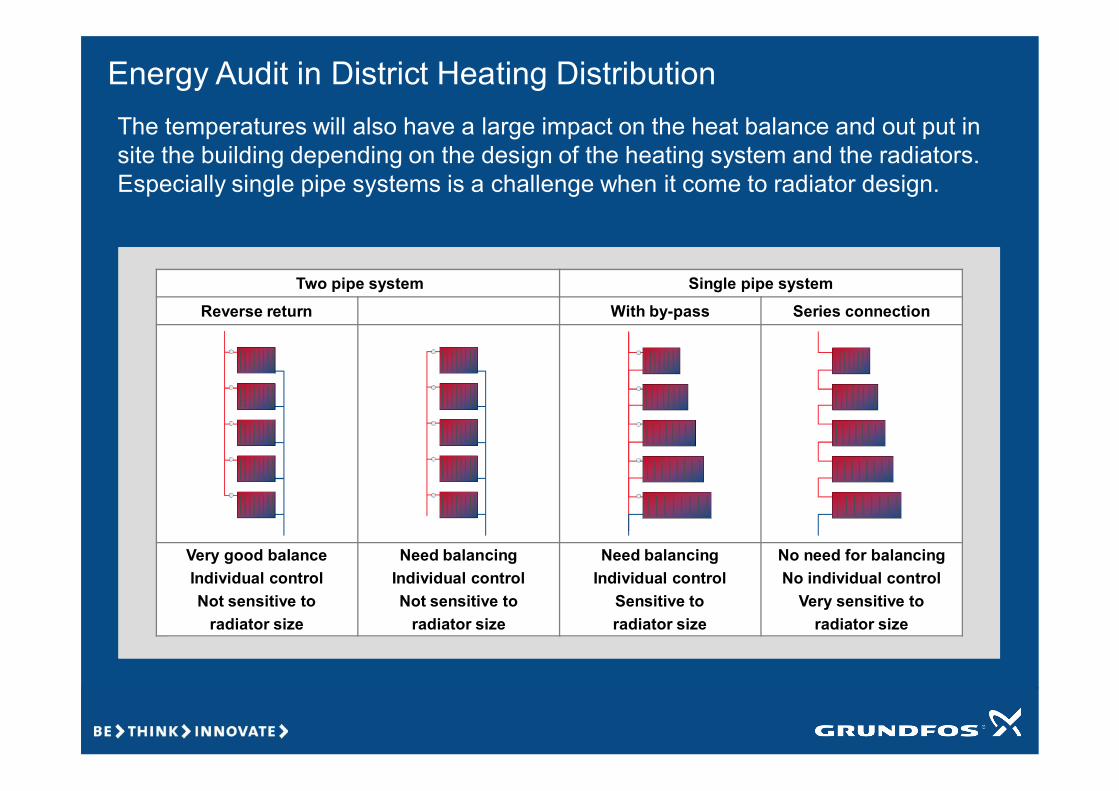
Two pipe system Single pipe system
Reverse return With by-pass Series connection
Very good balanceIndividual controlNot sensitive to
radiator size
Need balancingIndividual controlNot sensitive to
radiator size
Need balancingIndividual control
Sensitive toradiator size
No need for balancingNo individual control
Very sensitive toradiator size
The temperatures will also have a large impact on the heat balance and out put insite the building depending on the design of the heating system and the radiators.Especially single pipe systems is a challenge when it come to radiator design.
Energy Audit in District Heating Distribution

New lightconvectionradiators
Medium radiationfactor
Medium convectionfactor
Heat coils (AHU)(Fan coils)
Only convectionair driven
Under floor heatingOnly radiant
Large surface
Old heavy cast ironradiators
High radiation factorLow convection
factor
80-75oC
30-35oC
Demanded flow temperature
Radianteffect
Convectioneffect
The temperatures will also have a large impact on the heat balance and out put insite the building depending on the design of the heating system and the radiators.Especially single pipe systems is a challenge when it come to radiator design.
Energy Audit in District Heating Distribution

Energy Audit in District Heating Distribution
Correct sized pumphigh efficiency
Incorrect sized pumplow efficiency
The efficiency on the pump system is notlinked to pump quality, but very often it aquestion of the right design of the pumpsystem.

1.Energy consumption on existing pumps system.2.Select new pumps based on nameplate on the old pump (no measurements).3.Do a simple pump audit measuring Flow, Head and Power, and select pumps based on these data.4.Make Energy Audit measuring Flow, Head, Power and Temperatures including analyze of system,and select constant speed pumps based on how the system operates most efficient.5.Make Energy Audit measuring Flow, Head, Power and Temperatures, analyze of system, providinga load profile and operation strategy. Select variable speed pumps based on how the system operatesmost efficient.
Flow Head P4Total
h P1 Hours kWhEnergy
costEarly
energy Saving Inital cost Audit Total Pay-back
Design duty point m3/h m kW kWRMB /kWh RMB RMB RMB RMB RMB Years
1 1600 m3/h x 20 m 1000 25 68,0 0,63 107,9 3350 361587 0,7 253111 0 0 0 02 1600 m3/h x 20 m 1000 25 68,0 0,7 97,1 3350 325429 0,7 227800 25311 160000 0 160000 6,323 1000 m3/h x 25 m 1000 25 68,0 0,75 90,7 3350 303733 0,7 212613 40498 144000 20000 164000 4,054 880 m3/h x 20 m 880 20 47,9 0,74 64,7 3350 216718 0,7 151702 101409 130000 38000 168000 1,665 880 m3/h x 20 m 880 20 47,9 0,74 64,7 3350 75000 0,7 52500 200611 200000 38000 238000 1,19
Energy/cost calculation for 5 diff. situationsEvaluation of the analyze of the system.
Energy Audit in District Heating Distribution

0
50
100
150
200
250
Ton CO2
1 2 3 4 5 Case
Inviromental inpact
CO2 emission Reduction in CO2
100 % 96 % 89 % 30 %65 %
35 % 70 %11 %4 %
0
500.000
1.000.000
1.500.000
2.000.000
2.500.000
3.000.000
RMB
1 2 3 4 5 Case
10 Years LCC
Inital cost Service cost Energy cost
900.000 RMBSaving over10 years *
•A solution which only need implementation at the substation.
35 %CO2
reductionfrom year
One
Energy/cost calculation for 5 diff. situationsEvaluation of the analyze of the system.
Energy Audit in District Heating Distribution

Substation Hua Xin 56.000 m2
Flow Head Motor size Pumps inoperation
Year energyconsumption Saving year
m3/h m kW No. kWh/year kWh/yearBefore 320 32 45 2 158.580 94.620
(59%)After 91,2 28,8 11 2 63.96093 15,4 5,5 2
Substation Tian Xing 143.000 m2
Flow Head Motor size Pumps inoperation
Year energyconsumption Saving year
m3/h m kW No. kWh/year kWh/yearBefore 320 32 45 3 307.040 141.320
(46%)After 250 17 15 3 165.720
Substation Tian Xing Low 40.000 m2 High 22.000 m2
Flow Head Motor size Pumps inoperation
Year energyconsumption Saving year
m3/h m kW No. kWh/year kWh/year
BeforeLow 400 32 55 2 134.686 53.720
(39%)*High 46,7 44 11 2
After Low 125,4 10,6 5.5x2 1 80.960High 78,5 22,4 7.5 1
Results of the Energy Audit in Jinzhou
* The saving is based on 3 month operation with new pumps
Total 161.000 m2 gives a saving at 289.660 kWh/year =1,8 kWh/year/m2

Haapsalu District Heating Company EstoniaOperated by DalkiaOne test Energy Audit on Boiler house with 196building connected.The audit was made in cooperation with CEREG andthe Baltic Countries
Energy Audit in District Heating Distribution

Jaroslavl District Heating Company RussiaOne test Energy Audit on Domestic Hot Waterproduction and distribution.The audit was made in cooperation with CEREG andGMO
Energy Audit in District Heating Distribution

Jaroslavl District Heating Company RussiaOne test Energy Audit on heating distributionproduction and distribution.The audit was made in cooperation with CEREG andGMO
Chancingcontrol strategy
Potential saving :68% with new pump and new control strategy
Energy Audit in District Heating Distribution

District Heating the Grundfos Way
”For us, district heating means calculationstransformed into saving in energy!”

District Heating the Grundfos Way
The life cycle cost of any piece of equipment is the total ”lifetime” cost to purchase, install, operate,maintain and dispose of that equipment. Determining LCC involves following a methodology toidentify and quantify all of the components of the LCC equation.
A Guide to LCC Analysis for Pumping Systems is the result of a collaboration between:q Hydraulic Instituteq Europumpq US Department of Energy’s Office of industrial Technologies
LCC = life cycle costCic = inital costs, purchase priceCin = installation and commissioning costCe = energy costsCo = operation cost (labour cost)Cm = maintenance and repair costsCs = down time costs (loss of production)Cenv = environmental costsCd = decommissioning/disposal costs
LCC = C ic + Cin + Ce + Co + Cm + Cs + Cenv+ Cd
Life Cycle Cost

District Heating the Grundfos Way
Life Cycle Cost– 20 years operation
Initialcost
Energycost
Maintenancecost
Installationcost
OldSystem
NewSystem
5.000
4.000
3.000
2.000
1.000
0
Euro x 1000
6.000
7.000
8.000
Energy price 0,1 Euro/kWh
Calculations transformed into saving in energy!Ulaanbaatar Heat Efficiency ProjectBooster pump station 3Maximum capacityFlow: 2500 m3/hHead: 60 m
By replacing 3 circulator pump in a booster station ,with new speed controlled pumps, a yearly energysaving at 65% can be obtained.The pay-back of the new system is less than 2 years

District Heating the Grundfos Way
A housing society with 20 apartment blocks consider to replace allradiator val-ves to thermostatic valves, and at the same time they willreplace the 9 years old pumps.What is energy saving and life cycle cost?
Existing pump installation:> 20 Grundfos UPC 40-120> Flow: 12.7 m3/h> Head: 5.0 m> Operation days/year: 365 days> Energy consumption: 4,554 kWh/year/pump
Life Cycle Cost will be based on 2 new alternatives.> System 1: Constant speed pump UPS 40-120> System 2: Speed controlled pump MAGNA 40-120
Calculations transformed into saving in energy!

District Heating the Grundfos Way
Calculations transformed into saving in energy!Transforming life cycle cost into saving in energy and cost saving
Saving for compared to existing system : 49.440 EURO
10 years operation timeSystem
1Euro
%LCC
System2
Euro
%LCC
SavingsEuro
Saving%
Remarks
Cic 6.400 9,1% 12.000 28,5% -5.600 -88% End user price
Cin 1.000 1,4% 1.000 2,4% 0 0% Commissioning
Ce 62.100 88,7% 28.640 68% 33.460 54% Energy price 0,1 Euro/kWh
Cm 0 0% 0 0% 0 0%
Cd 500 0,1% 500 0,1% 0 0%
LCC 70.001 100% 42.141 100% 27.860 40%

District Heating the Grundfos Way
Calculations transformed into saving in energy!
10 years Life Cycle Cost for 20 Circulator pumps
Exsistingpumps
NewUPS pumps
Energy price 0,1 Euro/kWh
50.000
40.000
30.000
20.000
10.000
0
Euro
60.000
70.000
80.000
90.000
NewMAGNApumps
0 1 2 3 4 5 6 7 8 9 10Years of operation
Energy costInitial costPay back time
50.000
40.000
30.000
20.000
10.000
0
Euro
60.000
70.000
80.000
90.000
District Heating the Grundfos Way
Calculations transformed into saving in energy!
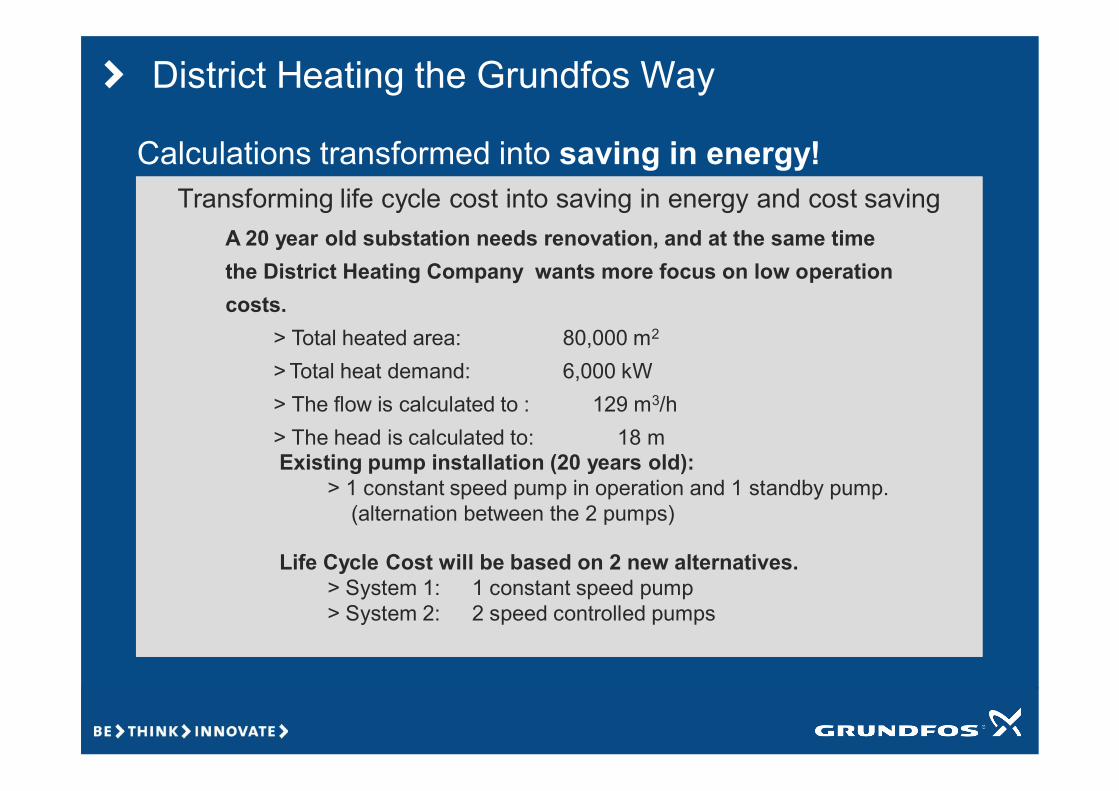
A 20 year old substation needs renovation, and at the same timethe District Heating Company wants more focus on low operationcosts.
> Total heated area: 80,000 m2
> Total heat demand: 6,000 kW> The flow is calculated to : 129 m3/h> The head is calculated to: 18 mExisting pump installation (20 years old):
> 1 constant speed pump in operation and 1 standby pump.(alternation between the 2 pumps)
Life Cycle Cost will be based on 2 new alternatives.> System 1: 1 constant speed pump> System 2: 2 speed controlled pumps
Transforming life cycle cost into saving in energy and cost saving

District Heating the Grundfos Way
Calculations transformed into saving in energy!
Total saving : 50.410 EURO
Transforming life cycle cost into saving in energy and cost saving
20 years operation timeSystem
1Euro
%LCC
System2
Euro
%LCC
SavingsEuro
Saving%
Remarks
Cic 5.200 4,6% 7,300 11,7% -2.100 -88% End user price
Cin 500 0,4% 600 1% -100 -20% Commissioning
Ce 105.642 93,6% 53.032 84,9% 33.460 50% Energy price 0,1 Euro/kWh
Cm 1.500 1,3% 1.500 2,4% 0 0%
LCC 112.842 100% 62.432 100% 27.860 45%

District Heating the Grundfos Way
Calculations transformed into saving in energy!20 years Life Cycle Cost for pump systems
System 1
Energy price 0,1 Euro/kWh
75.000
60.000
45.000
30.000
15.000
0
Euro
90.000
105.000
120.000
135.000
System 20 2 4 6 8 10 12 14 16 18 20
Years of operation
Pay back time Maintenancecost
Initalcost
Energycost
75.000
60.000
45.000
30.000
15.000
0
Euro
90.000
105.000
120.000
135.000