Embed Size (px)
Citation preview

THE REPUBLIC OF RWANDA
Fo
urt
h P
op
ula
tion
an
d H
ou
sin
g C
en
sus,
Rw
an
da
, 2
012
District Profile
Rutsiro
NATIONAL INSTITUTE OF STATISTICS OF RWANDA

Ministry of Finance and Economic Planning
National Institute of Statistics of Rwanda
Fourth Population and Housing Census, Rwanda, 2012
District Profile
Rutsiro
January 2015
THE REPUBLIC OF RWANDA

The Fourth Rwanda Population and Housing Census (2012 RPHC) was implemented by the National
Institute of Statistics of Rwanda (NISR). Field work was conducted from August 16th to 30
th, 2012. The
funding for the RPHC was provided by the Government of Rwanda, World Bank (WB), the UKAID (Former
DFID), European Union (EU), One UN, United Nations Population Fund (UNFPA), United Nations
Development Programme (UNDP), United Nations Children's Fund (UNICEF) and UN Women.
Additional information about the 2012 RPHC may be obtained from the NISR:
P.O. Box 6139, Kigali, Rwanda; Telephone: (250) 252 571 035
E-mail: [email protected]; Website: http://www.statistics.gov.rw.
Recommended citation:
National Institute of Statistics of Rwanda (NISR), Ministry of Finance and Economic Planning
(MINECOFIN) [Rwanda]; 2012. Rwanda Fourth Population and Housing Census.
District Profile: Rutsiro

xiii


xv

Fourth Population and Housing Census, Rwanda, 2012 District Profile:Rutsiro
iv

Fourth Population and Housing Census, Rwanda, 2012 District Profile:Rutsiro
v
Table of Content
Foreword ................................................................................................................................................ i
Acknowledgement ............................................................................................................................. iii
LIST OF TABLES .................................................................................................................................... vi
LIST OF FIGURES .................................................................................................................................. ix
Chapter 1: Population Size, Spatial Distribution, and Structure........................................... 1
1.1. Size and Spatial Distribution of the Population ......................................................... 1
1.1.1 Size and Spatial Distribution of the Population of the Western Province .......... 1
1.1.2 Size and spatial distribution of the population of the Rutsiro district .................. 3
1.1.3 Size and Spatial Distribution of the Population of t Rutsiro district by
residence area .................................................................................................................... 5
1.1.4 Size and spatial distribution of the resident population of Rutsiro ....................... 6
Chapter 2: Characteristics of the population .............................................................................. 9
2.1. Socio-cultural characteristics of the population ......................................................... 9
2.2. Marital Status ..................................................................................................................... 11
Chapter 3: Sub-Population ............................................................................................................ 21
3.1. Children (0-17 years) ................................................................................... 21
3.2. Youth (14-35 years) ..................................................................................... 27
3.3. Persons with Disabilities .............................................................................. 32
3.4. Elderly Population ........................................................................................ 33
Chapter 4: Households and Housing Characteristics ........................................................... 36
4.1. Households Characteristics.......................................................................... 36
4.2. Housing Characteristics ............................................................................... 38
ANNEXES ........................................................................................................................................... 61

Fourth Population and Housing Census, Rwanda, 2012 District Profile:Rutsiro
vi
LIST OF TABLES
Table 1: Distribution (count) of the resident population of Western Province in 2012 by
district, sex and density ........................................................................................ 1
Table 2: Distribution (count and %) of the resident population of Rutsiro district in 2012
bysector, sexand density ...................................................................................... 3
Table 3: Distribution (count and %) of the resident population of Rutsiro district by sector and
area of residence. ................................................................................................. 5
Table 4::Distribution (count and %) of the resident population of Rutsiro District by 5-year age
group and sex ....................................................................................................... 6
Table 5:Number and population share (%) of some specific interventions targeted groups in
Rutsiro district by sex ............................................................................................ 8
Table 6: Distribution (count and %) of the resident population of Rutsiro district by nationality
and sector ............................................................................................................. 9
Rutsiro District hosts very few foreigners; only one hundred out of 324.6 thousands residents
are foreignersTable 7: Distribution (count and %) of the resident population of
Rutsiro District by Religious Affiliation and residence areas .................................. 9
Table 8: Distribution (%) of the resident population of Rutsiro District aged 12 years and
above by Marital status and Sector ..................................................................... 11
Table 9: Distribution (%) of the resident population of Rutsiro district aged 12 years and
above by marital status, age groups and sex [Both sexes] .................................. 12
Table 10: Distribution (count and %) of the school-age population of Rutsiro district by sector
and by school attendance status and sex (Both sexes) ...................................... 13
Table 11: Gross and Net Attendance Rate (%) in primary school of Rutsiro district by sex and
sector.................................................................................................................. 15
Table 12: Gross and Net Attendance Rate (%) in Secondary School of Rutsiro district by sex
and sector ........................................................................................................... 16
Table 13: Distribution (count and %) of the resident population of Rutsiro district aged 3 years
and above by highest level of educational attainment and sector (Both sexes) ... 17
Table 14: Labour-force participation rate (%) among the resident population aged 16 years
and above by sex, Western Province, district and area of residence .................. 18
Table 15: Unemployment rate (%) among the active population aged 16 years and above in
Western Province by sex, District and area of residence .................................... 20
Table 16: Number and share (%) of children aged 0-17 years among the total resident
population of Rutsiro district by sex and sector of residence ............................... 21
Table 17: Percentage of the children aged 0-17 in western Province whose birth was
registered by sex, District and area of residence ................................................ 22
Table 18: Percentage of the children aged 0-17 in Rutsiro district whose birth was registered
by sex, Sector and area of residence .................................................................. 23
Table 19: Percentage of children aged 5-17 years currently employed by age group and sex
and by district ..................................................................................................... 24
Table 20: Percentage of children aged 5-17 years currently employed by age group and sex
and by sector in Rutsiro district ........................................................................... 26
Table 21: Number and share (%) of the resident youth aged 14-35 years among the total
resident population of Rutsiro district by Sector of residence and sex (Both sexes)
…………………………………………………………………………………………..27

Fourth Population and Housing Census, Rwanda, 2012 District Profile:Rutsiro
vii
Table 22: Distribution (count and %) of the resident youth of Rutsiro district aged 14-35 years
by Sector of residence and school attendance status (Both sexes) .................... 28
Table 23: Distribution (count and %) of the youth population of Rutsiro District aged 14-35
years by Sector of residence and highest level of education attained (Both
sexes)………………. ........................................................................................... 29
Table 24: Distribution (count and %) of the resident youth of Rutsiro district aged 14-35 years
by economic activity status and sex, and by sector residence ............................ 30
Table 25: Distribution (%) of the currently employed youth of Rutsiro district aged 14-35 years
by employment status and sex............................................................................ 31
Table 26: Number and share (%) of persons with disabilities of Rutsiro District aged 5 years
and above (Prevalence of disabilities) by Sector of residence and sex ............... 32
Table 27:: Number and share (%) of the resident elderly (aged 60 years and above) among
the total resident population of Rutsiro district by Sector of residence and sex ... 33
Table 28: Distribution (count) of the elderly resident (aged 60 years and above) by economic
activity status and sex, and by sector of residence ............................................. 34
Table 29: Distribution (%) of the elderly resident (aged 60 years and above) of Rutsiro District
by sector of residence and marital status (Both sexes) ....................................... 35
Table 30: Number of private households of Rutsiro District and their corresponding
population by Sector and mean size of private households ................................. 36
Table 31: Distribution (count and %) of private households’ heads of Rutsiro District by
Sector and sex .................................................................................................... 37
Table 32: Distribution (count and %) of the private households of Rutsiro District by type of
habitat and Sector............................................................................................... 38
Table 33: Distribution (%) of the private households of Rutsiro District by tenure of the
housing units and by Sector ................................................................................ 41
Table 34: Distribution (count and %) of the private households of Rutsiro District by main
material of the roof of the housing units and by Sector ....................................... 43
Table 35: Distribution (count and %) of the private households of Rutsiro District by main
material of the walls of the housing unit and by Sector ....................................... 45
Table 36: Distribution (count and %) of the private households of Rutsiro District by main
source of energy for lighting and by Sector ......................................................... 47
Table 37: Distribution (count and %) of the private households of Rutsiro District by main
source of energy for cooking and by Sector ........................................................ 49
Table 38: Distribution (count and %) of the private households of Rutsiro District by main
source of water and by Sector ............................................................................ 51
Table 39: Distribution (count and %) of the private households of Rutsiro District by main type
of toilet facility and by Sector .............................................................................. 54
Table 40: Distribution (count and %) of the private households of Rutsiro District by mode of
waste disposal and by Sector ............................................................................. 56
Table 41: Percentage of the private households of Rutsiro District possessing communication
assets by Sector ................................................................................................. 58
Table 42: Percentages of the private households of Rutsiro district that have access to the
Internet by place of access ................................................................................. 59
Table 43: Distribution (count and %) of the resident population of Rutsiro District by Single
age and Sex ....................................................................................................... 61
Table 44: Distribution (count and %) of the resident population of Rutsiro District by 5-year
age group and sex .............................................................................................. 64

Fourth Population and Housing Census, Rwanda, 2012 District Profile:Rutsiro
viii
Table 45: Distribution (%) of the resident population of Rutsiro District aged 12 years and
above by Marital status, Sector and Sex [Male,] ................................................. 77
Table 46: Distribution (%) of the resident population of Rutsiro District aged 12 years and
above by Marital status, Sector and Sex [Female,] ............................................. 77
Table 47: Distribution (%) of the resident population of Rutsiro District aged 12 years and
above by Marital status, Age groups and Sex [Male, Female] ............................. 79
Table 48: Distribution (count and %) of the school-age population of Rutsiro District by Sector
and by School attendance status and Sex (Male) ............................................... 80
Table 49: Distribution (count and %) of the school-age population of Rutsiro District by Sector
and by School attendance status and Sex (Female) ........................................... 81
Table 50: Distribution (%) of the resident population of Rutsiro District aged 3 years and
above by Highest level of educational attainment and Sector (Male) .................. 83
Table 51: Distribution (%) of the resident population of Rutsiro District aged 3 years and
above by Highest level of educational attainment and Sector (Female) .............. 84
Table 52: Distribution (%) of the resident population of Rutsiro District aged 16 years and
above residing in private households by Economic activity status and Sector
(Both sexes ) ...................................................................................................... 85
Table 53: Distribution (%) of the resident population of Rutsiro District aged 16 years and
above residing in private households by Economic activity status and Sector
(Male ) ................................................................................................................ 86
Table 54: Distribution (%) of the resident population of Rutsiro District aged 16 years and
above residing in private households by Economic activity status and Sector
(Femqle ) ............................................................................................................ 87
Table 55: Distribution (count and %) of the private households of Rutsiro District by main
source of water and by Sector ............................................................................ 88
Table 56: Distribution (count and %) of the private households of Rutsiro District by main type
of toilet facility and by Sector .............................................................................. 89

Fourth Population and Housing Census, Rwanda, 2012 District Profile:Rutsiro
ix
LIST OF FIGURES
Figure 1: Administrative map of Rutsiro district ................................................................................ x
Figure 2: Population Density (Inhabitants per square km) by district in Western Province ....... 2
Figure 3: Population Density of Rutsiro by Sector in 2012 ............................................................. 4
Figure 4: Age pyramid of the resident population of Rutsiro District in 2012 ............................... 7
Figure 5: Labour-force participation rate (LFPR) among the resident population in the private
households aged 5 years and above by age and by sex in Rutsiro district ............. 19
Figure 6: Employement among children aged 5-9, 10-14 and 15-17 years by district in
Rutsiro District .................................................................................................................... 25
Figure 7: Distribution (%) of the private households of Rutsiro District by type of habitat and
by Area of residence ......................................................................................................... 39
Figure 8: Distribution (%) of the private households of Rutsiro District by tenure of the
housing and area of residence ........................................................................................ 42
Figure 9: Distribution (%) of the private households of Rutsiro District by main material of the
roof and of the housing unit and by area of residence ................................................ 44
Figure 10: Distribution (%) of the private households of Rutsiro District by main material of
the walls of the housing unit and by area of residence ............................................... 46
Figure 11: Distribution (%) of the private households of Rutsiro District by main source of
energy for lighting and by area of residence ................................................................. 48
Figure 12: Distribution (%) of the private households of Rutsiro District by main source of
energy for cooking and by area of residence ................................................................ 50
Figure 13: Distribution (%) of the private households of Rutsiro District main source of water
and by Sector ..................................................................................................................... 52
Figure 14: Distribution (%) of the private households of Rutsiro District by main source of
water and by area of residence ....................................................................................... 53
Figure 15: Distribution (%) of the private households of Rutsiro District by main type of toilet
facility and by area of residence ..................................................................................... 55
Figure 16: Distribution (%) of the private households of Rutsiro District by mode of waste
disposal and by area of residence .................................................................................. 57
Figure 17: Percentage of private households whose at least one member have access to the
Internet by place of access and by area of residence ................................................. 60

Fourth Population and Housing Census, Rwanda, 2012 District Profile:Rutsiro
x
Figure 1: Administrative map of Rutsiro district

Fourth Population and Housing Census, Rwanda, 2012 District Profile:Rutsiro
1
Chapter 1: Population Size, Spatial Distribution, and Structure
1.1. Size and Spatial Distribution of the Population
1.1.1 Size and Spatial Distribution of the Population of the Western Province
Table 1: Distribution (count) of the resident population of Western Province in 2012 by district, sex
and density
Districts Both sexes Male Female % of
female
Population share (% of
the total population)
Density (Inhabitants per square
km)
Rwanda 10,515,973 5,064,868 5,451,105 51.8 415
Western Province
2,471,239 1,168,445 1,302,794 52.7 100 420
Karongi 331,808 156,073 175,735 53.0 13.4 334
Rutsiro 324,654 154,044 170,610 52.6 13.1 281
Rubavu 403,662 194,989 208,673 51.7 16.3 1,039
Nyabihu 294,740 137,799 156,941 53.2 11.9 555
Ngororero 333,713 154,591 179,122 53.7 13.5 491
Rusizi 400,858 192,528 208,330 52.0 16.2 418
Nyamasheke 381,804 178,421 203,383 53.3 15.4 325
Source: Rwanda 4th Population and Housing Census, 2012 (NISR)
The 4th Rwanda Population and Housing Census (PHC) has enumerated 2,471,239
residents in the Western Province, which represent 23.5% of the total population of
Rwanda (10,515,973 residents).
The population of the Western Province is predominantly female; 1,302,794 are women
corresponding to 52.7% of the total population of the province.
Rubavu, Rusizi and Nyamasheke are the mostly populated Districts with more than 380
thousands residents for each. Their populations represent, respectively, 16.3%, 16.2%
and 15.4% of the total resident population of the Western Province.
The least populated district in Western Province is Nyabihu with 297,740 inhabitants,
corresponding to 11.9% of the total resident population of the Western Province.
Three districts with a high population density (Inhabitants per Sq.km) are Rubavu (1,039
inhabitants / km2), Nyabihu (555 inhabitants/ km2) and Ngororero (491 inhabitants/ km2).
Three districts with a low population density (Inhabitants per Sq.km) are Rutsiro
(281inhabitants/ km2), Nyamasheke (325 inhabitants/km2) and Karongi (334 inhabitants/
km2)

Fourth Population and Housing Census, Rwanda, 2012 District Profile:Rutsiro
2
Figure 2: Population Density (Inhabitants per square km) by district in Western Province

Fourth Population and Housing Census, Rwanda, 2012 District Profile:Rutsiro
3
1.1.2 Size and spatial distribution of the population of the Rutsiro district
Table 2: Distribution (count and %) of the resident population of Rutsiro district in 2012 by sector, sex
and density
Sectors Both sexes Male Female % of female
Population share (% of
the total population)
Density (Inhabitants/
km2)
Rwanda 10,515,973 5,064,868 5,451,105 51.8
415
Western Province
2,471,239 1,168,445 1,302,794 52.7
420
Rutsiro District
324,654 154,044 170,610 52.6 100 281
Boneza 24,166 12,802 11,364 47.0 7.4
735
Gihango 23,166 11,004 12,162 52.5 7.1
501
Kigeyo 24,486 11,630 12,856 52.5 7.5
599
Kivumu 32,961 15,583 17,378 52.7 10.2
1138
Manihira 16,098 7,534 8,564 53.2 5.0
436
Mukura 33,440 15,510 17,930 53.6 10.3
324
Murunda 18,478 8,738 9,740 52.7 5.7
408
Musasa 22,805 10,873 11,932 52.3 7.0
525
Mushonyi 24,038 11,384 12,654 52.6 7.4
748
Mushubati 25,822 12,132 13,690 53.0 8.0
495
Nyabirasi 28,971 13,510 15,461 53.4 8.9
319
Ruhango 28,589 13,322 15,267 53.4 8.8
507
Rusebeya 21,634 10,022 11,612 53.7 6.7 412
Source: Rwanda 4th Population and Housing Census, 2012 (NISR)
The 4th Rwanda Population and Housing Census (PHC4) has enumerated 403,662
residents in Rutsiro district, which represent 13.1% of the total population of the Western
Province (2,471,239 residents).
The population of Rutsiro district is predominantly female; 170,610 are women
corresponding to 52.6% of the total resident population.
In each sector of Rutsiro district, the percentage of females is more than 50% except in
Boneza (47%).
Mukura and Kivumu are the mostly populated sectors with over 30 thousands residents
each. They represent 10.3% and 10.2% of the total population of district, respectively.
Manihira and Murunda are the less populated sectors in Rutsiro district with 16,098 and
18,478 residents respectively.

Fourth Population and Housing Census, Rwanda, 2012 District Profile:Rutsiro
4
Figure 3: Population Density of Rutsiro by Sector in 2012
Source: Rwanda 4
th Population and Housing Census, 2012 (NISR)

Fourth Population and Housing Census, Rwanda, 2012 District Profile:Rutsiro
5
1.1.3 Size and Spatial Distribution of the Population of t Rutsiro district by residence
area
Table 3: Distribution (count and %) of the resident population of Rutsiro district by sector and area of
residence.
District / Sectors
Count %
Total Urban Rural Total Urban Rural
Rwanda 10,515,973 1,737,684 8,778,289 100.0 16.5 83.5
Western Province
2,471,239
301,312 2,169,927 100,0 12.2 87.8
Rutsiro District
324,654 7,034 317,620 100.0 2.2 97.8
Boneza 24,166 0 24,166 100.0 0.0 100.0
Gihango 23,166 2,818 20,348 100.0 12.2 87.8
Kigeyo 24,486 0 24,486 100.0 0.0 100.0
Kivumu 32,961 4,216 28,745 100.0 12.8 87.2
Manihira 16,098 0 16,098 100.0 0.0 100.0
Mukura 33,440 0 33,440 100.0 0.0 100.0
Murunda 18,478 0 18,478 100.0 0.0 100.0
Musasa 22,805 0 22,805 100.0 0.0 100.0
Mushonyi 24,038 0 24,038 100.0 0.0 100.0
Mushubati 25,822 0 25,822 100.0 0.0 100.0
Nyabirasi 28,971 0 28,971 100.0 0.0 100.0
Ruhango 28,589 0 28,589 100.0 0.0 100.0
Rusebeya 21,634 0 21,634 100.0 0.0 100.0
Source: Rwanda 4th Population and Housing Census, 2012 (NISR)
Rutsiro district is almost rural: 97.8% of the resident population (317,620 inhabitants) lives
in rural areas.
Only 2.2 % of the population district of Rutsiro district resides in urban areas. Eleven of
thirteen sectors in Rutsiro district are entirely rural.
.

Fourth Population and Housing Census, Rwanda, 2012 District Profile:Rutsiro
6
1.1.4 Size and spatial distribution of the resident population of Rutsiro
Table 4: Distribution (count and %) of the resident population of Rutsiro District by 5-year age group
and sex
5-year age group
Count %
Both sexes Male Female Both
sexes Male Female
Total 324,654
154,044 170,610
100.0 100.0 100.0
0-4 47,898
23,965 23,933
14.8 15.6 14.0
5-9 51,032
25,234 25,798
15.7 16.4 15.1
10-14 42,863
21,109 21,754
13.2 13.7 12.8
15-19 35,605
17,660 17,945
11.0 11.5 10.5
20-24 30,096
14,565 15,531
9.3 9.5 9.1
25-29 27,119
12,639 14,480
8.4 8.2 8.5
30-34 22,111
10,316 11,795
6.8 6.7 6.9
35-39 14,462
6,212 8,250
4.5 4.0 4.8
40-44 11,346
4,932 6,414
3.5 3.2 3.8
45-49 9,291
3,984 5,307
2.9 2.6 3.1
50-54 10,216
4,256 5,960
3.1 2.8 3.5
55-59 7,311
3,081 4,230
2.3 2.0 2.5
60-64 5,268
2,217 3,051
1.6 1.4 1.8
65-69 3,108
1,213 1,895
1.0 0.8 1.1
70-74 2,875
1,054 1,821
0.9 0.7 1.1
75-79 1,679
657 1,022
0.5 0.4 0.6
80-84 1,322
517 805
0.4 0.3 0.5
85+ 1,052
433 619
0.3 0.3 0.4
Source: Rwanda 4th Population and Housing Census, 2012, ( NISR)
The population of Rutsiro district is mostly young. 64% of the resident population of
Rutsiro is under 25 years old, as shown by the age pyramid (Figure 4), reflecting the
high level of fertility in the recent past.

Fourth Population and Housing Census, Rwanda, 2012 District Profile:Rutsiro
7
The elderly (60 years and above) represent 4.7% of the total population of the
District. The distribution of the resident population by age and by sector is in the
annex
Figure 4: Age pyramid of the resident population of Rutsiro District in 2012

Fourth Population and Housing Census, Rwanda, 2012 District Profile:Rutsiro
8
Table 5: Number and population share (%) of some specific interventions targeted groups in
Rutsiro district by sex
Age group ( years)
Population Population share (%)
Both Sexes Male Female Both Sexes Male Female
<1 10,340 5,231 5,109 3.2 1.6 1.6
<5 47,898 23,965 23,933
14.8 7.4 7.4
1-4 37,558 18,734 18,824
11.6 5.8 5.8
3-6 40,131 19,847 20,284
12.4 6.1 6.2
0-15 149,146 73,927 75,219
45.9 22.8 23.2
0-17 164,313 81,464 82,849
50.6 25.1 25.5
7-12 58,880 29,048 29,832
18.1 8.9 9.2
13-18 43,903 21,768 22,135
13.5 6.7 6.8
14+ 190,160 87,317 102,843
58.6 26.9 31.7
14-35 125,499 60,232 65,267
38.7 18.6 20.1
15-24 65,701 32,225 33,476
20.2 9.9 10.3
15-49 ( female)
79,722
24.6
16-64 165,472 76,243 89,229
51.0 23.5 27.5
16+ 175,508 80,117 95,391
54.1 24.7 29.4
18+ 160,341 72,580 87,761
49.4 22.4 27.0
21+ 140,314 62,676 77,638
43.2 19.3 23.9
60+ 15,304 6,091 9,213
4.7 1.9 2.8
65+ 10,036 3,874 6,162
3.1 1.2 1.9
Total resident population
324,654 154,044 170,610 100.0 47.4 52.6
Some age groups are targets of specific interventions. For instance children under five
year for immunization programs, children in primary school age ( 7-12 years), people in
the official working age group (16-64 years), etc.
Knowing the size of such groups is of great importance for the design, implementation,
monitoring and evaluation of programs targeting such groups. The above table gives the
size of the main interventions target groups by sex, and their share in the entire
population of Rutsiro district.
The population aged 0-17 years represents 50.6 % of the total population of the district.
The economically active population aged 16 and 64 years represents 51%.

Fourth Population and Housing Census, Rwanda, 2012 District Profile:Rutsiro
9
Chapter 2: Characteristics of the population
2.1. Socio-cultural characteristics of the population
Table 6: Distribution (count and %) of the resident population of Rutsiro district by nationality and
sector
Sectors
Count %
Total Rwanda Foreigners N.S. Total Rwanda Foreigners N.S.
Rwanda 10,515,973 10,416,164 87,346 12,463 100 99.1 0.8 0.1
Western Province 2,741,239 2,446,191 20,734 4,314 100 99.0 0.8 0.2
Rutsiro 324654 324299 103 252 100 99.9 0.0 0.1
Boneza 24166 24128 16 22 100 99.8 0.1 0.1
Gihango 23166 23138 7 21 100 99.9 0.0 0.1
Kigeyo 24486 24467 12 7 100 99.9 0.0 0.0
Kivumu 32961 32873 14 74 100 99.7 0.0 0.2
Manihira 16098 16092 0 6 100 100.0 0.0 0.0
Mukura 33440 33420 5 15 100 99.9 0.0 0.0
Murunda 18478 18457 7 14 100 99.9 0.0 0.1
Musasa 22805 22788 7 10 100 99.9 0.0 0.0
Mushonyi 24038 24024 8 6 100 99.9 0.0 0.0
Mushubati 25822 25801 9 12 100 99.9 0.0 0.0
Nyabirasi 28971 28949 6 16 100 99.9 0.0 0.1
Ruhango 28589 28546 10 33 100 99.8 0.0 0.1
Rusebeya 21634 21616 2 16 100 99.9 0.0 0.1
Source: Rwandan 4th Population and Housing Census, 2012 (NISR)
Rutsiro District hosts very few foreigners; only one hundred out of 324.6 thousands residents
are foreigners

Fourth Population and Housing Census, Rwanda, 2012 District Profile:Rutsiro
10
Table 7: Distribution (count and %) of the resident population of Rutsiro District by Religious Affiliation
and residence areas
District / Sectors Count %
Total Urban Rural Total Urban Rural
Rwanda 1,515,973 1,737,687 8,778,289
Western Province 2,471,239 301,312 2,169,927
Rutsiro District 324,654 7,034 317,620 100 100 100
Catholic 122,362 4,295 118,067 37.7 61.1 37.2
Protestant 139,082 1,809 137,273 42.8 25.7 43.2
Adventist 43,691 260 43,431 13.5 3.7 13.7
Muslim 4,497 42 4,455 1.4 0.6 1.4
Jehovah Witness 2,836 80 2,756 0.9 1.1 0.9
Tradit/Animist 37 0 37 0.0 0.0 0.0
Non Religion 8,466 86 8,380 2.6 1.2 2.6
Other 721 21 700 0.2 0.3 0.2
Not stated 2,962 441 2,521 0.9 6.3 0.8
Source: Rwandan 4th Population and Housing Census, 2012 (NISR)
Christianity is the predominant religion in Rutsiro District with 94.9% distributed as
follows:., Protestants are42.8%, Catholics are 37.7%, Adventists are 13.5% and Jehovah
Witnesses are 1.4%,
Muslims represent 1.4% of the resident population,
2.6% of the resident population declared to be without religion.

Fourth Population and Housing Census, Rwanda, 2012 District Profile:Rutsiro
11
2.2. Marital Status
Table 8: Distribution (%) of the resident population of Rutsiro District aged 12 years and above by
Marital status and Sector
District / Sectors
Total (count)
Total (%)
Never married
Currently Married
Separated Widowed Divorced Not
Stated
Rwanda 6,937,678 100 45.5 46.1 0.5 6.3 1.5 0.0
Western Province 1,595,510 100 45.2 46.6 0.4 6.5 1.2 0.1
Rutsiro District 207,876 100 44.4 48.2 0.4 5.9 1.1 0.1
Boneza 16,044 100 47.4 45.9 0.4 5.1 1.2 0.0
Gihango 15,114 100 47.7 44.4 0.3 5.9 1.7 0.1
Kigeyo 16,184 100 46.4 46.8 0.3 5.3 1.1 0.1
Kivumu 20,912 100 45.1 47.6 0.3 5.8 1.2 0.1
Manihira 10,129 100 41.5 52.4 0.4 4.6 1.0 0.1
Mukura 21,077 100 43.7 49.3 0.4 5.7 0.7 0.1
Murunda 11,574 100 43.1 49.4 0.2 5.9 1.3 0.1
Musasa 14,896 100 42.9 48.9 0.3 6.6 1.3 0.0
Mushonyi 16,002 100 44.9 47.9 0.3 5.8 1.1 0.0
Mushubati 16,351 100 44.4 47.7 0.4 6.5 1.0 0.0
Nyabirasi 17,957 100 41.2 50.7 0.4 6.5 1.1 0.0
Ruhango 18,183 100 46.0 46.8 0.3 5.7 1.1 0.1
Rusebeya 13,453 100 40.4 51.5 0.5 6.6 0.9 0.1 Source: Rwanda 4
th Population and Housing Census, 2012 (NISR)
48.2 of the resident population of Rutsiro district aged 12 and above (48.2%) were
married at the time of the census, while 44.4% were never married. Up to 5.9% were
widowed, while separated and divorced were+ relatively few (0.4% and 1.1
respectively).
At the sector level,
Three sectors have the highest percentages of the currently married people
Manihira (52.4%), Rusebeya (51.5%) and Nyabirasi sectors (50.7%);
Gihango and Boneza sectors have the highest percentage of the never married
persons (47.7% and 47.4% respectively),
Masasa and Rusebeya (6.6% each), Mushubati and Nyabirasi (6.5%each) sectors
have the highest percentage of widowed
Details of the resident population of Rutsiro District aged 12 years and above by marital
status and sex is presented in the annex .

Fourth Population and Housing Census, Rwanda, 2012 District Profile:Rutsiro
12
Table 9: Distribution (%) of the resident population of Rutsiro district aged 12 years and above by
marital status, age groups and sex [Both sexes]
District / Sectors
Total (count)
Total (%)
Never married
Currently Married
Separated Widowed Divorced Not Stated
Rwanda 6,937,678 100 45.5 46.1 0.5 6.3 1.5 0.0
West 1,595,510 100 45.2 46.6 0.4 6.5 1.2 0.1
Rutsiro District 207,876 100 44.4 48.2 0.4 5.9 1.1 0.1
12-14 25,015 100 99.4 0.5 0.0 0.0 0.0 0.0
15-19 35,605 100 97.6 2.2 0.1 0.1 0.1 0.0
20-24 30,096 100 67.7 31.3 0.3 0.2 0.5 0.0
25-29 27,119 100 26.9 70.9 0.6 0.4 1.2 0.0
30-34 22,111 100 11.2 84.7 0.7 1.6 1.7 0.0
35-39 14,462 100 6.3 85.9 0.6 4.7 2.4 0.1
40-44 11,346 100 4.6 83.2 0.5 9.1 2.5 0.1
45-49 9,291 100 3.6 81.1 0.4 12.3 2.3 0.1
50-54 10,216 100 2.5 77.9 0.4 17.1 2.0 0.1
55-59 7,311 100 1.9 75.1 0.4 20.4 2.1 0.1
60-64 5,268 100 1.4 70.4 0.3 25.8 1.9 0.2
65-69 3,108 100 1.6 64.0 0.2 32.1 1.9 0.2
70-74 2,875 100 1.7 55.5 0.1 41.1 1.4 0.3
75-79 1,679 100 2.1 50.4 0.2 45.6 1.2 0.4
80-84 1,322 100 2.3 43.8 0.3 51.8 1.4 0.4
85+ 1,052 100 2.6 41.3 0.0 55.1 0.6 0.4 Source: Rwanda 4
th Population and Housing Census, 2012 (NISR)
The percentages of the resident population of Rutsiro district by marital status vary by sex
and age:
The percentage of the never married persons decreases from 99.4% (age group of
12-14 years) to 2.6% (age group of 85 years and above).
The percentage of persons currently married starts by increasing from 0.5% (age
group of 12-14 years) to a maximum of 85.9% (age group of 35-39 years) before
decreasing down to 41.3% due mainly to widowhood.
The percentage of divorced persons never reaches 3%, while the percentage of the
separated persons is below 1% among all age groups.
The percentage of the current married persons decreases from 91.9% to 89.3% among
males aged between 40-59 years while this percentage decreases from 71.1% to 49.9%
among females with the same age group. For more details on sex distribution see annex

Fourth Population and Housing Census, Rwanda, 2012 District Profile:Rutsiro
13
2.3. Educational Characteristics of the Population
Table 10: Distribution (count and %) of the school-age population of Rutsiro district by sector and by
school attendance status and sex (Both sexes)
Sectors Total(Count) Total (%) Currently attending No longer attending Never attended
Pre-school-age children (3-6 years)
Rwanda 1280857 100 29.0 0.6 70.4
Western Province 307278 100 24.1 0.3 75.6
Rutsiro District 40131 100 17.3 0.2 82.5
Boneza 2958 100 30.5 0.4 69.1
Gihango 2840 100 22.7 0.4 76.9
Kigeyo 2808 100 14.5 0.0 85.5
Kivumu 4220 100 25.6 0.2 74.2
Manihira 2004 100 13.4 0.0 86.6
Mukura 4195 100 11.4 0.2 88.4
Murunda 2324 100 10.7 0.2 89.2
Musasa 2744 100 19.5 0.3 80.2
Mushonyi 2731 100 13.3 0.1 86.6
Mushubati 3182 100 19.7 0.3 79.9
Nyabirasi 3825 100 12.4 0.3 87.3
Ruhango 3581 100 16.8 0.0 83.2
Rusebeya 2719 100 12.0 0.1 87.9
Primary school-age children (7-12 years)
Rwanda 1712459 100 92.5 0.9 6.6
Western Province 425860 10437.7451 9553.2 82.3 802.3
Rutsiro District 58880 100 90.6 0.7 8.7
Boneza 3960 100 95.1 0.7 4.2
Gihango 3912 100 94.4 0.9 4.7
Kigeyo 4520 100 91.7 0.5 7.7
Kivumu 6211 100 92.1 0.8 7.1
Manihira 3019 100 89.8 0.7 9.5
Mukura 6185 100 87.8 1.0 11.3
Murunda 3305 100 86.7 1.1 12.2
Musasa 4080 100 92.6 0.8 6.6
Mushonyi 4460 100 92.6 0.5 6.9
Mushubati 4757 100 94.8 0.4 4.8
Nyabirasi 5232 100 84.8 0.4 14.7
Ruhango 5180 100 88.6 0.7 10.6
Rusebeya 4059 100 88.1 0.7 11.2
Secondary school-age children (13-18 years)
Rwanda 1365771 100 74.4 21.1 4.5
Western Province 328485 100 75.4 18.7 5.8
Rutsiro District 43903 100 72.3 21.2 6.5
Boneza 2858 100 77.9 17.6 4.5
Gihango 3043 100 72.3 24.3 3.5

Fourth Population and Housing Census, Rwanda, 2012 District Profile:Rutsiro
14
Sectors Total(Count) Total (%) Currently attending No longer attending Never attended
Kigeyo 3623 100 77.4 18.3 4.3
Kivumu 4488 100 77.6 16.6 5.7
Manihira 2231 100 74.0 20.8 5.2
Mukura 4566 100 66.2 26.4 7.3
Murunda 2524 100 62.1 28.8 9.1
Musasa 2974 100 71.4 24.0 4.6
Mushonyi 3535 100 76.0 20.8 3.3
Mushubati 3347 100 77.8 18.4 3.8
Nyabirasi 3819 100 66.4 16.6 17.1
Ruhango 3994 100 70.4 22.5 7.1
Rusebeya 2901 100 69.9 22.8 7.4 Source: Rwanda 4
th Population and Housing Census, 2012 (NISR)
School attendance among children varies across education levels:
It is very low (17.3%) for the preschool-age population (3-6 years), very high(90.6%)
for the primary school-age population (7-12 years), and high (72.3%) for the
secondary school-age population (13-18 years).School attendance varies also across
the sectors:
Attendance for preschool-age, it varies from 10.7% in Murunda to 30.5% in
Boneza;
for primary school-age, it varies from 84.8% in Nyabirasito 95.1% in Boneza,
For secondary school, it varies from 62.1% in Murunda to 77.9% in Boneza.

Fourth Population and Housing Census, Rwanda, 2012 District Profile:Rutsiro
15
Table 11: Gross and Net Attendance Rate (%) in primary school of Rutsiro district by sex and sector
Level of education / Sectors
Gross attendance rates Net attendance rates
Both sexes
Male Female GPI Both sexes
Male Female GPI
Rwanda 138.7 138.9 138.4 1.0 88.2 87.3 89.1 1.0
Western Province 139.0 139.1 138.9 1.0 87.9 87.0 88.7 1.0
Rutsiro District 137.7 137.6 137.9 1.00 87.9 86.7 89.0 1.03
Boneza 144.9 147.5 142.2 0.96 92.5 91.3 93.6 1.03
Gihango 144.2 145.5 142.9 0.98 91.2 90.9 91.5 1.01
Kigeyo 146.1 146.1 146.1 1.00 89.4 88.3 90.5 1.02
Kivumu 141.8 143.2 140.4 0.98 87.6 87.2 88.1 1.01
Manihira 142.4 142.9 142.0 0.99 87.9 87.0 88.9 1.02
Mukura 130.4 127.6 133.2 1.04 85.1 83.0 87.1 1.05
Murunda 124.8 122.9 126.9 1.03 84.9 83.9 86.1 1.03
Musasa 138.6 138.1 139.1 1.01 91.0 89.5 92.4 1.03
Mushonyi 141.1 140.8 141.4 1.00 91.3 90.8 91.8 1.01
Mushubati 142.3 142.4 142.2 1.00 91.7 90.4 93.0 1.03
Nyabirasi 127.3 127.0 127.5 1.00 81.9 80.5 83.3 1.03
Ruhango 134.8 133.2 136.3 1.02 84.7 83.3 86.0 1.03
Rusebeya 134.7 135.0 134.4 1.00 86.1 84.5 87.5 1.04
Source: 4th Rwanda Population and Housing Census, 2012(NISR)
Table 11 reveals that not all children attending primary school level are of the official age for
that level (7-12 years).
The gross attendance rates are greater than 100% in all sectors, with minor
variations. The net attendance rate (NAR) in primary school for Rutsiro district
(87.9%) is equal to NAR at Province and slight below of the National level one
(87.9% and 88.2%, respectively).
The highest net attendance rate in primary school (92.5%) is in Boneza sector
followed by Mushubati sector with 91.7% while the sector with low NAR is Nyabirasi
with 81.9%.

Fourth Population and Housing Census, Rwanda, 2012 District Profile:Rutsiro
16
Table 12: Gross and Net Attendance Rate (%) in Secondary School of Rutsiro district by sex and
sector
District / Sectors
Gross attendance rates Net attendance rates
Both sexes
Male Female GPI Both sexes
Male Female GPI
Rwanda 42.3 41.7 43.0 1.0 22.0 20.1 23.8 1.2
Western Province 40.9 40.9 41 1.0 20.2 18.7 21.5 1.1
Rutsiro District 30.3 31.0 29.6 0.96 15.3 14.3 16.3 1.15
Boneza 39.3 37.0 41.9 1.13 17.3 14.2 20.8 1.46
Gihango 32.8 26.9 38.6 1.43 17.8 13.8 21.7 1.57
Kigeyo 32.1 34.6 29.8 0.86 14.4 14.3 14.4 1.01
Kivumu 33.3 38.0 28.6 0.75 13.9 15.1 12.8 0.85
Manihira 20.0 21.6 18.5 0.86 10.9 10.6 11.2 1.06
Mukura 23.2 24.4 22.0 0.90 12.9 12.8 13.1 1.02
Murunda 26.2 25.0 27.3 1.09 15.8 14.2 17.4 1.23
Musasa 32.4 31.1 33.7 1.08 16.6 14.6 18.7 1.28
Mushonyi 34.7 33.8 35.7 1.06 21.4 19.7 23.0 1.17
Mushubati 34.6 34.1 35.0 1.03 18.3 15.1 21.5 1.42
Nyabirasi 28.8 34.3 23.6 0.69 13.5 14.6 12.5 0.86
Ruhango 29.0 27.5 30.6 1.11 14.8 13.3 16.2 1.22
Rusebeya 26.2 30.2 22.2 0.74 11.5 11.5 11.5 1.00 Source: Rwanda 4
th Population and Housing Census, 2012 (NISR)
School attendance at secondary level is far from being universal in Rutsiro District. The
net attendance rate is 15.3% and gross attendance rate in Rutsiro district is 30.3%. This
means that more than two thirds of the Rutsiro children who are supposed to attend
secondary school are not actually attending that level.
There are minor differences in both attendance rates between males and females: the
GAR is higher for males than females (31% vs 29.6%) while the NAR is lower for males
than females (14.3% vs 16.3%)
There are important variations by sector. The net attendance rate is 21.4% in Mushonyi
sector while it is 10.9% in Manihira sector.

Fourth Population and Housing Census, Rwanda, 2012 District Profile:Rutsiro
17
Table 13: Distribution (count and %) of the resident population of Rutsiro district aged 3 years and
above by highest level of educational attainment and sector (Both sexes)
District / Sectors
To
tal (c
ou
nt)
To
tal
(%
)
No
sch
oo
lin
g
Pre
sch
oo
l
Pri
mary
Po
st-
pri
ma
ry
Seco
nd
ary
Un
ivers
ity
No
t sta
ted
Rwanda 9,618,310 100 25.5 3.5 56.7 0.8 10.8 1.9 1.0
Western Province 2,247,963 100 28.7 2.6 56.3 0.5 9.6 1.2 0.9
Rutsiro District 295,840 100
31.8 1.5 57.6 0.4 7.0 0.6 1.0
Boneza 22,271 100
24.3 3.4 61.2 0.6 8.9 0.8 0.9
Gihango 21,095 100
24.7 1.8 61.7 0.7 9.1 1.1 1.1
Kigeyo 22,654 100
29.8 1.0 58.9 0.3 7.9 0.7 1.3
Kivumu 30,132 100
30.7 3.0 56.5 0.4 7.5 0.6 1.3
Manihira 14,589 100
33.2 1.0 59.7 0.3 4.8 0.3 0.7
Mukura 30,292 100
37.0 0.8 55.0 0.4 5.4 0.2 1.1
Murunda 16,581 100
32.3 0.8 58.5 0.6 6.2 0.8 0.8
Musasa 20,959 100
28.4 1.6 61.6 0.5 6.9 0.5 0.5
Mushonyi 22,373 100
28.9 0.8 60.3 0.6 8.2 0.5 0.6
Mushubati 23,439 100
27.4 1.6 61.4 0.6 7.3 0.5 1.1
Nyabirasi 25,987 100
42.5 1.2 48.9 0.2 6.0 0.3 1.0
Ruhango 25,950 100
34.1 1.8 54.7 0.5 6.8 0.7 1.3
Rusebeya 19,518 100
36.8 0.4 55.1 0.2 5.9 0.4 1.1
Source: Rwanda 4th Population and Housing Census, 2012 (NISR)
Among the population aged 3 years and above in Rutsiro district, 31.8% of them has no
education, 57.6% attained the primary level and 7% attained secondary level, while
0.6%attained university.
Level of educational attainment varies across sectors and Gihango sector has both the
highest percentage of residents which attained the secondary and university levels(61.7%
and 9.1% respectively)

Fourth Population and Housing Census, Rwanda, 2012 District Profile:Rutsiro
18
Economic Activity Characteristics of the Population
Table 14: Labour-force participation rate (%) among the resident population aged 16 years and above
by sex, Western Province, district and area of residence
Provinces and Districts
Total Urban Rural
Both sexes Male Female Both sexes Male Female Both sexes Male Female
Rwanda 73.6 75.6 71.7 68.1 75.2 60.9 74.7 75.8 73.9
Western Province 73.4 74.3 72.6 61.6 67.7 56 75 75.3 74.9
Karongi 75.3 75.4 75.3 74.9 78.3 71.7 75.4 75.1 75.6
Rutsiro 78.3 77.8 78.7 76.9 77.8 76.2 78.3 77.8 78.7
Rubavu 65.2 69.7 61.4 56.3 64.5 48.5 71.1 73.3 69.2
Nyabihu 65.3 68.5 62.6 52.3 57.5 48 67.3 70.3 65
Ngororero 80.1 80.2 79.9 66.8 72.6 61.9 80.6 80.6 80.6
Rusizi 74.3 74.1 74.5 71.2 74.3 68.2 74.9 74.1 75.5
Nyamasheke 75.2 74.6 75.7 81 82.1 79.9 75.1 74.4 75.6
Source: Rwanda 4th Population and Housing Census, 2012 (NISR)
The official working age in Rutsiro district is 16 years and above.(people aged 16 years
and above) is composed of 175.5 thousands individuals. Among them 95.3 thousands
(55.9%) are females.
The labour force participation varies greatly in Western Province: from 65% in Rubavu
and Nyabihu to 80% in Ngororero. 78.3% of residents aged 16 years and above are in
labour market, either working or looking for a job(economically active)
Labour force participation rate is slightly higher among females than males (78.7% and
77.8%) and in rural areas (78.3%) than in urban areas (76.9%).

Fourth Population and Housing Census, Rwanda, 2012 District Profile:Rutsiro
19
Figure 5: Labour-force participation rate (LFPR) among the resident population in the private
households aged 5 years and above by age and by sex in Rutsiro district
Error! Reference source not found. allows the study of the calendar and intensity of labour
force participation and its variation by sex .The figure reveals:
Early entry and late exit to the labour market were above 40% at age 16 (the official
entry age in the labour market) and above 70% at 65 years (official age of retirement).
Labour force participation is intense between ages 25 and 60 with above 80% of the
population in the labour market.
Some gender disparity is remarkable in labour force participation at all age groups:
Between 16 and 24 years, females contribute more than males to labour force, while
from age 25, females contribution becomes less than male’s one.

Fourth Population and Housing Census, Rwanda, 2012 District Profile:Rutsiro
20
Table 15: Unemployment rate (%) among the active population aged 16 years and above in Western
Province by sex, District and area of residence
Provinces and Districts
Total Urban Rural
Both sexes
Male Female Both sexes
Male Female Both sexes
Male Female
Rwanda 3.4 2.8 4.0 7.7 5.1 11.1 2.6 2.2 2.9
Western Province
2.8 2.4 3.1 5.5 4.1 7.1 2.4 2.2 2.7
Karongi 2.0 1.7 2.2 3.2 2.3 4.1 1.9 1.6 2.1
Rutsiro 2.5 2.3 2.7 3.1 2.4 3.7 2.5 2.2 2.7
Rubavu 5.2 4.2 6.2 7.7 5.6 10.4 3.9 3.3 4.4
Nyabihu 3.3 2.9 3.7 3.8 3.2 4.5 3.3 2.9 3.6
Ngororero 2.0 1.7 2.2 4.1 2.9 5.3 1.9 1.6 2.1
Rusizi 2.4 2.2 2.5 3.9 2.8 5.1 2.1 2.1 2.2
Nyamasheke 2.3 2.0 2.5 1.5 1.0 2.0 2.3 2.0 2.5
Source: Rwanda 4th Population and Housing Census, 2012 (NISR)
In western Province, variations of unemployment rate are important by district:
from 2.0% in Karongi and Ngororero each to 5.2% in Rubavu district.
2.0% of the total active population aged 16 years and above in Ngororero district
were unemployed during the week preceding the time of census.
Unemployment rate is higher in urban areas than rural (4.1% vs 1.9%) and among
females than males’ (2.2% vs1.7%).

Fourth Population and Housing Census, Rwanda, 2012 District Profile:Rutsiro
21
Chapter 3: Sub-Population
3.1. Children (0-17 years)
3.1.1. Children population
Table 16: Number and share (%) of children aged 0-17 years among the total resident population of
Rutsiro district by sex and sector of residence
Sectors
Total resident population Total resident children Children Share (%)
Both sexes Male Female Both sexes Male Female Both sexes
Male Female
Rwanda 10,515,973 5,064,868 5,451,105 5,015,128 2,486,716 2,528,412 47.7 49.1 46.4
Western Province
2,471,239 1,168,445 1,302,794 1,226,148 606,778 619,370 49.6 51.9 47.5
Rutsiro District 324654 154044 170610
164313 81464 82849 50.6 52.9 48.6
Boneza 24166 12802 11364 11125 5643 5482
46.0 44.1 48.2
Gihango 23166 11004 12162 11346 5611 5735
49.0 51.0 47.2
Kigeyo 24486 11630 12856 12201 6034 6167
49.8 51.9 48.0
Kivumu 32961 15583 17378 16925 8339 8586
51.3 53.5 49.4
Manihira 16098 7534 8564 8437 4156 4281
52.4 55.2 50.0
Mukura 33440 15510 17930 17317 8543 8774
51.8 55.1 48.9
Murunda 18478 8738 9740 9606 4842 4764
52.0 55.4 48.9
Musasa 22805 10873 11932 11192 5592 5600
49.1 51.4 46.9
Mushonyi 24038 11384 12654 11887 5890 5997
49.5 51.7 47.4
Mushubati 25822 12132 13690 13132 6513 6619
50.9 53.7 48.3
Nyabirasi 28971 13510 15461 15065 7408 7657
52.0 54.8 49.5
Ruhango 28589 13322 15267 14770 7340 7430
51.7 55.1 48.7
Rusebeya 21634 10022 11612 11310 5553 5757
52.3 55.4 49.6
Source: Rwanda 4th Population and Housing Census, 2012 (NISR)
The children constitute 50.6% of the resident population of Rutsiro District, with a
slightly percentage of male children than female’s one. (52.9% against 48.6%)
The children share is higher in Manihira (52.4%), Rusebeya(52.3%), Murunda and
Nyabirasi (52% each) and small in Boneza sector (46%).

Fourth Population and Housing Census, Rwanda, 2012 District Profile:Rutsiro
22
3.1.2. Children birth registration
Table 17: Percentage of the children aged 0-17 in western Province whose birth was registered by
sex, District and area of residence
Provinces and
Districts
Total Urban Rural
Both sexes
Male Female Both sexes
Male Female Both sexes
Male Female
Rwanda 79.0 79.0 79.0 74.1 74.3 73.9 79.8 79.7 79.8
Western Province
75.6 75.7 75.6 72.1 72.1 72.1 76.1 76.2 76.0
Karongi 80.0 80.0 79.9 79.8 79.1 80.4 80.0 80.1 79.9
Rutsiro 66.3 66.1 66.5 69.7 69.2 70.2 66.2 66.1 66.4
Rubavu 62.3 62.5 62.2 67.2 67.3 67.1 59.7 59.8 59.5
Nyabihu 70.4 70.5 70.4 65.7 66.0 65.5 71.2 71.2 71.2
Ngororero 76.1 76.1 76.0 78.3 78.6 78.0 76.0 76.0 75.9
Rusizi 87.4 87.5 87.4 83.1 83.0 83.2 88.2 88.3 88.1
Nyamasheke 86.2 86.1 86.2 86.8 86.2 87.4 86.2 86.1 86.2
Source: Rwanda 4th Population and Housing Census, 2012 (NISR)
At the national level the percentage of children whose birth was registered is 79%.
Rubavu district is the district in the Province with a low percentage (62.3%) of children
whose birth was registered at the time of the census
Birth registration varies slightly by sex in Rutsiro district (75.7% for males vs 75.6% for
females). In contrast it varies a lot by area of residence and it is more common in rural
areas (69.7%) than in urban area (66.2%).
The situation is better in Rusizi (87%), Nyamasheke (86%) and Karongi (80%) whose
percentage of birth registration is higher than the average of Western province. It is less
in Rubavu (62%) and Rutsiro (66%) Districts.

Fourth Population and Housing Census, Rwanda, 2012 District Profile:Rutsiro
23
Table 18: Percentage of the children aged 0-17 in Rutsiro district whose birth was registered by sex,
Sector and area of residence
Sectors
Total Urban Rural
Both sexes
Male Female Both sexes
Male Female Both sexes
Male Female
Rwanda 79.0 79.0 79.0 74.1 74.3 73.9 79.8 79.7 79.8
Western Province
75.6 75.7 75.6 72.1 72.1 72.1 76.1 76.2 76.0
Rutsiro District 66.3 66.1 66.5 69.7 69.2 70.2 66.2 66.1 66.4
Boneza 71.3 70.4 72.3 0.0 0.0 0.0 71.3 70.4 72.3
Gihango 76.7 76.3 77.1 79.0 77.9 80.2 76.4 76.1 76.8
Kigeyo 72.5 71.9 73.0 0.0 0.0 0.0 72.5 71.9 73.0
Kivumu 61.4 61.9 60.9 64.8 64.3 65.3 61.0 61.6 60.3
Manihira 79.0 78.9 79.1 0.0 0.0 0.0 79.0 78.9 79.1
Mukura 62.6 62.2 63.0 0.0 0.0 0.0 62.6 62.2 63.0
Murunda 74.2 74.4 73.9 0.0 0.0 0.0 74.2 74.4 73.9
Musasa 73.5 72.7 74.3 0.0 0.0 0.0 73.5 72.7 74.3
Mushonyi 81.2 81.2 81.1 0.0 0.0 0.0 81.2 81.2 81.1
Mushubati 54.7 54.0 55.3 0.0 0.0 0.0 54.7 54.0 55.3
Nyabirasi 50.6 50.6 50.6 0.0 0.0 0.0 50.6 50.6 50.6
Ruhango 57.9 58.0 57.8 0.0 0.0 0.0 57.9 58.0 57.8
Rusebeya 63.6 63.4 63.8 0.0 0.0 0.0 63.6 63.4 63.8 Source: Rwanda 4
th Population and Housing Census, 2012 (NISR)
Birth registration varies across sectors. The highest percentage of registered children
is in Mushonyi Sector (81.2%) while the lowest (50.6%) is in Nyabirasi Sector.
The percentage of birth registration formales (66.1%) is almost the same as of
females (66.5%).
In Rutsiro district, birth registration is higher in urban (69.7%) than in rural areas
(66.2%)

Fourth Population and Housing Census, Rwanda, 2012 District Profile:Rutsiro
24
3.1.3. Economically active children
Table 19: Percentage of children aged 5-17 years currently employed by age group and sex and by
district
Districts
5-9years 10-14years 15-17years
Total Male Female Total Male Female Total Male Female
Rwanda 0.9 1.0 0.9 2.8 3.0 2.7 21.2 20.8 21.6
Western Province
1.1 1.2 1.1 3.2 3.4 3.0 20.6 20.1 21.1
Karongi 1.1 1.2 0.9 2.6 2.9 2.4 16.2 16.3 16.0
Rutsiro 1.7 1.8 1.6 4.9 5.2 4.6 27.5 26.9 28.0
Rubavu 1.4 1.4 1.4 3.5 3.6 3.4 19.8 17.4 22.1
Nyabihu 0.8 0.9 0.7 2.6 2.9 2.4 18.2 18.7 17.8
Ngororero 1.5 1.6 1.4 4.4 4.8 4.1 28.4 28.0 28.8
Rusizi 0.8 0.8 0.8 2.4 2.4 2.4 18.1 17.7 18.5
Nyamasheke 0.6 0.6 0.6 1.9 2.1 1.8 17.0 16.9 17.2
Source: Rwanda 4th Population and Housing Census, 2012 (NISR)
Children labour depends on their ages.
Between 5 and 9 years few children (0.9%) were employed at the time of the
Census at the national level. This percentage is 1.7% in Rutsiro district. There
is a slight difference between girls and boys (1.6% for females vs 1.8% for
males) .
Between 10 years and 14 years the percentage of children who were
employed during the census is around 3% at the national level, while it is
4.9% in Rutsiro district.
Between 15-17years, 21% children were employed at the time of the census
at the national level. This percentage is 27.5% in Rutsiro district.

Fourth Population and Housing Census, Rwanda, 2012 District Profile:Rutsiro
25
Figure 6: Employement among children aged 5-9, 10-14 and 15-17 years by district in Rutsiro District

Fourth Population and Housing Census, Rwanda, 2012 District Profile:Rutsiro
26
Table 20: Percentage of children aged 5-17 years currently employed by age group and sex and by
sector in Rutsiro district
Sectors
5-9yeras 10-14years 15-17years
Both sexes
Male Female Both sexes
Male Female Both sexes
Male Female
Rwanda 0.9 1.0 0.9 2.8 3.0 2.7 21.2 20.8 21.6
Western Province
1.1 1.2 1.1 3.2 3.4 3.0 20.6 20.1 21.1
Rutsiro
District 1.7 1.8 1.6 4.9 5.2 4.6 27.5 26.9 28.0
Boneza 0.5 0.4 0.5 2.5 3.1 1.9 17.0 17.2 16.8
Gihango 5.0 5.2 4.7 10.1 11.2 9.1 29.9 30.2 29.6
Kigeyo 2.7 2.8 2.6 5.8 5.5 6.2 25.8 24.3 27.1
Kivumu 1.9 1.9 1.9 4.1 3.9 4.4 19.8 17.1 22.6
Manihira 0.5 0.5 0.5 2.3 2.1 2.5 22.1 21.5 22.7
Mukura 2.9 3.2 2.7 5.9 5.9 6.0 30.6 28.3 32.7
Murunda 1.9 2.1 1.7 10.9 12.1 9.8 44.8 46.2 43.4
Musasa 0.9 0.7 1.0 4.2 5.0 3.4 30.5 30.0 31.1
Mushonyi 0.3 0.4 0.2 3.0 3.1 3.0 28.9 31.2 26.6
Mushubati 0.6 0.7 0.5 3.0 3.6 2.4 23.2 25.0 21.4
Nyabirasi 2.0 2.3 1.7 5.2 5.7 4.7 30.6 28.0 33.0
Ruhango 1.4 1.8 1.1 3.9 4.7 3.2 28.8 29.5 28.0
Rusebeya 0.7 0.7 0.7 3.4 3.6 3.2 26.8 25.4 28.1
Source: Rwanda 4th Population and Housing Census, 2012 (NISR)
Gihango Sector has a high percentage of employed children aged between 5-9
years(5.0%), while Murunda and Gihango sectors have a high percentage of
employed children aged 10-14 years (10.9% and 10.1% respectively) and a high
percentage of children aged 15-17 years is in Murunda sector (44.8%).

Fourth Population and Housing Census, Rwanda, 2012 District Profile:Rutsiro
27
3.2. Youth (14-35 years)
3.2.1. Youth population
Table 21: Number and share (%) of the resident youth aged 14-35 years among the total resident
population of Rutsiro district by Sector of residence and sex (Both sexes)
Sectors
Total resident population Youth resident population Youth Share (%)
Both sexes
Male Female Both sexes
Male Female
Bo
th
se
xe
s
Ma
le
Fe
ma
le
Rwanda 10,515,973 5,064,868 5,451,105 4,166,777 2,033,130 2,133,647 39.6 40.1 39.1
Western Province
2,471,239 1,168,445 1,302,794 960,716 455,154 505,562 38.9 39.0 38.8
Rutsiro District 324654 154044 170610 125499 60232 65267 38.7 39.1 38.3
Boneza 24166 12802 11364 10367 6022 4345 42.9 47.0 38.2
Gihango 23166 11004 12162 9363 4599 4764 40.4 41.8 39.2
Kigeyo 24486 11630 12856 9611 4541 5070 39.3 39.0 39.4
Kivumu 32961 15583 17378 12496 5911 6585 37.9 37.9 37.9
Manihira 16098 7534 8564 6349 3051 3298 39.4 40.5 38.5
Mukura 33440 15510 17930 12389 5754 6635 37.0 37.1 37.0
Murunda 18478 8738 9740 6891 3197 3694 37.3 36.6 37.9
Musasa 22805 10873 11932 8885 4297 4588 39.0 39.5 38.5
Mushonyi 24038 11384 12654 9077 4229 4848 37.8 37.1 38.3
Mushubati 25822 12132 13690 9830 4694 5136 38.1 38.7 37.5
Nyabirasi 28971 13510 15461 11110 5134 5976 38.3 38.0 38.7
Ruhango 28589 13322 15267 10630 4829 5801 37.2 36.2 38.0
Rusebeya 21634 10022 11612 8501 3974 4527 39.3 39.7 39.0 Source: Rwanda 4
th Population and Housing Census, 2012 (NISR)
Youth is defined in Rwanda as the population aged 14 to 35.
At the time of the census, young people in Rutsiro district were 125,499 which represent
38.7% of the total resident population of the district (403,662).
Although the share of the youth is almost the same at district level (39.1% for males vs
38.3% for females), it varies a little within the sectors of the district.
Sector with the highest youth share are Boneza (42.9%) and Gihango (40.4%)
Mukura is a sector with a low percentage of youth ( 37%).

Fourth Population and Housing Census, Rwanda, 2012 District Profile:Rutsiro
28
3.2.2. Educational characteristics of youth
Table 22: Distribution (count and %) of the resident youth of Rutsiro district aged 14-35 years by
Sector of residence and school attendance status (Both sexes)
District and Sectors
Count %
Total Currently attending
No longer attending
Never attended
Total Currently attending
No longer attending
Never attended
Rwanda 4,166,777 1,223,587 2,427,974 515,216 100 29.4 58.3 12.4
Western Province 960716 295670 515929
149117 100 30,8 53,7 15,5
Rutsiro District 125,499 34,697 68,248 22,554 100.0 27.6 54.4 18.0
Boneza 10,367 2,662 6,267 1,438 100.0 25.7 60.5 13.9
Gihango 9,363 2,491 5,992 880 100.0 26.6 64.0 9.4
Kigeyo 9,611 3,115 5,067 1,429 100.0 32.4 52.7 14.9
Kivumu 12,496 4,119 5,983 2,394 100.0 33.0 47.9 19.2
Manihira 6,349 1,634 3,602 1,113 100.0 25.7 56.7 17.5
Mukura 12,389 3,023 6,745 2,621 100.0 24.4 54.4 21.2
Murunda 6,891 1,611 4,035 1,245 100.0 23.4 58.6 18.1
Musasa 8,885 2,325 5,182 1,378 100.0 26.2 58.3 15.5
Mushonyi 9,077 2,702 5,197 1,178 100.0 29.8 57.3 13.0
Mushubati 9,830 2,859 5,762 1,209 100.0 29.1 58.6 12.3
Nyabirasi 11,110 2,864 4,585 3,661 100.0 25.8 41.3 33.0
Ruhango 10,630 3,091 5,368 2,171 100.0 29.1 50.5 20.4
Rusebeya 8,501 2,201 4,463 1,837 100.0 25.9 52.5 21.6 Source: Rwanda 4
th Population and Housing Census, 2012 (NISR)
Youth who have never attended school represent 12.4% of the total resident population at
national level; it represents16.2% of the total resident population in the Western Province
and 18% of the total resident population of Rutsiro District.
The percentage of youth who never attended school varies a lot within Sectors of Rutsiro
district. The highest percentage was registered in Nyabirasi (33%), whereas alow
percentage of youth who never attended school was enumerated in Gihango (9.4%).

Fourth Population and Housing Census, Rwanda, 2012 District Profile:Rutsiro
29
Table 23: Distribution (count and %) of the youth population of Rutsiro District aged 14-35 years by
Sector of residence and highest level of education attained (Both sexes)
District / Sectors
To
tal
(co
un
t)
To
tal(
%)
No
sc
ho
olin
g
Pre
sc
ho
ol
Pri
ma
ry
Po
st-
pri
ma
ry
Se
co
nd
ary
Un
ive
rsit
y
No
t s
tate
d
Rwanda 4,166,777 100 12.4 0.3 61.4 0.2 21.7 3.3 0.8
Western Province 960,716 100 15.5 0.3 61.3 0.1 19.8 2.2 0.8
Rutsiro District 125,499 100.0 18.0 0.2 64.8 0.1 15.0 1.1 0.8
Boneza 10,367 100.0 13.9 0.1 66.6 0.1 17.1 1.4 0.8
Gihango 9,363 100.0 9.4 0.3 69.0 0.1 18.6 1.7 0.8
Kigeyo 9,611 100.0 14.9 0.0 65.8 0.0 16.6 1.3 1.3
Kivumu 12,496 100.0 19.2 0.2 62.0 0.1 16.4 1.2 0.9
Manihira 6,349 100.0 17.5 0.5 70.3 0.1 10.3 0.6 0.7
Mukura 12,389 100.0 21.2 0.1 65.3 0.1 12.1 0.5 0.7
Murunda 6,891 100.0 18.1 0.0 66.7 0.1 13.1 1.4 0.7
Musasa 8,885 100.0 15.5 0.1 68.6 0.1 14.5 0.9 0.4
Mushonyi 9,077 100.0 13.0 0.1 66.3 0.2 18.7 1.1 0.6
Mushubati 9,830 100.0 12.3 0.1 69.4 0.1 16.1 1.0 1.0
Nyabirasi 11,110 100.0 33.0 0.1 53.0 0.0 12.6 0.5 0.8
Ruhango 10,630 100.0 20.4 0.8 61.3 0.1 15.1 1.4 0.9
Source: Rwanda 4th Population and Housing Census, 2012 (NISR)
In Rutsiro district, among all youth, 64.8% attained only the primary school level, 15%
attended the secondary education, 1.1% went to university, and 18% have no
education.
The highest level of education attained varies across sectors of the district.
The sectors with ahigh percentage of youth with no schooling are Nyabirasi
(33%) and Mukura (21.2%).
Youth with university level is high in Gihango sector (1.7%); youth with
secondary level is high in Mushonyi (18.7%) and Gihango (18.6%) sectors
The sectors with a high percentages of youth with primary education is Manihira
(70.3%).

Fourth Population and Housing Census, Rwanda, 2012 District Profile:Rutsiro
30
3.2.3. Economically active youth
Table 24: Distribution (count and %) of the resident youth of Rutsiro district aged 14-35 years by
economic activity status and sex, and by sector residence
Sector of residence
Total count
Total %
Employed Unemployed Inactive Not stated
Bo
th s
ex
es
Male
Fem
ale
Bo
th s
ex
es
Male
Fem
ale
Bo
th s
ex
es
Male
Fem
ale
Bo
th s
ex
es
Male
Fem
ale
Rwanda 4166777
100,0
59,6 29,7 29,9 2,5 1,0 1,5 36,6 17,2 19,4 1,3 0,9 0,4
Western
Province 960716
100,0
59,6 28,0 31,6 2,0 0,8 1,2 36,9 17,5 19,4 1,6 1,1 0,5
Rutsiro
District 125,499 100 65.1 62.2 67.7 1.8 0.7 1.0 31.2 32.2 30.2 2.0 4.0 0.1
Boneza 10,367 100
53.3 42.2 68.6 0.6 0.2 0.4 26.5 23.7 30.4 19.6 33.7 0.0
Gihango 9,363
64.1 62.2 65.8 1.2 0.4 0.7 30.7 28.9 32.4 4.1 8.0 0.3
Kigeyo 9,611 100
65.9 63.3 68.2 1.0 0.6 0.4 33.1 35.5 30.9 0.0 0.0 0.0
Kivumu 12,496 100
62.7 59.1 65.8 1.5 0.5 1.0 35.7 39.7 32.1 0.2 0.0 0.3
Manihira 6,349 100
63.6 63.5 63.8 2.4 0.8 1.6 33.9 34.8 33.1 0.0 0.0 0.0
Mukura 12,389 100
64.3 63.1 65.3 3.0 1.4 1.7 32.7 34.0 31.6 0.0 0.0 0.0
Murunda 6,891 100
75.0 74.3 75.5 1.8 0.7 1.1 23.1 24.1 22.3 0.1 0.1 0.1
Musasa 8,885 100
72.1 70.4 73.7 0.5 0.2 0.3 27.3 29.2 25.7 0.0 0.0 0.0
Mushonyi 9,077 100
68.1 65.4 70.5 1.0 0.5 0.5 30.5 32.8 28.4 0.4 0.8 0.1
Mushubati 9,830 100
63.4 64.0 62.9 1.9 0.7 1.2 34.6 34.6 34.7 0.0 0.0 0.0
Nyabirasi 11,110 100
68.3 65.9 70.4 1.3 0.5 0.8 30.4 33.0 28.1 0.0 0.0 0.0
Ruhango 10,630 100
64.9 62.6 66.7 4.0 1.8 2.2 31.0 33.3 29.0 0.1 0.1 0.2
Rusebeya 8,501 100
64.8 64.4 65.1 2.5 1.1 1.5 32.7 33.3 32.1 0.0 0.0 0.0
Source: Rwanda 4th Population and Housing Census, 2012 (NISR)
In Rutsiro district, 65.1% of the youth was employed at the time of the census (65%),
while 31.2% were out of the labour market (inactive). Only 1.8% were unemployed.
Murunda (75%) and Musasa (72.1%) Sectors had the high percentage of employed youth
and the low are in Boneza Sector (39% each).
The high percentage of unemployment youth is in Mukura Sector (4%) while the lowest
percentage of unemployed youth is in Boneza and Musasa Sectors (0.5% each).
At the time of the census, the youth out of the labour market was high in Kivumu (35.7%)
and the lowest in Murunda (23.1%).

Fourth Population and Housing Census, Rwanda, 2012 District Profile:Rutsiro
31
Table 25: Distribution (%) of the currently employed youth of Rutsiro district aged 14-35 years by
employment status and sex
Sectors
Total(counts) Total Employee Employer
Self-employed
Contributing family worker
Producers cooperative member
Other Not Stated
Rwanda 4166777 100 22.3 0.4 64.1 12.7 0.3 0.2 2.0
Western Province 960716 100 18.0 0.4 58.8 19.4 0.2 0.2 3.0
Rutsiro
District
125,499
100 13.8 0.3 60.0 22.8 0.3 0.2 2.6
Boneza
10,367 100
10.2 0.3 63.6 24.1 0.1 0.0 1.6
Gihango
9,363 100
17.4 0.4 56.5 23.4 0.2 0.1 2.0
Kigeyo
9,611 100
18.1 0.1 43.0 36.2 0.3 0.2 2.1
Kivumu
12,496 100
15.8 0.5 56.6 22.7 0.3 0.1 4.0
Manihira
6,349 100
9.1 0.2 57.5 32.1 0.3 0.0 0.8
Mukura
12,389 100
10.5 0.4 59.7 24.2 0.1 0.2 4.9
Murunda
6,891 100
11.2 0.3 63.7 23.5 0.2 0.0 1.1
Musasa
8,885 100
9.4 0.2 56.6 31.3 0.3 0.1 2.1
Mushonyi
9,077 100
14.2 0.2 69.4 14.1 0.2 0.1 1.8
Mushubati
9,830 100
10.6 0.4 64.8 20.6 0.3 0.2 3.1
Nyabirasi
11,110 100
17.2 0.5 67.4 11.2 0.7 0.2 2.8
Ruhango
10,630 100
19.1 0.3 59.2 19.0 0.1 0.0 2.2
Rusebeya
8,501 100
14.0 0.2 62.1 19.0 0.5 1.0 3.2
Source: Rwanda 4th Population and Housing Census, 2012 (NISR)
In Rutsiro district, the majority of youth aged 14-35 currently employed are self-employed
(60%), followed by contributing family workers (22.8%) and employees (13.8%).
The high percentage of employee youth is in Ruhango sector (19.1%), and low in
Manihira (9.1%) and Musasa sectors (9,4%).
The majority of youth in Mushonyi (69.4%) and Nyabirasi (67.4%) are self-employed while
the low percentage of self-employed youth is in Kigeyo (43.0%)

Fourth Population and Housing Census, Rwanda, 2012 District Profile:Rutsiro
32
3.3. Persons with Disabilities
Table 26: Number and share (%) of persons with disabilities of Rutsiro District aged 5 years and
above (Prevalence of disabilities) by Sector of residence and sex
District and Sectors
Total population (5
years and above)
Number of persons with disabilities
Prevalence of disabilities (%
of persons with disabilities)
Both sexes Both sexes Male Female Both sexes
Rwanda 8,975,946 446,453 221,150 225,303 5.0
Western Province 2,096,134 110,032 52,698 57,334 5.2
Rutsiro District 276,756 15,023 7,171 7,852 5.4
Boneza 20,970 960 564 396 4.6
Gihango 19,739 907 459 448 4.6
Kigeyo 21,307 1,353 653 700 6.4
Kivumu 27,930 1,492 717 775 5.3
Manihira 13,664 624 285 339 4.6
Mukura 28,239 1,934 828 1106 6.8
Murunda 15,486 822 384 438 5.3
Musasa 19,778 620 303 317 3.1
Mushonyi 21,185 1,042 534 508 4.9
Mushubati 21,888 1,368 623 745 6.3
Nyabirasi 24,081 1,774 817 957 7.4
Ruhango 24,253 1,192 573 619 4.9
Rusebeya 18,236 935 431 504 5.1
Source: Rwanda 4th Population and Housing Census, 2012 (NISR)
At the national level, 5% of the resident population aged 5 years and above have a
disability,
In Western Province, the prevalence rate is 5.2%, while in Rutsiro district it is 5.4%
At sector level, a high prevalence rates of the resident population aged 5 years and
above who have a disability are in Nyabirasi (7.4%), Mukura (6.8%), Kigeyo (6.4%)
and Mushubati (6.3%) while a low one is in Musasa (3.1%).

Fourth Population and Housing Census, Rwanda, 2012 District Profile:Rutsiro
33
3.4. Elderly Population
3.4.1. Elderly share
Table 27: Number and share (%) of the resident elderly (aged 60 years and above) among the total
resident population of Rutsiro district by Sector of residence and sex
Sector of residence
Total resident population Total resident elderly
Population share (% of elderly among
the resident population)
Both sexes
Male Female Both sexes
Male Female Both sexes
Male Female
Rwanda 10,515,973 5,064,868 5,451,105 511,738 207,239 304,499 4.9 4.1 5.6
Western 2,471,239 1,168,445 1,302,794 119,777 47,346 72,431 4.9 4.1 5.6
Rutsiro
District 324654 154044 170610 15,304 6,091 9,213 4.7 4.0 5.4
Boneza 24166 12802 11364 1,023 434 589 4.2 3.4 5.2
Gihango 23166 11004 12162 1,103 400 703 4.8 3.6 5.8
Kigeyo 24486 11630 12856 1,307 550 757 5.3 4.7 5.9
Kivumu 32961 15583 17378 1,549 623 926 4.7 4.0 5.3
Manihira 16098 7534 8564 672 261 411 4.2 3.5 4.8
Mukura 33440 15510 17930 1,591 599 992 4.8 3.9 5.5
Murunda 18478 8738 9740 867 358 509 4.7 4.1 5.2
Musasa 22805 10873 11932 1,041 412 629 4.6 3.8 5.3
Mushonyi 24038 11384 12654 1,337 565 772 5.6 5.0 6.1
Mushubati 25822 12132 13690 1,230 455 775 4.8 3.8 5.7
Nyabirasi 28971 13510 15461 1,263 499 764 4.4 3.7 4.9
Ruhango 28589 13322 15267 1,477 626 851 5.2 4.7 5.6
Rusebeya 21634 10022 11612 844 309 535 3.9 3.1 4.6
Source: Rwanda 4th Population and Housing Census, 2012 (NISR)
In 2012, the elderly persons constitute 4.7%of the resident population of Rutsiro district.
The share of the elderly females is higher than the male’s one (5.4% vs. 4%), The elderly
share is both high in Mushonyi sector (5.6%) and low in Rusebeya sector (3.9%).

Fourth Population and Housing Census, Rwanda, 2012 District Profile:Rutsiro
34
3.4.2. Economically active elderly
Table 28: Distribution (count) of the elderly resident (aged 60 years and above) by economic activity
status and sex, and by sector of residence
Sector of residence
Total resident Elderly population Currently employed elderly % of employed elderly
Both sexes
Male Female Both sexes
Male Female Both sexes
Male Female
Rwanda 511,738 207,239 304,499 271,605 117,822 153,783 53.1 56.9 50.5
Western Province 119,777 47,346 72,431 60,828 25,721 35,107 50.8 54.3 48.5
Rutsiro District 15,304 6,091 9,213 8,469 3,618 4,851 55.3 59.4 52.7
Boneza 1,023 434 589 579 257 322 56.6 59.2 54.7
Gihango 1,103 400 703 620 230 390 56.2 57.5 55.5
Kigeyo 1,307 550 757 828 369 459 63.4 67.1 60.6
Kivumu 1,549 623 926 932 414 518 60.2 66.5 55.9
Manihira 672 261 411 302 128 174 44.9 49.0 42.3
Mukura 1,591 599 992 729 297 432 45.8 49.6 43.5
Murunda 867 358 509 542 242 300 62.5 67.6 58.9
Musasa 1,041 412 629 656 284 372 63.0 68.9 59.1
Mushonyi 1,337 565 772 875 372 503 65.4 65.8 65.2
Mushubati 1,230 455 775 583 237 346 47.4 52.1 44.6
Nyabirasi 1,263 499 764 611 274 337 48.4 54.9 44.1
Ruhango 1,477 626 851 810 354 456 54.8 56.5 53.6
Rusebeya 844 309 535 402 160 242 47.6 51.8 45.2
Source: Rwanda 4th Population and Housing Census, 2012 (NISR)
In Rutsiro District, people keep on working until old ages as demonstrated by the fact that
55.3% were employed at the time of the census.
The percentage of employed elderly males is higher than elderly females (59.4% vs.
52.7%).
Employment among elderly resident is high in Mushonyi (65.4%), Kigeyo (63.4%) and
Musasa (63%) sectors and low in Manihira (44.9%) and Mukura (45.8%)

Fourth Population and Housing Census, Rwanda, 2012 District Profile:Rutsiro
35
3.4.3. Marital status of elderly
Table 29: Distribution (%) of the elderly resident (aged 60 years and above) of Rutsiro District by
sector of residence and marital status (Both sexes)
District and Sectors
Marital Status
To
tal(
co
un
t)
All
Never
marr
ied
Cu
rren
tly
marr
ied
Wid
ow
ed
Div
orc
ed
/
sep
ara
ted
No
t sta
ted
Rwanda 511,738 100 2.2 56.5 38.6 2.5 0.2
West 119,777 100 2.1 57.0 38.7 2.0 0.2
Rutsiro
District 15,304 100.0 1.7 59.8 36.4 1.8 0.3
Boneza 1,023 100.0 1.9 57.4 37.8 2.8 0.1
Gihango 1,103 100.0 2.2 57.4 37.4 2.5 0.5
Kigeyo 1,307 100.0 1.3 63.9 32.8 1.8 0.2
Kivumu 1,549 100.0 2.4 58.9 36.2 2.1 0.4
Manihira 672 100.0 0.7 67.4 30.8 0.9 0.1
Mukura 1,591 100.0 1.6 63.1 33.9 1.1 0.3
Murunda 867 100.0 1.0 60.1 36.9 1.5 0.5
Musasa 1,041 100.0 1.7 53.7 42.4 2.1 0.1
Mushonyi 1,337 100.0 2.1 61.2 34.6 1.9 0.1
Mushubati 1,230 100.0 1.1 55.0 41.0 2.5 0.3
Nyabirasi 1,263 100.0 1.6 57.8 39.4 1.0 0.2
Ruhango 1,477 100.0 2.3 63.4 32.5 1.6 0.3
Rusebeya 844 100.0 1.4 58.3 39.0 1.2 0.1
Source: Rwanda 4th Population and Housing Census, 2012 (NISR)
In Rutsiro District, 59.8% are married and 36.4% are widowed. Celibacy, divorce and
separation are rare among the elderly (less than 4% all together).
Marital status among the elderly varies slightly by sector of residence. Marriage rate is
high in Manihira (67.4%) sectorConversely widowhood is widespread in Musasa (42.4%)
and Mushubati (41%) sectors.

Fourth Population and Housing Census, Rwanda, 2012 District Profile:Rutsiro
36
Chapter 4: Households and Housing Characteristics
4.1. Households Characteristics
4.1.1. Average size of households
Table 30: Number of private households of Rutsiro District and their corresponding population by
Sector and mean size of private households
Sectors Number of private
households Corresponding
population Mean size of private
household
Rwanda 2,424,898 10,515,973 4.3
Western Province 543,494 2,438,355 4.5
Rutsiro District 71,267 321,761 4.5
Boneza 4,801 21,965 4.6
Gihango 5,244 22,756 4.3
Kigeyo 5,153 24,486 4.8
Kivumu 6,950 32,931 4.7
Manihira 3,647 16,098 4.4
Mukura 7,579 33,440 4.4
Murunda 4,110 18,464 4.5
Musasa 5,220 22,805 4.4
Mushonyi 5,248 23,839 4.5
Mushubati 5,878 25,819 4.4
Nyabirasi 6,353 28,971 4.6
Ruhango 6,166 28,553 4.6
Rusebeya 4,918 21,634 4.4
Source: Rwanda 4th Population and Housing Census, 2012 (NISR)
The average household size in Rutsiro district is 4.5 persons.
At the Sector level, the high sizes are found in Kigeyo (4.8 persons) and Kivumu (4.7
persons).
Small household size is found in Gihango sector (4.3 persons).

Fourth Population and Housing Census, Rwanda, 2012 District Profile:Rutsiro
37
4.1.2. Private households’ heads of Rutsiro District
Table 31: Distribution (count and %) of private households’ heads of Rutsiro District by Sector and sex
Sectors
Count %
Total number of private
households
Households headed by
Male
Households headed by
Female Total
Households headed by
Male
Households headed by
Female
Rwanda 2,424,898 1,728,945 695,953 100 71.3 28.7
Western Province
543,494 381,546 161,948 100 70.2 29.8
Rutsiro District
71,267 50,238
21,029
100.0 70.5 29.5
Boneza 4,801
3,571
1,230 100.0 74.4 25.6
Gihango 5,244
3,493
1,751 100.0 66.6 33.4
Kigeyo 5,153
3,838
1,315 100.0 74.5 25.5
Kivumu 6,950
5,074
1,876 100.0 73.0 27.0
Manihira 3,647
2,573
1,074 100.0 70.6 29.4
Mukura 7,579
5,082
2,497 100.0 67.1 32.9
Murunda 4,110
2,836
1,274 100.0 69.0 31.0
Musasa 5,220
3,741
1,479 100.0 71.7 28.3
Mushonyi 5,248
3,833
1,415 100.0 73.0 27.0
Mushubati 5,878
3,978
1,900 100.0
67.7 32.3
Nyabirasi 6,353
4,505
1,848 100.0
70.9 29.1
Ruhango 6,166
4,301
1,865 100.0
69.8 30.2
Rusebeya 4,918
3,413
1,505 100.0
69.4 30.6 Source: Rwanda 4
th Population and Housing Census, 2012 (NISR)
At the national level, 28.7% of private households are headed by women,
At the district level, 29.8% of private households are headed by women.
At the sector level, high percentages of female-headed households are found in the
sectors of Gihango (33.4%), Mukura (32.9%) and Mushubati (32.3%), and small ones in
Kigeyo (25.5%) and Boneza (25.6%)

Fourth Population and Housing Census, Rwanda, 2012 District Profile:Rutsiro
38
4.2. Housing Characteristics
4.2.1. Type of habitat
Table 32: Distribution (count and %) of the private households of Rutsiro District by type of habitat
and Sector
Sectors
To
tal
(co
un
t)
To
tal
(%)
Um
ud
ug
ud
u
Dis
pe
rsed
/Iso
late
d
ho
us
ing
Pla
nn
ed
urb
an
ho
us
ing
Sp
on
tan
eo
us
/
Sq
ua
tter
ho
us
ing
Oth
er
typ
e o
f
ho
us
ing
No
t S
tate
d
Rwanda 2,424,898 100 49.3 33.7 2.2 14.1 0.6 0.1
Western Province
543,494 100 40.1 47.5 2.6 9.1 0.6 0.1
Rutsiro District 71,267 100 62.6 35.3 0.2 1.6 0.2 0.1
Boneza 4,801 100
51.4 48.2 0.2 0.1 0.0 0.1
Gihango 5,244 100
69.0 27.2 0.2 3.1 0.3 0.1
Kigeyo 5,153 100
70.1 27.9 0.1 0.7 1.1 0.1
Kivumu 6,950 100
71.9 23.2 0.0 4.8 0.1 0.0
Manihira 3,647 100
55.7 43.0 0.1 0.7 0.5 0.1
Mukura 7,579 100
48.1 50.8 0.4 0.6 0.0 0.1
Murunda 4,110 100
67.1 30.1 0.3 2.3 0.2 0.0
Musasa 5,220 100
76.3 22.7 0.2 0.5 0.3 0.0
Mushonyi 5,248 100
76.7 22.6 0.1 0.2 0.4 0.0
Mushubati 5,878 100
49.0 48.5 0.2 2.0 0.0 0.1
Nyabirasi 6,353 100
60.6 36.9 0.2 2.0 0.2 0.1
Ruhango 6,166 100
69.5 29.0 0.2 1.2 0.0 0.0
Rusebeya 4,918 100
50.0 48.5 0.1 1.3 0.0 0.1
Source: Rwanda 4th Population and Housing Census, 2012 (NISR)
The most common type of habitat in Rutsiro district is the clustered rural settlement
known as Umudugudu (62.6%), followed by dispersed/isolated housing (35.3%) and
spontaneous/squatter housing (1.6%).
Percentage of clustered rural settlement housing (umudugudu) across sectors varies
between 48.1% and 76.7%.
Mushonyi and Musasa are the sectors with high percentage of clustered rural
settlement(76.7% and 76.3% respectively) while Mukura, Mushubati and Boneza have
more dispersed/isolated housing(50.8%, 48.5% and 48.2% respectively).

Fourth Population and Housing Census, Rwanda, 2012 District Profile:Rutsiro
39
Figure 7: Distribution (%) of the private households of Rutsiro District by type of habitat and
by Area of residence
62,7
35,4
0,21,4
0,20,1
Umudugudu
Dispersed/Isolated housing
Planned urban housing
Spontaneous / Squarter housing
Other type of housing
Not Stated
Type of Habitat - Rural
Source: 4th Rwanda Population and Housing Census, 2012, (NISR)
58,2
31,0
0,1 10,7
0,0 0,0
Umudugudu
Dispersed/Isolated housing
Planned urban housing
Spontaneous / Squarter housing
Other type of housing
Not Stated
Type of habitat-Urban
Source: 4th Rwanda Population and Housing Census, 2012, ( NISR)
The type of habitat varies according to the area of residence.
In urban areas, the predominant type is the clustered rural settlement (58.2%).
followed by dispersed/isolated housing 31%, and the spontaneous/squatter housing
(10.7%),

Fourth Population and Housing Census, Rwanda, 2012 District Profile:Rutsiro
40
In rural areas the predominant type is clustered rural settlement (umudugudu) with
62.7% and dispersed/isolated housing with 35.4%.

Fourth Population and Housing Census, Rwanda, 2012 District Profile:Rutsiro
41
Tenure of the housing Table 33: Distribution (%) of the private households of Rutsiro District by tenure of the housing units
and by Sector
Sectors Total Owner Tenant Hire
purchase Free
lodging Staff
housing Other
Not Stated
Rwanda 100 80.0 14.8 0.1 4.2 0.6 0.2 0.1
Western Province 100 86.1 8.8 0.1 4.5 0.3 0.1 0.1
Rutsiro District 100 88.8 5.5 0.1 5.3 0.1 0.0 0.1
Boneza 100 86.4 6.5 0.1 6.6 0.2 0.0 0.0
Gihango 100 86.9 7.0 0.1 5.5 0.1 0.0 0.1
Kigeyo 100 89.5 5.5 0.1 4.7 0.1 0.0 0.1
Kivumu 100 87.6 7.5 0.1 4.6 0.1 0.0 0.1
Manihira 100 90.1 3.9 0.1 5.6 0.1 0.0 0.0
Mukura 100 90.7 4.1 0.0 5.0 0.0 0.0 0.1
Murunda 100 90.1 5.5 0.1 3.9 0.1 0.0 0.0
Musasa 100 91.2 4.5 0.1 3.9 0.1 0.0 0.1
Mushonyi 100 90.5 4.8 0.2 4.3 0.2 0.0 0.0
Mushubati 100 88.3 4.3 0.1 6.6 0.1 0.0 0.4
Nyabirasi 100 86.5 6.2 0.3 6.7 0.2 0.0 0.1
Ruhango 100 87.7 7.7 0.0 3.9 0.4 0.0 0.2
Rusebeya 100 90.2 2.3 0.1 7.1 0.1 0.0 0.2
Source: Rwanda 4th Population and Housing Census, 2012 (NISR)
In Rutsiro district, 88.8% of housing units are occupied by their owner and only 5.5% by
tenants and free lodging 5.3%.
At the sector level, the percentage of owners of households units is higher in Musasa (91.2%), Mukura (90.7%) and Mushonyi (90.5%).

Fourth Population and Housing Census, Rwanda, 2012 District Profile:Rutsiro
42
Figure 8: Distribution (%) of the private households of Rutsiro District by tenure of the housing and area of residence
78,4
16,1
0,0
5,0
0,10,0
0,20,1
Owner
Tenant
Hire purchase
Free lodging
Staff housing
Refugee camp/temporaly camp settlment
Other
Not Stated
Tenure of housing-Urban
Source: 4th Rwanda Population and Housing Census, 2012, (NISR)
89,1
5,2
0,1
5,3
0,1 0,00,1 0,1
Owner
Tenant
Hire purchase
Free lodging
Staff housing
Refugee camp/temporaly camp settlment
Other
Not Stated
Source: 4th Rwanda Population and Housing Census, 2012,(NISR)
Tenure of housing -Rural
The tenure of housing units varies substantially according to the area of residence.
The percentage of owners of housing units is 78.4% in urban areas against 89% in
rural areas,
The percentage of tenants of housing units is 16% in urban areas whereas it is 5.2%
in rural areas,

Fourth Population and Housing Census, Rwanda, 2012 District Profile:Rutsiro
43
4.2.2. Material of the housing units
4.2.2.1. Main materials of the roof
Table 34: Distribution (count and %) of the private households of Rutsiro District by main material of
the roof of the housing units and by Sector
Sectors Total number
of private households
Total (%) Iron sheets Local tiles Other
material Not
Stated
Rwanda 2,424,898 100 59.5 39.3 0.9 0.1
WesternProvince 543,494 100 46.2 52.8 0.8 0.1
Rutsiro District 71,267 100
9.1 89.9 0.8 0.1
Boneza 4,801 100
4.2 94.5 1.0 0.4
Gihango 5,244 100
9.8 89.4 0.6 0.2
Kigeyo 5,153 100
9.7 89.0 1.1 0.2
Kivumu 6,950 100
2.1 96.4 1.2 0.2
Manihira 3,647 100
3.0 95.8 1.1 0.2
Mukura 7,579 100
7.4 91.3 0.7 0.5
Murunda 4,110 100
4.8 94.4 0.8 0.0
Musasa 5,220 100
3.9 95.2 0.8 0.1
Mushonyi 5,248 100
11.6 87.2 1.1 0.2
Mushubati 5,878 100
6.2 92.3 1.4 0.0
Nyabirasi 6,353 100
12.7 86.3 0.9 0.1
Ruhango 6,166 100
1.5 97.6 0.8 0.2
Rusebeya 4,918 100
6.8 92.1 1.0 0.2
Source: Rwanda 4th Population and Housing Census, 2012 (NISR)
In Rutsiroi district, housing units are mainly covered by local tiles (89.9%) and iron sheets
(9.1%).
The percentage of housing units using local tiles varies substantially between 86.3% and
97.6% across sectors. The highest percentage of housing covered by local tiles is found
in Ruhango (97.6%) and Kivumu (96.4%).
The high percentages of the housing units covered by iron sheets are in Nyabirasi
(12.7%) and Mushonyi (11.6%)

Fourth Population and Housing Census, Rwanda, 2012 District Profile:Rutsiro
44
Figure 9: Distribution (%) of the private households of Rutsiro District by main material of the roof and of the housing unit and by area of residence
7,4
90,2
2,20,1
Iron sheets
Local tiles
Other material
Not Stated
Main material of Roof- Urban
Source: 4th Rwanda Population and Housing Census, 2012, (NISR)
6,8
92,1
0,90,2
Iron sheets
Local tiles
Other material
Not Stated
Source: 4th Rwanda Population and Housing Census,2012,(NISR)
Main material of roof-Rural
The materials used for roofing are the local tiles (90.2% in urban vs 92.1% in rural)
and iron sheets (7.4%in urban areas vs 6.8% in rural).

Fourth Population and Housing Census, Rwanda, 2012 District Profile:Rutsiro
45
4.2.2.2. Main materials of the walls
Table 35: Distribution (count and %) of the private households of Rutsiro District by main material of
the walls of the housing unit and by Sector
Se
cto
rs
To
tal
nu
mb
er
of
pri
va
te
ho
us
eh
old
s
To
tal
(%)
Wo
od
/Mu
d
Wo
od
/Ce
me
n
ted
mu
d
Su
nd
rie
d
bri
ck
s
Pla
sti
c
sh
ea
thin
g
/Ca
rdb
oa
rd
Ce
me
nt
blo
ck
s/C
on
cr
ete
Sto
ne
Tim
be
r
Bu
rnt
bri
ck
s
Oth
er
No
t S
tate
d
Rwanda 2,424,898
100 35.6 4.1 55.3 0.1 0.7 0.2 0.8 2.6 0.3 0.3
Western Province
543,494
100 22.4 0.9 69.7 0.1 0.3 0.4 3.3 2.3 0.2 0.3
Rutsiro District 71,267
100 3.0 0.0 95.0 0.0 0.0 0.0 0.0 1.0 0.0 0.0
Boneza 4,801
100 0.0 1.0 98.0 0.0 0.0 0.0 0.0 0.0 0.0 0.0
Gihango 5,244
100 1.0 1.0 94.0 0.0 0.0 0.0 0.0 4.0 0.0 1.0
Kigeyo 5,153
100 1.0 0.0 98.0 0.0 0.0 0.0 0.0 1.0 0.0 0.0
Kivumu 6,950
100 1.0 0.0 97.0 0.0 0.0 0.0 0.0 0.0 0.0 1.0
Manihira 3,647
100 1.0 0.0 97.0 0.0 0.0 0.0 0.0 0.0 0.0 0.0
Mukura 7,579
100 6.0 0.0 93.0 0.0 0.0 0.0 0.0 0.0 0.0 1.0
Murunda 4,110
100 7.0 0.0 87.0 0.0 0.0 0.0 0.0 4.0 0.0 1.0
Musasa 5,220
100 1.0 0.0 97.0 0.0 0.0 0.0 0.0 2.0 0.0 0.0
Mushonyi 5,248
100 0.0 0.0 98.0 0.0 0.0 0.0 0.0 1.0 0.0 0.0
Mushubati 5,878
100 2.0 0.0 97.0 0.0 0.0 0.0 0.0 0.0 0.0 0.0
Nyabirasi 6,353
100 9.0 0.0 88.0 0.0 0.0 2.0 0.0 0.0 0.0 0.0
Ruhango 6,166
100 5.0 1.0 92.0 0.0 0.0 0.0 0.0 2.0 0.0 0.0
Rusebeya 4,918
100 4.0 0.0 95.0 0.0 0.0 0.0 0.0 0.0 0.0 0.0
Source: Rwanda 4th Population and Housing Census, 2012 (NISR)
In Rutsiro district walls of the housing units are mostly built with sundried bricks (95%)
and wood/mud (3%). Burnt bricks represent 1.0%.
At the sector level, sundried bricks stand far as the most used material for walls in
Boneza, Kigeyo, and Mushonyi (98% each), the wood/mud is most used in Nyabirasi
(9%) and Murunda (7%).
The burnt bricks are mostly used in Gihango and Murunda sectors (4% each).

Fourth Population and Housing Census, Rwanda, 2012 District Profile:Rutsiro
46
Figure 10: Distribution (%) of the private households of Rutsiro District by main material of the walls of the housing unit and by area of residence
1,5
86,3
0,0 10,6
1,0 0,6
Wood/Mud
Sundried brickes
Timber
Burnt bricks
Other
Not Stated
Main material of walls-urban
Source: 4th Rwanda Population and Housing Census, 2012,(NISR)
3,1
94,9
0,00,9 0,70,4
Wood/Mud
Sundried brickes
Timber
Burnt bricks
Other
Not Stated
Main material of walls-rural
Source: 4th Rwanda Population and Housing Census, 2012,(NISR)
In both urban and rural areas, the predominant materials are sundried bricks (86.3%
in urban vs 94.9% in rural).
In urban area 10.6% of housing units are built by burnt bricks.

Fourth Population and Housing Census, Rwanda, 2012 District Profile:Rutsiro
47
4.2.3. Source of energy of the private households
4.2.3.1. Main source of energy for lighting
Table 36: Distribution (count and %) of the private households of Rutsiro District by main source of
energy for lighting and by Sector
Sectors
Total number of
private household
s
Total (%)
Electricity Kerosene lamp
Candle Firewood Other Not
Stated
Rwanda 2,424,898 100 17.5 39.6 9.7 7.9 24.9 0.5
Western Province 543,494 100 12.0 36.0 10.7 16.5 23.9 0.5
Rutsiro District 71,267 100
3.3 24.8 11.5 24.2 35.6 0.5
Boneza 4,801 100
0.0 54.3 8.1 5.6 31.5 0.5
Gihango 5,244 100
7.0 16.6 9.5 18.3 47.2 1.4
Kigeyo 5,153 100
5.1 42.1 11.4 19.1 21.8 0.4
Kivumu 6,950 100
5.3 42.3 13.0 24.0 14.9 0.5
Manihira 3,647 100
0.0 6.8 18.6 25.1 49.2 0.3
Mukura 7,579 100
0.0 13.7 10.6 29.6 45.2 0.5
Murunda 4,110 100
5.8 20.5 6.4 17.5 49.1 0.7
Musasa 5,220 100
3.1 23.6 15.0 16.0 42.3 0.1
Mushonyi 5,248 100
6.7 45.7 10.7 17.5 18.8 0.4
Mushubati 5,878 100
3.6 21.2 3.2 23.1 48.4 0.5
Nyabirasi 6,353 100
0.0 9.2 18.0 44.9 27.5 0.3
Ruhango 6,166 100
6.5 21.3 12.8 28.1 31.0 0.3
Rusebeya 4,918 100
0.0 3.2 12.8 36.7 47.1 0.3
Source: Rwanda 4th Population and Housing Census, 2012 (NISR)
In Rutsiro district the main sources of energy for lighting used by the households are
kerosene lamp (24.8%), firewood (24.2%), candle (11.5%) and electricity (3.3%).
At the sector level, the percentage of the private households using kerosene lamp for
lighting is higher in Boneza (54.3%) and Mushonyi (45.7%). It is low in Rusebeya (3.2%),
Manihira (6.8%) and Nyabirasi (9.2%).The percentage that use electricity for lighting is
higher in Gihango (7%) , Mushonyi (6.7%) and Ruhango (6.5%) sectors
The sectors with the highest percentages of private households using firewood for lighting
are Nyabirasi (44.9%) and Rusebeya (36.7%).
The high percentages of households that use candle are in Nyabirasi (18%) and Musasa
(15%)

Fourth Population and Housing Census, Rwanda, 2012 District Profile:Rutsiro
48
Figure 11: Distribution (%) of the private households of Rutsiro District by main source of energy for lighting and by area of residence
27,4
27,214,8
19,1
10,7
0,9
Electricity
Kerosene Lamp
Candle
Firewood
Other
Not stated
Main source of energy for lighting-Urban
Source: 4th Rwanda Population and Housing Census,2012(NISR)
3,1
24,7
11,5
24,3
35,9
0,5
Electricity
Kerosene Lamp
Candle
Firewood
Other
Not stated
Main source of energy for lighting-Rural
Source: 4th Rwanda Population and Housing Census, 2012(NISR)
The sources of energy for lighting vary by area of residence.
In urban areas, the three main sources of energy for lighting are electricity (27.3%),
kerosene lamp (27.2%), Firewood (19.1%) and candle (14.8%).
In rural areas, most of private households use kerosene lamps (24.7%) and firewood
(24.3%) for lighting and candle (11.5%).

Fourth Population and Housing Census, Rwanda, 2012 District Profile:Rutsiro
49
4.2.3.2. Main source of energy for cooking
Table 37: Distribution (count and %) of the private households of Rutsiro District by main source of
energy for cooking and by Sector
Sectors
Total number of private household
Total Firewood Charcoal Grass/Leaves Other Not Stated
Rwanda
2,424,898
100 82.2 13.2 2.7 1.2 0.7
Western Province 543,494
100 88.6 8.3 1.8 0.7 0.6
Rutsiro District 71,267 100
96.8 1.9 0.4 0.3 0.6
Boneza 4,801 100
94.7 3.3 0.3 0.8 0.9
Gihango 5,244 100
97.1 1.9 0.2 0.2 0.6
Kigeyo 5,153 100
94.0 1.2 3.3 0.7 0.8
Kivumu 6,950 100
97.0 1.7 0.6 0.2 0.5
Manihira 3,647 100
97.3 1.2 0.3 0.4 0.7
Mukura 7,579 100
94.8 3.1 1.1 0.2 0.8
Murunda 4,110 100
98.1 1.4 0.0 0.3 0.2
Musasa 5,220 100
97.0 2.1 0.3 0.2 0.4
Mushonyi 5,248 100
94.4 1.8 2.8 0.3 0.7
Mushubati 5,878 100
97.5 0.8 1.0 0.2 0.4
Nyabirasi 6,353 100
93.6 2.5 2.8 0.4 0.7
Ruhango 6,166 100
96.7 0.6 1.8 0.2 0.7
Rusebeya 4,918 100
96.0 1.8 1.2 0.4 0.6
Source: Rwanda 4th Population and Housing Census, 2012 (NISR)
At the district level, firewood is used as the main sources of energy for cooking in private
households (96.8%) followed by charcoal (1.9%), and grass/leaves (1.7%).
At the sector level, firewood is the most used source of cooking energy by private
households in all sectors (between 93.6% and 98.1%).
Sectors with high percentage of private households using charcoal as main source of
cooking energy are Boneza (3.3%) and Mukura(3.1%).
Sectors with the highest percentages of private households using grass/leaves as main
source of cooking energy are Kigeyo (3.3%), Mushonyi and Nyabirasi (2.8% each).

Fourth Population and Housing Census, Rwanda, 2012 District Profile:Rutsiro
50
Figure 12: Distribution (%) of the private households of Rutsiro District by main source of energy for cooking and by area of residence
87,3
10,2
0,01,8
0,7
Firewood
Charcoal
Grass/Leaves
Other
Not Stated
Main source of energy for cooking -urban
Source: 4th Rwanda Population and Housing Census , 2012, (NISR)
96,2
1,61,2 0,3
0,6
Firewood
Charcoal
Grass/Leaves
Other
Not Stated
Main source of energy for cooking-rural
Source: 4th Rwanda Population and Housing Census, 2012, (NISR)
The main sources of energy for cooking used by private households vary by area of
residence.
In urban areas, private households use more firewood (87.3%) and charcoal (10.2%).
In rural areas, private households use mainly firewood (96.2%).

Fourth Population and Housing Census, Rwanda, 2012 District Profile:Rutsiro
51
4.2.4. Water and sanitation of the private households
4.2.4.1. Main source of water
Table 38: Distribution (count and %) of the private households of Rutsiro District by main source of
water and by Sector
Sectors
Main source of water
Total number of private
households Total Improved source of water
Unimproved source of water Not Sated
Rwanda
2,424,898
100 72,3 26,7 1,1
Western Province
543,494
100 71,1 27,6 1,2
Rutsiro District 71,267 100 70,3 28,4 1,4
Boneza 4,801 100 66,5 32,1 1,4
Gihango 5,244 100 67,4 30,6 2
Kigeyo 5,153 100 76,2 22,3 1,4
Kivumu 6,950 100 83,1 15 1,9
Manihira 3,647 100 68,6 30,1 1,3
Mukura 7,579 100 62,1 36,4 1,5
Murunda 4,110 100 62,1 36,1 1,7
Musasa 5,220 100 78,8 20,7 0,5
Mushonyi 5,248 100 84,6 14,4 1
Mushubati 5,878 100 76,9 21,3 1,8
Nyabirasi 6,353 100 70,8 28 1,2
Ruhango 6,166 100 53,6 45,7 0,8
Rusebeya 4,918 100 61,5 36,6 1,9
In Rutsiro District, 70.3 % of the private households use improved sources of water.
At the sector level, the percentage of the private households using water from improved
sources is between 53.6 % and 84.6 %.
The hight percentage of the private households using water from unimproved sources is
in Ruhango (45.7%), Rusebeya (36.6%) and Mukura, (36.4%), sectors.

Fourth Population and Housing Census, Rwanda, 2012 District Profile:Rutsiro
52
Figure 13: Distribution (%) of the private households of Rutsiro District main source of water and by Sector
66,5
67,4 7
6,2 8
3,1
68,6
62,1
62,1
78,8 84,6
76,9
70,8
53,6 6
1,5
32,1
30,6
22,3
15
30,1 36,4
36,1
20,7
14,4 2
1,3 2
8
45,7
36,6
1,4
2 1,4 1,9
1,3
1,5
1,7
0,5
1 1,8
1,2
0,8 1,9
Improved source of water Unimproved source of water Not Sated

Fourth Population and Housing Census, Rwanda, 2012 District Profile:Rutsiro
53
Figure 14: Distribution (%) of the private households of Rutsiro District by main source of water and by area of residence
89,2
9,5
1,3
Improved source of water
Unimproved source of water
Not Stated
Main source of water-Urban
Source: 4th Rwanda Population and Housinng Census,2012(NISR)
69,9
28,7
1,4
Improved source of water
Unimproved source of water
Not Stated
Main source of water-rural
Source: 4th Rwanda Population and Housing Census, 2012(NISR)
In both Urban and rural areas, ah high percentage of private households use water from
improved source of water (89.2% in urban vs 69.9% in rural area). In rural areas, 27.8%
of private households use water from unimproved source of water, while 9% of private
households use water from unimproved source of water in urban area.

Fourth Population and Housing Census, Rwanda, 2012 District Profile:Rutsiro
54
Main type of toilet facility
Table 39: Distribution (count and %) of the private households of Rutsiro District by main type of toilet
facility and by Sector
Sectors
Main source of toilet facilities
Total number of private households
Total
Flush toilet / WC System
Private pit latrine
Shared pit latrine
Bush Other Not Stated
Rwanda
2,424,898
100 0.8 82.4 12.4 0.9 1.7 1.7
Western Province
543,494
100 0.4 84.1 10.4 1.4 1.8 2.0
Rutsiro
District 71,267 100 0.0 81.9 12.0 1.7 2.5 1.9
Boneza 4,801 100 0.0 76.5 17.9 0.8 3.1 1.7
Gihango 5,244 100 0.2 80.0 14.5 0.7 2.7 2.1
Kigeyo 5,153 100 0.0 84.0 9.6 1.0 2.9 2.5
Kivumu 6,950 100 0.0 74.7 13.0 3.0 5.2 4.1
Manihira 3,647 100 0.0 88.4 6.9 1.8 0.9 2.0
Mukura 7,579 100 0.0 88.6 7.4 1.3 1.4 1.3
Murunda 4,110 100 0.1 78.4 16.2 1.2 1.9 2.2
Musasa 5,220 100 0.0 86.7 8.9 0.5 3.3 0.5
Mushonyi 5,248 100 0.0 84.1 12.0 0.8 1.6 1.5
Mushubati 5,878 100 0.0 83.8 10.6 1.1 3.4 1.2
Nyabirasi 6,353 100 0.0 81.8 11.2 4.5 1.4 1.1
Ruhango 6,166 100 0.0 78.3 13.7 2.6 3.0 2.4
Rusebeya 4,918 100 0.0 79.3 15.8 1.0 1.3 2.6
Source: Rwanda 4th Population and Housing Census, 2012 (NISR)
At the district level the main types of toilet facility used by the private households are
private pit latrine (81.9%) and shared pit latrine (12%). Only 1.7% of the private
households of the district are equipped with bush.
At the sector level, the percentage of households using private pit latrines is high. It varies
between 74.7% and 88.6%.
Boneza has a high percentage of private households using shared pit latrine (17.9%).

Fourth Population and Housing Census, Rwanda, 2012 District Profile:Rutsiro
55
Figure 15: Distribution (%) of the private households of Rutsiro District by main type of toilet facility and by area of residence
0,5
76,9
9,6
1,05,6
6,3
Flush toilet / WC System
Private pit latrine
Shared pit latrine
Bush
Other
Not Stated
Main type of toilet -Urban
Source: 4th Rwanda Population and Housing census, 2012(NISR)
0,0
82,0
12,0
1,7 2,51,8
Flush toilet / WC SystemPrivate pit latrine
Shared pit latrine Bush
Other
Not Stated
Main type of toilet -Rural
Source: 4th Rwanda Population and Housing census, 2012(NISR)
The type of toilet facility used in the private households varies according to the area of
residence.
In urban areas, the most used types of toilet are private pit latrine (76.9%) and
shared pit latrine (9.6%).
In rural areas, the main type of toilet used is the private pit latrine (82%) and to a
lesser extent the shared pit latrine (12%).

Fourth Population and Housing Census, Rwanda, 2012 District Profile:Rutsiro
56
4.2.4.2. Mode of waste disposal
Table 40: Distribution (count and %) of the private households of Rutsiro District by mode of waste
disposal and by Sector
Sectors
Mode of waste disposal
To
tal
nu
mb
er
of
pri
vate
ho
useh
old
s
To
tal
Co
mp
ost
du
mp
ing
Pri
vate
du
st
bin
s
Pu
blic
refu
se
du
mp
In t
he b
ush
On
th
e
farm
s
In t
he R
ive
r/
Str
ea
m/
Dari
n/G
utt
er
Oth
er
No
t sta
ted
Rwanda
2,424,898
100 57.2 8.7 1.2 6.9 23.7 0.1 1.3 0.9
Western Province 543,494
100 60.4 4.1 0.5 9.3 23.7 0.1 0.9 1.0
Rutsiro District 71,267 100 65.5 1.3 0.2 9.3 21.9 0.1 0.7 1.0
Boneza 4,801 100 63.0 2.5 0.0 9.1 23.9 0.1 0.5 1.0
Gihango 5,244 100 64.1 2.2 0.1 8.2 24.0 0.0 0.5 0.9
Kigeyo 5,153 100 67.0 1.4 0.6 10.5 18.7 0.1 0.3 1.3
Kivumu 6,950 100 70.0 1.6 0.1 8.8 17.0 0.1 0.9 1.4
Manihira 3,647 100 65.0 1.3 0.2 10.6 21.7 0.0 0.6 0.7
Mukura 7,579 100 76.3 0.3 0.1 6.8 14.5 0.1 0.5 1.4
Murunda 4,110 100 76.6 2.6 0.2 7.1 11.6 0.1 0.2 1.6
Musasa 5,220 100 46.4 1.1 0.1 3.1 47.9 0.0 0.8 0.6
Mushonyi 5,248 100 60.5 2.8 0.1 6.5 28.8 0.1 0.5 0.7
Mushubati 5,878 100 66.6 0.7 0.0 6.9 23.1 0.2 1.3 1.2
Nyabirasi 6,353 100 58.7 0.5 0.1 18.9 20.6 0.0 0.5 0.7
Ruhango 6,166 100 60.2 1.1 0.4 12.9 22.8 0.1 1.9 0.7
Rusebeya 4,918 100 75.2 0.5 0.1 10.5 12.0 0.1 0.4 1.3 Source: Rwanda 4
th Population and Housing Census, 2012 (NISR)
In Rutsiro district, the main modes of waste disposal used by the private households are
the compost dumping (65.5%), the farms (21.9%), the bush (9.3%), and the private dust
bins (1.3%).
Sectors with high percentages of households using compost dumping are Murunda
(76.6%), Mukura (76.3%), Rusebeya (75.2%) and Kivumu (70%),
Sector with the highest proportions of households disposing their waste on the farms is
Musasa (47.9%),
Sector with highest proportions of private households that discharge domestic waste in
the bush is Nyabirasi (18.9%).

Fourth Population and Housing Census, Rwanda, 2012 District Profile:Rutsiro
57
Figure 16: Distribution (%) of the private households of Rutsiro District by mode of waste disposal and by area of residence
67,1
7,5
0,2
4,3
18,2
0,11,2 1,4
Compost dumping
Private dust bins
Public refuse dump
In the bush
On the farms
In the River/Stream/Darin/Gutter
Other
Not stated
Main mode of waste disposal-urban
Source: 4th Rwanda Population and Housing Census , 2012, (NISR)
65,4
1,2
0,2
9,4
22,0
0,10,7 1,0
Compost dumping
Private dust bins
Public refuse dump
In the bush
On the farms
In the River/Stream/Darin/Gutter
Other
Not stated
Main mode of waste disposal -Rural
Source: 4th Rwanda Population and Housing Census,2012, (NISR)
The main modes of waste disposal used by the households vary by area of residence.
Urban households evacuate their waste mainly in the compost dumping (67.1%), on
the Farms (18.2%) or in the private dust bins (7.5%).
In rural areas, the households evacuate their waste mainly in compost dumping
(65.4%), on the farms (22%) or in the bush (9.4%).

Fourth Population and Housing Census, Rwanda, 2012 District Profile:Rutsiro
58
Assets possessed by private households
4.2.4.3. Communication assets
Table 41: Percentage of the private households of Rutsiro District possessing communication assets
by Sector
Sectors
Total number of
private household
Radio TV Telephone (landline)
Cellphone Computer
Rwanda
2,424,898
64.0 7.8 0.5 54.1 2.4
Western Province 543,494
56.3 4.4 0.6 47.4 1
Rutsiro District 71,267 56.7 1.4 0.4 41.0 0.4
Boneza 4,801 66.2 0.7 0.2 49.9 0.4
Gihango 5,244 58.8 3.0 1.3 40.9 1.5
Kigeyo 5,153 62.9 1.6 0.4 51.6 0.3
Kivumu 6,950 51.5 1.7 1.0 39.9 0.3
Manihira 3,647 59.3 0.5 0.2 38.4 0.2
Mukura 7,579 56.1 0.3 0.1 33.3 0.1
Murunda 4,110 58.5 2.4 0.2 41.8 1.0
Musasa 5,220 62.5 1.2 0.3 42.8 0.2
Mushonyi 5,248 61.9 1.8 0.2 49.4 0.2
Mushubati 5,878 55.2 1.2 0.2 39.2 0.3
Nyabirasi 6,353 45.9 0.2 0.3 36.3 0.0
Ruhango 6,166 51.4 2.7 1.0 39.3 0.6
Rusebeya 4,918 53.4 0.6 0.2 35.4 0.1
Source: Rwanda 4th Population and Housing Census, 2012 (NISR)
At the district level 56.7% of the private households possess a radio, 41% owns a mobile
phone, 1.4% a TV and 0.4% a computer.
Households possess a radio in Rutsiro district are between 45.9% (Nyabirasi) and 66.2%
(Boneza) Mobile phone is more common in sectors of Kigeyo (51.6%) and Boneza
(49.9%) while it is less common in Mukura (33.3%) and in Nyabirasi (36.3%)
Gihango leads other sectors with 1.3% of households possessing TV.

Fourth Population and Housing Census, Rwanda, 2012 District Profile:Rutsiro
59
4.2.4.4. Access to the Internet
Table 42: Percentages of the private households of Rutsiro district that have access to the Internet by
place of access
Sectors Total number
of private households
Home Office/School Cyber-café Other
Rwanda
2,424,898
42.3 52.7 57.6 17.7
Western Province 543,494
34.6 48.1 87.9 17.3
Rutsiro District 71,267 41.0 54.3 33.2 20.5
Boneza 4,801 31.4 61.6 20.9 25.6
Gihango 5,244 56.0 66.7 35.5 24.8
Kigeyo 5,153 39.7 48.0 41.1 4.1
Kivumu 6,950 30.1 38.6 57.8 13.3
Manihira 3,647 40.9 29.6 25.0 22.7
Mukura 7,579 45.3 45.3 26.6 26.6
Murunda 4,110 62.9 70.5 18.1 17.1
Musasa 5,220 28.8 51.3 36.3 32.5
Mushonyi 5,248 38.2 56.6 48.7 18.4
Mushubati 5,878 21.5 41.8 44.3 22.8
Nyabirasi 6,353 38.2 52.9 17.7 20.6
Ruhango 6,166 38.1 55.6 27.0 19.1
Rusebeya 4,918 50.0 64.7 17.7 14.7
Source: Rwanda 4th Population and Housing Census, 2012 (NISR)
At the district level, private households mainly access internet at office or school (54.3%),
at home (41%) and at cyber-cafes (33.2%).
At the sector level,
Sectors with the highest proportions of private households with access to internet from
office or school are Murunda (70.5%), Gihango (66.7%), Rusebeya (64.7%) and Boneza
(61.6%)
Sectors with the highest proportions of private households with access to internet at
home are Murunda (62.9%), Gihango (56%) and Rusebeya (50%).
Sectors with the highest proportions of private households with access to internet
through Cyber-café are Kivumu (57.8%) and Mushonyi (48.7%)

Fourth Population and Housing Census, Rwanda, 2012 District Profile:Rutsiro
60
Figure 17: Percentage of private households whose at least one member have access to the Internet by place of access and by area of residence
41,0
52,1
39,5
54,3
73,6
51,8
33,2
41,3
32,1
20,5 23,1
20,1
0,0
10,0
20,0
30,0
40,0
50,0
60,0
70,0
80,0
90,0
100,0
Rutsiro District Rutsiro Urban Rutsiro Rural
Home Office/School Cyber cafe Other
Source: Rwanda 4
th Population and Housing Census, 2012 (NISR)
Access to the Internet varies greatly depending on the area of residence.
In urban areas, private households access the Internet mainly in office or at school
(73.6%) and through at Home (52.1%).
In rural areas, private households access the Internet mainly in office or at school
(51.8%) and through at Home (39.5%).

Fourth Population and Housing Census, Rwanda, 2012 District Profile:Rutsiro
61
ANNEXES
Table 43: Distribution (count and %) of the resident population of Rutsiro District by Single age and
Sex
AGE Count %
Both sexes Male Female Both sexes Male Female
Total 324,654 154,044 170,610 100.0 100.0 100.0
0 10,340 5,231 5,109 3.2 3.4 3.0
1 9,785 4,910 4,875 3.0 3.2 2.9
2 8,689 4,393 4,296 2.7 2.9 2.5
3 9,940 4,936 5,004 3.1 3.2 2.9
4 9,144 4,495 4,649 2.8 2.9 2.7
5 10,012 4,953 5,059 3.1 3.2 3.0
6 11,035 5,463 5,572 3.4 3.5 3.3
7 10,687 5,302 5,385 3.3 3.4 3.2
8 9,693 4,669 5,024 3.0 3.0 2.9
9 9,605 4,847 4,758 3.0 3.1 2.8
10 10,022 5,021 5,001 3.1 3.3 2.9
11 7,826 3,801 4,025 2.4 2.5 2.4
12 11,047 5,408 5,639 3.4 3.5 3.3
13 6,669 3,298 3,371 2.1 2.1 2.0
14 7,299 3,581 3,718 2.2 2.3 2.2
15 7,353 3,619 3,734 2.3 2.3 2.2
16 8,290 4,057 4,233 2.6 2.6 2.5
17 6,877 3,480 3,397 2.1 2.3 2.0
18 7,415 3,733 3,682 2.3 2.4 2.2
19 5,670 2,771 2,899 1.7 1.8 1.7
20 6,942 3,400 3,542 2.1 2.2 2.1
21 5,893 2,757 3,136 1.8 1.8 1.8
22 5,993 2,982 3,011 1.8 1.9 1.8
23 5,569 2,681 2,888 1.7 1.7 1.7
24 5,699 2,745 2,954 1.8 1.8 1.7
25 5,698 2,673 3,025 1.8 1.7 1.8
26 5,720 2,673 3,047 1.8 1.7 1.8
27 5,177 2,368 2,809 1.6 1.5 1.6
28 5,794 2,702 3,092 1.8 1.8 1.8
29 4,730 2,223 2,507 1.5 1.4 1.5
30 5,869 2,818 3,051 1.8 1.8 1.8
31 3,855 1,793 2,062 1.2 1.2 1.2
32 4,885 2,309 2,576 1.5 1.5 1.5
33 3,732 1,720 2,012 1.1 1.1 1.2
34 3,770 1,676 2,094 1.2 1.1 1.2
35 3,269 1,471 1,798 1.0 1.0 1.1
36 2,834 1,180 1,654 0.9 0.8 1.0
37 2,809 1,173 1,636 0.9 0.8 1.0
38 2,865 1,204 1,661 0.9 0.8 1.0
39 2,685 1,184 1,501 0.8 0.8 0.9
40 2,769 1,217 1,552 0.9 0.8 0.9
41 1,968 836 1,132 0.6 0.5 0.7
42 2,640 1,122 1,518 0.8 0.7 0.9

Fourth Population and Housing Census, Rwanda, 2012 District Profile:Rutsiro
62
AGE Count %
Both sexes Male Female Both sexes Male Female
43 2,027 904 1,123 0.6 0.6 0.7
44 1,942 853 1,089 0.6 0.6 0.6
45 1,940 871 1,069 0.6 0.6 0.6
46 1,804 748 1,056 0.6 0.5 0.6
47 1,814 775 1,039 0.6 0.5 0.6
48 1,920 807 1,113 0.6 0.5 0.7
49 1,813 783 1,030 0.6 0.5 0.6
50 2,382 995 1,387 0.7 0.6 0.8
51 1,762 715 1,047 0.5 0.5 0.6
52 2,277 950 1,327 0.7 0.6 0.8
53 2,087 872 1,215 0.6 0.6 0.7
54 1,708 724 984 0.5 0.5 0.6
55 1,602 703 899 0.5 0.5 0.5
56 1,688 689 999 0.5 0.4 0.6
57 1,419 613 806 0.4 0.4 0.5
58 1,374 553 821 0.4 0.4 0.5
59 1,228 523 705 0.4 0.3 0.4
60 1,543 650 893 0.5 0.4 0.5
61 933 414 519 0.3 0.3 0.3
62 1,221 527 694 0.4 0.3 0.4
63 837 338 499 0.3 0.2 0.3
64 734 288 446 0.2 0.2 0.3
65 749 314 435 0.2 0.2 0.3
66 696 248 448 0.2 0.2 0.3
67 711 268 443 0.2 0.2 0.3
68 512 204 308 0.2 0.1 0.2
69 440 179 261 0.1 0.1 0.2
70 832 325 507 0.3 0.2 0.3
71 402 150 252 0.1 0.1 0.1
72 817 297 520 0.3 0.2 0.3
73 387 142 245 0.1 0.1 0.1
74 437 140 297 0.1 0.1 0.2
75 361 124 237 0.1 0.1 0.1
76 476 170 306 0.1 0.1 0.2
77 385 150 235 0.1 0.1 0.1
78 237 105 132 0.1 0.1 0.1
79 220 108 112 0.1 0.1 0.1
80 370 158 212 0.1 0.1 0.1
81 216 82 134 0.1 0.1 0.1
82 459 163 296 0.1 0.1 0.2
83 142 58 84 0.0 0.0 0.0
84 135 56 79 0.0 0.0 0.0
85 142 54 88 0.0 0.0 0.1
86 120 49 71 0.0 0.0 0.0
87 121 57 64 0.0 0.0 0.0
88 78 39 39 0.0 0.0 0.0
89 61 27 34 0.0 0.0 0.0
90 99 41 58 0.0 0.0 0.0
91 50 16 34 0.0 0.0 0.0
92 149 67 82 0.0 0.0 0.0
93 17 8 9 0.0 0.0 0.0

Fourth Population and Housing Census, Rwanda, 2012 District Profile:Rutsiro
63
AGE Count %
Both sexes Male Female Both sexes Male Female
94 27 14 13 0.0 0.0 0.0
95 23 9 14 0.0 0.0 0.0
96 28 6 22 0.0 0.0 0.0
97 23 7 16 0.0 0.0 0.0
98 22 7 15 0.0 0.0 0.0
99 7 2 5 0.0 0.0 0.0
100 24 10 14 0.0 0.0 0.0
101 11 3 8 0.0 0.0 0.0
102 16 5 11 0.0 0.0 0.0
103 1 1 0 0.0 0.0 0.0
104 1 1 0 0.0 0.0 0.0
105 6 1 5 0.0 0.0 0.0
106 5 3 2 0.0 0.0 0.0
107 2 0 2 0.0 0.0 0.0
108 2 1 1 0.0 0.0 0.0
110 8 2 6 0.0 0.0 0.0
111 1 0 1 0.0 0.0 0.0
112 5 2 3 0.0 0.0 0.0
114 1 0 1 0.0 0.0 0.0
116 1 0 1 0.0 0.0 0.0
117 1 1 0 0.0 0.0 0.0 Source: Rwanda 4
th Population and Housing Census, 2012 (NISR)

Fourth Population and Housing Census, Rwanda, 2012 District Profile:Rutsiro
64
Age-sex structure for all sectors
Table 44: Distribution (count and %) of the resident population of Rutsiro District by 5-year age group
and sex
Boneza Sector
Five-year age groups
Count %
Both sexes Male Female Both sexes Male Female
Total 24,166 12,802 11,364 100.0 100.0 100.0
0-4 3,196 1,636 1,560 13.2 12.8 13.7
5-9 3,747 1,853 1,894 15.5 14.5 16.7
10-14 2,732 1,408 1,324 11.3 11.0 11.7
15-19 2,446 1,357 1,089 10.1 10.6 9.6
20-24 2,639 1,637 1,002 10.9 12.8 8.8
25-29 2,533 1,496 1,037 10.5 11.7 9.1
30-34 2,052 1,165 887 8.5 9.1 7.8
35-39 1,180 586 594 4.9 4.6 5.2
40-44 751 390 361 3.1 3.0 3.2
45-49 624 280 344 2.6 2.2 3.0
50-54 722 324 398 3.0 2.5 3.5
55-59 521 236 285 2.2 1.8 2.5
60-64 367 159 208 1.5 1.2 1.8
65-69 184 71 113 0.8 0.6 1.0
70-74 206 81 125 0.9 0.6 1.1
75-79 110 55 55 0.5 0.4 0.5
80-84 80 31 49 0.3 0.2 0.4
85+ 76 37 39 0.3 0.3 0.3 Source: Rwanda 4
th Population and Housing Census, 2012 (NISR)

Fourth Population and Housing Census, Rwanda, 2012 District Profile:Rutsiro
65
Gihango Sector
Five-year age groups
Count %
Both sexes
Male Female Both sexes
Male Female
Total 23,166 11,004 12,162 100,0 100,0 100,0
0-4
3,427
1,749
1,678 14,8 15,9 13,8
5-9
3,484
1,705
1,779 15,0 15,5 14,6
10-14
2,834
1,371
1,463 12,2 12,5 12,0
15-19
2,531
1,253
1,278 10,9 11,4 10,5
20-24
2,282
1,176
1,106 9,9 10,7 9,1
25-29
2,065
1,002
1,063 8,9 9,1 8,7
30-34
1,691
786
905 7,3 7,1 7,4
35-39
1,130
496
634 4,9 4,5 5,2
40-44
812
342
470 3,5 3,1 3,9
45-49
633
265
368 2,7 2,4 3,0
50-54
685
268
417 3,0 2,4 3,4
55-59
489
191
298 2,1 1,7 2,5
60-64
352
140
212 1,5 1,3 1,7
65-69
223
70
153 1,0 0,6 1,3
70-74
210
74
136 0,9 0,7 1,1
75-79
149
56
93 0,6 0,5 0,8
80-84
97
32
65 0,4 0,3 0,5
85+
72
28
44 0,3 0,3 0,4
Source: Rwanda 4th Population and Housing Census, 2012 (NISR)
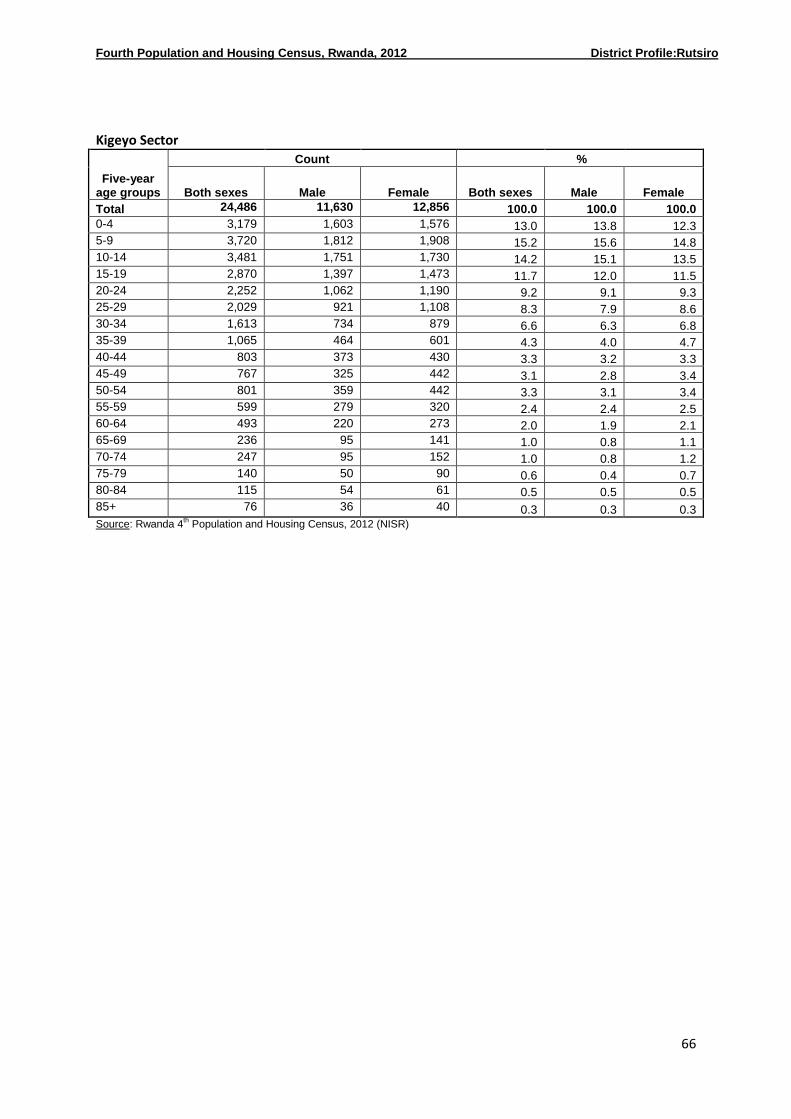
Fourth Population and Housing Census, Rwanda, 2012 District Profile:Rutsiro
66
Kigeyo Sector
Five-year age groups
Count %
Both sexes Male Female Both sexes Male Female
Total 24,486 11,630 12,856 100.0 100.0 100.0
0-4 3,179 1,603 1,576 13.0 13.8 12.3
5-9 3,720 1,812 1,908 15.2 15.6 14.8
10-14 3,481 1,751 1,730 14.2 15.1 13.5
15-19 2,870 1,397 1,473 11.7 12.0 11.5
20-24 2,252 1,062 1,190 9.2 9.1 9.3
25-29 2,029 921 1,108 8.3 7.9 8.6
30-34 1,613 734 879 6.6 6.3 6.8
35-39 1,065 464 601 4.3 4.0 4.7
40-44 803 373 430 3.3 3.2 3.3
45-49 767 325 442 3.1 2.8 3.4
50-54 801 359 442 3.3 3.1 3.4
55-59 599 279 320 2.4 2.4 2.5
60-64 493 220 273 2.0 1.9 2.1
65-69 236 95 141 1.0 0.8 1.1
70-74 247 95 152 1.0 0.8 1.2
75-79 140 50 90 0.6 0.4 0.7
80-84 115 54 61 0.5 0.5 0.5
85+ 76 36 40 0.3 0.3 0.3 Source: Rwanda 4
th Population and Housing Census, 2012 (NISR)

Fourth Population and Housing Census, Rwanda, 2012 District Profile:Rutsiro
67
Kivumu Sector
Five-year age groups
Count %
Both sexes Male Female Both sexes Male Female
Total 32,961 15,583 17,378 100.0 100.0 100.0
0-4 5,031 2,397 2,634 15.3 15.4 15.2
5-9 5,079 2,522 2,557 15.4 16.2 14.7
10-14 4,529 2,258 2,271 13.7 14.5 13.1
15-19 3,635 1,810 1,825 11.0 11.6 10.5
20-24 3,038 1,461 1,577 9.2 9.4 9.1
25-29 2,659 1,175 1,484 8.1 7.5 8.5
30-34 2,128 951 1,177 6.5 6.1 6.8
35-39 1,322 573 749 4.0 3.7 4.3
40-44 1,156 535 621 3.5 3.4 3.6
45-49 994 451 543 3.0 2.9 3.1
50-54 1,077 476 601 3.3 3.1 3.5
55-59 764 351 413 2.3 2.3 2.4
60-64 562 224 338 1.7 1.4 1.9
65-69 337 138 199 1.0 0.9 1.1
70-74 244 105 139 0.7 0.7 0.8
75-79 182 70 112 0.6 0.4 0.6
80-84 114 46 68 0.3 0.3 0.4
85+ 110 40 70 0.3 0.3 0.4 Source: Rwanda 4
th Population and Housing Census, 2012 (NISR)

Fourth Population and Housing Census, Rwanda, 2012 District Profile:Rutsiro
68
Manihira Sector
Five-year age groups
Count %
Both sexes Male Female Both sexes Male Female
Total 16,098 7,534 8,564 100.0 100.0 100.0
0-4 2,434 1,209 1,225 15.1 16.0 14.3
5-9 2,620 1,262 1,358 16.3 16.8 15.9
10-14 2,210 1,098 1,112 13.7 14.6 13.0
15-19 1,767 878 889 11.0 11.7 10.4
20-24 1,577 743 834 9.8 9.9 9.7
25-29 1,416 668 748 8.8 8.9 8.7
30-34 1,054 497 557 6.5 6.6 6.5
35-39 698 295 403 4.3 3.9 4.7
40-44 521 198 323 3.2 2.6 3.8
45-49 388 152 236 2.4 2.0 2.8
50-54 459 172 287 2.9 2.3 3.4
55-59 282 101 181 1.8 1.3 2.1
60-64 193 86 107 1.2 1.1 1.2
65-69 152 58 94 0.9 0.8 1.1
70-74 145 49 96 0.9 0.7 1.1
75-79 65 22 43 0.4 0.3 0.5
80-84 65 23 42 0.4 0.3 0.5
85+ 52 23 29 0.3 0.3 0.3 Source: Rwanda 4
th Population and Housing Census, 2012 (NISR)

Fourth Population and Housing Census, Rwanda, 2012 District Profile:Rutsiro
69
Mukura Sector
Five-year age groups
Count %
Both sexes Male Female Both sexes Male Female
Total 33,440 15,510 17,930 100.0 100.0 100.0
0-4 5,201 2,636 2,565 15.6 17.0 14.3
5-9 5,282 2,586 2,696 15.8 16.7 15.0
10-14 4,529 2,202 2,327 13.5 14.2 13.0
15-19 3,670 1,781 1,889 11.0 11.5 10.5
20-24 2,985 1,397 1,588 8.9 9.0 8.9
25-29 2,558 1,165 1,393 7.6 7.5 7.8
30-34 2,125 949 1,176 6.4 6.1 6.6
35-39 1,546 616 930 4.6 4.0 5.2
40-44 1,190 495 695 3.6 3.2 3.9
45-49 830 327 503 2.5 2.1 2.8
50-54 1,125 452 673 3.4 2.9 3.8
55-59 808 305 503 2.4 2.0 2.8
60-64 537 219 318 1.6 1.4 1.8
65-69 316 120 196 0.9 0.8 1.1
70-74 270 73 197 0.8 0.5 1.1
75-79 161 55 106 0.5 0.4 0.6
80-84 141 56 85 0.4 0.4 0.5
85+ 166 76 90 0.5 0.5 0.5 Source: Rwanda 4
th Population and Housing Census, 2012 (NISR)

Fourth Population and Housing Census, Rwanda, 2012 District Profile:Rutsiro
70
Murunda Sector
Five-year age groups
Count %
Both sexes Male Female Both sexes Male Female
Total 18,478 8,738 9,740 100.0 100.0 100.0
0-4 2,992 1,502 1,490 16.2 17.2 15.3
5-9 2,893 1,496 1,397 15.7 17.1 14.3
10-14 2,392 1,193 1,199 12.9 13.7 12.3
15-19 2,127 1,053 1,074 11.5 12.1 11.0
20-24 1,552 721 831 8.4 8.3 8.5
25-29 1,421 631 790 7.7 7.2 8.1
30-34 1,178 507 671 6.4 5.8 6.9
35-39 890 376 514 4.8 4.3 5.3
40-44 707 277 430 3.8 3.2 4.4
45-49 533 233 300 2.9 2.7 3.1
50-54 532 230 302 2.9 2.6 3.1
55-59 394 161 233 2.1 1.8 2.4
60-64 290 123 167 1.6 1.4 1.7
65-69 185 78 107 1.0 0.9 1.1
70-74 155 72 83 0.8 0.8 0.9
75-79 95 30 65 0.5 0.3 0.7
80-84 92 38 54 0.5 0.4 0.6
85+ 50 17 33 0.3 0.2 0.3 Source: Rwanda 4
th Population and Housing Census, 2012 (NISR)

Fourth Population and Housing Census, Rwanda, 2012 District Profile:Rutsiro
71
Musasa Sector
Five-year age groups
Count %
Both sexes Male Female Both sexes Male Female
Total 22,805 10,873 11,932 100.0 100.0 100.0
0-4 3,027 1,532 1,495 13.3 14.1 12.5
5-9 3,641 1,822 1,819 16.0 16.8 15.2
10-14 2,928 1,420 1,508 12.8 13.1 12.6
15-19 2,414 1,222 1,192 10.6 11.2 10.0
20-24 2,049 995 1,054 9.0 9.2 8.8
25-29 1,948 866 1,082 8.5 8.0 9.1
30-34 1,753 868 885 7.7 8.0 7.4
35-39 1,084 470 614 4.8 4.3 5.1
40-44 918 411 507 4.0 3.8 4.2
45-49 703 320 383 3.1 2.9 3.2
50-54 719 284 435 3.2 2.6 3.6
55-59 580 251 329 2.5 2.3 2.8
60-64 385 173 212 1.7 1.6 1.8
65-69 211 85 126 0.9 0.8 1.1
70-74 211 66 145 0.9 0.6 1.2
75-79 109 44 65 0.5 0.4 0.5
80-84 73 23 50 0.3 0.2 0.4
85+ 52 21 31 0.2 0.2 0.3 Source: Rwanda 4
th Population and Housing Census, 2012 (NISR)

Fourth Population and Housing Census, Rwanda, 2012 District Profile:Rutsiro
72
Mushonyi Sector
Five-year age groups
Count %
Both sexes Male Female Both sexes Male Female
Total 24,038 11,384 12,654 100.0 100.0 100.0
0-4 2,853 1,442 1,411 11.9 12.7 11.2
5-9 3,801 1,849 1,952 15.8 16.2 15.4
10-14 3,441 1,699 1,742 14.3 14.9 13.8
15-19 2,716 1,359 1,357 11.3 11.9 10.7
20-24 1,941 910 1,031 8.1 8.0 8.1
25-29 1,883 800 1,083 7.8 7.0 8.6
30-34 1,684 767 917 7.0 6.7 7.2
35-39 1,127 490 637 4.7 4.3 5.0
40-44 935 440 495 3.9 3.9 3.9
45-49 780 355 425 3.2 3.1 3.4
50-54 840 387 453 3.5 3.4 3.6
55-59 700 321 379 2.9 2.8 3.0
60-64 484 218 266 2.0 1.9 2.1
65-69 244 111 133 1.0 1.0 1.1
70-74 302 99 203 1.3 0.9 1.6
75-79 150 57 93 0.6 0.5 0.7
80-84 105 55 50 0.4 0.5 0.4
85+ 52 25 27 0.2 0.2 0.2 Source: Rwanda 4
th Population and Housing Census, 2012 (NISR)

Fourth Population and Housing Census, Rwanda, 2012 District Profile:Rutsiro
73
Mushubati Sector
Five-year age groups
Count %
Both sexes Male Female Both sexes Male Female
Total 25,822 12,132 13,690 100.0 100.0 100.0
0-4 3,934 1,974 1,960 15.2 16.3 14.3
5-9 4,126 2,074 2,052 16.0 17.1 15.0
10-14 3,358 1,617 1,741 13.0 13.3 12.7
15-19 2,663 1,332 1,331 10.3 11.0 9.7
20-24 2,281 1,074 1,207 8.8 8.9 8.8
25-29 2,138 969 1,169 8.3 8.0 8.5
30-34 1,908 910 998 7.4 7.5 7.3
35-39 1,204 528 676 4.7 4.4 4.9
40-44 877 350 527 3.4 2.9 3.8
45-49 697 290 407 2.7 2.4 3.0
50-54 848 324 524 3.3 2.7 3.8
55-59 558 235 323 2.2 1.9 2.4
60-64 363 139 224 1.4 1.1 1.6
65-69 246 72 174 1.0 0.6 1.3
70-74 242 90 152 0.9 0.7 1.1
75-79 148 51 97 0.6 0.4 0.7
80-84 123 55 68 0.5 0.5 0.5
85+ 108 48 60 0.4 0.4 0.4 Source: Rwanda 4
th Population and Housing Census, 2012 (NISR)

Fourth Population and Housing Census, Rwanda, 2012 District Profile:Rutsiro
74
Nyabirasi Sector
Five-year age groups
Count %
Both sexes Male Female Both sexes Male Female
Total 28,971 13,510 15,461 100.0 100.0 100.0
0-4 4,890 2,441 2,449 16.9 18.1 15.8
5-9 4,570 2,251 2,319 15.8 16.7 15.0
10-14 3,701 1,813 1,888 12.8 13.4 12.2
15-19 3,220 1,514 1,706 11.1 11.2 11.0
20-24 2,919 1,329 1,590 10.1 9.8 10.3
25-29 2,340 1,059 1,281 8.1 7.8 8.3
30-34 1,725 780 945 6.0 5.8 6.1
35-39 1,120 482 638 3.9 3.6 4.1
40-44 917 379 538 3.2 2.8 3.5
45-49 859 369 490 3.0 2.7 3.2
50-54 886 361 525 3.1 2.7 3.4
55-59 561 233 328 1.9 1.7 2.1
60-64 423 174 249 1.5 1.3 1.6
65-69 289 113 176 1.0 0.8 1.1
70-74 209 86 123 0.7 0.6 0.8
75-79 127 56 71 0.4 0.4 0.5
80-84 112 34 78 0.4 0.3 0.5
85+ 103 36 67 0.4 0.3 0.4 Source: Rwanda 4
th Population and Housing Census, 2012 (NISR)

Fourth Population and Housing Census, Rwanda, 2012 District Profile:Rutsiro
75
Ruhango Sector
Five-year age groups
Count %
Both sexes Male Female Both sexes Male Female
Total 28,589 13,322 15,267 100.0 100.0 100.0
0-4 4,336 2,163 2,173 15.2 16.2 14.2
5-9 4,501 2,256 2,245 15.7 16.9 14.7
10-14 3,851 1,884 1,967 13.5 14.1 12.9
15-19 3,188 1,558 1,630 11.2 11.7 10.7
20-24 2,462 1,080 1,382 8.6 8.1 9.1
25-29 2,188 961 1,227 7.7 7.2 8.0
30-34 1,819 781 1,038 6.4 5.9 6.8
35-39 1,262 499 763 4.4 3.7 5.0
40-44 1,066 469 597 3.7 3.5 3.9
45-49 903 394 509 3.2 3.0 3.3
50-54 897 382 515 3.1 2.9 3.4
55-59 639 269 370 2.2 2.0 2.4
60-64 546 237 309 1.9 1.8 2.0
65-69 325 148 177 1.1 1.1 1.2
70-74 272 107 165 1.0 0.8 1.1
75-79 149 74 75 0.5 0.6 0.5
80-84 115 39 76 0.4 0.3 0.5
85+ 70 21 49 0.2 0.2 0.3 Source: Rwanda 4
th Population and Housing Census, 2012 (NISR)

Fourth Population and Housing Census, Rwanda, 2012 District Profile:Rutsiro
76
Rusebeya Sector
Five-year age groups
Count %
Both sexes Male Female Both sexes Male Female
Total 21,634 10,022 11,612 100.0 100.0 100.0
0-4 3,398 1,681 1,717 15.7 16.8 14.8
5-9 3,568 1,746 1,822 16.5 17.4 15.7
10-14 2,877 1,395 1,482 13.3 13.9 12.8
15-19 2,358 1,146 1,212 10.9 11.4 10.4
20-24 2,119 980 1,139 9.8 9.8 9.8
25-29 1,941 926 1,015 9.0 9.2 8.7
30-34 1,381 621 760 6.4 6.2 6.5
35-39 834 337 497 3.9 3.4 4.3
40-44 693 273 420 3.2 2.7 3.6
45-49 580 223 357 2.7 2.2 3.1
50-54 625 237 388 2.9 2.4 3.3
55-59 416 148 268 1.9 1.5 2.3
60-64 273 105 168 1.3 1.0 1.4
65-69 160 54 106 0.7 0.5 0.9
70-74 162 57 105 0.7 0.6 0.9
75-79 94 37 57 0.4 0.4 0.5
80-84 90 31 59 0.4 0.3 0.5
85+ 65 25 40 0.3 0.2 0.3 Source: Rwanda 4
th Population and Housing Census, 2012 (NISR)

Fourth Population and Housing Census, Rwanda, 2012 District Profile:Rutsiro
77
Table 45: Distribution (%) of the resident population of Rutsiro District aged 12 years and above by
Marital status, Sector and Sex [Male,]
Sectors Total Neve
r
marr
ied
Marr
ied
Sep
era
te
d
Wid
ow
ed
Div
orc
ed
No
t
Sta
ted
Counts
Rwanda 3 284 937 1 655 398 1 557 403 6 916 41 028 23 326 866
Western Province 733 577 362 731 357 230 1 063 8 672 3 648 233
Rutsiro District 96 023 46 903 47 435 114 1 132 423 16
Boneza 8 700 4 788 3 743 19 104 46 0
Gihango 6 993 3 747 3 136 12 65 30 3
Kigeyo 7 512 3 752 3 634 6 87 31 2
Kivumu 9 686 4 765 4 739 8 129 44 1
Manihira 4 602 2 100 2 435 6 41 16 4
Mukura 9 350 4 477 4 741 9 96 25 2
Murunda 5 223 2 485 2 632 4 82 20 0
Musasa 6 909 3 300 3 472 10 79 48 0
Mushonyi 7 403 3 533 3 719 4 108 37 2
Mushubati 7 423 3 639 3 628 17 98 41 0
Nyabirasi 8 073 3 632 4 305 7 100 29 0
Ruhango 8 145 4 020 3 999 3 93 28 2
Rusebeya 6 004 2 665 3 252 9 50 28 0
%
Rwanda 100 50,4 47,4 0,2 1,2 0,7 0,0
Western Province 100 49,4 48,7 0,1 1,2 0,5 0,0
Rutsiro District 100 48,8 49,4 0,1 1,2 0,4 0,0
Boneza 100 55,0 43,0 0,2 1,2 0,5 0,0
Gihango 100 53,6 44,8 0,2 0,9 0,4 0,0
Kigeyo 100 49,9 48,4 0,1 1,2 0,4 0,0
Kivumu 100 49,2 48,9 0,1 1,3 0,5 0,0
Manihira 100 45,6 52,9 0,1 0,9 0,3 0,1
Mukura 100 47,9 50,7 0,1 1,0 0,3 0,0
Murunda 100 47,6 50,4 0,1 1,6 0,4 0,0
Musasa 100 47,8 50,3 0,1 1,1 0,7 0,0
Mushonyi 100 47,7 50,2 0,1 1,5 0,5 0,0
Mushubati 100 49,0 48,9 0,2 1,3 0,6 0,0
Nyabirasi 100 45,0 53,3 0,1 1,2 0,4 0,0
Ruhango 100 49,4 49,1 0,0 1,1 0,3 0,0
Rusebeya 100 44,4 54,2 0,1 0,8 0,5 0,0 Source: Rwanda 4
th Population and Housing Census, 2012 (NISR)
Table 46: Distribution (%) of the resident population of Rutsiro District aged 12 years and above by
Marital status, Sector and Sex [Female,]
Sectors Total Never married Married Seperated Widowed Divorced Not Stated
Counts
Rwanda 3 652 741 1 499 069 1 641 203 28 625 399 117 82 142 2 585
Western Province 861 933 358 533 386 810 5 677 94 787 15 443 683
Rutsiro District 111 853 45 294 52 856 615 11 060 1 918 110
Boneza 7 344 2 818 3 615 42 718 145 6

Fourth Population and Housing Census, Rwanda, 2012 District Profile:Rutsiro
78
Gihango 8 121 3 464 3 570 29 820 224 14
Kigeyo 8 672 3 753 3 941 43 771 153 11
Kivumu 11 226 4 660 5 215 59 1 076 202 14
Manihira 5 527 2 106 2 872 33 427 85 4
Mukura 11 727 4 736 5 655 81 1 114 126 15
Murunda 6 351 2 508 3 088 23 596 129 7
Musasa 7 987 3 091 3 809 40 903 140 4
Mushonyi 8 599 3 646 3 944 43 814 147 5
Mushubati 8 928 3 621 4 172 43 959 127 6
Nyabirasi 9 884 3 774 4 796 68 1 075 165 6
Ruhango 10 038 4 348 4 505 47 947 180 11
Rusebeya 7 449 2 769 3 674 64 840 95 7
%
Rwanda 100 41,0 44,9 0,8 10,9 2,2 0,1
Western Province 100 41,6 44,9 0,7 11,0 1,8 0,1
Rutsiro District 100 40,5 47,3 0,5 9,9 1,7 0,1
Boneza 100 38,4 49,2 0,6 9,8 2,0 0,1
Gihango 100 42,7 44,0 0,4 10,1 2,8 0,2
Kigeyo 100 43,3 45,4 0,5 8,9 1,8 0,1
Kivumu 100 41,5 46,5 0,5 9,6 1,8 0,1
Manihira 100 38,1 52,0 0,6 7,7 1,5 0,1
Mukura 100 40,4 48,2 0,7 9,5 1,1 0,1
Murunda 100 39,5 48,6 0,4 9,4 2,0 0,1
Musasa 100 38,7 47,7 0,5 11,3 1,8 0,1
Mushonyi 100 42,4 45,9 0,5 9,5 1,7 0,1
Mushubati 100 40,6 46,7 0,5 10,7 1,4 0,1
Nyabirasi 100 38,2 48,5 0,7 10,9 1,7 0,1
Ruhango 100 43,3 44,9 0,5 9,4 1,8 0,1
Rusebeya 100 37,2 49,3 0,9 11,3 1,3 0,1 Source: Rwanda 4
th Population and Housing Census, 2012 (NISR)

Fourth Population and Housing Census, Rwanda, 2012 District Profile:Rutsiro
79
Table 47: Distribution (%) of the resident population of Rutsiro District aged 12 years and above by
Marital status, Age groups and Sex [Male, Female]
Age group Total population aged 12+ Total
Never married
Married Separated Widowed Divorced Not Stated
Male
Rwanda 3,284,937 100.0 50.4 47.4 0.2 0.7 1.2 0.0
Western Province 733,577 100.0 49.5 48.7 0.1 0.5 1.2 0.0
Rutsiro District 96,023 100.0 48.8 49.4 0.1 1.2 0.4 0.0
12-14 12,287 100.0 99.6 0.4 0.0 0.0 0.0 0.0
15-19 17,660 100.0 98.7 1.3 0.0 0.0 0.0 0.0
20-24 14,565 100.0 75.3 24.4 0.1 0.1 0.1 0.0
25-29 12,639 100.0 31.9 67.4 0.1 0.1 0.4 0.0
30-34 10,316 100.0 11.8 87.3 0.2 0.1 0.5 0.0
35-39 6,212 100.0 5.5 92.9 0.2 0.6 0.9 0.0
40-44 4,932 100.0 4.1 93.6 0.2 1.1 1.1 0.0
45-49 3,984 100.0 3.7 93.2 0.2 1.9 1.0 0.1
50-54 4,256 100.0 2.9 93.0 0.2 3.0 0.8 0.0
55-59 3,081 100.0 2.5 91.8 0.3 4.3 1.1 0.0
60-64 2,217 100.0 1.7 90.0 0.4 6.4 1.5 0.0
65-69 1,213 100.0 2.6 87.6 0.2 8.6 1.1 0.1
70-74 1,054 100.0 2.4 85.3 0.2 11.1 1.0 0.0
75-79 657 100.0 2.7 81.7 0.2 14.6 0.6 0.2
80-84 517 100.0 2.9 75.4 0.4 19.0 2.3 0.0
85+ 433 100.0 3.5 71.4 0.0 24.0 1.2 0.0
Female
Rwanda 3,652,741 100.0 41.1 44.9 0.8 10.9 2.2 0.1
Western Province 861,933 100.0 41.6 44.9 0.7 11.0 1.8 0.1
Rutsiro District 111,853 100.0 40.5 47.3 0.5 9.9 1.7 0.1
12-14 12,728 100.0 99.3 0.6 0.0 0.0 0.0 0.0
15-19 17,945 100.0 96.6 3.0 0.1 0.1 0.1 0.0
20-24 15,531 100.0 60.5 37.8 0.5 0.2 0.9 0.0
25-29 14,480 100.0 22.4 74.0 1.0 0.7 1.9 0.0
30-34 11,795 100.0 10.8 82.4 1.2 2.8 2.8 0.1
35-39 8,250 100.0 6.9 80.7 1.0 7.7 3.6 0.1
40-44 6,414 100.0 5.1 75.2 0.8 15.2 3.6 0.2
45-49 5,307 100.0 3.6 72.1 0.6 20.1 3.3 0.2
50-54 5,960 100.0 2.2 67.2 0.5 27.2 2.8 0.2
55-59 4,230 100.0 1.5 62.9 0.4 32.1 2.9 0.2
60-64 3,051 100.0 1.1 56.2 0.3 39.9 2.2 0.3
65-69 1,895 100.0 0.9 49.0 0.2 47.2 2.4 0.3
70-74 1,821 100.0 1.3 38.3 0.1 58.4 1.5 0.4
75-79 1,022 100.0 1.8 30.3 0.2 65.6 1.6 0.6
80-84 805 100.0 1.9 23.5 0.2 72.9 0.9 0.6
85+ 619 100.0 1.9 20.4 0.0 76.9 0.2 0.6 Source: Rwanda 4
th Population and Housing Census, 2012 (NISR)

Fourth Population and Housing Census, Rwanda, 2012 District Profile:Rutsiro
80
Table 48: Distribution (count and %) of the school-age population of Rutsiro District by Sector and by
School attendance status and Sex (Male)
Sectors
Count %
Total Currently attending
No longer attending
Never attended Total
Currently attending
No longer attending
Never attended
Pre-school-age children (3-6 years)
Rwanda 637,995 185,075 3,491 449,429 100.0 29.0 0.6 70.4
Western Province 153,215 35,912 478 116,825 100.0 23.4 0.3 76.2
Rutsiro District 19,847 3,342 47 16,458 100.0 16.8 0.2 82.9
Boneza 1,482 445 10 1,027 100.0 30.0 0.7 69.3
Gihango 1,389 292 5 1,092 100.0 21.0 0.4 78.6
Kigeyo 1,379 191 1 1,187 100.0 13.9 0.1 86.1
Kivumu 2,030 519 2 1,509 100.0 25.6 0.1 74.3
Manihira 979 131 1 847 100.0 13.4 0.1 86.5
Mukura 2,078 214 4 1,860 100.0 10.3 0.2 89.5
Murunda 1,161 128 3 1,030 100.0 11.0 0.3 88.7
Musasa 1,369 254 3 1,112 100.0 18.6 0.2 81.2
Mushonyi 1,331 158 1 1,172 100.0 11.9 0.1 88.1
Mushubati 1,584 327 8 1,249 100.0 20.6 0.5 78.9
Nyabirasi 1,887 228 6 1,653 100.0 12.1 0.3 87.6
Ruhango 1,833 295 1 1,537 100.0 16.1 0.1 83.9
Rusebeya 1,345 160 2 1,183 100.0 11.9 0.1 88.0
Primary school-age children (7-12 years)
Rwanda 847,951 778,099 8,781 61,071 100.0 91.8 1.0 7.2
Western Province 210,126 190,768 1,860 17,498 100.0 90.8 0.9 8.3
Rutsiro District 29,048 26,012 253 2,783 100.0 89.5 0.9 9.6
Boneza 1,969 1,861 15 93 100.0 94.5 0.8 4.7
Gihango 1,919 1,805 22 92 100.0 94.1 1.1 4.8
Kigeyo 2,233 2,025 17 191 100.0 90.7 0.8 8.6
Kivumu 3,091 2,835 31 225 100.0 91.7 1.0 7.3
Manihira 1,473 1,308 10 155 100.0 88.8 0.7 10.5
Mukura 3,065 2,627 46 392 100.0 85.7 1.5 12.8
Murunda 1,698 1,459 22 217 100.0 85.9 1.3 12.8
Musasa 2,017 1,842 18 157 100.0 91.3 0.9 7.8
Mushonyi 2,196 2,018 7 171 100.0 91.9 0.3 7.8
Mushubati 2,342 2,192 13 137 100.0 93.6 0.6 5.8
Nyabirasi 2,553 2,129 10 414 100.0 83.4 0.4 16.2
Ruhango 2,533 2,219 25 289 100.0 87.6 1.0 11.4
Rusebeya 1,959 1,692 17 250 100.0 86.4 0.9 12.8
Secondary school-age children (13-18 years)
Rwanda 671,825 499,738 138,801 33,286 100.0 74.4 20.7 5.0
Western Province 161,289 121,898 29,622 9,769 100.0 75.6 18.4 6.1
Rutsiro District 21,768 15,723 4,511 1,534 100.0 72.2 20.7 7.0
Boneza 1,532 1,136 299 97 100.0 74.2 19.5 6.3
Gihango 1,497 1,060 371 66 100.0 70.8 24.8 4.4
Kigeyo 1,765 1,400 294 71 100.0 79.3 16.7 4.0
Kivumu 2,253 1,811 321 121 100.0 80.4 14.2 5.4
Manihira 1,120 833 221 66 100.0 74.4 19.7 5.9
Mukura 2,192 1,463 550 179 100.0 66.7 25.1 8.2

Fourth Population and Housing Census, Rwanda, 2012 District Profile:Rutsiro
81
Sectors
Count %
Total Currently attending
No longer attending
Never attended Total
Currently attending
No longer attending
Never attended
Murunda 1,255 766 350 139 100.0 61.0 27.9 11.1
Musasa 1,494 1,052 352 90 100.0 70.4 23.6 6.0
Mushonyi 1,750 1,319 367 64 100.0 75.4 21.0 3.7
Mushubati 1,654 1,247 316 91 100.0 75.4 19.1 5.5
Nyabirasi 1,851 1,269 296 286 100.0 68.6 16.0 15.5
Ruhango 1,970 1,346 461 163 100.0 68.3 23.4 8.3
Rusebeya 1,435 1,021 313 101 100.0 71.1 21.8 7.0 Source: Rwanda 4
th Population and Housing Census, 2012 (NISR)
Table 49: Distribution (count and %) of the school-age population of Rutsiro District by Sector and by
School attendance status and Sex (Female)
Sectors
Count %
Total Currently attending
No longer attending
Never attended Total
Currently attending
No longer attending
Never attended
Pre-school-age children (3-6 years)
Rwanda 642,862 197,189 3,613 442,060 100.0 30.7 0.6 68.8
Western Province 154,063 38,122 462 115,479 100.0 24.7 0.3 75.0
Rutsiro District 20,284 3,613 33 16,638 100.0 17.8 0.2 82.0
Boneza 1,476 457 2 1,017 100.0 31.0 0.1 68.9
Gihango 1,451 354 6 1,091 100.0 24.4 0.4 75.2
Kigeyo 1,429 215 0 1,214 100.0 15.0 0.0 85.0
Kivumu 2,190 561 6 1,623 100.0 25.6 0.3 74.1
Manihira 1,025 137 0 888 100.0 13.4 0.0 86.6
Mukura 2,117 264 3 1,850 100.0 12.5 0.1 87.4
Murunda 1,163 120 1 1,042 100.0 10.3 0.1 89.6
Musasa 1,375 281 5 1,089 100.0 20.4 0.4 79.2
Mushonyi 1,400 205 2 1,193 100.0 14.6 0.1 85.2
Mushubati 1,598 300 3 1,295 100.0 18.8 0.2 81.0
Nyabirasi 1,938 247 4 1,687 100.0 12.7 0.2 87.0
Ruhango 1,748 307 0 1,441 100.0 17.6 0.0 82.4
Rusebeya 1,374 165 1 1,208 100.0 12.0 0.1 87.9
Primary school-age children (7-12 years)
Rwanda 864,508 805,864 7,036 51,608 100.0 93.2 0.8 6.0
Western Province 215,734 199,001 1,496 15,237 100.0 92.2 0.7 7.1
Rutsiro District 29,832 27,347 164 2,321 100.0 17.8 0.2 82.0
Boneza 1,991 1,905 13 73 100.0 31.0 0.1 68.9
Gihango 1,993 1,887 13 93 100.0 24.4 0.4 75.2
Kigeyo 2,287 2,122 7 158 100.0 15.0 0.0 85.0
Kivumu 3,120 2,886 19 215 100.0 25.6 0.3 74.1
Manihira 1,546 1,404 11 131 100.0 13.4 0.0 86.6
Mukura 3,120 2,801 14 305 100.0 12.5 0.1 87.4
Murunda 1,607 1,407 15 185 100.0 10.3 0.1 89.6
Musasa 2,063 1,938 14 111 100.0 20.4 0.4 79.2
Mushonyi 2,264 2,114 14 136 100.0 14.6 0.1 85.2
Mushubati 2,415 2,317 6 92 100.0 18.8 0.2 81.0
Nyabirasi 2,679 2,310 13 356 100.0 12.7 0.2 87.0
Ruhango 2,647 2,373 12 262 100.0 17.6 0.0 82.4
Rusebeya 2,100 1,883 13 204 100.0 12.0 0.1 87.9
Secondary school-age children (13-18 years)

Fourth Population and Housing Census, Rwanda, 2012 District Profile:Rutsiro
82
Sectors
Count %
Total Currently attending
No longer attending
Never attended Total
Currently attending
No longer attending
Never attended
Rwanda 693,946 516,716 148,694 28,536 100.0 74.5 21.4 4.1
Western Province 161,289 121,898 29,622 9,769 100.0 75.6 18.4 6.1
Rutsiro District 22,135 16,019 4,796 1,320 100.0 72.4 21.7 6.0
Boneza 1,326 1,090 205 31 100.0 82.2 15.5 2.3
Gihango 1,546 1,139 368 39 100.0 73.7 23.8 2.5
Kigeyo 1,858 1,405 369 84 100.0 75.6 19.9 4.5
Kivumu 2,235 1,673 425 137 100.0 74.9 19.0 6.1
Manihira 1,111 819 243 49 100.0 73.7 21.9 4.4
Mukura 2,374 1,561 657 156 100.0 65.8 27.7 6.6
Murunda 1,269 801 378 90 100.0 63.1 29.8 7.1
Musasa 1,480 1,071 362 47 100.0 72.4 24.5 3.2
Mushonyi 1,785 1,366 368 51 100.0 76.5 20.6 2.9
Mushubati 1,693 1,356 301 36 100.0 80.1 17.8 2.1
Nyabirasi 1,968 1,265 337 366 100.0 64.3 17.1 18.6
Ruhango 2,024 1,467 436 121 100.0 72.5 21.5 6.0
Rusebeya 1,466 1,006 347 113 100.0 68.6 23.7 7.7 Source: Rwanda 4
th Population and Housing Census, 2012 (NISR)

Fourth Population and Housing Census, Rwanda, 2012 District Profile:Rutsiro
83
Table 50: Distribution (%) of the resident population of Rutsiro District aged 3 years and above by
Highest level of educational attainment and Sector (Male)
Sectors
Highest level of education attained
To
tal
Ne
ve
r
att
en
de
d
Pre
-sc
ho
ol
Pri
ma
ry
Po
st-
Pri
ma
ry
Se
co
nd
ary
Un
ive
rsit
y
No
t s
tate
d
Count
Rwanda 4,616,716
1,050,073
166,311
2,682,674
36,952
524,246
112,064
44,396
Western Province 1,057,240 267,380 29,182 616,024 5,878 110,900 17,800 10,076
Rutsiro District 139,510 39,134 2,235 83,709 633 11,146 1,216 1,437
Boneza 11,808 2,650 382 7,313 54 1,177 130 102
Gihango 9,944 2,207 176 6,260 62 996 134 109
Kigeyo 10,686 2,777 112 6,507 33 972 134 151
Kivumu 14,220 3,704 438 8,396 61 1,291 143 187
Manihira 6,781 1,968 72 4,248 20 390 35 48
Mukura 13,925 4,529 109 8,124 73 866 53 171
Murunda 7,773 2,294 71 4,708 37 499 92 72
Musasa 9,935 2,703 165 6,173 37 719 76 62
Mushonyi 10,523 2,760 78 6,568 60 918 85 54
Mushubati 10,931 2,692 201 6,940 67 837 78 116
Nyabirasi 12,007 4,322 147 6,394 28 945 56 115
Ruhango 12,007 3,753 239 6,788 77 865 134 151
Rusebeya 8,970 2,775 45 5,290 24 671 66 99
%
Rwanda 100.0 22.8 3.6 58.1 0.8 11.4 2.4 1.0
Western Province
100.0 25.3 2.8 58.3 0.6 10.5 1.7 1.0
Rutsiro District
100.0 28.1 1.6 60.0 0.5 8.0 0.9 1.0
Boneza 100.0 22.4 3.2 61.9 0.5 10.0 1.1 0.9
Gihango 100.0 22.2 1.8 63.0 0.6 10.0 1.3 1.1
Kigeyo 100.0 26.0 1.0 60.9 0.3 9.1 1.3 1.4
Kivumu 100.0 26.0 3.1 59.0 0.4 9.1 1.0 1.3
Manihira 100.0 29.0 1.1 62.6 0.3 5.8 0.5 0.7
Mukura 100.0 32.5 0.8 58.3 0.5 6.2 0.4 1.2
Murunda 100.0 29.5 0.9 60.6 0.5 6.4 1.2 0.9
Musasa 100.0 27.2 1.7 62.1 0.4 7.2 0.8 0.6
Mushonyi 100.0 26.2 0.7 62.4 0.6 8.7 0.8 0.5
Mushubati 100.0 24.6 1.8 63.5 0.6 7.7 0.7 1.1
Nyabirasi 100.0 36.0 1.2 53.3 0.2 7.9 0.5 1.0
Ruhango 100.0 31.3 2.0 56.5 0.6 7.2 1.1 1.3
Rusebeya 100.0 30.9 0.5 59.0 0.3 7.5 0.7 1.1
Source: Rwanda 4th Population and Housing Census, 2012 (NISR)

Fourth Population and Housing Census, Rwanda, 2012 District Profile:Rutsiro
84
Table 51: Distribution (%) of the resident population of Rutsiro District aged 3 years and above by
Highest level of educational attainment and Sector (Female)
Sectors Highest level of education attained
To
tal
Ne
ve
r
att
en
de
d
Pre
-
sc
ho
ol
Pri
ma
ry
Po
st-
Pri
ma
ry
Se
co
nd
ar
y
Un
ive
rsit
y
No
t s
tate
d
Count
Rwanda 5,001,594
1,397,566
171,388
2,766,235
35,048
510,488
73,547
47,322
Western Province 1,190,723 378,559 30,028 650,168 6,434 104,642 9,802 11,090
Rutsiro District 156,330 54,850 2,284 86,822 695 9,655 469 1,555
Boneza 10,463 2,754 370 6,323 69 813 41 93
Gihango 11,151 2,999 203 6,751 79 915 88 116
Kigeyo 11,968 3,984 122 6,839 34 809 31 149
Kivumu 15,912 5,555 462 8,615 60 976 52 192
Manihira 7,808 2,872 70 4,465 24 315 10 52
Mukura 16,367 6,691 142 8,538 54 763 19 160
Murunda 8,808 3,058 59 4,995 55 528 46 67
Musasa 11,024 3,258 164 6,741 60 725 28 48
Mushonyi 11,850 3,716 90 6,920 82 925 31 86
Mushubati 12,508 3,730 180 7,461 78 870 36 153
Nyabirasi 13,980 6,722 153 6,304 22 627 18 134
Ruhango 13,943 5,095 232 7,404 61 909 59 183
Rusebeya 10,548 4,416 37 5,466 17 480 10 122
%
Rwanda 100.0 27.9 3.4 55.3 0.7 10.2 1.5 1.0
Western Province 100.0 31.8 2.5 54.6 0.5 8.8 0.8 0.9
Rutsiro District
100.0 35.1 1.5 55.5 0.4 6.2 0.3 1.0
Boneza 100.0 26.3 3.5 60.4 0.7 7.8 0.4 0.9
Gihango 100.0 26.9 1.8 60.5 0.7 8.2 0.8 1.0
Kigeyo 100.0 33.3 1.0 57.1 0.3 6.8 0.3 1.2
Kivumu 100.0 34.9 2.9 54.1 0.4 6.1 0.3 1.2
Manihira 100.0 36.8 0.9 57.2 0.3 4.0 0.1 0.7
Mukura 100.0 40.9 0.9 52.2 0.3 4.7 0.1 1.0
Murunda 100.0 34.7 0.7 56.7 0.6 6.0 0.5 0.8
Musasa 100.0 29.6 1.5 61.1 0.5 6.6 0.3 0.4
Mushonyi 100.0 31.4 0.8 58.4 0.7 7.8 0.3 0.7
Mushubati 100.0 29.8 1.4 59.6 0.6 7.0 0.3 1.2
Nyabirasi 100.0 48.1 1.1 45.1 0.2 4.5 0.1 1.0
Ruhango 100.0 36.5 1.7 53.1 0.4 6.5 0.4 1.3
Rusebeya 100.0 41.9 0.4 51.8 0.2 4.6 0.1 1.2

Fourth Population and Housing Census, Rwanda, 2012 District Profile:Rutsiro
85
Table 52: Distribution (%) of the resident population of Rutsiro District aged 16 years and above
residing in private households by Economic activity status and Sector (Both sexes )
Counts
Sector TOTAL Employed Unemployed Home worker Retired Old age Student Other
RWANDA 5 846 266 4 152 682 147 876 495 462 13 872 158 650 785 655 92069
Western Province
1 330 610 949 238 26 960 93 347 3 355 42 978 190 688 24 044
Rutsiro District
172 654 131 794 3 400 8 181 342 5 197 20 881 2 859
Boneza 11 771 9 173 99 117 29 354 1 776 223
Gihango 12 478 9 467 180 894 17 326 1 387 207
Kigeyo 13 516 10 566 135 339 13 379 1 892 192
Kivumu 17 528 13 224 273 606 29 503 2 652 241
Manihira 8 451 6 081 231 777 22 284 927 129
Mukura 17 681 12 495 737 1 785 47 573 1 707 337
Murunda 9 782 8 154 192 201 15 251 826 143
Musasa 12 687 10 494 68 173 15 323 1 438 176
Mushonyi 13 182 10 767 133 189 12 368 1 603 110
Mushubati 13 872 10 053 310 980 19 471 1 779 260
Nyabirasi 15 152 11 518 216 714 47 517 1 747 393
Ruhango 15 226 11 508 538 526 42 517 1 821 274
Rusebeya 11 328 8 294 288 880 35 331 1 326 174
%
RWANDA 100 71,0 2,5 8,5 0,2 2,7 13,4 1,6
Western Province
100 71,3 2,0 7,0 0,3 3,2 14,3 1,8
Rutsiro District
100 76,3 2,0 4,7 0,2 3,0 12,1 1,7
Boneza 100 77,9 0,8 1,0 0,2 3,0 15,1 1,9
Gihango 100 75,9 1,4 7,2 0,1 2,6 11,1 1,7
Kigeyo 100 78,2 1,0 2,5 0,1 2,8 14,0 1,4
Kivumu 100 75,4 1,6 3,5 0,2 2,9 15,1 1,4
Manihira 100 72,0 2,7 9,2 0,3 3,4 11,0 1,5
Mukura 100 70,7 4,2 10,1 0,3 3,2 9,7 1,9
Murunda 100 83,4 2,0 2,1 0,2 2,6 8,4 1,5
Musasa 100 82,7 0,5 1,4 0,1 2,5 11,3 1,4
Mushonyi 100 81,7 1,0 1,4 0,1 2,8 12,2 0,8
Mushubati 100 72,5 2,2 7,1 0,1 3,4 12,8 1,9
Nyabirasi 100 76,0 1,4 4,7 0,3 3,4 11,5 2,6
Ruhango 100 75,6 3,5 3,5 0,3 3,4 12,0 1,8
Rusebeya 100 73,2 2,5 7,8 0,3 2,9 11,7 1,5
Source: Rwanda 4th Population and Housing Census, 2012 (NISR)

Fourth Population and Housing Census, Rwanda, 2012 District Profile:Rutsiro
86
Table 53: Distribution (%) of the resident population of Rutsiro District aged 16 years and above
residing in private households by Economic activity status and Sector (Male )
Counts
Sector TOTAL Employed Unemployed Home worker Retired Old age Student Other
RWANDA 2 716 688 1 998 012 57 097 158 308 6 527 54 754 402 556 39 434
Western Province
597 886 433 284 10 690 29 137 1 519 15 007 98 287 9 962
Rutsiro District
77 359 58 867 1 356 2 902 136 1 879 11 008 1 211
Boneza 5 448 4 161 37 50 14 136 959 91
Gihango 5 542 4 254 60 343 11 116 652 106
Kigeyo 6 188 4 777 59 117 7 151 998 79
Kivumu 8 016 5 943 106 195 11 170 1 494 97
Manihira 3 771 2 746 82 292 9 100 503 39
Mukura 7 710 5 456 323 695 11 205 893 127
Murunda 4 354 3 628 70 77 5 89 416 69
Musasa 5 818 4 767 23 79 10 104 757 78
Mushonyi 5 944 4 786 59 91 5 137 810 56
Mushubati 6 221 4 604 106 302 2 170 931 106
Nyabirasi 6 690 5 064 86 224 18 178 951 169
Ruhango 6 680 4 990 228 219 23 208 891 121
Rusebeya 4 977 3 691 117 218 10 115 753 73
%
RWANDA 100 73,5 2,1 5,8 0,2 2,0 14,8 1,5
Western Province
100 72,5 1,8 4,9 0,3 2,5 16,4 1,7
Rutsiro District
100 76,1 1,8 3,8 0,2 2,4 14,2 1,6
Boneza 100 76,4 0,7 0,9 0,3 2,5 17,6 1,7
Gihango 100 76,8 1,1 6,2 0,2 2,1 11,8 1,9
Kigeyo 100 77,2 1,0 1,9 0,1 2,4 16,1 1,3
Kivumu 100 74,1 1,3 2,4 0,1 2,1 18,6 1,2
Manihira 100 72,8 2,2 7,7 0,2 2,7 13,3 1,0
Mukura 100 70,8 4,2 9,0 0,1 2,7 11,6 1,6
Murunda 100 83,3 1,6 1,8 0,1 2,0 9,6 1,6
Musasa 100 81,9 0,4 1,4 0,2 1,8 13,0 1,3
Mushonyi 100 80,5 1,0 1,5 0,1 2,3 13,6 0,9
Mushubati 100 74,0 1,7 4,9 0,0 2,7 15,0 1,7
Nyabirasi 100 75,7 1,3 3,3 0,3 2,7 14,2 2,5
Ruhango 100 74,7 3,4 3,3 0,3 3,1 13,3 1,8
Rusebeya 100 74,2 2,4 4,4 0,2 2,3 15,1 1,5
Source: Rwanda 4th Population and Housing Census, 2012 (NISR)

Fourth Population and Housing Census, Rwanda, 2012 District Profile:Rutsiro
87
Table 54: Distribution (%) of the resident population of Rutsiro District aged 16 years and above
residing in private households by Economic activity status and Sector (Femqle )
Counts
Sector TOTAL Employed Unemployed Home worker Retired Old age Student Other
RWANDA 3 129 578 2 154 670 90 779 337 154 7 345 103 896 383 099 52 635
Western Province
732 724 515 954 16 270 64 210 1 836 27 971 92 401 14 082
Rutsiro District
95 295 72 927 2 044 5 279 206 3 318 9 873 1 648
Boneza 6 323 5 012 62 67 15 218 817 132
Gihango 6 936 5 213 120 551 6 210 735 101
Kigeyo 7 328 5 789 76 222 6 228 894 113
Kivumu 9 512 7 281 167 411 18 333 1 158 144
Manihira 4 680 3 335 149 485 13 184 424 90
Mukura 9 971 7 039 414 1 090 36 368 814 210
Murunda 5 428 4 526 122 124 10 162 410 74
Musasa 6 869 5 727 45 94 5 219 681 98
Mushonyi 7 238 5 981 74 98 7 231 793 54
Mushubati 7 651 5 449 204 678 17 301 848 154
Nyabirasi 8 462 6 454 130 490 29 339 796 224
Ruhango 8 546 6 518 310 307 19 309 930 153
Rusebeya 6 351 4 603 171 662 25 216 573 101
%
RWANDA 100 68,8 2,9 10,8 0,2 3,3 12,2 1,7
Western Province
100 70,4 2,2 8,8 0,3 3,8 12,6 1,9
Rutsiro District
100 76,5 2,1 5,5 0,2 3,5 10,4 1,7
Boneza 100 79,3 1,0 1,1 0,2 3,4 12,9 2,1
Gihango 100 75,2 1,7 7,9 0,1 3,0 10,6 1,5
Kigeyo 100 79,0 1,0 3,0 0,1 3,1 12,2 1,5
Kivumu 100 76,5 1,8 4,3 0,2 3,5 12,2 1,5
Manihira 100 71,3 3,2 10,4 0,3 3,9 9,1 1,9
Mukura 100 70,6 4,2 10,9 0,4 3,7 8,2 2,1
Murunda 100 83,4 2,2 2,3 0,2 3,0 7,6 1,4
Musasa 100 83,4 0,7 1,4 0,1 3,2 9,9 1,4
Mushonyi 100 82,6 1,0 1,4 0,1 3,2 11,0 0,7
Mushubati 100 71,2 2,7 8,9 0,2 3,9 11,1 2,0
Nyabirasi 100 76,3 1,5 5,8 0,3 4,0 9,4 2,6
Ruhango 100 76,3 3,6 3,6 0,2 3,6 10,9 1,8
Rusebeya 100 72,5 2,7 10,4 0,4 3,4 9,0 1,6

Fourth Population and Housing Census, Rwanda, 2012 District Profile:Rutsiro
88
Table 55: Distribution (count and %) of the private households of Rutsiro District by main source of
water and by Sector
Sectors
Main source of water
Total number of private households
Total
Internal pipe-born water
Pipe-born water in the compound
Public tap out of the compound
Protected spring/ Well
Unprotected spring/Well
Rain water
River
Lake/ Stream/ Pond/ Surface water
Other Not Stated
2,424,898 Improved source of water Unimproved source of water
Rwanda 543,494 100 0.5 7.1 27.7 37.0 13.0 0.7 6.4 6.4 0.2 1.1
Western Province 71,267
100 0.3 4.2 26.8 39.8 16.3 1.8 6.0 3.4 0.1 1.2
Rutsiro
District 4,801 100.0 0.2 1.1 11.2 57.8 17.6 0.1 6.5 4.0 0.2 1.4
Boneza 5,244 100.0 0.0 0.5 5.1 60.9 17.0 0.0 3.0 12.1 0.0 1.4
Gihango 5,153 100.0 0.2 4.2 18.5 44.5 19.2 0.0 5.6 5.5 0.3 2.0
Kigeyo 6,95 100.0 0.5 0.7 8.8 66.2 9.3 0.1 9.3 3.6 0.0 1.4
Kivumu 3,647 100.0 0.3 1.0 17.3 64.5 6.9 0.0 1.1 7.0 0.0 1.9
Manihira 7,579 100.0 0.1 0.6 10.9 57.0 22.4 0.1 2.9 3.6 1.1 1.3
Mukura 4,11 100.0 0.1 0.7 9.3 52.0 14.4 0.0 17.6 3.6 0.8 1.5
Murunda 5,22 100.0 0.2 1.8 13.6 46.5 27.9 0.0 6.7 0.9 0.6 1.7
Musasa 5,248 100.0 0.1 0.3 4.2 74.2 16.3 0.1 1.8 2.5 0.0 0.5
Mushonyi 5,878 100.0 0.4 0.7 18.6 64.9 8.3 0.0 2.6 3.5 0.0 1.0
Mushubati 6,353 100.0 0.2 2.0 13.4 61.3 7.9 0.1 6.8 6.5 0.0 1.8
Nyabirasi 6,166 100.0 0.0 0.3 15.1 55.4 22.0 0.0 5.6 0.4 0.0 1.2
Ruhango 4,918 100.0 0.1 1.2 2.4 49.9 33.1 0.3 11.2 1.1 0.0 0.8
Rusebeya 2,424,898 100.0 0.0 0.3 7.3 53.9 30.3 0.0 4.3 2.0 0.0 1.9
Source: Rwanda 4th Population and Housing Census, 2012 (NISR)

Fourth Population and Housing Census, Rwanda, 2012 District Profile:Rutsiro
89
Table 56: Distribution (count and %) of the private households of Rutsiro District by main type of toilet
facility and by Sector
Sectors
Main source of toilet facilities
Total number of private households
Total
Improved sanitation facilities
Unimproved sanaitation facitilities Not Stated
Rwanda 2,424,898 100 95,6 2,6 1,7
Western Province 543,494 100 94,9 3,2 2,0
Rutsiro District 71,267 100 93,9 4,2 1,9
Boneza 4,801 100 94,4 3,9 1,7
Gihango 5,244 100 94,7 3,4 2,1
Kigeyo 5,153 100 93,6 3,9 2,5
Kivumu 6,95 100 87,7 8,2 4,1
Manihira 3,647 100 95,3 2,7 2,0
Mukura 7,579 100 96 2,7 1,3
Murunda 4,11 100 94,7 3,1 2,2
Musasa 5,22 100 95,6 3,8 0,5
Mushonyi 5,248 100 96,1 2,4 1,5
Mushubati 5,878 100 94,4 4,5 1,2
Nyabirasi 6,353 100 93 5,9 1,1
Ruhango 6,166 100 92 5,6 2,4
Rusebeya 4,918 100 95,1 2,3 2,6 Source: Rwanda 4
th Population and Housing Census, 2012 (NISR)

NATIONAL INSTITUTE OF STATISTICS OF RWANDA