Embed Size (px)
Citation preview
State Planning Commission, Madhya Pradesh
District wise Poverty
Estimates for
Madhya Pradesh
District wise Poverty
Estimates for
Madhya Pradesh
1
District wise Poverty Estimates for Madhya Pradesh
1S.P.Batra, Chitranjan Tyagi and Mangesh Tyagi
The scope of most of the studies on poverty is limited to states. The main source of data for these studies is “Consumer Expenditure Surveys” undertaken by the National Sample Survey Organization. In past years, the disparities are growing at both between and within the states. This necessitate to do the analysis at disaggregated level say district for identification of the critical areas/ districts for taking necessary steps in implementation of programmes and framing new policy interventions. The sample design adopted for National Sample Survey Organization's Consumer Expenditure Survey 2004-05, allows estimating parameters such as percentage of population living below poverty line at district level. It is because the sample design had taken districts as strata in both the rural and urban sectors. The paper “Levels of Living and Poverty Pattern: A District-wise Analysis for India” published in Economic and political Weekly, Vol XLIV No 9, February 2009 by Siladitya Choudhuri and Nivedita Gupta is appreciated attempt in this direction. On observing the results area wise i.e. rural and urban, seems to be counter intuitive in the opinion of experts knowing their state better. The main constraint is the number of observations at the district level, which varies from 30 to 520 in rural areas and in urban area 10 to 1136 depending upon the rural and urban population. Districts with low number of observations may not provide desired estimates. The national sample survey cell in state (under Directorate of Economic and Statistics) also collect data for equal sample size for each round of NSS, but collected data is not used in estimation of poverty. Directorate of Economic and Statistics,
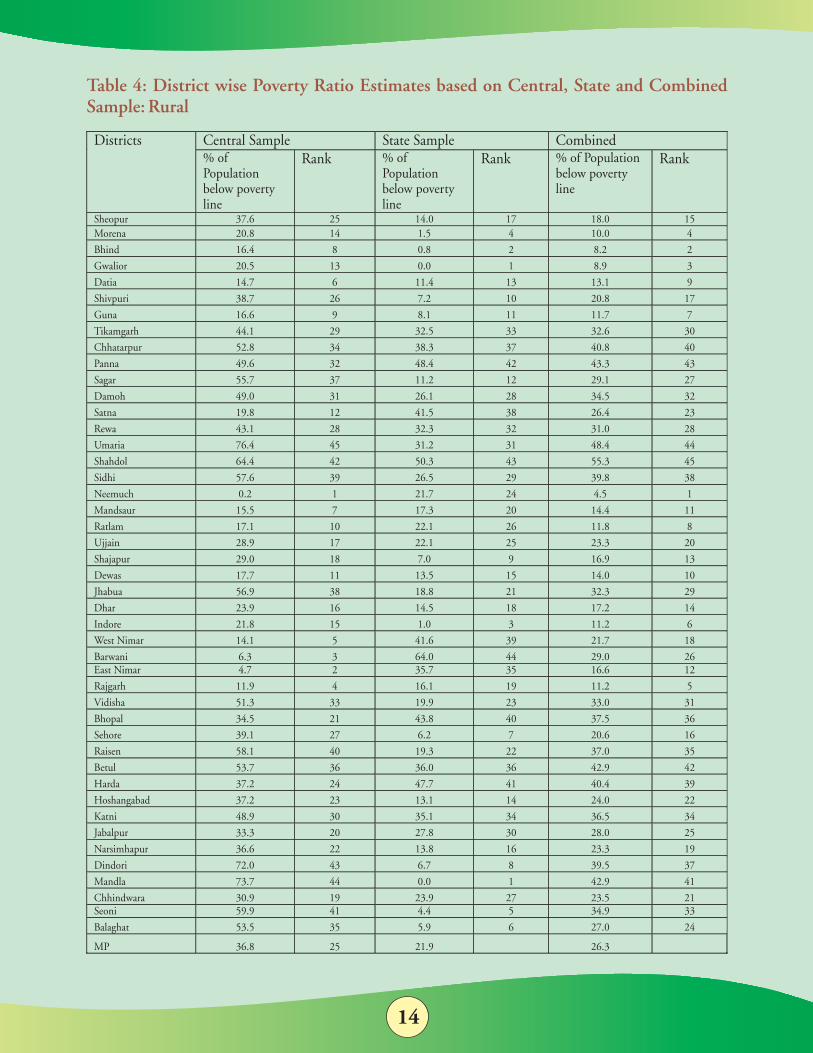
stMadhya Pradesh had validated/cleaned the data collected for NSS 61 round. Thus using state sample along with national sample will increase the number of observation two times. Combined sample may be in the position to provide better estimates of poverty at district level for the state. In present exercise an attempt is made to analyze the State and Central sample of Consumer Expenditure Survey 2004-05 for the state of Madhya Pradesh to estimate the percentage of population living below poverty line by districts. Comparative poverty ratios calculated from Central, State and combined sample are presented separately for rural, urban and over all. Details are given in tables 4-6.In case of rural population below poverty line by district shows that from central sample, Neemuch, East Nimar, Barwani, Rajgarh and West Nimar have lowest proportion (between 0.2 to 14.1%) of population living below poverty line while Seoni, Shahdol, Dindori, Mandla and Umaria have highest proportion (between 59.9 to 76.4 %) of population living below poverty line. Estimates obtained from state sample shows that Gwalior, Mandla, Bhind, Indore, Morena and Seoni have lowest proportion (between 0.0 to 4.4%) of
1 S.P.Batra, Specialist (Statistics) and Mr. Chitranjan Tyagi (Team L eader) with Poverty Monitoring and
Policy Support Unit (PMPSU), Mr. Mangesh Tyagi, Advisor, State Planning Commission, Govern ment of
Madhya Pradesh.
2
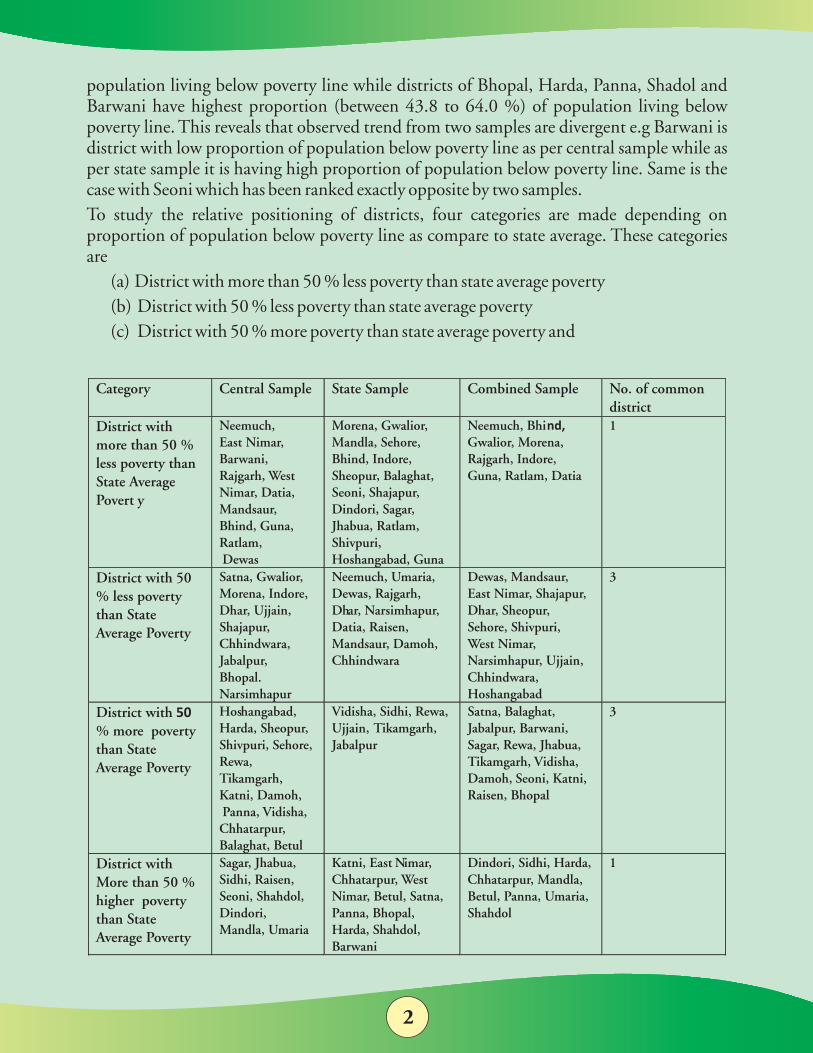
population living below poverty line while districts of Bhopal, Harda, Panna, Shadol and Barwani have highest proportion (between 43.8 to 64.0 %) of population living below poverty line. This reveals that observed trend from two samples are divergent e.g Barwani is district with low proportion of population below poverty line as per central sample while as per state sample it is having high proportion of population below poverty line. Same is the case with Seoni which has been ranked exactly opposite by two samples. To study the relative positioning of districts, four categories are made depending on proportion of population below poverty line as compare to state average. These categories are
(a) District with more than 50 % less poverty than state average poverty(b) District with 50 % less poverty than state average poverty(c) District with 50 % more poverty than state average poverty and
Category Central Sample State Sample Combined Sample No. of common district
District with more than 50 % less poverty than State Average Povert y
Neemuch, East Nimar, Barwani, Rajgarh, West Nimar, Datia, Mandsaur, Bhind, Guna, Ratlam, Dewas
Morena, Gwalior, Mandla, Sehore, Bhind, Indore, Sheopur, Balaghat, Seoni, Shajapur, Dindori, Sagar, Jhabua, Ratlam, Shivpuri, Hoshangabad, Guna
Neemuch, Bhind, Gwalior, Morena, Rajgarh, Indore, Guna, Ratlam, Datia
1
District with 50 % less poverty than State Average Poverty
Satna, Gwalior, Morena, Indore, Dhar, Ujjain, Shajapur, Chhindwara, Jabalpur, Bhopal. Narsimhapur
Neemuch, Umaria, Dewas, Rajgarh, Dhar, Narsimhapur, Datia, Raisen, Mandsaur, Damoh, Chhindwara
Dewas, Mandsaur, East Nimar, Shajapur, Dhar, Sheopur, Sehore, Shivpuri, West Nimar, Narsimhapur, Ujjain, Chhindwara, Hoshangabad
3
District with 50 % more poverty than State Average Poverty
Hoshangabad, Harda, Sheopur, Shivpuri, Sehore, Rewa, Tikamgarh, Katni, Damoh, Panna, Vidisha, Chhatarpur, Balaghat, Betul
Vidisha, Sidhi, Rewa, Ujjain, Tikamgarh, Jabalpur
Satna, Balaghat, Jabalpur, Barwani, Sagar, Rewa, Jhabua, Tikamgarh, Vidisha, Damoh, Seoni, Katni, Raisen, Bhopal
3
District with More than 50 % higher poverty than State Average Poverty
Sagar, Jhabua, Sidhi, Raisen, Seoni, Shahdol, Dindori, Mandla, Umaria
Katni, East Nimar, Chhatarpur, West Nimar, Betul, Satna, Panna, Bhopal, Harda, Shahdol, Barwani
Dindori, Sidhi, Harda, Chhatarpur, Mandla, Betul, Panna, Umaria, Shahdol
1
3
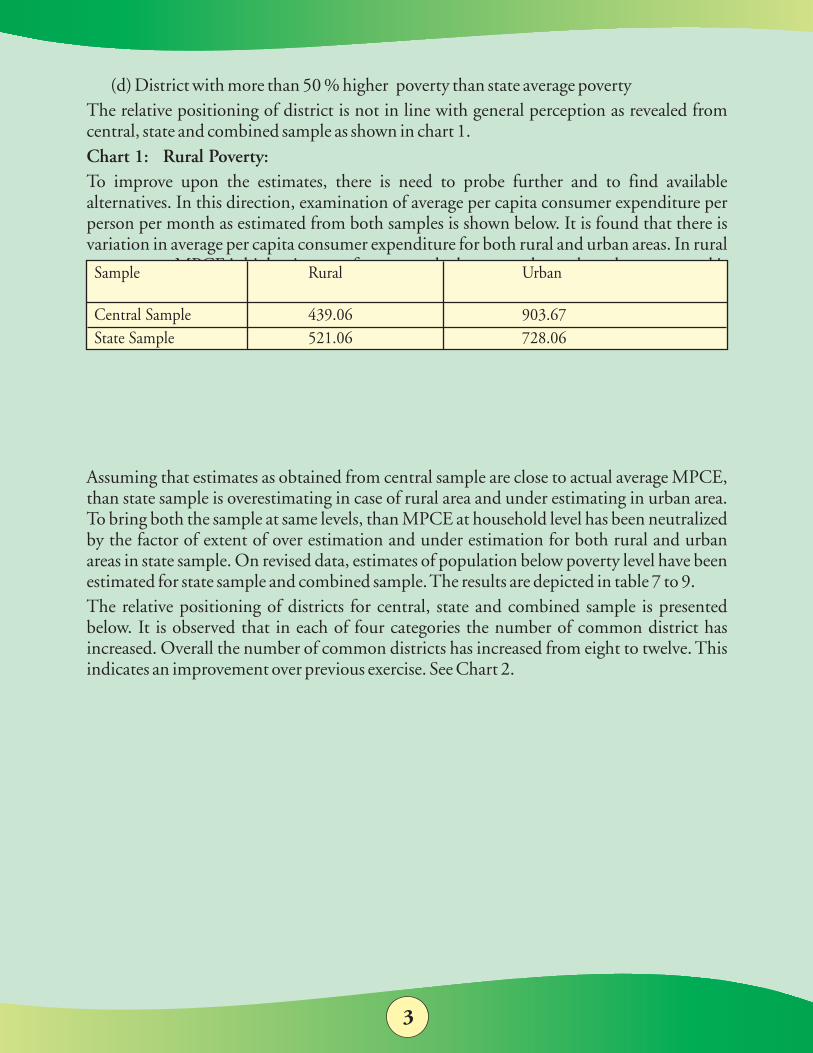
(d) District with more than 50 % higher poverty than state average povertyThe relative positioning of district is not in line with general perception as revealed from central, state and combined sample as shown in chart 1. Chart 1: Rural Poverty: To improve upon the estimates, there is need to probe further and to find available alternatives. In this direction, examination of average per capita consumer expenditure per person per month as estimated from both samples is shown below. It is found that there is variation in average per capita consumer expenditure for both rural and urban areas. In rural area average MPCE is higher in case of state sample than central sample and reverse trend is found in case of urban areas. Estimated Average MPCE- 2004-05
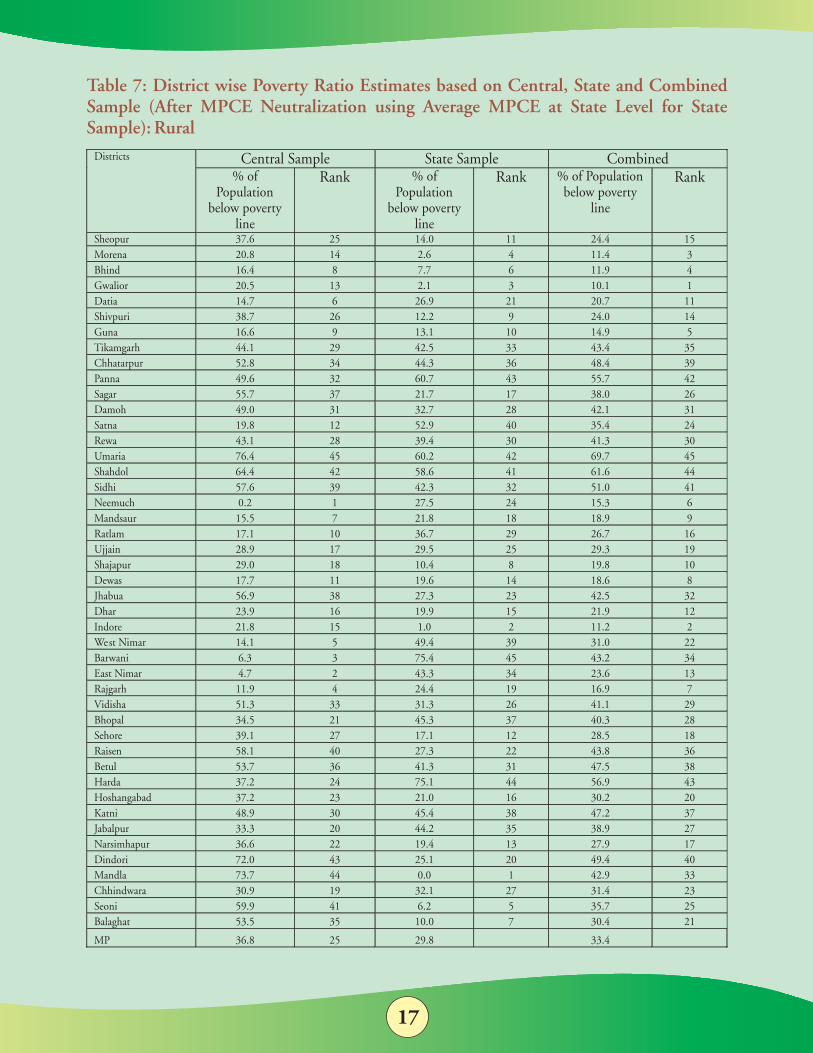
Assuming that estimates as obtained from central sample are close to actual average MPCE, than state sample is overestimating in case of rural area and under estimating in urban area. To bring both the sample at same levels, than MPCE at household level has been neutralized by the factor of extent of over estimation and under estimation for both rural and urban areas in state sample. On revised data, estimates of population below poverty level have been estimated for state sample and combined sample. The results are depicted in table 7 to 9. The relative positioning of districts for central, state and combined sample is presented below. It is observed that in each of four categories the number of common district has increased. Overall the number of common districts has increased from eight to twelve. This indicates an improvement over previous exercise. See Chart 2.
Sample Rural Urban
Central Sample 439.06 903.67State Sample 521.06 728.06
4
Category Central Sample State Sample Combined Sample No. of common district
District with More than 50 % less poverty than State Average Poverty
Neemuch, East Nimar, Barwani, Rajgarh, West Nimar, Datia, Mandsaur, Bhind, Guna, Ratlam, Dewas
Mandla, Indore, Gwalior, Morena, Seoni, Bhind, Balaghat, Shajapur, Shivpuri, Guna, Sheopur
Gwalior, Indore, Morena, Bhind, Guna, Neemuch
2
District with 50 % less poverty than State Average Poverty
Satna, Gwalior, Morena, Indore, Dhar, Ujjain, Shajapur, Chhindwara, Jabalpur, Bhopal. Narsimhapur
Sehore, Narsimhapur, Dewas, Dhar, Hoshangabad, Sagar, Mandsaur, Rajgarh, Dindori, Datia, Raisen, Jhabua, Neemuch, Ujjain
Rajgarh, Dewas, Mandsaur, Shajapur, Datia, Dhar, East Nimar, Shivpuri, Sheopur, Ratlam, Narsimhapur, Sehore, Ujjain, Hoshangabad, Balaghat, West Nimar, Chhindwara
3
District with 50 % more poverty than State Average Poverty
Hoshangabad, Harda, Sheopur, Shivpuri, Sehore, Rewa, Tikamgarh, Katni, Damoh, Panna, Vidisha, Chhatarpur, Balaghat, Betul
Vidisha, Chhindwara, Damoh, Ratlam, Rewa, Betul, Sidhi, Tikamgarh, East Nimar, Jabalpur, Chhatarpur
Satna, Seoni, Sagar, Jabalpur, Bhopal, Vidisha, Rewa, Damoh, Jhabua, Mandla, Barwani, Tikamgarh, Raisen, Katni, Betul, Chhatarpur, Dindori
5
District with More than 50 % higher poverty than State Average Poverty
Sagar, Jhabua, Sidhi, Raisen, Seoni, Shahdol, Dindori, Mandla, Umaria
Bhopal, Katni, West Nimar, Satna, Shahdol, Umaria, Panna, Harda, Barwani
Sidhi, Panna, Harda, Shahdol, Umaria
2
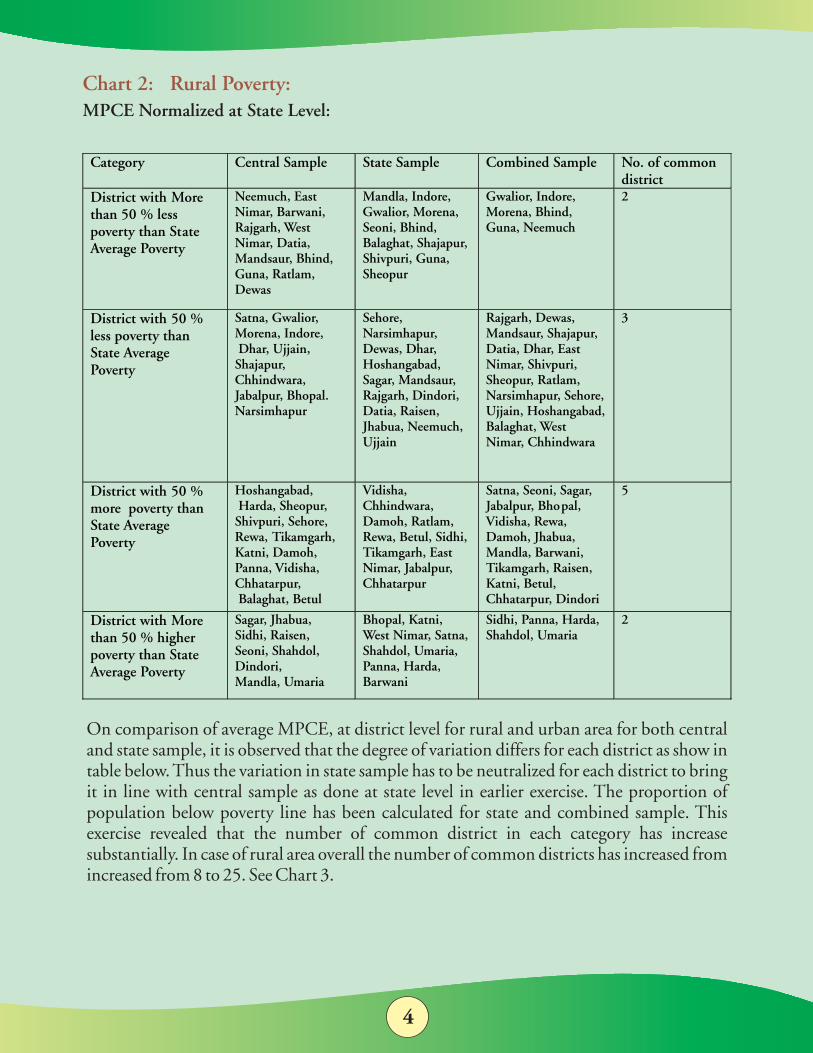
Chart 2: Rural Poverty: MPCE Normalized at State Level:
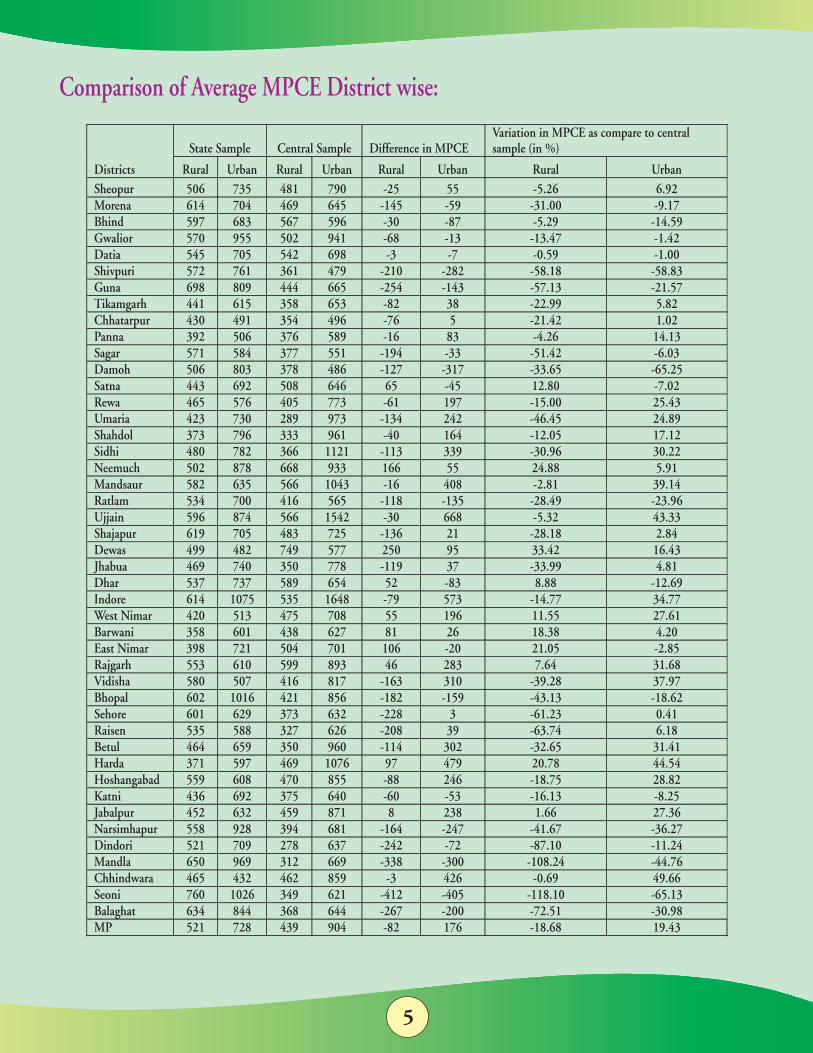
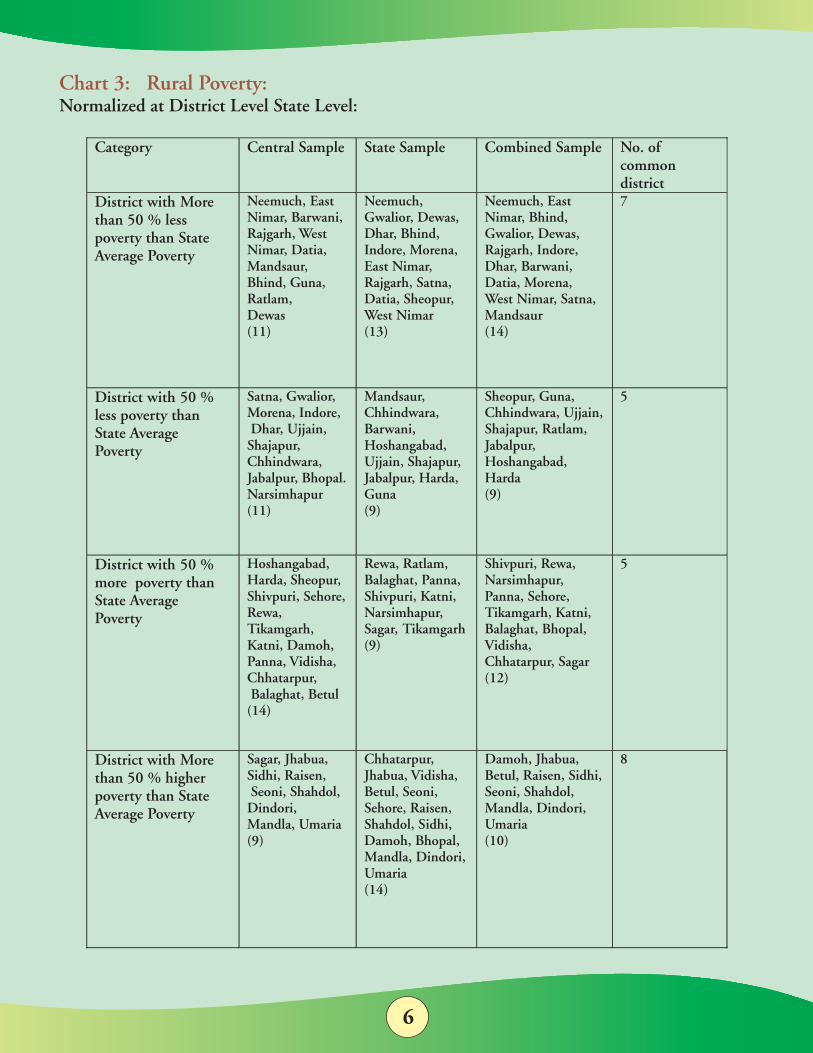
On comparison of average MPCE, at district level for rural and urban area for both central and state sample, it is observed that the degree of variation differs for each district as show in table below. Thus the variation in state sample has to be neutralized for each district to bring it in line with central sample as done at state level in earlier exercise. The proportion of population below poverty line has been calculated for state and combined sample. This exercise revealed that the number of common district in each category has increase substantially. In case of rural area overall the number of common districts has increased from increased from 8 to 25. See Chart 3.
5
Comparison of Average MPCE District wise:
Districts
State Sample
Central Sample
Difference in MPCE
Variation in MPCE as compare to central sample (in %)
Rural
Urban
Rural
Urban
Rural
Urban
Rural
Urban
Sheopur
506
735
481
790
-25
55
-5.26
6.92
Morena
614
704
469
645
-145
-59
-31.00
-9.17
Bhind
597
683
567
596
-30
-87
-5.29
-14.59
Gwalior
570
955
502
941
-68
-13
-13.47
-1.42
Datia
545
705
542
698
-3
-7
-0.59
-1.00
Shivpuri
572
761
361
479
-210
-282
-58.18
-58.83 Guna
698
809
444
665
-254
-143
-57.13
-21.57
Tikamgarh
441
615
358
653
-82
38
-22.99
5.82 Chhatarpur
430
491
354
496
-76
5
-21.42
1.02
Panna
392
506
376
589
-16
83
-4.26
14.13 Sagar
571
584
377
551
-194
-33
-51.42
-6.03
Damoh 506 803 378 486 -127 -317 -33.65 -65.25 Satna 443 692 508 646 65 -45 12.80 -7.02 Rewa 465 576 405 773 -61 197 -15.00 25.43 Umaria 423 730 289 973 -134 242 -46.45 24.89 Shahdol 373 796 333 961 -40 164 -12.05 17.12 Sidhi 480 782 366 1121 -113 339 -30.96 30.22
Neemuch 502 878 668 933 166 55 24.88 5.91
Mandsaur 582 635 566 1043 -16 408 -2.81 39.14
Ratlam
534
700
416
565
-118
-135
-28.49
-23.96
Ujjain
596
874
566
1542
-30
668
-5.32
43.33
Shajapur
619
705
483
725
-136
21
-28.18
2.84
Dewas
499
482
749
577
250
95
33.42
16.43
Jhabua
469
740
350
778
-119
37
-33.99
4.81
Dhar
537
737
589
654
52
-83
8.88
-12.69
Indore
614
1075
535
1648
-79
573
-14.77
34.77
West Nimar
420
513
475
708
55
196
11.55
27.61
Barwani
358
601
438
627
81
26
18.38
4.20
East Nimar
398
721
504
701
106
-20
21.05
-2.85
Rajgarh
553
610
599
893
46
283
7.64
31.68
Vidisha
580
507
416
817
-163
310
-39.28
37.97
Bhopal
602
1016
421
856
-182
-159
-43.13
-18.62
Sehore
601
629
373
632
-228
3
-61.23
0.41
Raisen
535
588
327
626
-208
39
-63.74
6.18
Betul
464
659
350
960
-114
302
-32.65
31.41
Harda
371
597
469
1076
97
479
20.78
44.54
Hoshangabad
559
608
470
855
-88
246
-18.75
28.82
Katni
436
692
375
640
-60
-53
-16.13
-8.25
Jabalpur
452
632
459
871
8
238
1.66
27.36
Narsimhapur
558
928
394
681
-164
-247
-41.67
-36.27
Dindori
521
709
278
637
-242
-72
-87.10
-11.24
Mandla
650
969
312
669
-338
-300
-108.24
-44.76
Chhindwara
465
432
462
859
-3
426
-0.69
49.66
Seoni
760
1026
349
621
-412
-405
-118.10
-65.13
Balaghat
634
844
368
644
-267
-200
-72.51
-30.98
MP
521
728
439
904
-82
176
-18.68
19.43
6
Chart 3: Rural Poverty: Normalized at District Level State Level:
Category Central Sample State Sample Combined Sample No. of common district
District with More than 50 % less poverty than State Average Poverty
Neemuch, East Nimar, Barwani, Rajgarh, West Nimar, Datia, Mandsaur, Bhind, Guna, Ratlam, Dewas (11)
Neemuch, Gwalior, Dewas, Dhar, Bhind, Indore, Morena, East Nimar, Rajgarh, Satna, Datia, Sheopur, West Nimar (13)
Neemuch, East Nimar, Bhind, Gwalior, Dewas, Rajgarh, Indore, Dhar, Barwani, Datia, Morena, West Nimar, Satna, Mandsaur (14)
7
District with 50 % less poverty than State Average Poverty
Satna, Gwalior, Morena, Indore, Dhar, Ujjain, Shajapur, Chhindwara, Jabalpur, Bhopal. Narsimhapur (11)
Mandsaur, Chhindwara, Barwani, Hoshangabad, Ujjain, Shajapur, Jabalpur, Harda, Guna (9)
Sheopur, Guna, Chhindwara, Ujjain, Shajapur, Ratlam, Jabalpur, Hoshangabad, Harda (9)
5
District with 50 % more poverty than State Average Poverty
Hoshangabad, Harda, Sheopur, Shivpuri, Sehore, Rewa, Tikamgarh, Katni, Damoh, Panna, Vidisha, Chhatarpur, Balaghat, Betul (14)
Rewa, Ratlam, Balaghat, Panna, Shivpuri, Katni, Narsimhapur, Sagar, Tikamgarh (9)
Shivpuri, Rewa, Narsimhapur, Panna, Sehore, Tikamgarh, Katni, Balaghat, Bhopal, Vidisha, Chhatarpur, Sagar (12)
5
District with More than 50 % higher poverty than State Average Poverty
Sagar, Jhabua, Sidhi, Raisen, Seoni, Shahdol, Dindori, Mandla, Umaria (9)
Chhatarpur, Jhabua, Vidisha, Betul, Seoni, Sehore, Raisen, Shahdol, Sidhi, Damoh, Bhopal, Mandla, Dindori, Umaria (14)
Damoh, Jhabua, Betul, Raisen, Sidhi, Seoni, Shahdol, Mandla, Dindori, Umaria (10)
8
7
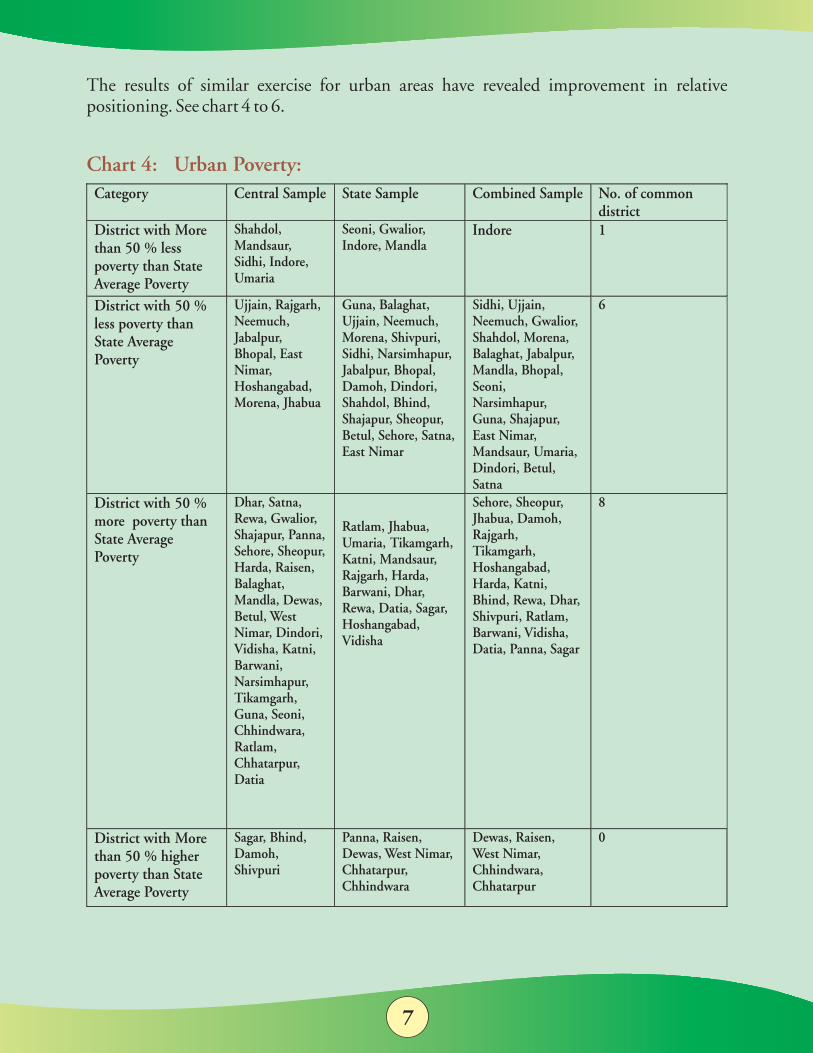
The results of similar exercise for urban areas have revealed improvement in relative positioning. See chart 4 to 6.
Chart 4: Urban Poverty: Category Central Sample State Sample Combined Sample No. of common
district District with More than 50 % less poverty than State Average Poverty
Shahdol, Mandsaur, Sidhi, Indore, Umaria
Seoni, Gwalior, Indore, Mandla
Indore 1
District with 50 % less poverty than State Average Poverty
Ujjain, Rajgarh, Neemuch, Jabalpur, Bhopal, East Nimar, Hoshangabad, Morena, Jhabua
Guna, Balaghat, Ujjain, Neemuch, Morena, Shivpuri, Sidhi, Narsimhapur, Jabalpur, Bhopal, Damoh, Dindori, Shahdol,
Bhind,
Shajapur, Sheopur, Betul, Sehore, Satna, East Nimar
Sidhi, Ujjain, Neemuch, Gwalior, Shahdol, Morena, Balaghat, Jabalpur, Mandla, Bhopal, Seoni, Narsimhapur, Guna, Shajapur, East Nimar, Mandsaur, Umaria, Dindori, Betul, Satna
6
District with 50 % more poverty than State Average Poverty
Dhar, Satna, Rewa, Gwalior, Shajapur, Panna, Sehore, Sheopur, Harda, Raisen, Balaghat, Mandla, Dewas, Betul, West Nimar, Dindori, Vidisha, Katni, Barwani, Narsimhapur, Tikamgarh, Guna, Seoni, Chhindwara, Ratlam, Chhatarpur, Datia
Ratlam, Jhabua, Umaria, Tikamgarh, Katni, Mandsaur, Rajgarh, Harda, Barwani, Dhar, Rewa, Datia, Sagar, Hoshangabad, Vidisha
Sehore, Sheopur, Jhabua, Damoh, Rajgarh, Tikamgarh, Hoshangabad, Harda, Katni, Bhind, Rewa, Dhar, Shivpuri, Ratlam, Barwani, Vidisha, Datia, Panna, Sagar
8
District with More than 50 % higher poverty than State Average Poverty
Sagar, Bhind, Damoh, Shivpuri
Panna, Raisen, Dewas, West Nimar, Chhatarpur, Chhindwara
Dewas, Raisen, West Nimar, Chhindwara, Chhatarpur
0
8
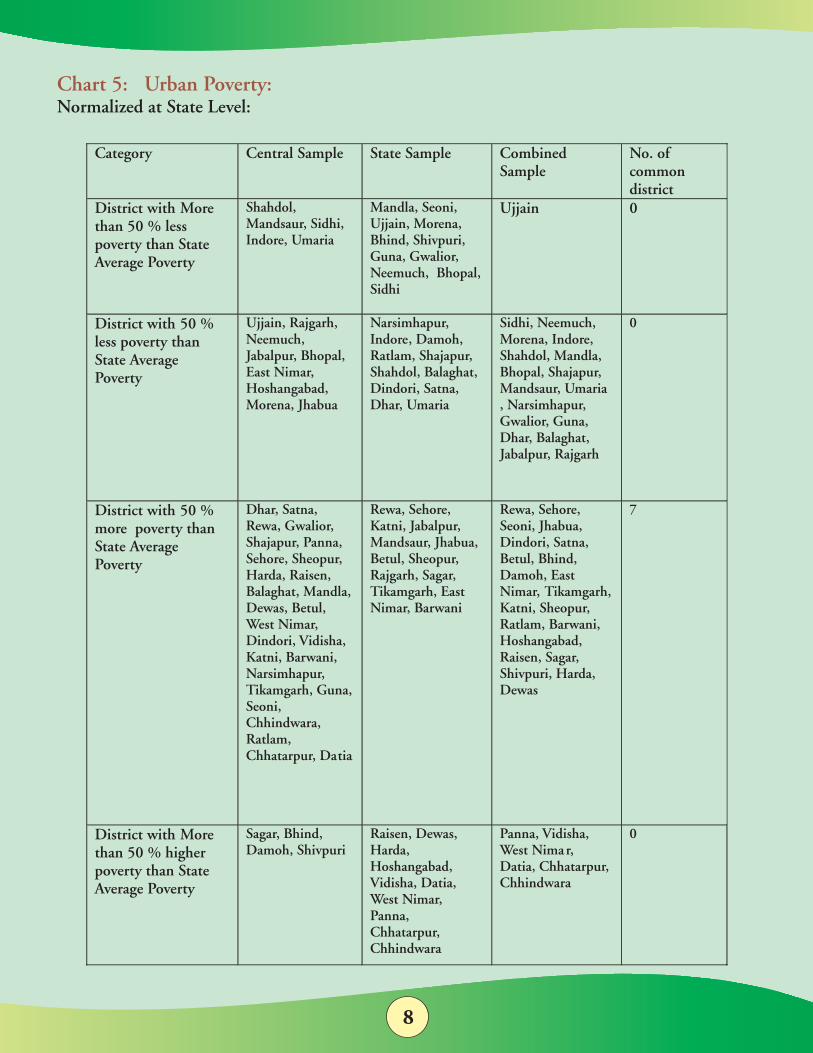
Chart 5: Urban Poverty: Normalized at State Level:
Category Central Sample State Sample Combined Sample
No. of common district
District with More than 50 % less poverty than State Average Poverty
Shahdol, Mandsaur, Sidhi, Indore, Umaria
Mandla, Seoni, Ujjain, Morena, Bhind, Shivpuri, Guna, Gwalior, Neemuch, Bhopal, Sidhi
Ujjain 0
District with 50 % less poverty than State Average Poverty
Ujjain, Rajgarh, Neemuch, Jabalpur, Bhopal, East Nimar, Hoshangabad, Morena, Jhabua
Narsimhapur, Indore, Damoh, Ratlam, Shajapur, Shahdol, Balaghat, Dindori, Satna, Dhar, Umaria
Sidhi, Neemuch, Morena, Indore, Shahdol, Mandla, Bhopal, Shajapur, Mandsaur, Umaria , Narsimhapur, Gwalior, Guna, Dhar, Balaghat, Jabalpur, Rajgarh
0
District with 50 % more poverty than State Average Poverty
Dhar, Satna, Rewa, Gwalior, Shajapur, Panna, Sehore, Sheopur, Harda, Raisen, Balaghat, Mandla, Dewas, Betul, West Nimar, Dindori, Vidisha, Katni, Barwani, Narsimhapur, Tikamgarh, Guna, Seoni, Chhindwara, Ratlam, Chhatarpur, Datia
Rewa, Sehore, Katni, Jabalpur, Mandsaur, Jhabua, Betul, Sheopur, Rajgarh, Sagar, Tikamgarh, East Nimar, Barwani
Rewa, Sehore, Seoni, Jhabua, Dindori, Satna, Betul, Bhind, Damoh, East Nimar, Tikamgarh, Katni, Sheopur, Ratlam, Barwani, Hoshangabad, Raisen, Sagar, Shivpuri, Harda, Dewas
7
District with More than 50 % higher poverty than State Average Poverty
Sagar, Bhind, Damoh, Shivpuri
Raisen, Dewas, Harda, Hoshangabad, Vidisha, Datia, West Nimar, Panna, Chhatarpur, Chhindwara
Panna, Vidisha, West Nimar, Datia, Chhatarpur, Chhindwara
0
9
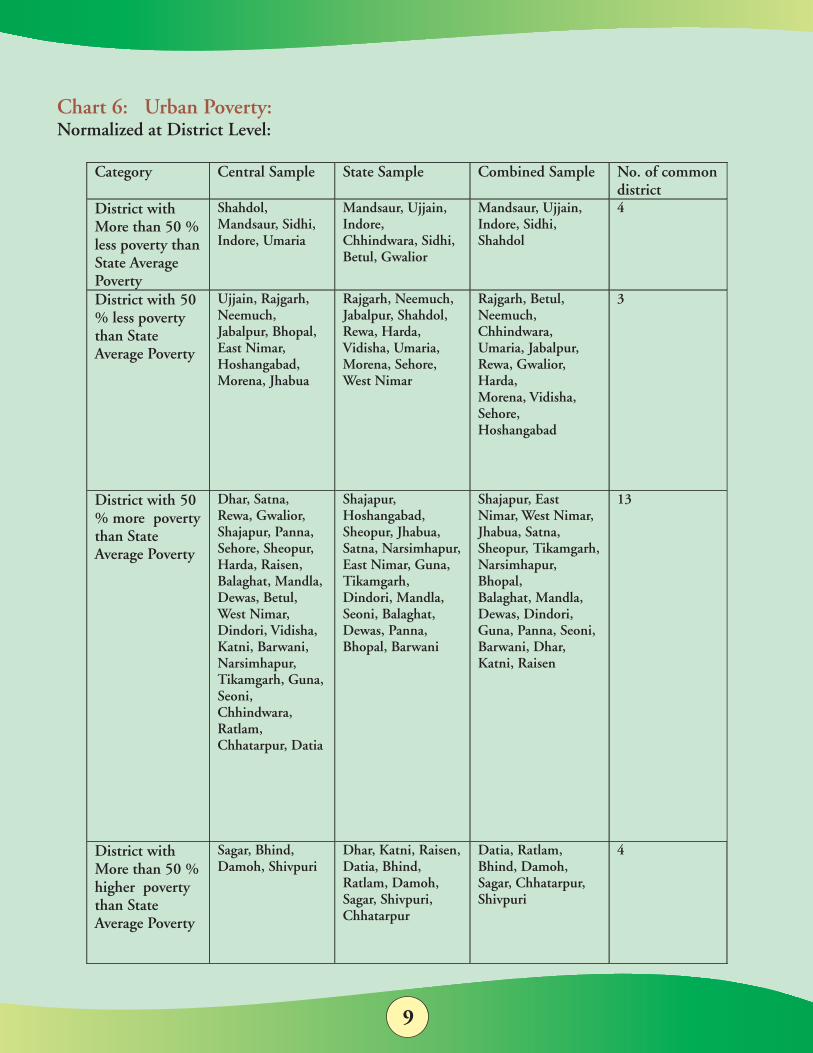
Chart 6: Urban Poverty: Normalized at District Level:
Category Central Sample State Sample Combined Sample No. of common district
District with More than 50 % less poverty than State Average Poverty
Shahdol, Mandsaur, Sidhi, Indore, Umaria
Mandsaur, Ujjain, Indore, Chhindwara, Sidhi, Betul, Gwalior
Mandsaur, Ujjain, Indore, Sidhi, Shahdol
4
District with 50 % less poverty than State Average Poverty
Ujjain, Rajgarh, Neemuch, Jabalpur, Bhopal, East Nimar, Hoshangabad, Morena, Jhabua
Rajgarh, Neemuch, Jabalpur, Shahdol, Rewa, Harda, Vidisha, Umaria, Morena, Sehore, West Nimar
Rajgarh, Betul, Neemuch, Chhindwara, Umaria, Jabalpur, Rewa, Gwalior, Harda, Morena, Vidisha, Sehore, Hoshangabad
3
District with 50 % more poverty than State Average Poverty
Dhar, Satna, Rewa, Gwalior, Shajapur, Panna, Sehore, Sheopur, Harda, Raisen, Balaghat, Mandla, Dewas, Betul, West Nimar, Dindori, Vidisha, Katni, Barwani, Narsimhapur, Tikamgarh, Guna, Seoni, Chhindwara, Ratlam, Chhatarpur, Datia
Shajapur, Hoshangabad, Sheopur, Jhabua, Satna, Narsimhapur, East Nimar, Guna, Tikamgarh, Dindori, Mandla, Seoni, Balaghat, Dewas, Panna, Bhopal, Barwani
Shajapur, East Nimar, West Nimar, Jhabua, Satna, Sheopur, Tikamgarh, Narsimhapur, Bhopal, Balaghat, Mandla, Dewas, Dindori, Guna, Panna, Seoni, Barwani, Dhar, Katni, Raisen
13
District with More than 50 % higher poverty than State Average Poverty
Sagar, Bhind, Damoh, Shivpuri
Dhar, Katni, Raisen, Datia, Bhind, Ratlam, Damoh, Sagar, Shivpuri, Chhatarpur
Datia, Ratlam, Bhind, Damoh, Sagar, Chhatarpur, Shivpuri
4
10
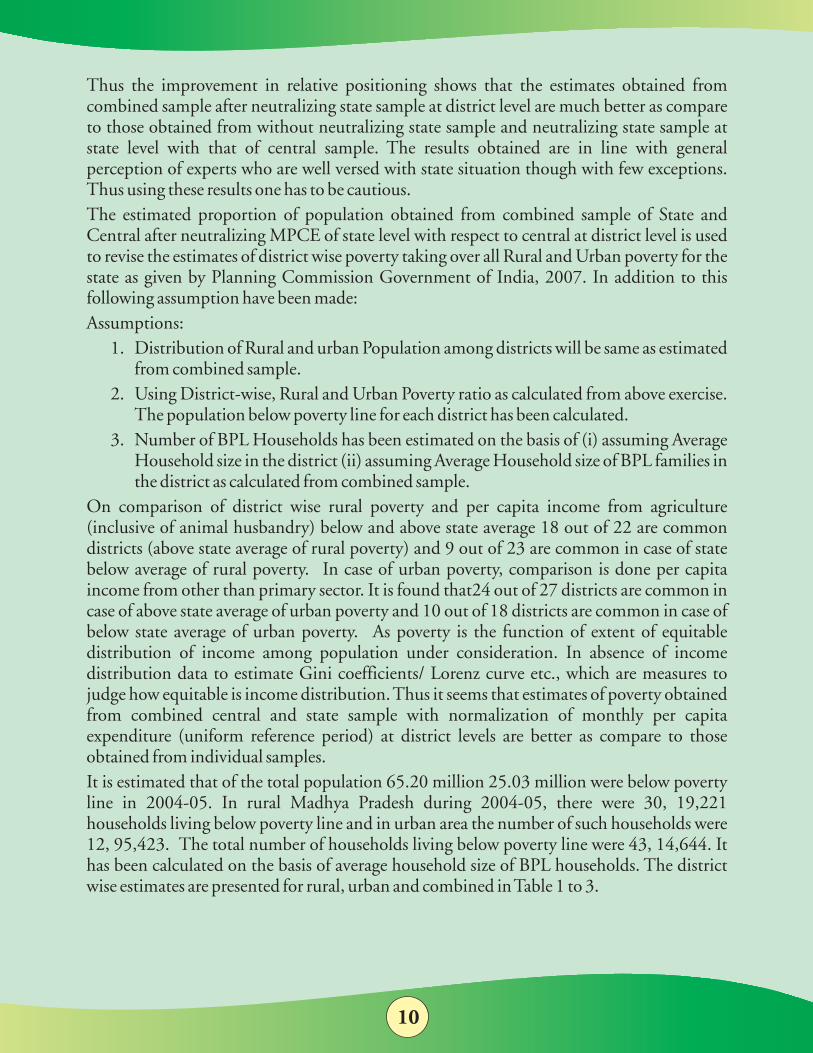
Thus the improvement in relative positioning shows that the estimates obtained from combined sample after neutralizing state sample at district level are much better as compare to those obtained from without neutralizing state sample and neutralizing state sample at state level with that of central sample. The results obtained are in line with general perception of experts who are well versed with state situation though with few exceptions. Thus using these results one has to be cautious.The estimated proportion of population obtained from combined sample of State and Central after neutralizing MPCE of state level with respect to central at district level is used to revise the estimates of district wise poverty taking over all Rural and Urban poverty for the state as given by Planning Commission Government of India, 2007. In addition to this following assumption have been made: Assumptions:
1. Distribution of Rural and urban Population among districts will be same as estimated from combined sample.
2. Using District-wise, Rural and Urban Poverty ratio as calculated from above exercise. The population below poverty line for each district has been calculated.
3. Number of BPL Households has been estimated on the basis of (i) assuming Average Household size in the district (ii) assuming Average Household size of BPL families in the district as calculated from combined sample.
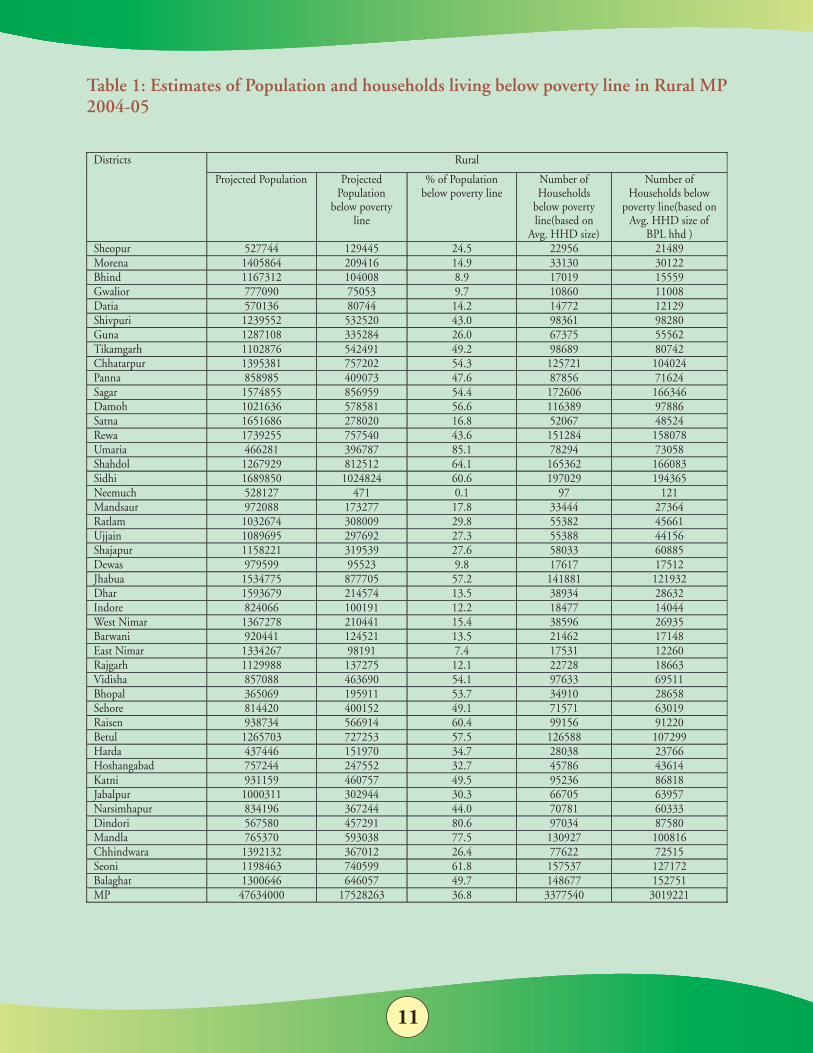
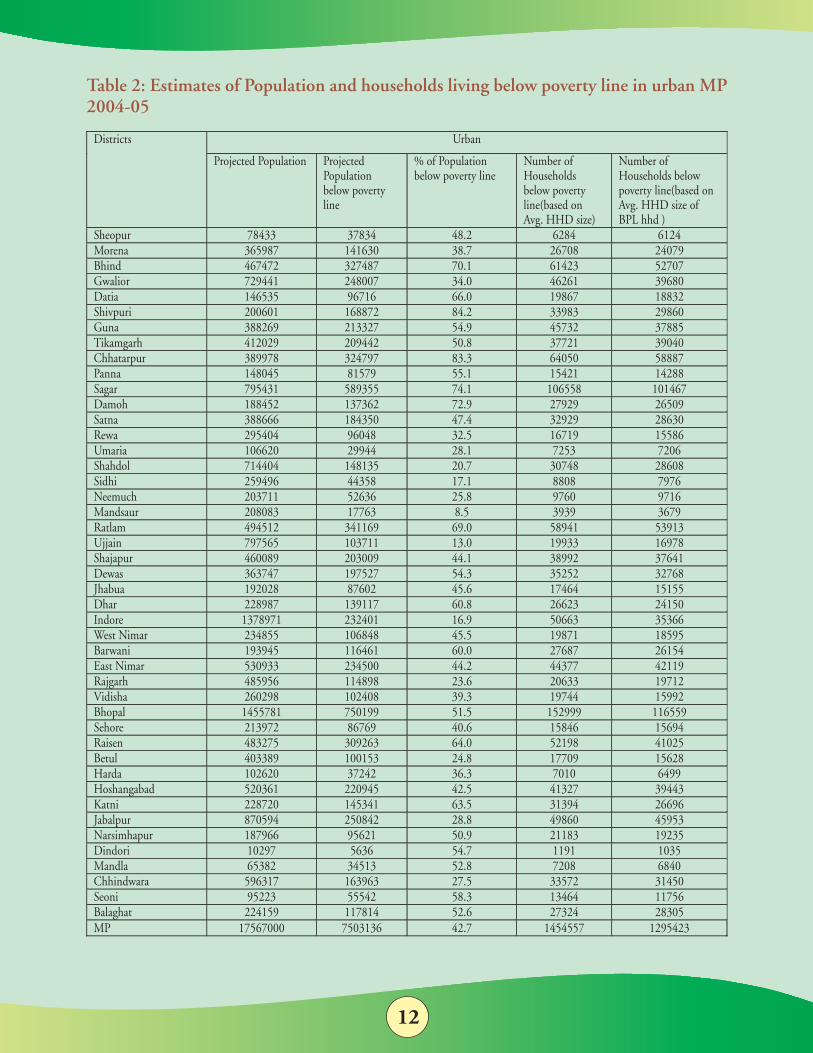
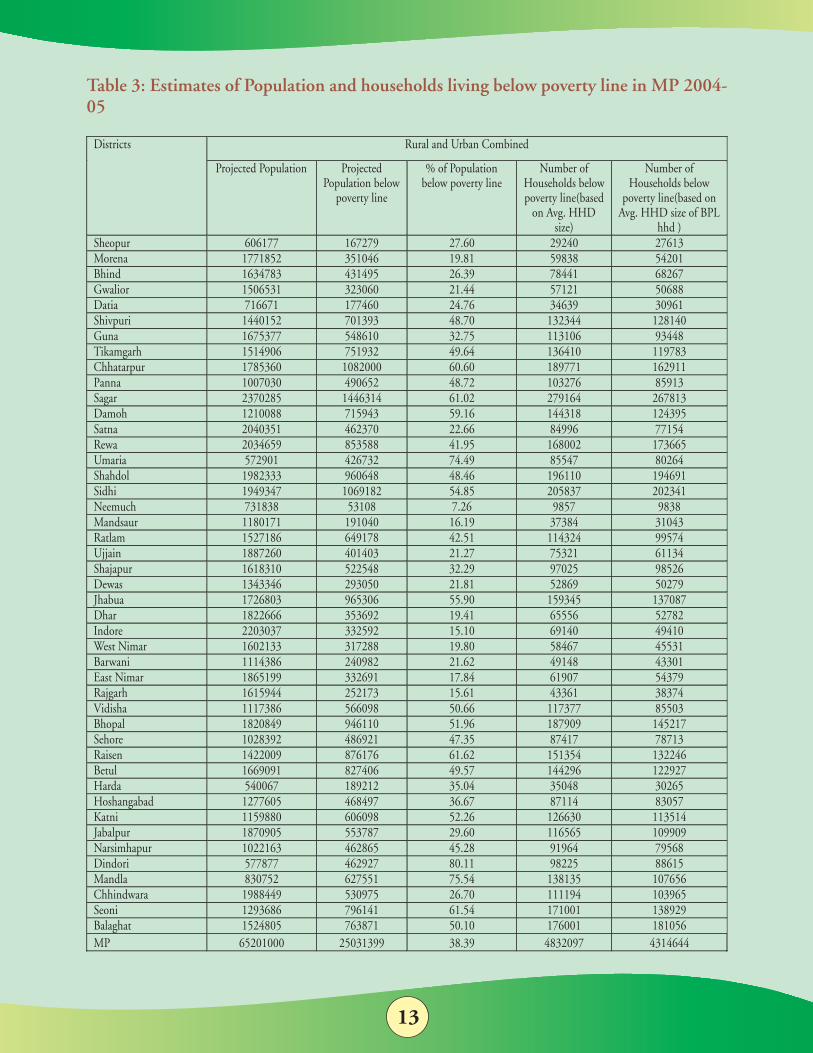
On comparison of district wise rural poverty and per capita income from agriculture (inclusive of animal husbandry) below and above state average 18 out of 22 are common districts (above state average of rural poverty) and 9 out of 23 are common in case of state below average of rural poverty. In case of urban poverty, comparison is done per capita income from other than primary sector. It is found that24 out of 27 districts are common in case of above state average of urban poverty and 10 out of 18 districts are common in case of below state average of urban poverty. As poverty is the function of extent of equitable distribution of income among population under consideration. In absence of income distribution data to estimate Gini coefficients/ Lorenz curve etc., which are measures to judge how equitable is income distribution. Thus it seems that estimates of poverty obtained from combined central and state sample with normalization of monthly per capita expenditure (uniform reference period) at district levels are better as compare to those obtained from individual samples.It is estimated that of the total population 65.20 million 25.03 million were below poverty line in 2004-05. In rural Madhya Pradesh during 2004-05, there were 30, 19,221 households living below poverty line and in urban area the number of such households were 12, 95,423. The total number of households living below poverty line were 43, 14,644. It has been calculated on the basis of average household size of BPL households. The district wise estimates are presented for rural, urban and combined in Table 1 to 3.
11
Table 1: Estimates of Population and households living below poverty line in Rural MP 2004-05
Districts
Rural
Projected Population
Projected Population
below poverty line
% of Population
below poverty line
Number of Households
below poverty line(based on
Avg. HHD size)
Number of Households below
poverty line(based on Avg. HHD size of
BPL hhd )
Sheopur
527744
129445
24.5
22956
21489
Morena
1405864
209416
14.9
33130
30122
Bhind
1167312
104008
8.9
17019
15559
Gwalior
777090
75053
9.7
10860
11008
Datia
570136
80744
14.2
14772
12129
Shivpuri
1239552
532520
43.0
98361
98280
Guna
1287108
335284
26.0
67375
55562
Tikamgarh
1102876
542491
49.2
98689
80742
Chhatarpur
1395381
757202
54.3
125721
104024
Panna
858985
409073
47.6
87856
71624
Sagar
1574855
856959
54.4
172606
166346
Damoh
1021636
578581
56.6
116389
97886
Satna
1651686
278020
16.8
52067
48524
Rewa
1739255
757540
43.6
151284
158078
Umaria
466281
396787
85.1
78294
73058
Shahdol
1267929
812512
64.1
165362
166083
Sidhi
1689850
1024824
60.6
197029
194365
Neemuch
528127
471
0.1
97
121
Mandsaur
972088
173277
17.8
33444
27364
Ratlam
1032674
308009
29.8
55382
45661
Ujjain
1089695
297692
27.3
55388
44156
Shajapur
1158221
319539
27.6
58033
60885
Dewas
979599
95523
9.8
17617
17512
Jhabua
1534775
877705
57.2
141881
121932
Dhar
1593679
214574
13.5
38934
28632
Indore
824066
100191
12.2
18477
14044
West Nimar
1367278
210441
15.4
38596
26935
Barwani
920441
124521
13.5
21462
17148
East Nimar
1334267
98191
7.4
17531
12260
Rajgarh
1129988
137275
12.1
22728
18663
Vidisha
857088
463690
54.1
97633
69511
Bhopal
365069
195911
53.7
34910
28658
Sehore
814420
400152
49.1
71571
63019
Raisen
938734
566914
60.4
99156
91220
Betul
1265703
727253
57.5
126588
107299
Harda
437446
151970
34.7
28038
23766
Hoshangabad
757244
247552
32.7
45786
43614
Katni
931159
460757
49.5
95236
86818
Jabalpur
1000311
302944
30.3
66705
63957
Narsimhapur
834196
367244
44.0
70781
60333
Dindori
567580
457291
80.6
97034
87580
Mandla
765370
593038
77.5
130927
100816
Chhindwara
1392132
367012
26.4
77622
72515
Seoni
1198463
740599
61.8
157537
127172
Balaghat
1300646
646057
49.7
148677
152751
MP 47634000 17528263 36.8 3377540 3019221
12
Table 2: Estimates of Population and households living below poverty line in urban MP 2004-05
Districts
Urban
Projected Population
Projected Population below poverty line
% of Population below poverty line
Number of Households below poverty line(based on Avg. HHD size)
Number of Households below poverty line(based on Avg. HHD size of BPL hhd )
Sheopur
78433
37834
48.2
6284
6124
Morena
365987
141630
38.7
26708
24079
Bhind
467472
327487
70.1
61423
52707
Gwalior
729441
248007
34.0
46261
39680
Datia
146535
96716
66.0
19867
18832
Shivpuri
200601
168872
84.2
33983
29860
Guna
388269
213327
54.9
45732
37885
Tikamgarh
412029
209442
50.8
37721
39040
Chhatarpur
389978
324797
83.3
64050
58887
Panna
148045
81579
55.1
15421
14288
Sagar
795431
589355
74.1
106558
101467
Damoh
188452
137362
72.9
27929
26509
Satna
388666
184350
47.4
32929
28630
Rewa
295404
96048
32.5
16719
15586
Umaria
106620
29944
28.1
7253
7206
Shahdol
714404
148135
20.7
30748
28608
Sidhi
259496
44358
17.1
8808
7976
Neemuch
203711
52636
25.8
9760
9716
Mandsaur
208083
17763
8.5
3939
3679
Ratlam
494512
341169
69.0
58941
53913
Ujjain
797565
103711
13.0
19933
16978
Shajapur
460089
203009
44.1
38992
37641
Dewas
363747
197527
54.3
35252
32768
Jhabua
192028
87602
45.6
17464
15155
Dhar
228987
139117
60.8
26623
24150
Indore
1378971
232401
16.9
50663
35366
West Nimar
234855
106848
45.5
19871
18595
Barwani
193945
116461
60.0
27687
26154
East Nimar
530933
234500
44.2
44377
42119
Rajgarh
485956
114898
23.6
20633
19712
Vidisha
260298
102408
39.3
19744
15992
Bhopal
1455781
750199
51.5
152999
116559
Sehore
213972
86769
40.6
15846
15694
Raisen
483275
309263
64.0
52198
41025
Betul
403389
100153
24.8
17709
15628
Harda
102620
37242
36.3
7010
6499
Hoshangabad
520361
220945
42.5
41327
39443
Katni
228720
145341
63.5
31394
26696
Jabalpur
870594
250842
28.8
49860
45953
Narsimhapur
187966
95621
50.9
21183
19235
Dindori
10297
5636
54.7
1191
1035
Mandla
65382
34513
52.8
7208
6840
Chhindwara
596317
163963
27.5
33572
31450
Seoni
95223
55542
58.3
13464
11756
Balaghat
224159
117814
52.6
27324
28305
MP 17567000 7503136 42.7 1454557 1295423
13
Table 3: Estimates of Population and households living below poverty line in MP 2004-05
Districts Rural and Urban Combined
Projected Population Projected Population below
poverty line
% of Population below poverty line
Number of Households below poverty line(based
on Avg. HHD size)
Number of Households below
poverty line(based on Avg. HHD size of BPL
hhd ) Sheopur 606177 167279 27.60 29240 27613
Morena 1771852 351046 19.81 59838 54201
Bhind 1634783 431495 26.39 78441 68267
Gwalior 1506531 323060 21.44 57121 50688
Datia 716671 177460 24.76 34639 30961
Shivpuri
1440152
701393
48.70
132344
128140
Guna
1675377
548610
32.75
113106
93448
Tikamgarh
1514906
751932
49.64
136410
119783
Chhatarpur
1785360
1082000
60.60
189771
162911
Panna
1007030
490652
48.72
103276
85913
Sagar
2370285
1446314
61.02
279164
267813
Damoh
1210088
715943
59.16
144318
124395
Satna
2040351
462370
22.66
84996
77154
Rewa
2034659
853588
41.95
168002
173665
Umaria
572901
426732
74.49
85547
80264
Shahdol
1982333
960648
48.46
196110
194691
Sidhi
1949347
1069182
54.85
205837
202341
Neemuch
731838
53108
7.26
9857
9838
Mandsaur
1180171
191040
16.19
37384
31043
Ratlam
1527186
649178
42.51
114324
99574
Ujjain
1887260
401403
21.27
75321
61134
Shajapur
1618310
522548
32.29
97025
98526
Dewas
1343346
293050
21.81
52869
50279
Jhabua
1726803
965306
55.90
159345
137087
Dhar
1822666
353692
19.41
65556
52782
Indore
2203037
332592
15.10
69140
49410
West Nimar
1602133
317288
19.80
58467
45531
Barwani
1114386
240982
21.62
49148
43301
East Nimar
1865199
332691
17.84
61907
54379
Rajgarh
1615944
252173
15.61
43361
38374
Vidisha
1117386
566098
50.66
117377
85503
Bhopal
1820849
946110
51.96
187909
145217
Sehore
1028392
486921
47.35
87417
78713
Raisen
1422009
876176
61.62
151354
132246
Betul
1669091
827406
49.57
144296
122927
Harda
540067
189212
35.04
35048
30265
Hoshangabad
1277605
468497
36.67
87114
83057
Katni
1159880
606098
52.26
126630
113514
Jabalpur
1870905
553787
29.60
116565
109909
Narsimhapur
1022163
462865
45.28
91964
79568
Dindori
577877
462927
80.11
98225
88615
Mandla
830752
627551
75.54
138135
107656
Chhindwara
1988449
530975
26.70
111194
103965
Seoni
1293686
796141
61.54
171001
138929
Balaghat 1524805 763871 50.10 176001 181056MP 65201000 25031399 38.39 4832097 4314644
14
Table 4: District wise Poverty Ratio Estimates based on Central, State and Combined Sample: Rural
Districts
Central Sample
State Sample
Combined
% of Population below poverty line
Rank
% of Population below poverty line
Rank
% of Population below poverty line
Rank
Sheopur
37.6
25
14.0
17
18.0
15
Morena
20.8
14
1.5
4
10.0
4
Bhind
16.4
8
0.8
2
8.2
2
Gwalior
20.5
13
0.0
1
8.9
3
Datia
14.7
6
11.4
13
13.1
9
Shivpuri
38.7
26
7.2
10
20.8
17
Guna
16.6
9
8.1
11
11.7
7
Tikamgarh
44.1
29
32.5
33
32.6
30
Chhatarpur
52.8
34
38.3
37
40.8
40
Panna
49.6
32
48.4
42
43.3
43
Sagar
55.7
37
11.2
12
29.1
27
Damoh
49.0
31
26.1
28
34.5
32
Satna
19.8
12
41.5
38
26.4
23
Rewa
43.1
28
32.3
32
31.0
28
Umaria
76.4
45
31.2
31
48.4
44
Shahdol
64.4
42
50.3
43
55.3
45
Sidhi
57.6
39
26.5
29
39.8
38
Neemuch
0.2
1
21.7
24
4.5
1
Mandsaur
15.5
7
17.3
20
14.4
11
Ratlam
17.1
10
22.1
26
11.8
8
Ujjain
28.9
17
22.1
25
23.3
20
Shajapur
29.0
18
7.0
9
16.9
13
Dewas
17.7
11
13.5
15
14.0
10
Jhabua
56.9
38
18.8
21
32.3
29
Dhar
23.9
16
14.5
18
17.2
14
Indore
21.8
15
1.0
3
11.2
6
West Nimar
14.1
5
41.6
39
21.7
18
Barwani
6.3
3
64.0
44
29.0
26
East Nimar
4.7
2
35.7
35
16.6
12
Rajgarh
11.9
4
16.1
19
11.2
5
Vidisha
51.3
33
19.9
23
33.0
31
Bhopal
34.5
21
43.8
40
37.5
36
Sehore
39.1
27
6.2
7
20.6
16
Raisen
58.1
40
19.3
22
37.0
35
Betul
53.7
36
36.0
36
42.9
42
Harda
37.2
24
47.7
41
40.4
39
Hoshangabad
37.2
23
13.1
14
24.0
22
Katni
48.9
30
35.1
34
36.5
34
Jabalpur
33.3
20
27.8
30
28.0
25
Narsimhapur
36.6
22
13.8
16
23.3
19
Dindori
72.0
43
6.7
8
39.5
37
Mandla
73.7
44
0.0
1
42.9
41
Chhindwara
30.9
19
23.9
27
23.5
21
Seoni
59.9
41
4.4
5
34.9
33
Balaghat
53.5
35
5.9
6
27.0
24
MP
36.8
25
21.9
26.3
15
Table 5: District wise Poverty Ratio Estimates based on Central, State and Combined Sample: Urban
Districts
Central Sample
State Sample
Combined
% of Population below poverty line
Rank
% of Population below poverty line
Rank
% of Population below poverty line
Rank
Sheopur
49.2
22
40.4
24
44.7
23
Morena
42.1
13
18.7
5
30.8
7
Bhind
69.1
43
32.0
18
53.0
31
Gwalior
46.8
18
16.0
3
30.6
5
Datia
64.0
41
60.3
37
61.2
38
Shivpuri
77.4
45
24.2
9
54.3
34
Guna
58.4
36
14.0
2
38.2
14
Tikamgarh
58.3
35
45.7
29
50.8
27
Chhatarpur
62.2
40
78.3
44
77.2
45
Panna
48.2
20
64.9
41
62.2
39
Sagar
67.5
42
60.3
38
63.5
40
Damoh
70.1
44
28.8
13
48.3
25
Satna
45.0
16
38.0
22
44.0
21 Rewa
46.5
17
51.0
32
53.3
32 Umaria
20.9
5
46.0
30
42.5
18 Shahdol
12.6
1
31.6
17
30.8
6 Sidhi
19.4
3
22.4
8
23.3
2 Neemuch 32.7 8 20.6 6 27.9 4
Mandsaur 18.0 2 45.1 28 42.4 17 Ratlam 61.7 39 35.9 20 54.5 35 Ujjain 25.4 6 25.2 11 25.7 3
Shajapur 48.0 19 39.2 23 40.9 15
Dewas 53.4 27 69.9 42 67.0 41
Jhabua
42.3
14
42.3
25
45.5
24
Dhar
44.5
15
53.8
34
53.5
33
Indore
20.2
4
21.0
7
20.9
1
West Nimar
54.9
29
76.5
43
70.6
43
Barwani
58.0
33
55.1
35
55.7
36
East Nimar
37.7
11
43.5
26
41.0
16
Rajgarh
25.9
7
52.7
33
49.0
26
Vidisha
56.8
31
61.4
40
61.1
37
Bhopal
34.8
10
28.7
12
34.6
11
Sehore
48.5
21
30.4
15
44.1
22
Raisen
50.9
24
60.7
39
67.5
42
Betul
54.1
28
36.5
21
43.9
20
Harda
50.6
23
49.6
31
52.7
29
Hoshangabad
39.3
12
57.1
36
50.8
28
Katni
56.9
32
44.5
27
52.9
30
Jabalpur
33.9
9
30.8
16
32.6
9
Narsimhapur
58.1
34
29.6
14
36.8
13
Dindori
55.8
30
32.7
19
43.4
19
Mandla
52.8
26
18.2
4
33.2
10
Chhindwara
60.1
38
80.0
45
76.4
44
Seoni
59.8
37
9.0
1
36.1
12
Balaghat
52.3
25
24.6
10
31.7
8
MP
42.7
41.0
44.0

16
Table 6: District wise Poverty Ratio Estimates based on Central, State and Combined Sample: Total
Districts Central Sample State Sample Combined % of Population below poverty line
Rank % of Population below poverty line
Rank % of Population below poverty line
Rank
Sheopur 39.5 24 7.8 4 22.0 7
Morena 23.9 9 8.0 5 14.9 2
Bhind 33.1 16 13.1 10 22.6 9
Gwalior 34.7 19 8.6 7 20.3 6
Datia 20.9 8 27.0 25 24.3 11
Shivpuri 46.1 29 9.1 8 26.1 16
Guna 26.0 12 12.1 9 18.6 4
Tikamgarh
45.4
28
33.4
32
38.1
32
Chhatarpur
53.9
38
47.1
44
49.9
45
Panna
49.4
30
44.4
41
46.5
42
Sagar
59.1
41
29.5
27
42.0
37
Damoh
51.7
33
19.6
18
37.0
30
Satna
25.1
11
35.8
37
30.2
22
Rewa
43.4
27
26.8
24
34.8
26
Umaria
71.6
43
22.1
21
47.1
43
Shahdol
51.0
32
41.7
39
45.5
41
Sidhi
51.7
34
18.1
16
37.2
31
Neemuch
7.3
1
14.8
14
11.8
1
Mandsaur
15.9
5
23.1
23
20.0
5
Ratlam
33.7
18
20.3
19
27.2
18
Ujjain
27.5
14
22.2
22
24.4
13
Shajapur
31.9
15
19.5
17
24.5
14
Dewas
27.2
13
32.9
31
30.2
21
Jhabua
55.8
39
13.5
11
34.0
24
Dhar
25.0
10
20.4
20
22.5
8
Indore
20.7
7
14.3
13
17.7
3
West Nimar
18.8
6
40.6
38
29.9
20
Barwani
11.1
2
50.5
4
34.3
25
East Nimar
14.2
4
34.0
5
24.4
12
Rajgarh
13.5
3
32.5
10
23.9
10
Vidisha
52.4
35
30.4
7
40.4
35
Bhopal
34.7
20
35.3
25
35.1
28
Sehore
40.5
26
13.7
8
26.2
17
Raisen
57.1
40
43.1
9
48.5
44
Betul
53.8
37
35.6
32
43.1
40
Harda
39.5
25
46.0
44
43.0
39
Hoshangabad
38.1
22
33.6
41
36.0
29
Katni
50.4
31
30.4
27
40.2
34
Jabalpur
33.5
17
27.9
18
30.3
23
Narsimhapur
39.2
23
15.8
37
26.1
15
Dindori
71.8
44
5.3
24
39.6
33
Mandla
72.5
45
3.0
21
42.0
38
Chhindwara
37.3
21
44.4
39
41.3
36
Seoni
59.9
42
4.8
16
35.0
27
Balaghat
53.4
36
8.4
14
27.8
19
MP
38.2
26.1
31.7
17
Table 7: District wise Poverty Ratio Estimates based on Central, State and Combined Sample (After MPCE Neutralization using Average MPCE at State Level for State Sample): Rural
Districts Central Sample State Sample Combined % of
Population below poverty
line
Rank % of Population
below poverty line
Rank % of Population below poverty
line
Rank
Sheopur 37.6 25 14.0 11 24.4 15
Morena 20.8 14 2.6 4 11.4 3
Bhind
16.4
8
7.7
6
11.9
4
Gwalior
20.5
13
2.1
3
10.1
1
Datia
14.7
6
26.9
21
20.7
11
Shivpuri
38.7
26
12.2
9
24.0
14
Guna
16.6
9
13.1
10
14.9
5
Tikamgarh
44.1
29
42.5
33
43.4
35
Chhatarpur
52.8
34
44.3
36
48.4
39
Panna
49.6
32
60.7
43
55.7
42
Sagar
55.7
37
21.7
17
38.0
26
Damoh
49.0
31
32.7
28
42.1
31
Satna
19.8
12
52.9
40
35.4
24
Rewa
43.1
28
39.4
30
41.3
30
Umaria
76.4
45
60.2
42
69.7
45
Shahdol
64.4
42
58.6
41
61.6
44
Sidhi
57.6
39
42.3
32
51.0
41
Neemuch
0.2
1
27.5
24
15.3
6
Mandsaur
15.5
7
21.8
18
18.9
9
Ratlam
17.1
10
36.7
29
26.7
16
Ujjain
28.9
17
29.5
25
29.3
19
Shajapur
29.0
18
10.4
8
19.8
10
Dewas
17.7
11
19.6
14
18.6
8
Jhabua
56.9
38
27.3
23
42.5
32
Dhar
23.9
16
19.9
15
21.9
12
Indore
21.8
15
1.0
2
11.2
2
West Nimar
14.1
5
49.4
39
31.0
22
Barwani
6.3
3
75.4
45
43.2
34
East Nimar
4.7
2
43.3
34
23.6
13
Rajgarh
11.9
4
24.4
19
16.9
7
Vidisha
51.3
33
31.3
26
41.1
29
Bhopal
34.5
21
45.3
37
40.3
28
Sehore
39.1
27
17.1
12
28.5
18
Raisen
58.1
40
27.3
22
43.8
36
Betul
53.7
36
41.3
31
47.5
38
Harda
37.2
24
75.1
44
56.9
43
Hoshangabad
37.2
23
21.0
16
30.2
20
Katni
48.9
30
45.4
38
47.2
37
Jabalpur
33.3
20
44.2
35
38.9
27
Narsimhapur
36.6
22
19.4
13
27.9
17
Dindori
72.0
43
25.1
20
49.4
40
Mandla
73.7
44
0.0
1
42.9
33
Chhindwara
30.9
19
32.1
27
31.4
23
Seoni
59.9
41
6.2
5
35.7
25
Balaghat
53.5
35
10.0
7
30.4
21
MP
36.8
25
29.8
33.4
18
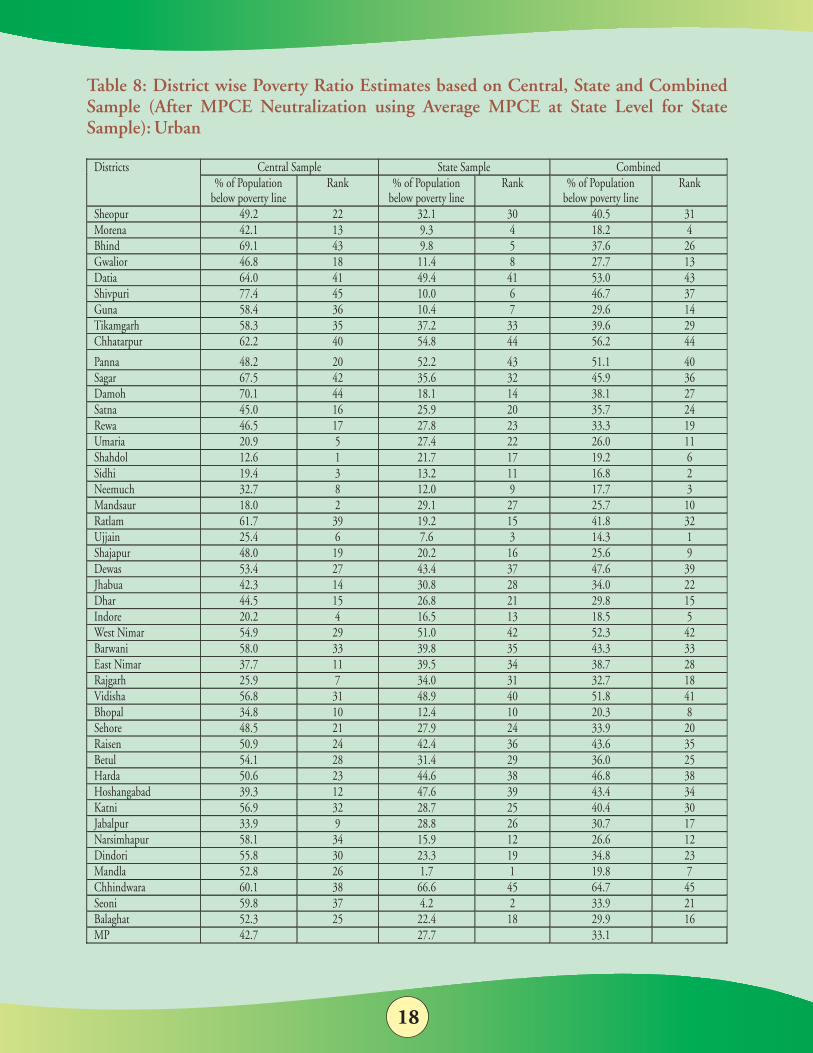
Table 8: District wise Poverty Ratio Estimates based on Central, State and Combined Sample (After MPCE Neutralization using Average MPCE at State Level for State Sample): Urban
Districts
Central Sample
State Sample
Combined
% of Population below poverty line
Rank
% of Population below poverty line
Rank
% of Population below poverty line
Rank
Sheopur
49.2
22
32.1
30
40.5
31
Morena
42.1
13
9.3
4
18.2
4
Bhind
69.1
43
9.8
5
37.6
26
Gwalior
46.8
18
11.4
8
27.7
13
Datia
64.0
41
49.4
41
53.0
43
Shivpuri
77.4
45
10.0
6
46.7
37
Guna
58.4
36
10.4
7
29.6
14
Tikamgarh
58.3
35
37.2
33
39.6
29
Chhatarpur
62.2
40
54.8
44
56.2
44
Panna
48.2
20
52.2
43
51.1
40
Sagar
67.5
42
35.6
32
45.9
36
Damoh
70.1
44
18.1
14
38.1
27
Satna
45.0
16
25.9
20
35.7
24
Rewa
46.5
17
27.8
23
33.3
19
Umaria
20.9
5
27.4
22
26.0
11
Shahdol
12.6
1
21.7
17
19.2
6
Sidhi
19.4
3
13.2
11
16.8
2
Neemuch
32.7
8
12.0
9
17.7
3
Mandsaur
18.0
2
29.1
27
25.7
10
Ratlam
61.7
39
19.2
15
41.8
32
Ujjain
25.4
6
7.6
3
14.3
1
Shajapur
48.0
19
20.2
16
25.6
9
Dewas
53.4
27
43.4
37
47.6
39
Jhabua
42.3
14
30.8
28
34.0
22
Dhar
44.5
15
26.8
21
29.8
15
Indore
20.2
4
16.5
13
18.5
5
West Nimar
54.9
29
51.0
42
52.3
42
Barwani
58.0
33
39.8
35
43.3
33
East Nimar
37.7
11
39.5
34
38.7
28
Rajgarh
25.9
7
34.0
31
32.7
18
Vidisha
56.8
31
48.9
40
51.8
41
Bhopal
34.8
10
12.4
10
20.3
8
Sehore
48.5
21
27.9
24
33.9
20
Raisen
50.9
24
42.4
36
43.6
35
Betul
54.1
28
31.4
29
36.0
25
Harda
50.6
23
44.6
38
46.8
38
Hoshangabad
39.3
12
47.6
39
43.4
34
Katni
56.9
32
28.7
25
40.4
30
Jabalpur
33.9
9
28.8
26
30.7
17
Narsimhapur
58.1
34
15.9
12
26.6
12
Dindori
55.8
30
23.3
19
34.8
23
Mandla
52.8
26
1.7
1
19.8
7
Chhindwara
60.1
38
66.6
45
64.7
45
Seoni
59.8
37
4.2
2
33.9
21
Balaghat
52.3
25
22.4
18
29.9
16
MP
42.7
27.7
33.1
19
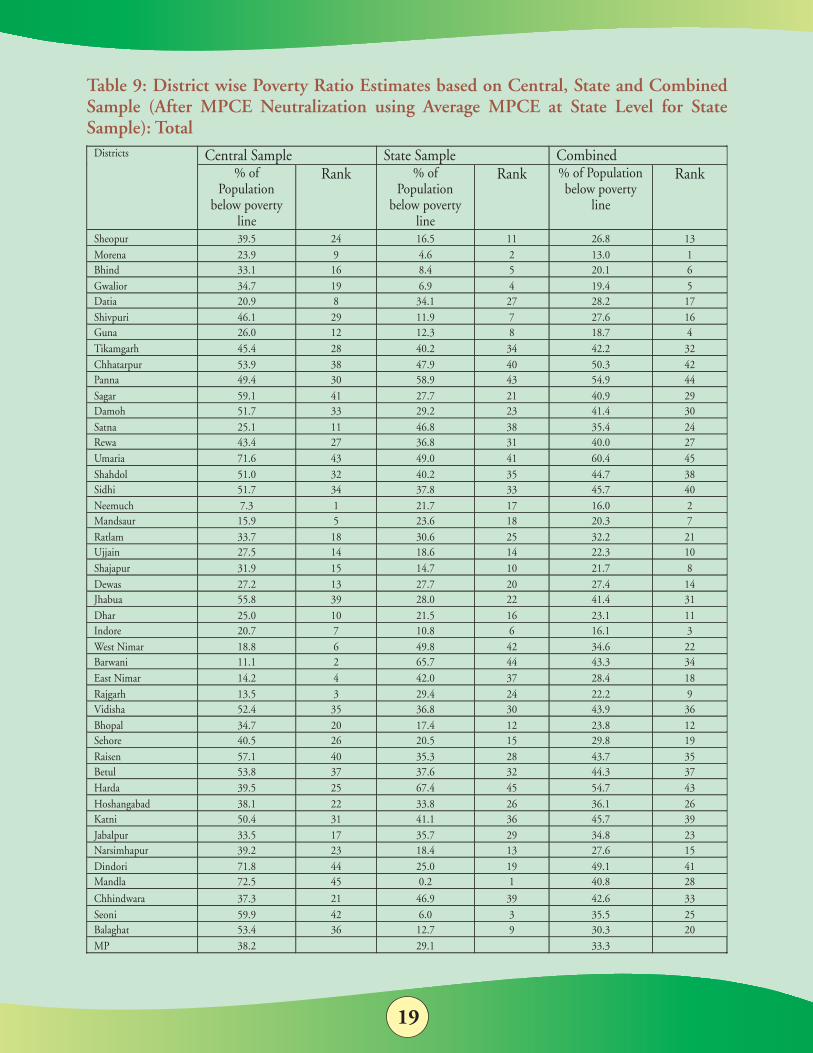
Table 9: District wise Poverty Ratio Estimates based on Central, State and Combined Sample (After MPCE Neutralization using Average MPCE at State Level for State Sample): Total
Districts
Central Sample
State Sample
Combined
% of Population
below poverty line
Rank
% of Population
below poverty line
Rank
% of Population below poverty
line
Rank
Sheopur
39.5
24
16.5
11
26.8
13
Morena
23.9
9
4.6
2
13.0
1
Bhind
33.1
16
8.4
5
20.1
6
Gwalior
34.7
19
6.9
4
19.4
5
Datia
20.9
8
34.1
27
28.2
17
Shivpuri
46.1
29
11.9
7
27.6
16
Guna
26.0
12
12.3
8
18.7
4
Tikamgarh
45.4
28
40.2
34
42.2
32
Chhatarpur
53.9
38
47.9
40
50.3
42
Panna
49.4
30
58.9
43
54.9
44
Sagar
59.1
41
27.7
21
40.9
29
Damoh
51.7
33
29.2
23
41.4
30
Satna
25.1
11
46.8
38
35.4
24
Rewa
43.4
27
36.8
31
40.0
27
Umaria
71.6
43
49.0
41
60.4
45
Shahdol
51.0
32
40.2
35
44.7
38
Sidhi
51.7
34
37.8
33
45.7
40
Neemuch
7.3
1
21.7
17
16.0
2
Mandsaur
15.9
5
23.6
18
20.3
7
Ratlam
33.7
18
30.6
25
32.2
21
Ujjain
27.5
14
18.6
14
22.3
10
Shajapur
31.9
15
14.7
10
21.7
8
Dewas
27.2
13
27.7
20
27.4
14
Jhabua
55.8
39
28.0
22
41.4
31
Dhar
25.0
10
21.5
16
23.1
11
Indore
20.7
7
10.8
6
16.1
3
West Nimar
18.8
6
49.8
42
34.6
22
Barwani
11.1
2
65.7
44
43.3
34
East Nimar
14.2
4
42.0
37
28.4
18
Rajgarh
13.5
3
29.4
24
22.2
9
Vidisha
52.4
35
36.8
30
43.9
36
Bhopal
34.7
20
17.4
12
23.8
12
Sehore
40.5
26
20.5
15
29.8
19
Raisen
57.1
40
35.3
28
43.7
35
Betul
53.8
37
37.6
32
44.3
37
Harda
39.5
25
67.4
45
54.7
43
Hoshangabad
38.1
22
33.8
26
36.1
26
Katni
50.4
31
41.1
36
45.7
39
Jabalpur
33.5
17
35.7
29
34.8
23
Narsimhapur
39.2
23
18.4
13
27.6
15
Dindori
71.8
44
25.0
19
49.1
41
Mandla
72.5
45
0.2
1
40.8
28
Chhindwara
37.3
21
46.9
39
42.6
33
Seoni
59.9
42
6.0
3
35.5
25
Balaghat
53.4
36
12.7
9
30.3
20
MP
38.2
29.1
33.3
20
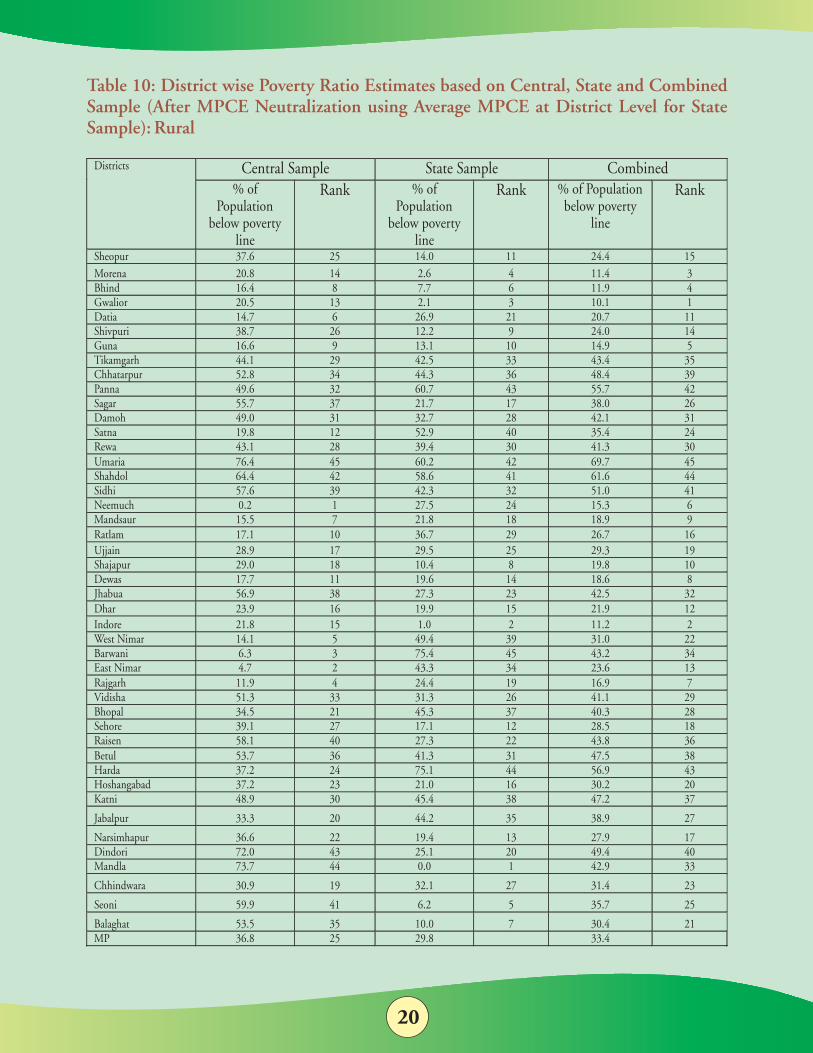
Table 10: District wise Poverty Ratio Estimates based on Central, State and Combined Sample (After MPCE Neutralization using Average MPCE at District Level for State Sample): Rural
Districts Central Sample State Sample Combined
% of Population
below poverty line
Rank % of Population
below poverty line
Rank % of Population below poverty
line
Rank
Sheopur 37.6 25 14.0 11 24.4 15
Morena 20.8 14 2.6 4 11.4 3
Bhind 16.4 8 7.7 6 11.9 4
Gwalior 20.5 13 2.1 3 10.1 1
Datia
14.7
6
26.9
21
20.7
11
Shivpuri
38.7
26
12.2
9
24.0
14
Guna
16.6
9
13.1
10
14.9
5
Tikamgarh
44.1
29
42.5
33
43.4
35
Chhatarpur
52.8
34
44.3
36
48.4
39
Panna
49.6
32
60.7
43
55.7
42
Sagar
55.7
37
21.7
17
38.0
26
Damoh
49.0
31
32.7
28
42.1
31
Satna
19.8
12
52.9
40
35.4
24
Rewa
43.1
28
39.4
30
41.3
30
Umaria
76.4
45
60.2
42
69.7
45
Shahdol
64.4
42
58.6
41
61.6
44
Sidhi
57.6
39
42.3
32
51.0
41
Neemuch
0.2
1
27.5
24
15.3
6
Mandsaur
15.5
7
21.8
18
18.9
9
Ratlam
17.1
10
36.7
29
26.7
16
Ujjain
28.9
17
29.5
25
29.3
19
Shajapur
29.0
18
10.4
8
19.8
10
Dewas
17.7
11
19.6
14
18.6
8
Jhabua
56.9
38
27.3
23
42.5
32
Dhar
23.9
16
19.9
15
21.9
12
Indore
21.8
15
1.0
2
11.2
2
West Nimar
14.1
5
49.4
39
31.0
22
Barwani
6.3
3
75.4
45
43.2
34
East Nimar
4.7
2
43.3
34
23.6
13
Rajgarh
11.9
4
24.4
19
16.9
7
Vidisha
51.3
33
31.3
26
41.1
29
Bhopal
34.5
21
45.3
37
40.3
28
Sehore
39.1
27
17.1
12
28.5
18
Raisen
58.1
40
27.3
22
43.8
36
Betul
53.7
36
41.3
31
47.5
38
Harda
37.2
24
75.1
44
56.9
43
Hoshangabad
37.2
23
21.0
16
30.2
20
Katni
48.9
30
45.4
38
47.2
37
Jabalpur
33.3
20
44.2
35
38.9
27
Narsimhapur
36.6
22
19.4
13
27.9
17
Dindori
72.0
43
25.1
20
49.4
40
Mandla
73.7
44
0.0
1
42.9
33
Chhindwara
30.9
19
32.1
27
31.4
23
Seoni
59.9
41
6.2
5
35.7
25
Balaghat
53.5
35
10.0
7
30.4
21
MP
36.8
25
29.8
33.4
21
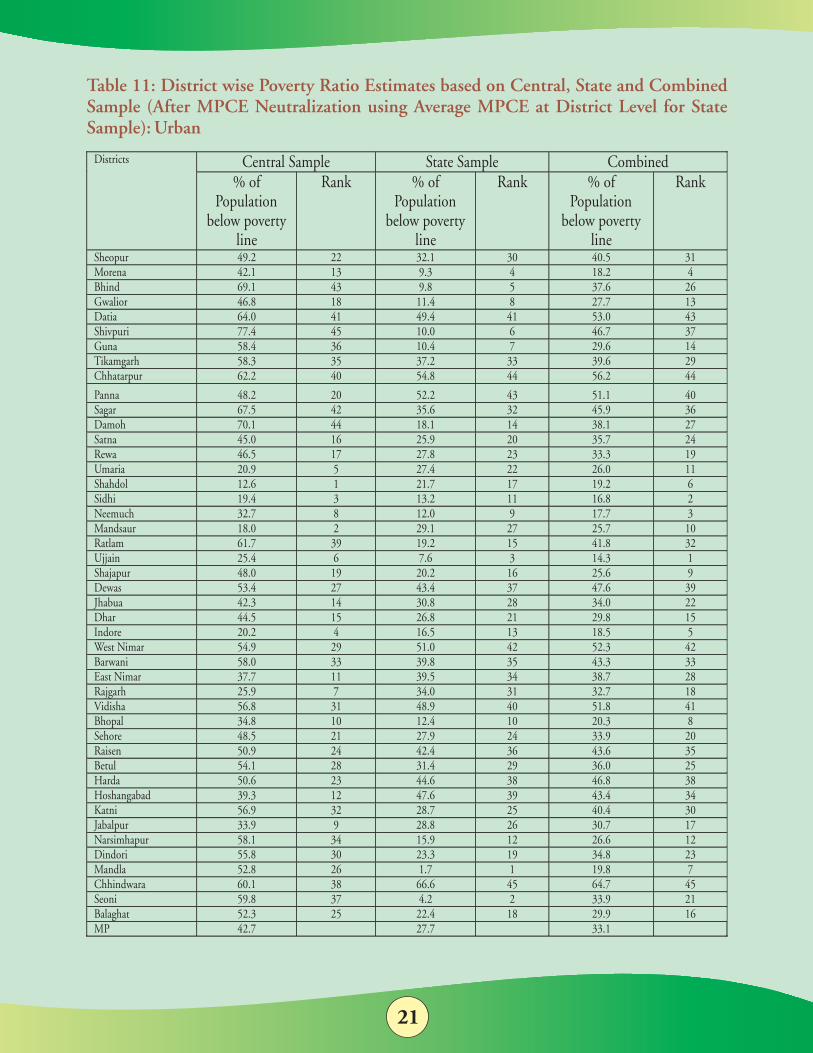
Table 11: District wise Poverty Ratio Estimates based on Central, State and Combined Sample (After MPCE Neutralization using Average MPCE at District Level for State Sample): Urban
Districts
Central Sample
State Sample
Combined
% of Population
below poverty line
Rank
% of Population
below poverty line
Rank
% of Population
below poverty line
Rank
Sheopur
49.2
22
32.1
30
40.5
31 Morena
42.1
13
9.3
4
18.2
4
Bhind
69.1
43
9.8
5
37.6
26 Gwalior
46.8
18
11.4
8
27.7
13
Datia 64.0 41 49.4 41 53.0 43 Shivpuri 77.4 45 10.0 6 46.7 37 Guna 58.4 36 10.4 7 29.6 14 Tikamgarh 58.3 35 37.2 33 39.6 29
Chhatarpur 62.2 40 54.8 44 56.2 44
Panna 48.2 20 52.2 43 51.1 40
Sagar
67.5
42
35.6
32
45.9
36
Damoh
70.1
44
18.1
14
38.1
27
Satna
45.0
16
25.9
20
35.7
24
Rewa
46.5
17
27.8
23
33.3
19
Umaria
20.9
5
27.4
22
26.0
11
Shahdol
12.6
1
21.7
17
19.2
6
Sidhi
19.4
3
13.2
11
16.8
2
Neemuch
32.7
8
12.0
9
17.7
3
Mandsaur
18.0
2
29.1
27
25.7
10
Ratlam
61.7
39
19.2
15
41.8
32
Ujjain
25.4
6
7.6
3
14.3
1
Shajapur
48.0
19
20.2
16
25.6
9
Dewas
53.4
27
43.4
37
47.6
39
Jhabua
42.3
14
30.8
28
34.0
22
Dhar
44.5
15
26.8
21
29.8
15
Indore
20.2
4
16.5
13
18.5
5
West Nimar
54.9
29
51.0
42
52.3
42
Barwani
58.0
33
39.8
35
43.3
33
East Nimar
37.7
11
39.5
34
38.7
28
Rajgarh
25.9
7
34.0
31
32.7
18
Vidisha
56.8
31
48.9
40
51.8
41
Bhopal
34.8
10
12.4
10
20.3
8
Sehore
48.5
21
27.9
24
33.9
20
Raisen
50.9
24
42.4
36
43.6
35
Betul
54.1
28
31.4
29
36.0
25
Harda
50.6
23
44.6
38
46.8
38
Hoshangabad
39.3
12
47.6
39
43.4
34
Katni
56.9
32
28.7
25
40.4
30
Jabalpur
33.9
9
28.8
26
30.7
17
Narsimhapur
58.1
34
15.9
12
26.6
12
Dindori
55.8
30
23.3
19
34.8
23
Mandla
52.8
26
1.7
1
19.8
7
Chhindwara
60.1
38
66.6
45
64.7
45
Seoni
59.8
37
4.2
2
33.9
21
Balaghat
52.3
25
22.4
18
29.9
16
MP
42.7
27.7
33.1
22
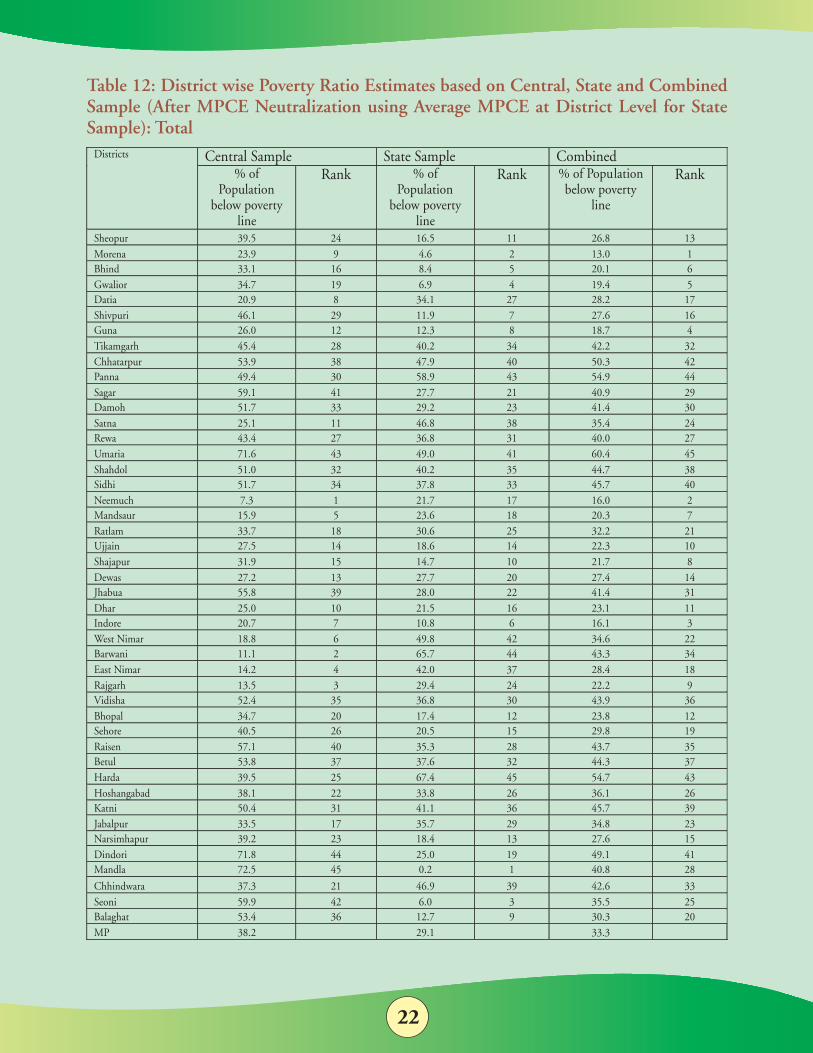
Table 12: District wise Poverty Ratio Estimates based on Central, State and Combined Sample (After MPCE Neutralization using Average MPCE at District Level for State Sample): Total
Districts
Central Sample
State Sample
Combined
% of Population
below poverty line
Rank
% of Population
below poverty line
Rank
% of Population below poverty
line
Rank
Sheopur
39.5
24
16.5
11
26.8
13
Morena
23.9
9
4.6
2
13.0
1
Bhind
33.1
16
8.4
5
20.1
6
Gwalior
34.7
19
6.9
4
19.4
5
Datia
20.9
8
34.1
27
28.2
17
Shivpuri
46.1
29
11.9
7
27.6
16
Guna
26.0
12
12.3
8
18.7
4
Tikamgarh
45.4
28
40.2
34
42.2
32
Chhatarpur
53.9
38
47.9
40
50.3
42
Panna
49.4
30
58.9
43
54.9
44
Sagar
59.1
41
27.7
21
40.9
29
Damoh
51.7
33
29.2
23
41.4
30
Satna
25.1
11
46.8
38
35.4
24
Rewa
43.4
27
36.8
31
40.0
27
Umaria
71.6
43
49.0
41
60.4
45
Shahdol
51.0
32
40.2
35
44.7
38
Sidhi
51.7
34
37.8
33
45.7
40
Neemuch
7.3
1
21.7
17
16.0
2
Mandsaur
15.9
5
23.6
18
20.3
7
Ratlam
33.7
18
30.6
25
32.2
21
Ujjain
27.5
14
18.6
14
22.3
10
Shajapur
31.9
15
14.7
10
21.7
8
Dewas
27.2
13
27.7
20
27.4
14
Jhabua
55.8
39
28.0
22
41.4
31
Dhar
25.0
10
21.5
16
23.1
11
Indore
20.7
7
10.8
6
16.1
3
West Nimar
18.8
6
49.8
42
34.6
22
Barwani
11.1
2
65.7
44
43.3
34
East Nimar
14.2
4
42.0
37
28.4
18
Rajgarh
13.5
3
29.4
24
22.2
9
Vidisha
52.4
35
36.8
30
43.9
36
Bhopal
34.7
20
17.4
12
23.8
12
Sehore
40.5
26
20.5
15
29.8
19
Raisen
57.1
40
35.3
28
43.7
35
Betul
53.8
37
37.6
32
44.3
37
Harda
39.5
25
67.4
45
54.7
43
Hoshangabad
38.1
22
33.8
26
36.1
26
Katni
50.4
31
41.1
36
45.7
39
Jabalpur
33.5
17
35.7
29
34.8
23
Narsimhapur
39.2
23
18.4
13
27.6
15
Dindori
71.8
44
25.0
19
49.1
41
Mandla
72.5
45
0.2
1
40.8
28
Chhindwara
37.3
21
46.9
39
42.6
33
Seoni
59.9
42
6.0
3
35.5
25
Balaghat
53.4
36
12.7
9
30.3
20
MP
38.2
29.1
33.3
23
While estimating the population living below poverty line district wise distribution of observations by monthly per capita expenditure classes (MPCE classes) were looked into. MPCE class wise range is presented in Annexure 1It is observed from the central sample that in rural areas, district wise number of observations varies from 40 to 120 (Annexure 2). In some districts lower MPCE classes have no observation for example Gwalior, Mandsaur and Ratlam are the districts where lowest MPCE class does not have any observation. The districts of Datia, Guna, Satna, West Nimar, Barwani and East Nimar do not have any observation in lowest two MPCE classes and Neemuch is the district where three lowest categories of MPCE class have no presentation. These three categories represent MPCE less than Rs.320 which is lower than poverty line cut off point of Rs.327.18 paise as set by Planning Commission GOI. Thus number of observation reveals that there is no poverty in district of Neemuch and other districts mentioned above have less poverty which is not true especially in case of West Nimar, Barwani and East Nimar. These observations leads to the conclusion that district wise poverty estimates based on central sample needs to be used cautiously and may be along with other parameters. It also necessitates finding out other alternative to estimate district wise poverty. The state sample also reveals similar type of observations as that of central sample as shown in Annexure 3. In this case also the number of districts, with no observations in lowest category, is 16 in number. In all there are 59 observations in lowest category. The districts with no observations in first two lowest categories are 7 in number. Districts of Sheopur, Morena and Mandla have no observation in first three lowest categories. These facts also reveal that district wise poverty estimates based on state sample also need to be scrutinized properly. The last alternative, to estimate poverty at district level is to use combined sample i. e. central and state sample. On combining central and state sample, the District wise Distribution of observations by MPCE class is given in Annexure 4. This reveals that there are only five districts namely Gwalior, Datia, Guna, Neemuch and West Nimar for which lowest MPCE class does not have any observation. In combined sample all the districts have observation in second and third lowest categories. Thus on combining sample the number of observations has doubled in totality and improvised at category levels. The number of observations in first three MPCE classes is sufficient (i.e. more than 5) in most of the districts except Gwalior and Neemuch having 5 and 4 observations. Thus in case of poverty estimate for these two districts should be used cautiously. Similar situation in respect of sample observation is observed in case of urban area.It reveals that sample size is not sufficient for estimating district wise poverty. Thus the sample size has to be increased in case of NSSO rounds for central and state samples. In case of urban area, the representation of different town classes has to be ensured to have better estimates of urban poverty and sample size is also to be increased.Keeping in view, the Report of Expert Group to Review the Methodology for Estimation of Poverty under the chairmanship of Prof. Suresh Tendulkar to Planning Commission,
24
Government of India, It is necessary to re-estimate district wise poverty. The similar exercise was undertaken as mentioned in this paper. The new cut-off points, as mentioned in the report, are used to estimate the percentage of people living below poverty. These cut-off points are Rs. 408.41 and Rs. 532.26 per capita per month for rural and urban area of the state using mixed reference period instead of uniform reference period.
The estimated proportion of population obtained from combined sample of State and Central after neutralizing MPCE of state level with respect to central at district level is used to revise the estimates of district wise poverty taking over all Rural and Urban poverty for the state as given by Planning Commission Government of India, November 2009. In addition to this following assumption have been made: Assumptions:1. Distribution of Rural and urban Population among districts will be same as estimated from combined sample.2. Using District-wise, Rural and Urban Poverty ratio as calculated from above exercise. The population below poverty line for each district has been calculated.3. Number of BPL Households has been estimated on the basis of (i) assuming Average Household size in the district (ii) assuming Average Household size of BPL families in the district as calculated from combined sample. On comparison of district wise rural poverty and per capita income from agriculture (inclusive of animal husbandry) below and above state average 15 out of 21 are common districts (above the state average of rural poverty) and 17 out of 24 are common in case of below state average of rural poverty. In case of urban poverty, comparison is done per capita income from other than primary sector. It is found that 9 out of 20 districts are common in case of above the state average of urban poverty and 22 out of 25 districts are common in case of below the state average of urban poverty. As poverty is the function of extent of equitable distribution of income among population under consideration. In absence of income distribution data to estimate Gini coefficients/ Lorenz curve etc., which are measures to judge how equitable is income distribution. Thus it seems that estimates of poverty obtained from combined central and state sample with normalization of monthly per capita expenditure at district levels are better as compare to those obtained from individual samples.
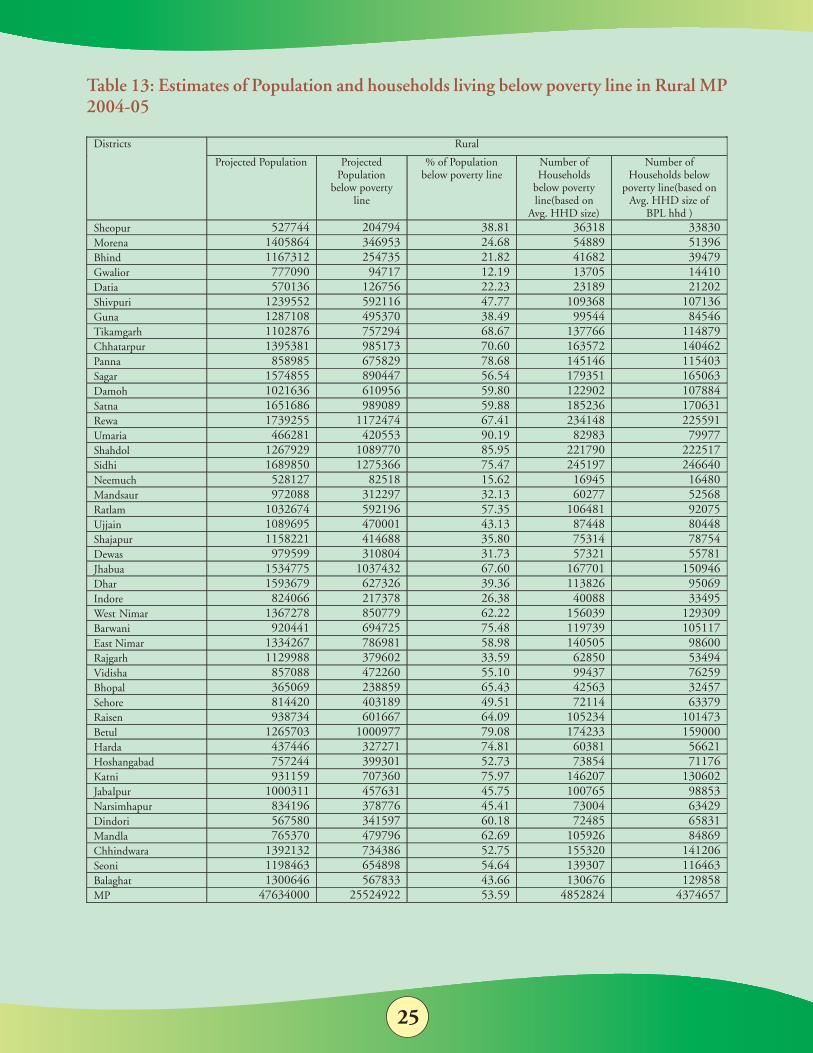
It is estimated that of the total population 65.20 million 31.68 million were below poverty line in 2004-05. In rural Madhya Pradesh during 2004-05, there were 43, 74,657 households living below poverty line and in urban area the number of such households were 10, 69,100. The total number of households living below poverty line were 54, 43,757. The district wise estimates are presented for rural, urban and combined in Table 13 to 15.
25
Table 13: Estimates of Population and households living below poverty line in Rural MP 2004-05
Districts
Rural
Projected Population
Projected Population
below poverty line
% of Population
below poverty line
Number of Households
below poverty line(based on
Avg. HHD size)
Number of Households below
poverty line(based on Avg. HHD size of
BPL hhd )
Sheopur
527744
204794
38.81
36318
33830
Morena
1405864
346953
24.68
54889
51396
Bhind
1167312
254735
21.82
41682
39479
Gwalior
777090
94717
12.19
13705
14410
Datia
570136
126756
22.23
23189
21202
Shivpuri
1239552
592116
47.77
109368
107136
Guna
1287108
495370
38.49
99544
84546
Tikamgarh
1102876
757294
68.67
137766
114879
Chhatarpur
1395381
985173
70.60
163572
140462
Panna
858985
675829
78.68
145146
115403
Sagar
1574855
890447
56.54
179351
165063
Damoh
1021636
610956
59.80
122902
107884
Satna
1651686
989089
59.88
185236
170631
Rewa 1739255
1172474
67.41
234148
225591
Umaria 466281 420553 90.19 82983 79977
Shahdol 1267929 1089770 85.95 221790 222517
Sidhi 1689850 1275366 75.47 245197 246640
Neemuch 528127 82518 15.62 16945 16480 Mandsaur 972088 312297 32.13 60277 52568 Ratlam 1032674 592196 57.35 106481 92075 Ujjain 1089695 470001 43.13 87448 80448 Shajapur 1158221 414688 35.80 75314 78754 Dewas 979599 310804 31.73 57321 55781 Jhabua 1534775 1037432 67.60 167701 150946 Dhar 1593679 627326 39.36 113826 95069 Indore 824066 217378 26.38 40088 33495 West Nimar 1367278 850779 62.22 156039 129309 Barwani
920441 694725 75.48 119739 105117
East Nimar
1334267
786981
58.98
140505
98600
Rajgarh
1129988
379602
33.59
62850
53494 Vidisha
857088
472260
55.10
99437
76259
Bhopal
365069
238859
65.43
42563
32457 Sehore
814420
403189
49.51
72114
63379
Raisen
938734
601667
64.09
105234
101473 Betul
1265703
1000977
79.08
174233
159000
Harda
437446
327271
74.81
60381
56621 Hoshangabad
757244
399301
52.73
73854
71176
Katni
931159
707360
75.97
146207
130602 Jabalpur
1000311
457631
45.75
100765
98853
Narsimhapur
834196
378776
45.41
73004
63429
Dindori
567580
341597
60.18
72485
65831
Mandla
765370
479796
62.69
105926
84869
Chhindwara
1392132
734386
52.75
155320
141206
Seoni
1198463
654898
54.64
139307
116463
Balaghat
1300646
567833
43.66
130676
129858
MP
47634000
25524922
53.59
4852824
4374657
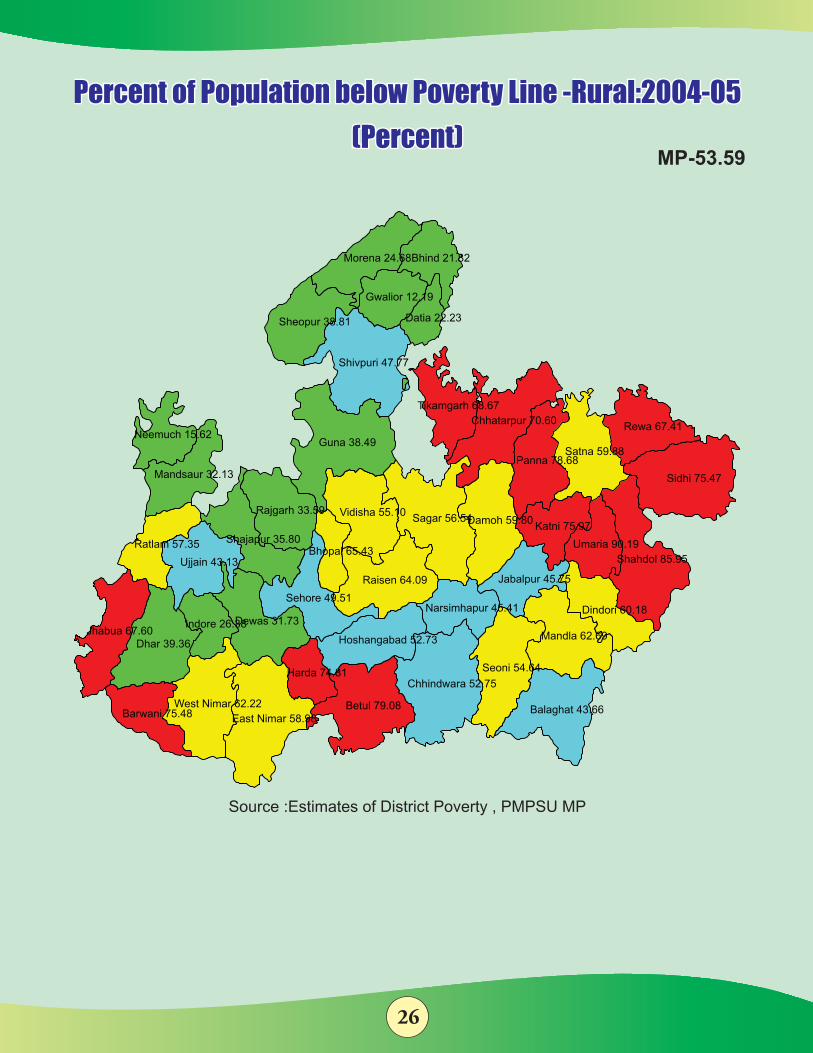
26
Percent of Population below Poverty Line -Rural:2004-05
(Percent)
Percent of Population below Poverty Line -Rural:2004-05
(Percent)MP-53.59
Sagar 56.54
Ujjain 43.13
Ratlam 57.35
Mandsaur 32.13
Neemuch 15.62
Sidhi 75.47
Shahdol 85.95
Umaria 90.19
Rewa 67.41
Sheopur 38.81
Damoh 59.80
Dhar 39.36
Panna 78.68
Chhatarpur 70.60
Tikamgarh 68.67
Guna 38.49
Shivpuri 47.77
Datia 22.23
Gwalior 12.19
Bhind 21.82Morena 24.68
Satna 59.88
Raisen 64.09
Balaghat 43.66
Seoni 54.64
Chhindwara 52.75
Mandla 62.69
Dindori 60.18Narsimhapur 45.41
Jabalpur 45.75
Katni 75.97
Hoshangabad 52.73
Shajapur 35.80
Betul 79.08
Dewas 31.73
Sehore 49.51
Bhopal 65.43
Vidisha 55.10Rajgarh 33.59
East Nimar 58.98Barwani 75.48West Nimar 62.22
Indore 26.38Jhabua 67.60
Harda 74.81
Source :Estimates of District Poverty , PMPSU MP

27
Table 14: Estimates of Population and households living below poverty line in Urban MP 2004-05
Districts
Urban
Projected Population
Projected Population
below poverty line
% of Population
below poverty line
Number of
Households below poverty line(based
on Avg. HHD size)
Number of Households below
poverty line(based on Avg. HHD size of
BPL hhd )
Sheopur
78433
29663
37.82
4927
4802
Morena
365987
60027
16.40
11320
10206
Bhind
467472
202066
43.23
37899
32521
Gwalior
729441
212030
29.07
39551
33924
Datia
146535
71006
48.46
14586
13826
Shivpuri
200601
75965
37.87
15287
13432
Guna
388269
119877
30.87
25699
21289
Tikamgarh
412029
185353
44.99
33382
34550
Chhatarpur
389978
247652
63.50
48837
44900
Panna
148045
82685
55.85
15630
14482
Sagar
795431
376380
47.32
68051
64800
Damoh
188452
73361
38.93
14916
14158
Satna
388666
127129
32.71
22708
19744
Rewa
295404
134857
45.65
23474
21884
Umaria 106620 33487 31.41 8111 8059
Shahdol 714404 138677 19.41 28785 26781
Sidhi 259496 53724 20.70 10668 9660
Neemuch 203711 22838 11.21 4235 4216
Mandsaur 208083 54418 26.15 12068 11271
Ratlam 494512 250501 50.66 43277 39585 Ujjain 797565 167588 21.01 32211 27435 Shajapur 460089 170507 37.06 32749 31615 Dewas 363747 174587 48.00 31158 28962 Jhabua 192028 76469 39.82 15245 13229 Dhar 228987 78277 34.18 14980 13589 Indore 1378971 247180 17.92 53885 37615 West Nimar
234855 147639 62.86 27457 25695
Barwani
193945
105883
54.59
25172
23778
East Nimar
530933
208042
39.18
39370
37367 Rajgarh
485956
229597
47.25
41229
39389
Vidisha
260298
125691
48.29
24233
19628 Bhopal
1455781
289030
19.85
58946
44907
Sehore
213972
71922
33.61
13135
13008 Raisen
483275
237042
49.05
40008
31445
Betul
403389
135010
33.47
23872
21067
Harda
102620
46335
45.15
8721
8085 Hoshangabad
520361
214577
41.24
40136
38306
Katni
228720
130693
57.14
28230
24006
Jabalpur
870594
217143
24.94
43162
39779
Narsimhapur
187966
51598
27.45
11431
10380
Dindori
10297
3740
36.32
790
687
Mandla
65382
15167
23.20
3168
3006
Chhindwara
596317
375711
63.01
76929
72066
Seoni
95223
32753
34.40
7940
6933
Balaghat
224159
54253
24.20
12583
13034
MP
17567000
6158130
35.06
1190148
1069100
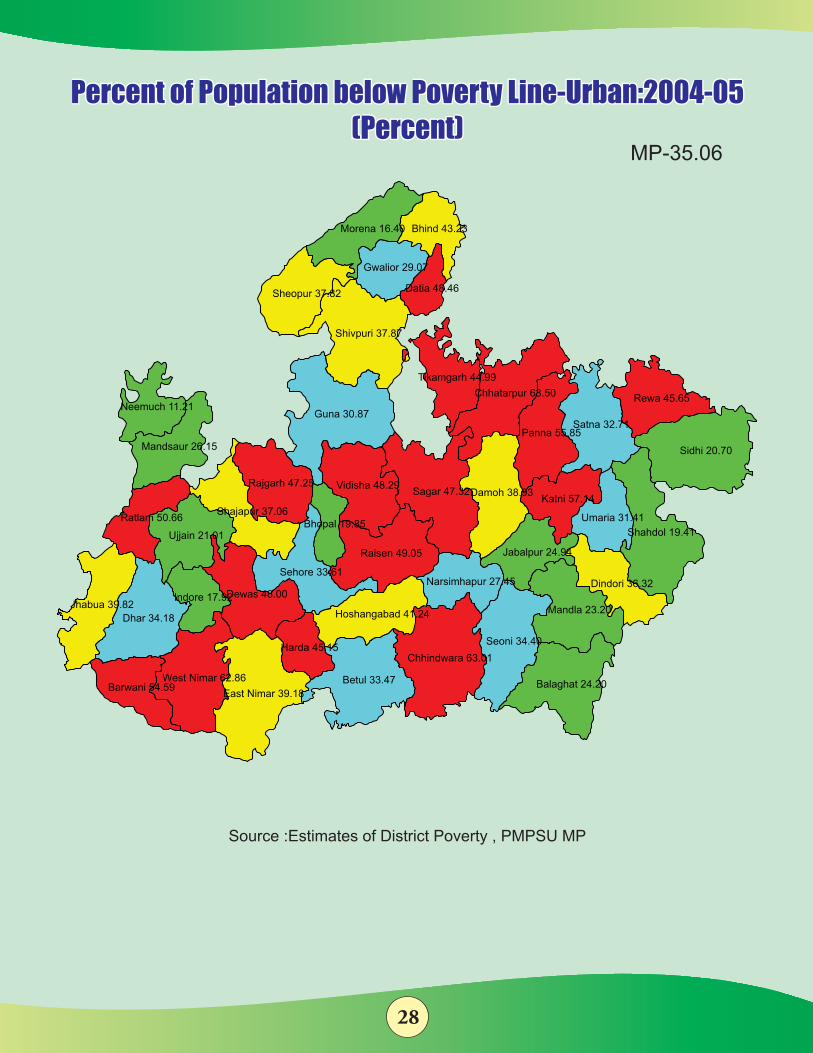
28
Percent of Population below Poverty Line-Urban:2004-05(Percent)
Percent of Population below Poverty Line-Urban:2004-05(Percent)
Sagar 47.32
Ujjain 21.01
Ratlam 50.66
Mandsaur 26.15
Neemuch 11.21
Sidhi 20.70
Shahdol 19.41
Umaria 31.41
Rewa 45.65
Sheopur 37.82
Damoh 38.93
Dhar 34.18
Panna 55.85
Chhatarpur 63.50
Tikamgarh 44.99
Guna 30.87
Shivpuri 37.87
Datia 48.46
Gwalior 29.07
Bhind 43.23Morena 16.40
Satna 32.71
Raisen 49.05
Balaghat 24.20
Seoni 34.40
Chhindwara 63.01
Mandla 23.20
Dindori 36.32Narsimhapur 27.45
Jabalpur 24.94
Katni 57.14
Hoshangabad 41.24
Shajapur 37.06
Betul 33.47
Dewas 48.00
Sehore 33.61
Bhopal 19.85
Vidisha 48.29Rajgarh 47.25
East Nimar 39.18Barwani 54.59
West Nimar 62.86
Indore 17.92Jhabua 39.82
Harda 45.15
Source :Estimates of District Poverty , PMPSU MP
MP-35.06
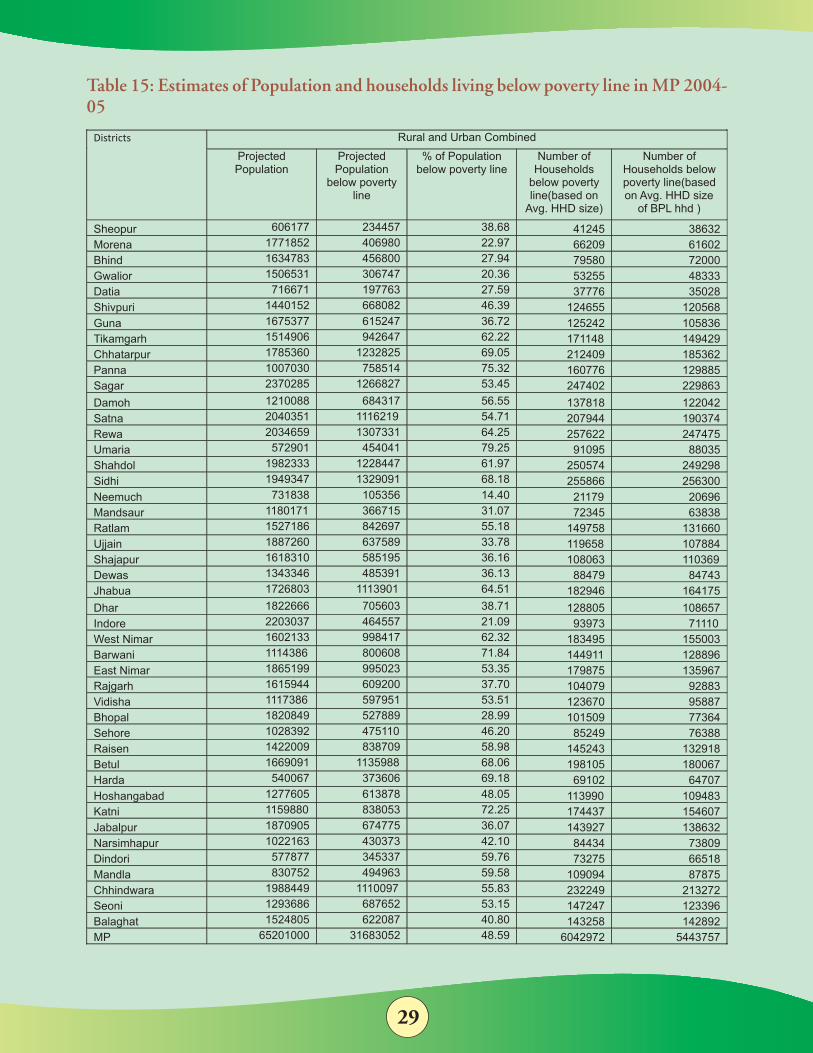
29
Table 15: Estimates of Population and households living below poverty line in MP 2004-05
Districts
Rural and Urban Combined
Projected Population
Projected Population
below poverty line
% of Population below poverty line
Number of
Households below poverty line(based on
Avg. HHD size)
Number of Households below poverty line(based on Avg. HHD size
of BPL hhd )
Sheopur
606177
234457
38.68
41245
38632
Morena
1771852
406980
22.97
66209
61602
Bhind
1634783
456800
27.94
79580
72000
Gwalior
1506531
306747
20.36
53255
48333
Datia
716671
197763
27.59
37776
35028
Shivpuri
1440152
668082
46.39
124655
120568
Guna
1675377
615247
36.72
125242
105836
Tikamgarh
1514906
942647
62.22
171148
149429
Chhatarpur
1785360
1232825
69.05
212409
185362
Panna
1007030
758514
75.32
160776
129885
Sagar
2370285
1266827
53.45
247402
229863
Damoh
1210088
684317
56.55
137818
122042
Satna
2040351
1116219
54.71
207944
190374
Rewa 2034659
1307331
64.25
257622
247475
Umaria 572901
454041
79.25
91095
88035
Shahdol 1982333 1228447 61.97 250574 249298
Sidhi 1949347 1329091 68.18 255866 256300
Neemuch 731838 105356 14.40 21179 20696
Mandsaur 1180171 366715 31.07 72345 63838
Ratlam 1527186 842697 55.18 149758 131660
Ujjain 1887260 637589 33.78 119658 107884
Shajapur 1618310 585195 36.16 108063 110369 Dewas 1343346 485391 36.13 88479 84743 Jhabua 1726803 1113901 64.51 182946 164175 Dhar
1822666 705603 38.71 128805 108657 Indore
2203037 464557 21.09 93973 71110 West Nimar
1602133
998417
62.32
183495
155003
Barwani
1114386
800608
71.84 144911
128896
East Nimar
1865199
995023
53.35
179875
135967
Rajgarh
1615944
609200
37.70
104079
92883
Vidisha
1117386
597951
53.51
123670
95887
Bhopal
1820849
527889
28.99
101509
77364 Sehore
1028392
475110
46.20
85249
76388
Raisen
1422009
838709
58.98
145243
132918 Betul
1669091
1135988
68.06
198105
180067
Harda
540067
373606
69.18
69102
64707
Hoshangabad
1277605
613878
48.05
113990
109483
Katni
1159880
838053
72.25
174437
154607
Jabalpur
1870905
674775
36.07
143927
138632
Narsimhapur
1022163
430373
42.10
84434
73809
Dindori
577877
345337
59.76
73275
66518
Mandla
830752
494963
59.58
109094
87875
Chhindwara
1988449
1110097
55.83
232249
213272
Seoni
1293686
687652
53.15
147247
123396
Balaghat
1524805
622087
40.80
143258
142892
MP
65201000
31683052
48.59
6042972
5443757
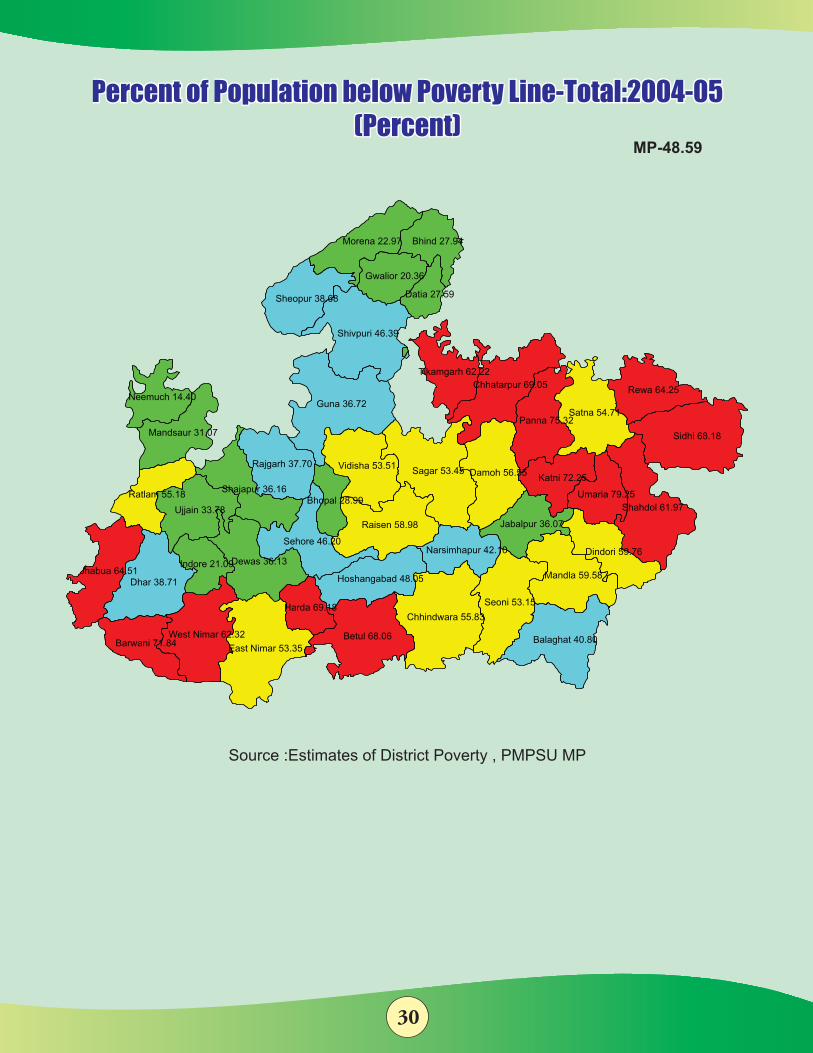
30
Percent of Population below Poverty Line-Total:2004-05(Percent)
Percent of Population below Poverty Line-Total:2004-05(Percent)
MP-48.59
Sagar 53.45
Ujjain 33.78
Ratlam 55.18
Mandsaur 31.07
Neemuch 14.40
Sidhi 68.18
Shahdol 61.97
Umaria 79.25
Rewa 64.25
Sheopur 38.68
Damoh 56.55
Dhar 38.71
Panna 75.32
Chhatarpur 69.05
Tikamgarh 62.22
Guna 36.72
Shivpuri 46.39
Datia 27.59
Gwalior 20.36
Bhind 27.94Morena 22.97
Satna 54.71
Raisen 58.98
Balaghat 40.80
Seoni 53.15
Chhindwara 55.83
Mandla 59.58
Dindori 59.76Narsimhapur 42.10
Jabalpur 36.07
Katni 72.25
Hoshangabad 48.05
Shajapur 36.16
Betul 68.06
Dewas 36.13
Sehore 46.20
Bhopal 28.99
Vidisha 53.51Rajgarh 37.70
East Nimar 53.35Barwani 71.84
West Nimar 62.32
Indore 21.09Jhabua 64.51
Harda 69.18
Source :Estimates of District Poverty , PMPSU MP
31
The problem of high proportion of population living below poverty line results in various problems such as hunger, malnutrition, low level of education etc. Both central and state governments have taken many direct and indirect initiatives to reduce poverty, some of these initiatives are Mahatama Gandhi National Rural Employment Guarantee Act, Better irrigation facilities under Balram Talab, Percolation Tanks, minor, medium and major irrigation projects, Deen Dyal Antodaya Upchar Yojana and many other. These schemes have started showing the impact on income thus reducing poverty.
Conclusions: For understanding of the level of living prevailing in any part of the state and country, district-level estimates of poverty are necessary along with other socio economic indicators. This paper may to cater to the need for generation of district-level estimates of poverty for the state.
In the NSS 2004-05 survey, in a good number of cases, low sample size resulted in high RSE of the district-level estimates especially in the urban sector and same is true in case of state sample. To arrive at more reliable and conclusive district- level estimates, the number of sample observations needs to be suitably augmented at district level for rural and urban areas. In case of urban areas, the representation of different type of urban area (i.e. different town classes) is to be ensured in future surveys for estimating poverty at district level. Combined Central and State Sample may provide more robust and conclusive district- level estimates.
ReferencesAhluwalia, Montek S (2000): “Economic Performance of States in Post-Reform Period”, Economic & Political Weekly, 6 May.Bhanumurthy, N R and A Mitra (2004): “Economic Growth, Poverty and Reforms in Indian States”, DEG, Working Paper Series No E/247/2004.Deaton, A and J Dreze (2002): “Poverty and Inequality in India: A Re-examination”, Economic & Political Weekly, 3 September.Ghosh, B, S Marjit and C Neogi (1998): “Economic Growth and Regional Divergence in India, 1960 to 1995”, Economic & Political Weekly, Vol 33, No 26.Himanshu (2007): “Recent Trends in Poverty and Inequality: Some Preliminary Results”, Economic & Political Weekly, 10 February.Krishna, K L (2004): “Patterns and Determinants of Economic Growth in Indian States”, ICRIER, Discussion Paper No 144, New Delhi.Report on Small Area Estimation of Socio-Economic Variables-November (2000): A Study conducted by Indian Statistical Institute in Collaboration with National Sample Survey Organization.
32
Sastry, N S (2003): “District Level Poverty Estimates: Feasibility of Using NSS Household Consumption Expenditure Survey Data”, Economic & Political Weekly, 25 January.Sen, A and Himanshu (2004): “Poverty and Inequality – I and II, Widening Disparities during the 1990s”, Economic & Political Weekly, 18 and 25 September.Sundaram, K and S D Tendulkar (2003): “Poverty in India in the 1990s – An Analysis of Changes in 15 Major States”, Economic & Political Weekly, 5 April.Report of the Expert Group to Review the Methodology for Estimation of Poverty: Planning Commission, Government of India, November 2009.
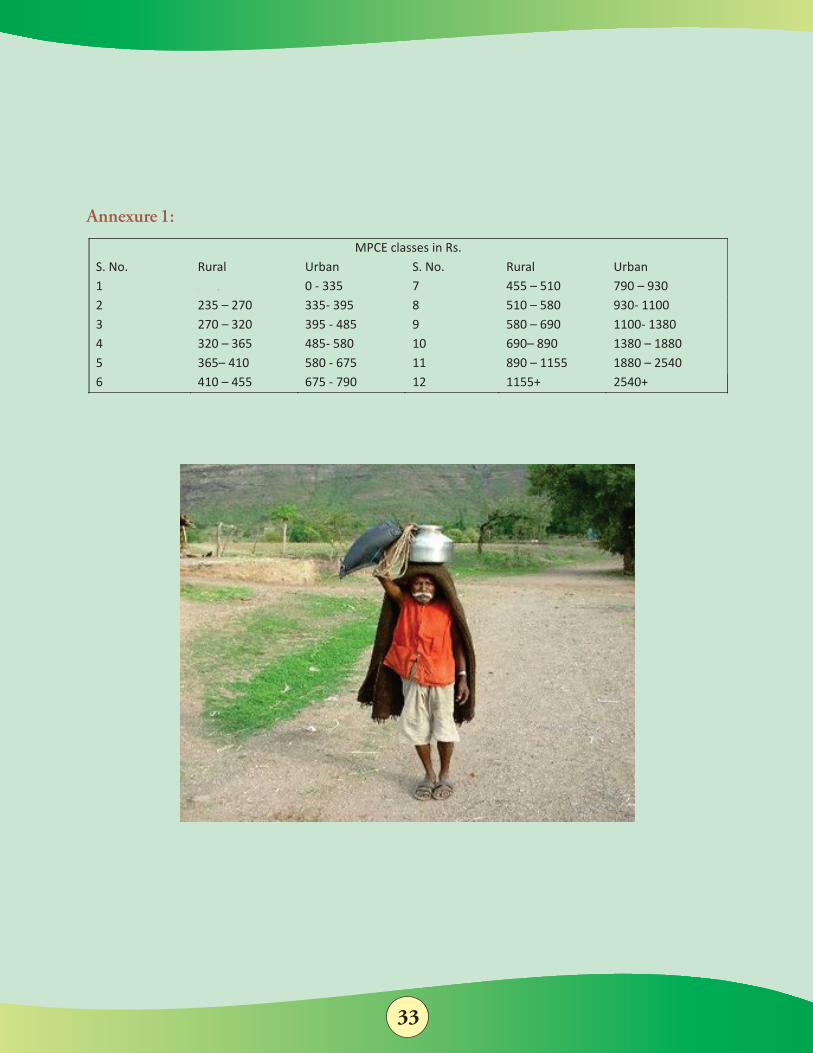
33
MPCE classes in Rs.
S. No.
Rural
Urban
S. No.
Rural
Urban
1 0 –
235
0 - 335 7 455 – 510 790 – 930
2 235 – 270 335- 395 8 510 – 580 930- 1100
3 270 – 320 395 - 485 9 580 – 690 1100- 1380 4 320 – 365 485- 580 10 690– 890 1380 – 1880 5 365– 410 580 - 675 11 890 – 1155 1880 – 2540 6 410 –
455
675 -
790
12
1155+
2540+
Annexure 1:
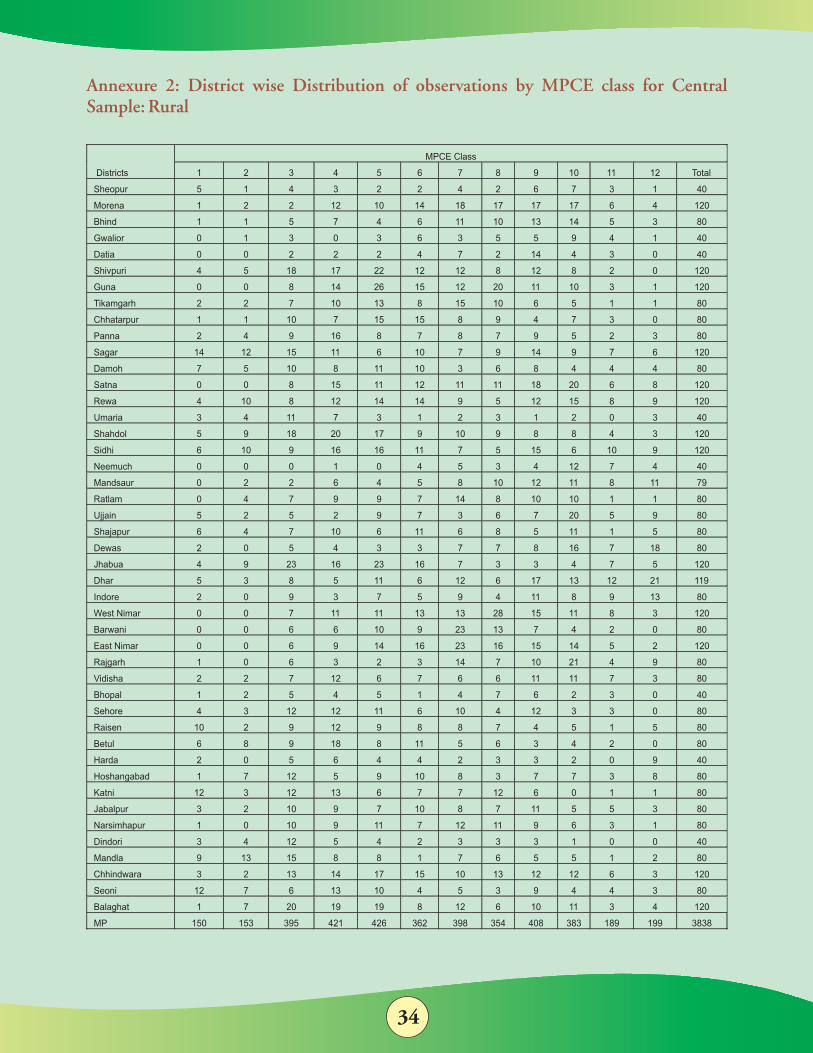
34
Annexure 2: District wise Distribution of observations by MPCE class for Central Sample: Rural
Districts
MPCE
Class
1
2
3
4
5
6
7
8
9
10
11
12
Total
Sheopur
5
1
4
3
2
2
4
2
6
7
3
1
40
Morena
1
2
2
12
10
14
18
17
17
17
6
4
120
Bhind
1
1
5
7
4
6
11
10
13
14
5
3
80
Gwalior
0
1
3
0
3
6
3
5
5
9
4
1
40
Datia
0
0
2
2
2
4
7
2
14
4
3
0
40
Shivpuri
4
5
18
17
22
12
12
8
12
8
2
0
120
Guna
0
0
8
14
26
15
12
20
11
10
3
1
120
Tikamgarh
2
2
7
10
13
8
15
10
6
5
1
1
80
Chhatarpur
1
1
10
7
15
15
8
9
4
7
3
0
80
Panna
2
4
9
16
8
7
8
7
9
5
2
3
80
Sagar
14
12
15
11
6
10
7
9
14
9
7
6
120
Damoh
7
5
10
8
11
10
3
6
8
4
4
4
80
Satna
0
0
8
15
11
12
11
11
18
20
6
8
120
Rewa
4
10
8
12
14
14
9
5
12
15
8
9
120
Umaria
3
4
11
7
3
1
2
3
1
2
0
3
40
Shahdol
5
9
18
20
17
9
10
9
8
8
4
3
120
Sidhi
6
10
9
16
16
11
7
5
15
6
10
9
120
Neemuch
0
0
0
1
0
4
5
3
4
12
7
4
40
Mandsaur
0
2
2
6
4
5
8
10
12
11
8
11
79
Ratlam
0
4
7
9
9
7
14
8
10
10
1
1
80
Ujjain
5
2
5
2
9
7
3
6
7
20
5
9
80
Shajapur
6
4
7
10
6
11
6
8
5
11
1
5
80
Dewas
2
0
5
4
3
3
7
7
8
16
7
18
80
Jhabua
4
9
23
16
23
16
7
3
3
4
7
5
120
Dhar
5
3
8
5
11
6
12
6
17
13
12
21
119
Indore
2
0
9
3
7
5
9
4
11
8
9
13
80
West Nimar
0
0
7
11
11
13
13
28
15
11
8
3
120
Barwani
0
0
6
6
10
9
23
13
7
4
2
0
80
East Nimar
0
0
6
9
14
16
23
16
15
14
5
2
120
Rajgarh
1
0
6
3
2
3
14
7
10
21
4
9
80
Vidisha
2
2
7
12
6
7
6
6
11
11
7
3
80
Bhopal
1
2
5
4
5
1
4
7
6
2
3
0
40
Sehore
4
3
12
12
11
6
10
4
12
3
3
0
80
Raisen
10
2
9
12
9
8
8
7
4
5
1
5
80
Betul
6
8
9
18
8
11
5
6
3
4
2
0
80
Harda
2
0
5
6
4
4
2
3
3
2
0
9
40
Hoshangabad
1
7
12
5
9
10
8
3
7
7
3
8
80
Katni
12
3
12
13
6
7
7
12
6
0
1
1
80
Jabalpur
3
2
10
9
7
10
8
7
11
5
5
3
80
Narsimhapur
1
0
10
9
11
7
12
11
9
6
3
1
80
Dindori
3
4
12
5
4
2
3
3
3
1
0
0
40
Mandla
9
13
15
8
8
1
7
6
5
5
1
2
80
Chhindwara
3
2
13
14
17
15
10
13
12
12
6
3
120
Seoni
12
7
6
13
10
4
5
3
9
4
4
3
80
Balaghat
1
7
20
19
19
8
12
6
10
11
3
4
120
MP
150
153
395
421
426
362
398
354
408
383
189
199
3838

35
Annexure 3: District wise Distribution of observations by MPCE class for State Sample: Rural
Districts
MPCE Class
1
2
3
4
5
6
7
8
9
10
11
12
Total
Sheopur
0
0
0
5
3
3
3
8
12
5
1
0
40
Morena
0
0
0
3
4
10
13
19
32
28
9
2
120
Bhind
0
0
1
1
4
6
11
10
21
20
6
0
80
Gwalior
0
0
0
0
1
4
5
10
7
9
4
0
40
Datia
0
2
0
1
7
4
3
4
5
8
5
1
40
Shivpuri
0
1
1
3
10
5
13
22
28
20
11
6
120
Guna
0
1
7
5
5
8
11
15
19
20
17
12
120
Tikamgarh
0
3
7
10
7
18
6
6
7
9
6
1
80
Chhatarpur
0
4
11
10
10
11
10
6
6
7
2
3
80
Panna
3
3
13
8
12
6
8
8
9
8
2
0
80
Sagar
0
1
4
10
16
9
10
19
17
17
10
7
120
Damoh
2
0
3
9
11
10
8
8
6
12
6
5
80
Satna
2
3
15
13
13
15
8
10
14
14
9
4
120
Rewa
8
4
8
17
12
7
10
9
15
16
10
4
120
Umaria
0
0
3
6
7
4
4
3
6
3
4
0
40
Shahdol
6
18
21
15
19
14
8
7
3
4
3
2
120
Sidhi
4
2
7
14
13
14
13
15
13
7
12
6
120
Neemuch
0
1
2
4
2
6
3
5
6
7
2
2
40
Mandsaur
0
2
4
5
5
7
8
15
4
19
7
4
80
Ratlam
0
1
4
11
7
9
8
8
12
10
7
3
80
Ujjain
1
1
5
6
8
5
6
9
9
16
7
7
80
Shajapur
1
1
4
3
5
5
8
8
17
16
8
4
80
Dewas
0
1
4
4
7
7
10
12
11
12
2
0
70
Jhabua
0
0
4
15
8
24
20
13
17
15
4
0
120
Dhar
0
0
9
6
11
20
22
19
9
12
3
9
120
Indore
0
1
2
0
5
4
13
11
13
22
6
3
80
West Nimar
0
4
13
19
19
15
14
13
14
5
3
1
120
Barwani
9
6
12
11
10
5
6
7
8
5
1
0
80
East Nimar
5
3
11
13
19
20
20
12
7
5
3
2
120
Rajgarh
0
2
3
6
7
4
11
15
12
13
4
3
80
Vidisha
1
0
6
6
6
10
6
8
13
9
8
7
80
Bhopal
0
3
6
3
1
5
7
3
3
4
4
1
40
Sehore
0
1
0
4
5
9
15
8
9
14
9
6
80
Raisen
1
0
7
7
9
7
6
12
10
11
7
3
80
Betul
1
3
9
6
9
5
10
14
5
13
1
4
80
Harda
4
3
4
5
8
2
2
3
1
4
4
0
40
Hoshangabad
0
1
2
9
9
7
4
10
18
10
8
2
80
Katni
1
2
10
12
9
9
5
12
9
7
1
3
80
Jabalpur
4
3
6
6
17
3
11
7
9
12
2
0
80
Narsimhapur
0
1
5
1
7
11
8
10
13
12
6
6
80
Dindori
0
0
1
4
6
2
5
4
5
8
5
0
40
Mandla
0
0
0
0
1
3
8
17
16
17
13
5
80
Chhindwara
5
7
5
12
11
17
12
16
14
18
3
0
120
Seoni
0
1
1
0
1
0
2
10
8
26
18
13
80
Balaghat
1
2
2
4
5
6
11
10
24
24
23
8
120
MP
59
92
242
312
371
375
405
470
516
553
286
149
3830
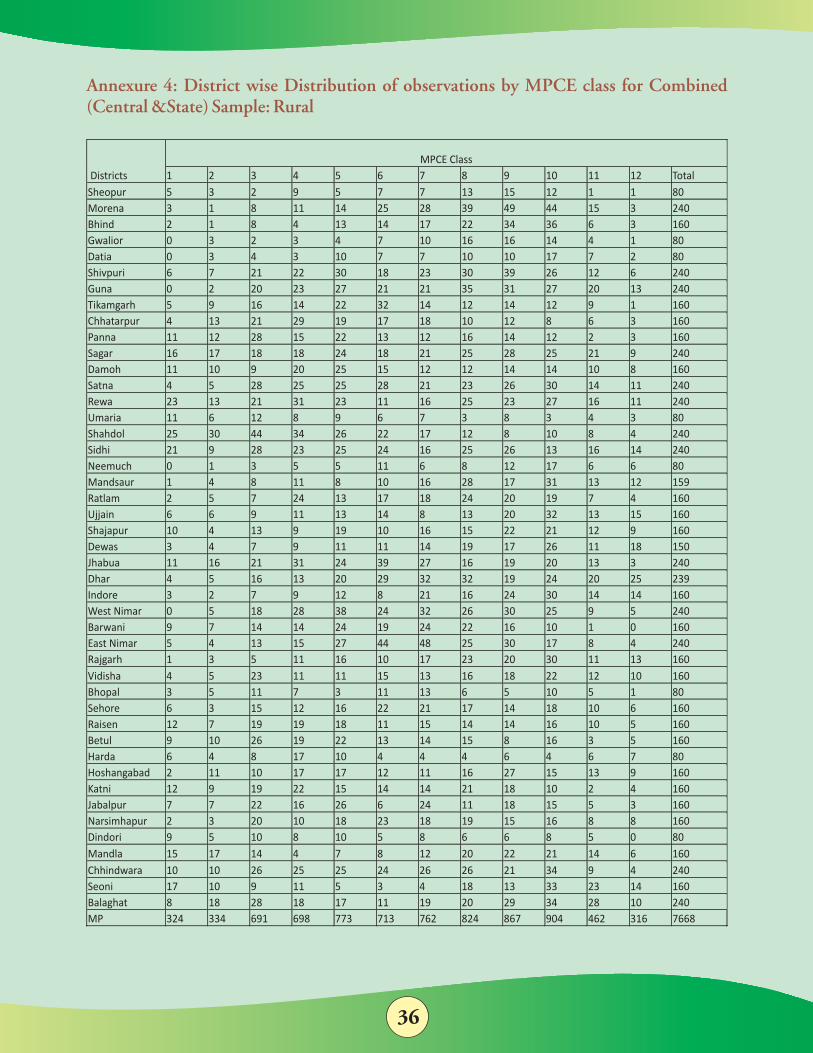
36
Annexure 4: District wise Distribution of observations by MPCE class for Combined (Central &State) Sample: Rural
Districts
MPCE
Class
1
2
3
4
5
6
7
8
9
10
11
12
Total
Sheopur
5
3
2
9
5
7
7
13
15
12
1
1
80
Morena
3
1
8
11
14
25
28
39
49
44
15
3
240
Bhind
2
1
8
4
13
14
17
22
34
36
6
3
160
Gwalior
0
3
2
3
4
7
10
16
16
14
4
1
80
Datia
0
3
4
3
10
7
7
10
10
17
7
2
80
Shivpuri
6
7
21
22
30
18
23
30
39
26
12
6
240
Guna
0
2
20
23
27
21
21
35
31
27
20
13
240
Tikamgarh
5
9
16
14
22
32
14
12
14
12
9
1
160
Chhatarpur
4
13
21
29
19
17
18
10
12
8
6
3
160
Panna
11
12
28
15
22
13
12
16
14
12
2
3
160
Sagar
16
17
18
18
24
18
21
25
28
25
21
9
240
Damoh
11
10
9
20
25
15
12
12
14
14
10
8
160
Satna
4
5
28
25
25
28
21
23
26
30
14
11
240
Rewa
23
13
21
31
23
11
16
25
23
27
16
11
240
Umaria
11
6
12
8
9
6
7
3
8
3
4
3
80
Shahdol
25
30
44
34
26
22
17
12
8
10
8
4
240
Sidhi
21
9
28
23
25
24
16
25
26
13
16
14
240
Neemuch
0
1
3
5
5
11
6
8
12
17
6
6
80
Mandsaur
1
4
8
11
8
10
16
28
17
31
13
12
159
Ratlam
2
5
7
24
13
17
18
24
20
19
7
4
160
Ujjain
6
6
9
11
13
14
8
13
20
32
13
15
160
Shajapur
10
4
13
9
19
10
16
15
22
21
12
9
160
Dewas
3
4
7
9
11
11
14
19
17
26
11
18
150
Jhabua
11
16
21
31
24
39
27
16
19
20
13
3
240
Dhar
4
5
16
13
20
29
32
32
19
24
20
25
239
Indore
3
2
7
9
12
8
21
16
24
30
14
14
160
West Nimar
0
5
18
28
38
24
32
26
30
25
9
5
240
Barwani
9
7
14
14
24
19
24
22
16
10
1
0
160
East Nimar
5
4
13
15
27
44
48
25
30
17
8
4
240
Rajgarh
1
3
5
11
16
10
17
23
20
30
11
13
160
Vidisha
4
5
23
11
11
15
13
16
18
22
12
10
160
Bhopal
3
5
11
7
3
11
13
6
5
10
5
1
80
Sehore
6
3
15
12
16
22
21
17
14
18
10
6
160
Raisen
12
7
19
19
18
11
15
14
14
16
10
5
160
Betul
9
10
26
19
22
13
14
15
8
16
3
5
160
Harda
6
4
8
17
10
4
4
4
6
4
6
7
80
Hoshangabad
2
11
10
17
17
12
11
16
27
15
13
9
160
Katni 12 9 19 22 15 14 14 21 18 10 2 4 160
Jabalpur 7 7 22 16 26 6 24 11 18 15 5 3 160
Narsimhapur 2 3 20 10 18 23 18 19 15 16 8 8 160
Dindori 9 5 10 8 10 5 8 6 6 8 5 0 80
Mandla 15 17 14 4 7 8 12 20 22 21 14 6 160
Chhindwara 10 10 26 25 25 24 26 26 21 34 9 4 240
Seoni 17 10 9 11 5 3 4 18 13 33 23 14 160
Balaghat 8 18 28 18 17 11 19 20 29 34 28 10 240
MP 324 334 691 698 773 713 762 824 867 904 462 316 7668
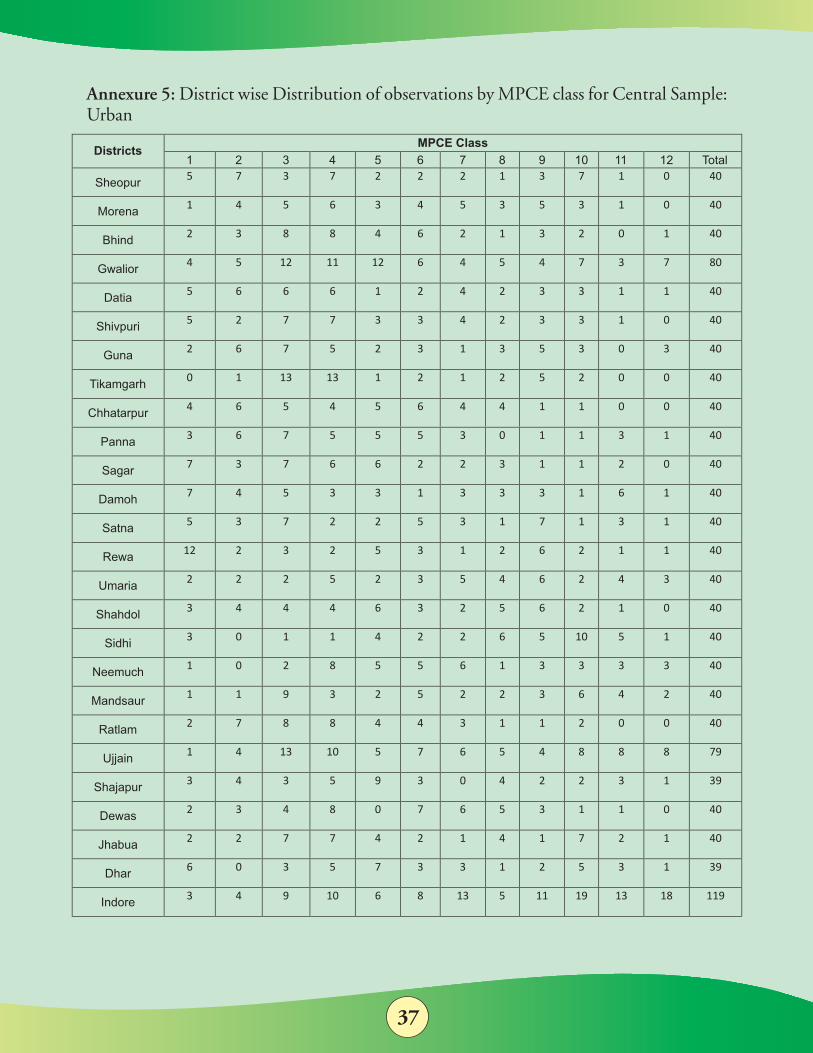
37
Annexure 5: District wise Distribution of observations by MPCE class for Central Sample: Urban
MPCE Class
Districts
1
2
3
4
5
6
7
8
9
10
11
12
Total
Sheopur 5
7
3
7
2
2
2
1
3
7
1
0
40
Morena 1
4
5
6
3
4
5
3
5
3
1
0
40
Bhind 2
3
8
8
4
6
2
1
3
2
0
1
40
Gwalior 4
5
12
11
12
6
4
5
4
7
3
7
80
Datia 5
6
6
6
1
2
4
2
3
3
1
1
40
Shivpuri 5
2
7
7
3
3
4
2
3
3
1
0
40
Guna 2
6
7
5
2
3
1
3
5
3
0
3
40
Tikamgarh 0 1 13 13 1 2 1 2 5 2 0 0 40
Chhatarpur 4 6 5 4 5 6 4 4 1 1 0 0 40
Panna 3 6 7 5 5 5 3 0 1 1 3 1 40
Sagar 7 3 7 6 6 2 2 3 1 1 2 0 40
Damoh 7 4 5 3 3 1 3 3 3 1 6 1 40
Satna 5 3 7 2 2 5 3 1 7 1 3 1 40
Rewa 12 2 3 2 5 3 1 2 6 2 1 1 40
Umaria 2 2 2 5 2 3 5 4 6 2 4 3 40
Shahdol 3 4 4 4 6 3 2 5 6 2 1 0 40
Sidhi 3 0 1 1 4 2 2 6 5 10 5 1 40
Neemuch 1 0 2 8 5 5 6 1 3 3 3 3 40
Mandsaur 1 1 9 3 2 5 2 2 3 6 4 2 40
Ratlam 2 7 8 8 4 4 3 1 1 2 0 0 40
Ujjain 1 4 13 10 5 7 6 5 4 8 8 8 79
Shajapur
3 4 3 5 9 3 0 4 2 2 3 1 39
Dewas
2
3
4
8
0
7
6
5
3
1
1
0
40
Jhabua
2
2
7
7
4
2
1
4
1
7
2
1
40
Dhar
6
0
3
5
7
3
3
1
2
5
3
1
39
Indore
3
4
9
10
6
8
13
5
11
19
13
18
119
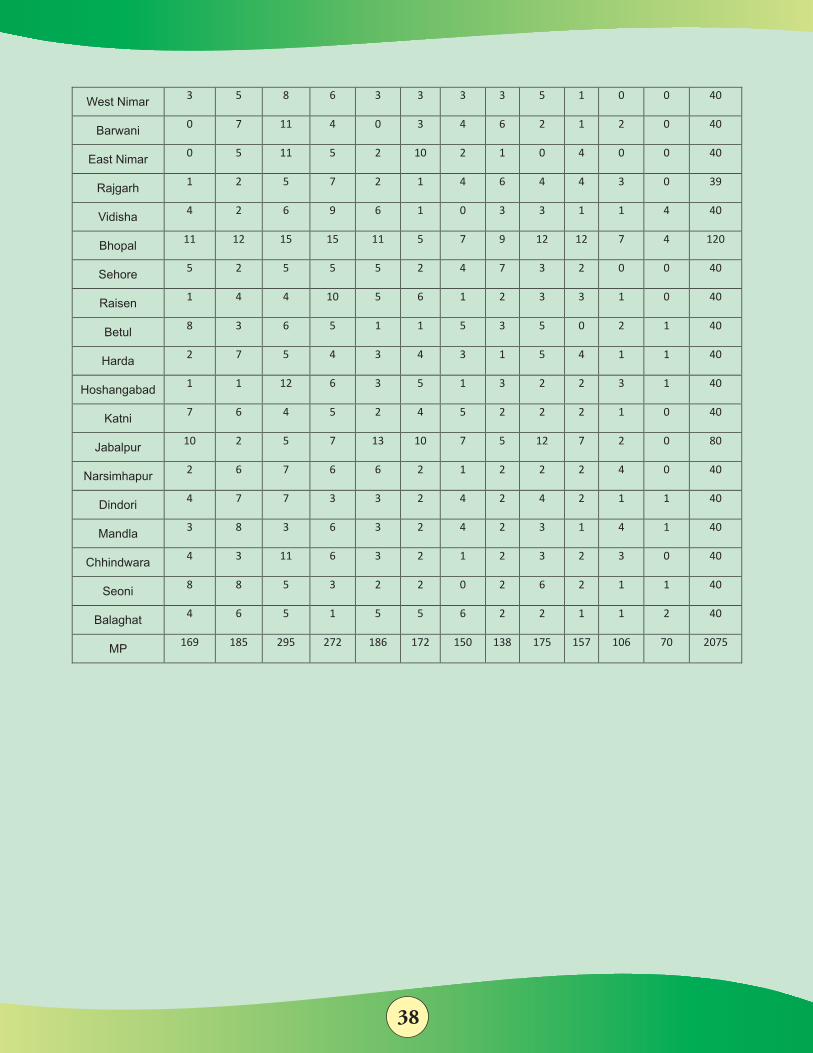
38
West Nimar 3
5
8
6
3
3
3
3
5
1
0
0
40
Barwani 0
7
11
4
0
3
4
6
2
1
2
0
40
East Nimar 0
5
11
5
2
10
2
1
0
4
0
0
40
Rajgarh 1 2 5 7 2 1 4 6 4 4 3 0 39
Vidisha 4 2 6 9 6 1 0 3 3 1 1 4 40
Bhopal 11 12 15 15 11 5 7 9 12 12 7 4 120
Sehore 5 2 5 5 5 2 4 7 3 2 0 0 40
Raisen 1 4 4 10 5 6 1 2 3 3 1 0 40
Betul 8 3 6 5 1 1 5 3 5 0 2 1 40
Harda 2 7 5 4 3 4 3 1 5 4 1 1 40
Hoshangabad 1 1 12 6 3 5 1 3 2 2 3 1 40
Katni 7 6 4 5 2 4 5 2 2 2 1 0 40
Jabalpur 10 2 5 7 13 10 7 5 12 7 2 0 80
Narsimhapur 2 6 7 6 6 2 1 2 2 2 4 0 40
Dindori 4 7 7 3 3 2 4 2 4 2 1 1 40
Mandla 3 8 3 6 3 2 4 2 3 1 4 1 40
Chhindwara 4 3 11 6 3 2 1 2 3 2 3 0 40
Seoni 8 8 5 3 2 2 0 2 6 2 1 1 40
Balaghat
4
6
5
1
5
5
6
2
2
1
1
2
40
MP
169
185
295
272
186
172
150
138
175
157
106
70
2075
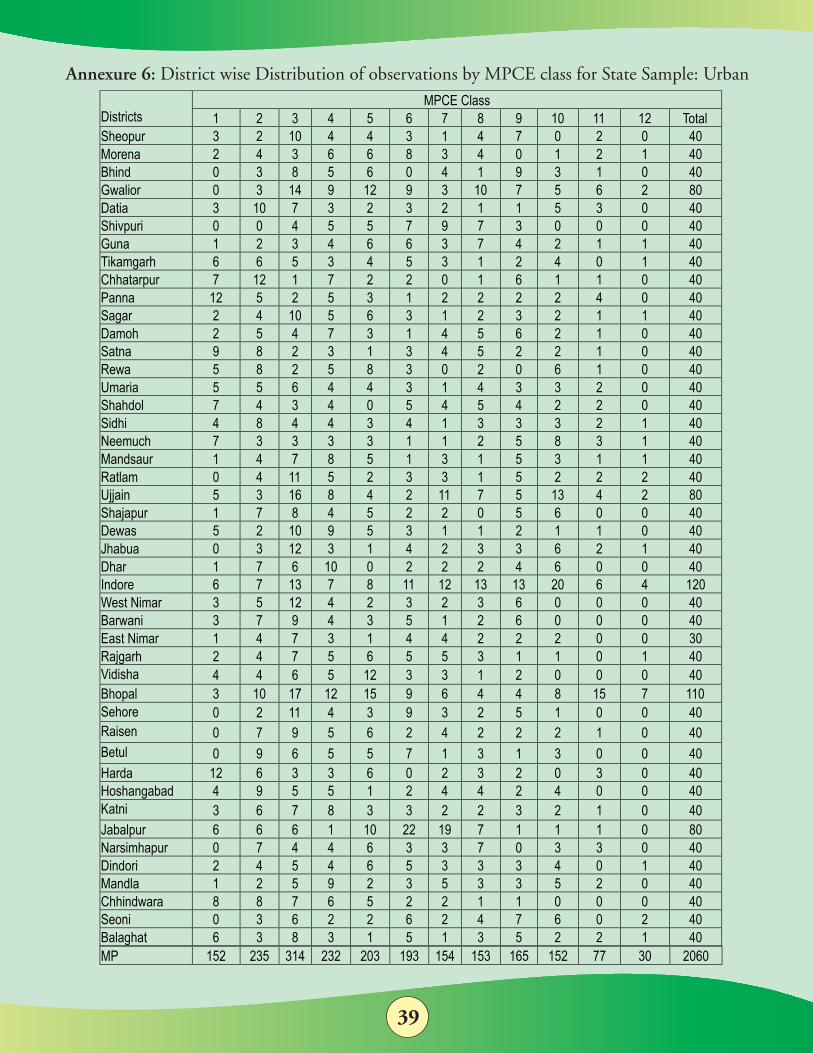
39
Annexure 6: District wise Distribution of observations by MPCE class for State Sample: UrbanMPCE Class
Districts
1
2
3
4
5
6
7
8
9
10
11
12
Total
Sheopur
3
2
10
4
4
3
1
4
7
0
2
0
40
Morena
2
4
3
6
6
8
3
4
0
1
2
1
40
Bhind
0
3
8
5
6
0
4
1
9
3
1
0
40
Gwalior
0
3
14
9
12
9
3
10
7
5
6
2
80
Datia
3
10
7
3
2
3
2
1
1
5
3
0
40
Shivpuri
0
0
4
5
5
7
9
7
3
0
0
0
40
Guna
1
2
3
4
6
6
3
7
4
2
1
1
40
Tikamgarh
6
6
5
3
4
5
3
1
2
4
0
1
40
Chhatarpur 7 12 1 7 2 2 0 1 6 1 1 0 40
Panna 12 5 2 5 3 1 2 2 2 2 4 0 40
Sagar 2 4 10 5 6 3 1 2 3 2 1 1 40
Damoh 2 5 4 7 3 1 4 5 6 2 1 0 40
Satna 9 8 2 3 1 3 4 5 2 2 1 0 40
Rewa 5 8 2 5 8 3 0 2 0 6 1 0 40
Umaria 5 5 6 4 4 3 1 4 3 3 2 0 40
Shahdol 7 4 3 4 0 5 4 5 4 2 2 0 40
Sidhi 4 8 4 4 3 4 1 3 3 3 2 1 40
Neemuch 7 3 3 3 3 1 1 2 5 8 3 1 40
Mandsaur 1 4 7 8 5 1 3 1 5 3 1 1 40
Ratlam 0 4 11 5 2 3 3 1 5 2 2 2 40
Ujjain 5 3 16 8 4 2 11 7 5 13 4 2 80
Shajapur 1 7 8 4 5 2 2 0 5 6 0 0 40 Dewas 5 2 10 9 5 3 1 1 2 1 1 0 40 Jhabua 0 3 12 3 1 4 2 3 3 6 2 1 40 Dhar 1 7 6 10 0 2 2 2 4 6 0 0 40 Indore 6 7 13 7 8 11 12 13 13 20 6 4 120 West Nimar 3 5 12 4 2 3 2 3 6 0 0 0 40 Barwani 3 7 9 4 3 5 1 2 6 0 0 0 40 East Nimar 1 4 7 3 1 4 4 2 2 2 0 0 30 Rajgarh 2 4 7 5 6 5 5 3 1 1 0 1 40 Vidisha 4 4 6 5 12 3 3 1 2 0 0 0 40 Bhopal 3 10 17 12 15 9 6 4 4 8 15 7 110 Sehore 0 2 11 4 3 9 3 2 5 1 0 0 40 Raisen 0 7 9 5 6 2 4 2 2 2 1 0 40 Betul 0 9 6 5 5 7 1 3 1 3 0 0 40 Harda
12
6
3
3
6
0
2
3
2
0
3
0
40
Hoshangabad
4
9
5
5
1
2
4
4
2
4
0
0
40
Katni 3
6
7
8
3
3
2
2
3
2
1
0
40
Jabalpur
6
6
6
1
10
22
19
7
1
1
1
0
80
Narsimhapur
0
7
4
4
6
3
3
7
0
3
3
0
40
Dindori
2
4
5
4
6
5
3
3
3
4
0
1
40
Mandla
1
2
5
9
2
3
5
3
3
5
2
0
40
Chhindwara
8
8
7
6
5
2
2
1
1
0
0
0
40 Seoni
0
3
6
2
2
6
2
4
7
6
0
2
40 Balaghat
6
3
8
3
1
5
1
3
5
2
2
1
40 MP 152 235 314 232 203 193 154 153 165 152 77 30 2060
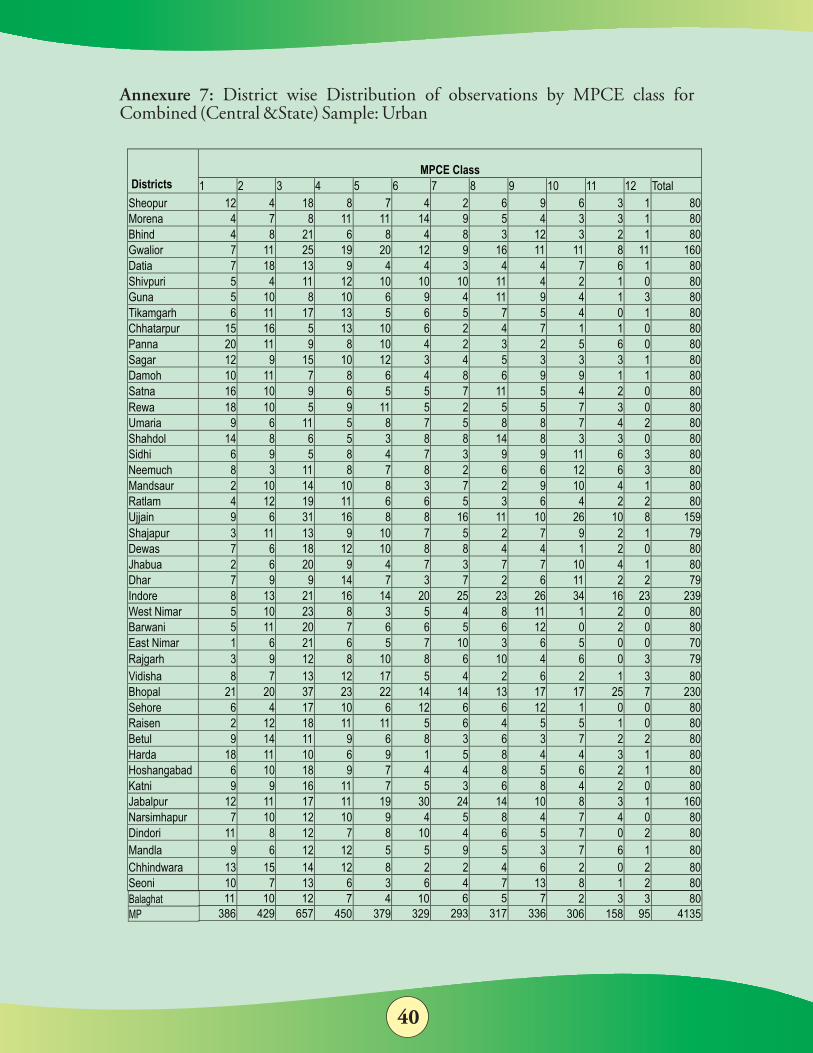
40
Annexure 7: District wise Distribution of observations by MPCE class for Combined (Central &State) Sample: Urban
MPCE Class Districts 1 2 3 4 5 6 7 8 9 10 11 12 Total
Sheopur
12
4
18
8
7
4
2
6
9
6
3
1
80
Morena
4
7
8
11
11
14
9
5
4
3
3
1
80
Bhind 4
8
21
6
8
4
8
3
12
3
2
1
80
Gwalior
7
11
25
19
20
12
9
16
11
11
8
11
160
Datia 7
18
13
9
4
4
3
4
4
7
6
1
80
Shivpuri
5
4
11
12
10
10
10
11
4
2
1
0
80
Guna 5
10
8
10
6
9
4
11
9
4
1
3
80
Tikamgarh
6
11
17
13
5
6
5
7
5
4
0
1
80
Chhatarpur
15
16
5
13
10
6
2
4
7
1
1
0
80
Panna
20
11
9
8
10
4
2
3
2
5
6
0
80
Sagar 12
9
15
10
12
3
4
5
3
3
3
1
80
Damoh
10
11
7
8
6
4
8
6
9
9
1
1
80
Satna 16
10
9
6
5
5
7
11
5
4
2
0
80
Rewa 18
10
5
9
11
5
2
5
5
7
3
0
80
Umaria
9
6
11
5
8
7
5
8
8
7
4
2
80
Shahdol
14
8
6
5
3
8
8
14
8
3 3
0
80
Sidhi 6
9
5
8
4
7
3
9
9 11
6
3
80
Neemuch
8
3
11
8
7
8
2
6
6 12
6
3
80
Mandsaur 2 10 14 10 8 3 7 2 9 10 4 1 80
Ratlam 4 12 19 11 6 6 5 3 6 4 2 2 80
Ujjain 9 6 31 16 8 8 16 11 10 26 10 8 159
Shajapur 3 11 13 9 10 7 5 2 7 9 2 1 79
Dewas 7 6 18 12 10 8 8 4 4 1 2 0 80
Jhabua
2
6
20
9
4
7
3
7
7 10
4
1
80
Dhar 7
9
9
14
7
3
7
2
6 11
2
2
79
Indore
8
13
21
16
14
20
25
23
26 34
16
23
239
West Nimar
5
10
23
8
3
5
4
8
11
1
2
0
80
Barwani
5
11
20
7
6
6
5
6
12
0
2
0
80
East Nimar
1
6
21
6
5
7
10
3
6
5
0
0
70
Rajgarh
3
9
12
8
10
8
6
10
4
6
0
3
79
Vidisha
8
7
13
12
17
5
4
2
6
2
1
3
80
Bhopal
21
20
37
23
22
14
14
13
17
17
25
7
230
Sehore
6
4
17
10
6
12
6
6
12
1
0
0
80
Raisen
2
12
18
11
11
5
6
4
5
5
1
0
80
Betul 9
14
11
9
6
8
3
6
3
7
2
2
80
Harda
18
11
10
6
9
1
5
8
4
4
3
1
80
Hoshangabad
6
10
18
9
7
4
4
8
5
6
2
1
80
Katni 9
9
16
11
7
5
3
6
8
4
2
0
80
Jabalpur
12
11
17
11
19
30
24
14
10
8
3
1
160
Narsimhapur
7
10
12
10
9
4
5
8
4
7
4
0
80
Dindori
11
8
12
7
8
10
4
6
5
7
0
2
80
Mandla 9 6 12 12 5 5 9 5 3 7 6 1 80
Chhindwara 13 15 14 12 8 2 2 4 6 2 0 2 80
Seoni 10 7 13 6 3 6 4 7 13 8 1 2 80
11 10 12
386 429 657 7 4 10
450 379 329 6 5 7
293 317 336 2 3 3 80
306 158 95 4135Balaghat MP
S. P. Batra Specialist (Statistics)PMPSU
Mangesh Tyagi AdvisorState Planning Commission Madhya Pradesh Govt.
Chitranjan Tyagi Team LeaderPMPSU