Embed Size (px)
Citation preview
DISCUSSION PAPER SERIES
IZA DP No. 12411
Jeffrey T. DenningEric R. EideMerrill Warnick
Why Have College Completion Rates Increased?
JUNE 2019
Any opinions expressed in this paper are those of the author(s) and not those of IZA. Research published in this series may include views on policy, but IZA takes no institutional policy positions. The IZA research network is committed to the IZA Guiding Principles of Research Integrity.The IZA Institute of Labor Economics is an independent economic research institute that conducts research in labor economics and offers evidence-based policy advice on labor market issues. Supported by the Deutsche Post Foundation, IZA runs the world’s largest network of economists, whose research aims to provide answers to the global labor market challenges of our time. Our key objective is to build bridges between academic research, policymakers and society.IZA Discussion Papers often represent preliminary work and are circulated to encourage discussion. Citation of such a paper should account for its provisional character. A revised version may be available directly from the author.
Schaumburg-Lippe-Straße 5–953113 Bonn, Germany
Phone: +49-228-3894-0Email: [email protected] www.iza.org
IZA – Institute of Labor Economics
DISCUSSION PAPER SERIES
ISSN: 2365-9793
IZA DP No. 12411
Why Have College Completion Rates Increased?
JUNE 2019
Jeffrey T. DenningBrigham Young University and IZA
Eric R. EideBrigham Young University
Merrill WarnickBrigham Young University
ABSTRACT
IZA DP No. 12411 JUNE 2019
Why Have College Completion Rates Increased?*
College completion rates declined from the 1970s to the 1990s. We document that
this trend has reversed - since the 1990s, college completion rates have increased. We
investigate the reasons for the increase in college graduation rates. Collectively, student
characteristics, institutional resources, and institution attended do not explain much of the
change. However, we document that standards for degree receipt may explain some of the
change in graduation rates.
JEL Classification: I23, I21
Keywords: college completion
Corresponding author:Jeffrey T. DenningBrigham Young UniversityDepartment of Economics165 FOBProvo, UT 84602USA
E-mail: [email protected]
* We thank Sandra Black, Lars Lefgren, Richard Patterson, Sarah Turner, participants at the BYU R Squared seminar,
NBER Education 2019 Spring Meetings, Society of Labor Economists 2019 Meetings, and Association for Education
Finance and Policy 2019 Conference for useful comments on the draft.
2
1. Introduction
Students who attend college enjoy many long run benefits (Oreopoulos and Petronijevic,
2013). Students who complete college have even better outcomes (Jaeger and Page, 1996; Ost,
Pan, and Webber, 2018). Despite the large returns to college completion, many students who
enroll in college do not graduate, leading to what some have described as a “college completion
crisis” (Deming, 2017). In fact, in 2016, the six-year graduation rate for college completion at
four-year schools was 67 percent (Shapiro et al., 2017).1 Consequently, policy and research
attention has increasingly focused on college completion.2
In influential work, Bound, Lovenheim, and Turner (2010) (hereafter BLT) showed that
college completion rates declined from the 1970s to the 1990s. This fact added additional
motivation for studying college completion. BLT showed that the overall decline was due to
both changing student preparedness and institution-level factors. However, the institution, or
supply-side, factors were relatively more important than student preparedness in explaining
the decline in graduation rates.3 BLT was highly influential in directing research over the next
several years that considered the role institutions played on college completion.4
Our study asks what has happened to college completion rates after 1990. First, we
document across three national data sources that aggregate trends have changed—college
completion rates increased from 1990 to present. The increase in graduation rates occurred across
institution types including public and private universities as well as elite and non-elite
institutions. College graduation rates increased for both men and women which is notable
because men drove the decline documented in BLT.
1 Hess and Hatalsky (2018) offer a nice summary of our understanding of the causes of college completion, policy tools, trends, etc. 2 As examples see Scott-Clayton (2012), Castleman and Long (2016), Bettinger et al. (2019), Denning, Marx, Turner (Forthcoming), and Barr (2019). 3 The decline in graduation rates in BLT was driven by males. The overall decline was largely due to the group of institutions that BLT refers to as public “non-top 50.” Bound, Lovenheim, and Turner (2012) also document that time to degree has increased over a similar time frame. 4 Many subsequent papers explored the causal effect of institution attended on graduation (Cohodes and Goodman, 2014; Zimmerman, 2014; Goodman, Hurwitz, and Smith, 2017).
3
Next, we investigate why college completion rates declined. We discuss relevant trends
that could affect college graduation such as the college wage premium, enrollment, student
preparation, study time, employment during college, price, state support for higher education,
and initial college attended. The trends in these variables almost uniformly would predict
declining college graduation rates. We use two nationally representative surveys from the
National Center for Education Statistics (NCES): National Education Longitudinal Study of 1988
(NELS:88) and Education Longitudinal Study of 2002 (ELS:2002) to decompose the change in
graduation rates into changes in student characteristics and institution-level factors.5 These
longitudinal student-level data sets have information on high school student background,
academic preparation, college enrollment, and graduation outcomes. We find that student
characteristics, institutional resources, and institution attended explain little of the change in
graduation rates.
We then explore alternative hypotheses to explain the increase in graduation rates. We
document that college student grade point averages are higher in the ELS:2002 than in NELS:88.
This is true after accounting for math test scores, student demographics, and institution type
attended. The increase in GPA happens across the distribution; importantly, 11 percent of all
students move from being below a 2.0 GPA to above a 2.0. We add student first year GPA into
our decomposition which accounts for most of the change in graduation rates. Our findings
combined with trends in studying and labor force participation in college suggest standards for
degree receipt have changed.
The rest of the paper proceeds as follows. Section 2 describes trends in college
graduation rate and other related trends. Section 3 outlines potential explanations for the
change in college graduation rates. Section 4 describes the data. Section 5 discusses the
empirical strategy. Section 6 contains the results and Section 7 concludes.
2. Trends in College Graduation Rates
5 NELS:88 is the primary data set used for the later period in BLT.
4
We first establish that college graduation rates have increased since the 1990s. We use three data
sources to document these trends. All three sources have limitations; however, the evidence is
consistent across all sources we consider.
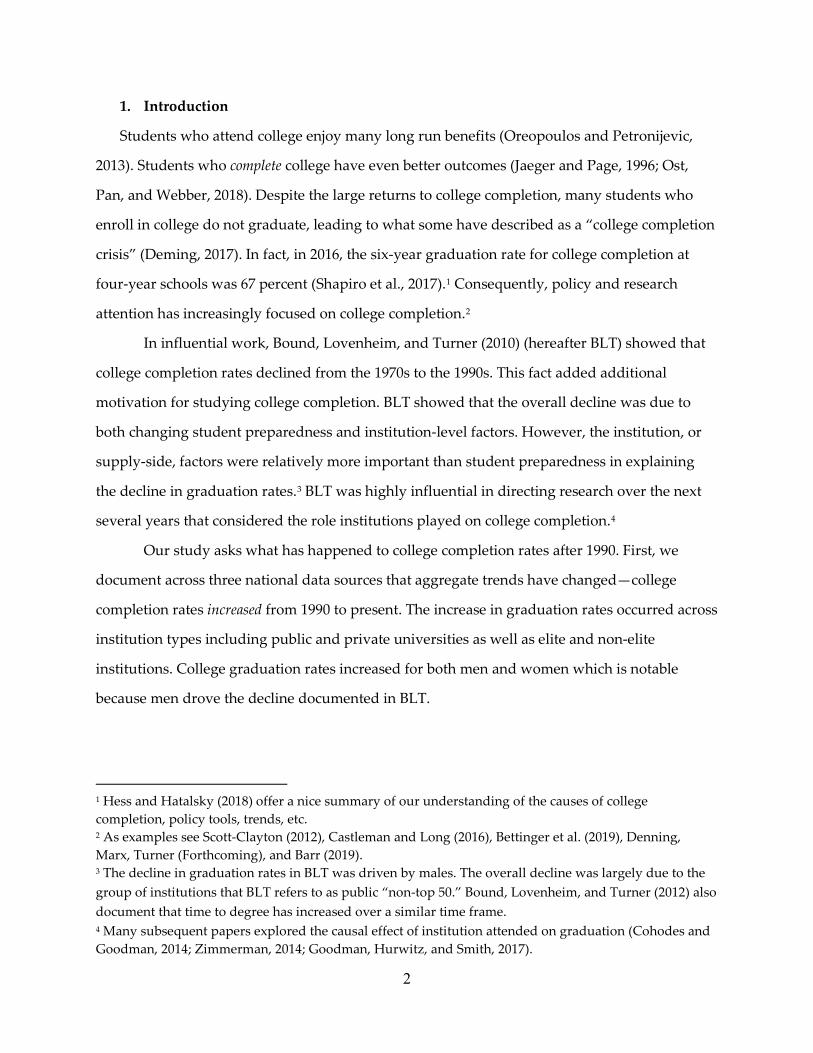
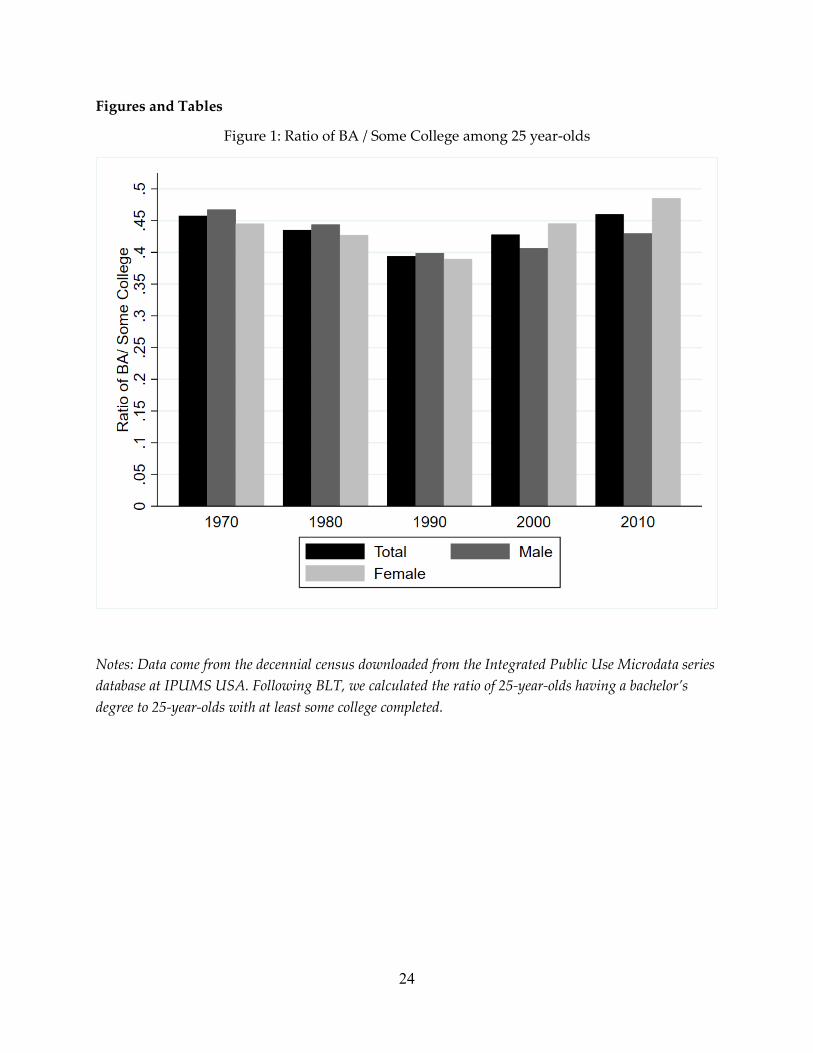
First, we use the decennial census to examine college graduation trends (Ruggles et al.,
2019). Figure 1 shows the ratio of bachelor’s recipients to those with some college among
respondents who are 25 years old. If the college graduation rate increases, the ratio of bachelor’s
recipients to those who attended college but did not graduate would increase. The decline from
1970 to 1990 is visible and is the focus of BLT. However, from 1990 to 2010, the ratio of BA
recipients to those with some college increased—especially for women.6
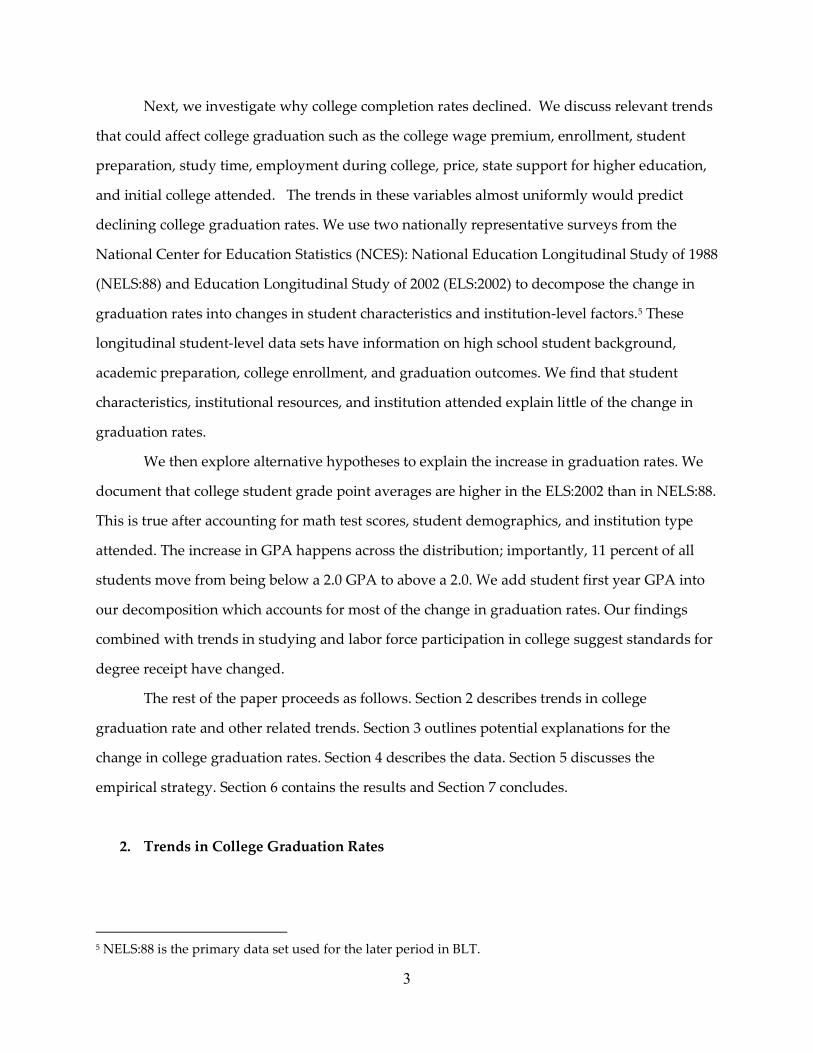
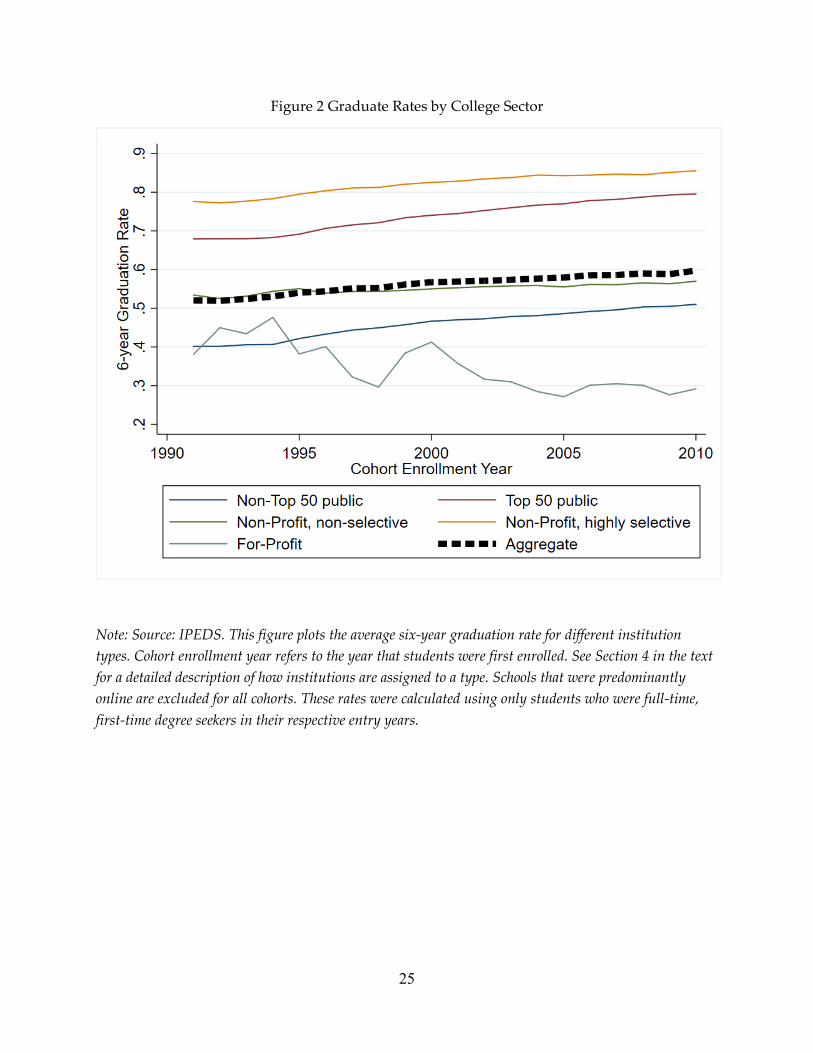
In the period that BLT studies, there were no nationwide institution-level graduation
data available. However, NCES started publishing cohort graduation rates by college starting
with the entering class of 1991. We summarize the trends in these graduation rates in Figure 2.7
Integrated Postsecondary Education Data System (IPEDS) collects graduation rates for all
schools who receive Title IV federal financial aid. However, the graduation rates are calculated
only for first-time, full-time students who begin in the fall. These graduation rates will not
capture students who do not fit this description.8 We focus on the six-year graduation rate in
Figure 2. Despite this limitation, the trends in the IPEDs data mirror the ratio of the number of
bachelor’s degrees to people with some college found in Figure 1. Terry Long (2018) notes
similar trends in graduation rates using the same data starting in the entering class of 1998 and
describes differences in graduation rates across institution type, student demographics, and the
consequences of non-completion.
6 Archidald, Feldman, and McHenry (2015) document this fact using similar census data. 7For Figure 2, we exclude schools that were predominantly online because online schools are different in many ways. Online schools are concentrated at for-profit institutions and have lower graduation rates than traditional schools. Information on online enrollment is first available in 2012 in IPEDS. We follow the convention of Deming et al. (2015) and label institutions that were predominantly online in 2012 as online prior to 2012. 8 For instance, this measure is likely to do a poor job measuring college completion at for-profit colleges where many students are “nontraditional.”
5
We consider enrollment and graduation separately by institution type. We follow the
convention of BLT with one notable difference--we separately consider for-profit institutions.9
With that modification, we categorize schools as follows: Top 50 Public, Non-Top 50 Public,
Highly Selective Non-Profit, Non-Selective Non-Profit, and For-Profit. We follow BLT in our
definition of Top 50 and Selective for public schools and private schools respectively and
provide complete descriptions of these groups in Section 4.10
Figure 2 shows there is substantial heterogeneity in the graduation rates across
institution types. The graduation rates are highest for highly selective private universities and
top 50 publics. The lowest graduation rates are for for-profit institutions. Setting aside for-profit
schools, graduation rates continuously increase from 1991-2010. Not all school types had
increases of the same size; public schools had larger increases than non-profit private schools at
similar levels of selectivity. However, the direction of the graduation rates are surprisingly
consistent across institution types. When combining all schools weighted by enrollment (the
black dashed line), the graduation rate increases from 52.0 percent to 59.7 percent. For-profit
schools notably exhibit a different pattern. Graduation rates decline for the 20 years we observe
which coincides with the growth in the for-profit sector as seen in Figure A1. The growth in the
for-profit sector suggests some of the decline may be due to changing composition of the
sector’s institutions or students.
We also show that the graduation rates for the two nationally representative samples
followed a similar pattern. We define college graduation as graduation within 8 years of
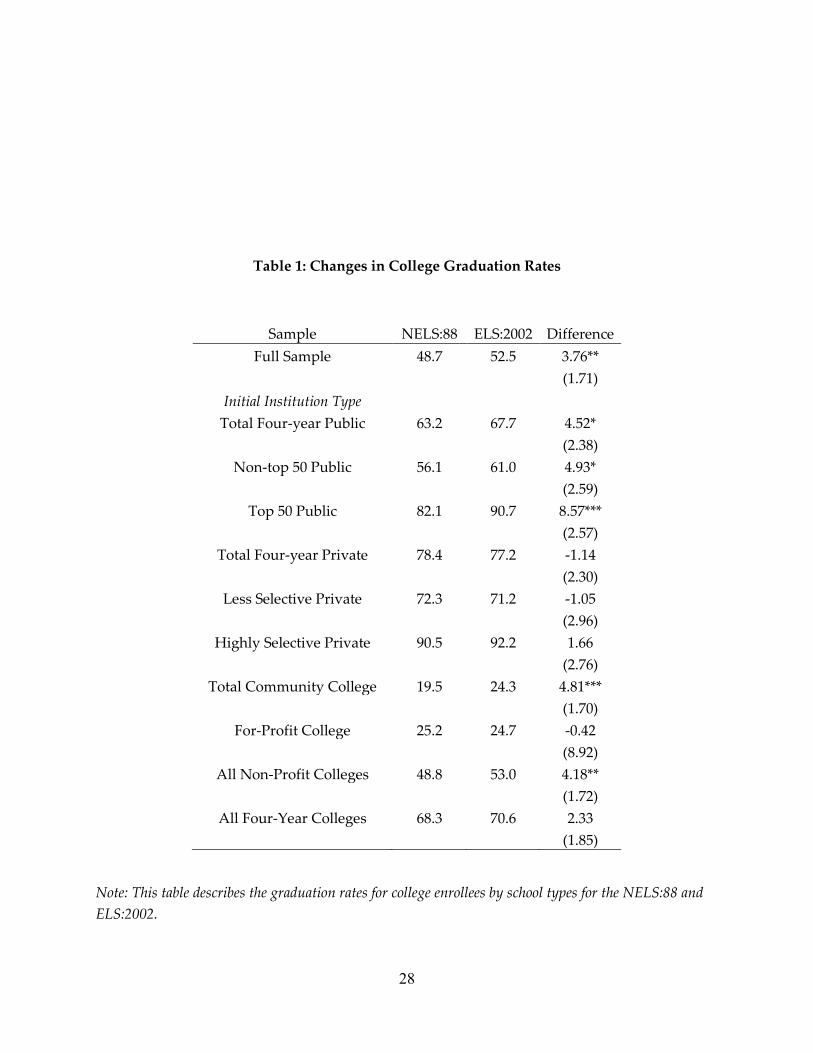
expected high school graduation following BLT.11 In Table 1, we show the eight-year graduation
rate for the two nationally representative surveys used in this paper, NELS:88 and ELS:2002. We
show that the overall graduation rate increased by 3.76 percentage points. We find statistically
significant increases in graduation rates for top 50 and non-top 50 public schools of 8.6 and 4.9
9 For-profit institutions have lower graduation rates and increased enrollments in the 2000s. Further, for-profits are different in many ways from nonprofit institutions (Deming et al. 2012). 10 See Section 4 for a description of the criteria used to classify schools. 11 We know when students actually graduate from high school but we use years from expected high school graduation to avoid conditioning our outcome on an endogenous variable (actual high school graduation)
6
percentage points respectively. We also see statistically significant increases at community
colleges and all non-profit colleges. Less selective and highly selective private universities do
not have a statistically significant change in their graduation rates across NELS:88 and
ELS:2002. This contrasts with aggregate graduation trends in IPEDS but may be due to
relatively small samples in the individual level surveys.
The remainder of the paper will use NELS:88 and ELS:2002 to analyze the change in
graduation rates so we show that the change in graduation rates is comparable to the change in
graduation rates in IPEDS. NELS:88 and ELS:2002 represent the high school graduating cohorts
of 1992 and 2004, respectively. The change in overall graduation rates for the entering cohorts of
1992 to 2004 in IPEDS is 5.74 percentage points which is similar but somewhat larger to what is
observed across NELS:88 and ELS:2002 at 3.76. Hence, using NELS:88 and ELS:2002 should
yield useful insight because the change in graduation rates is similar to observed aggregate
changes.
3. Potential Explanations for Changes in Graduation Rate
We initially consider two types of explanations for changes in college graduation rates: student-
level characteristics and institution-level characteristics. Student characteristics that may affect
college graduation include student preparation, work during school, time spent studying, and
choice of major. Institution characteristics that may explain changes in graduation rates include
the quality of instruction, financial aid, student services, and standards for degree receipt.
In trying to explain the changes in college completion, several trends are worth noting.
BLT notes that an increasing college wage premium would predict an increasing graduation
rate. However, the college wage premium has flattened beginning for cohorts born around 1970
(Ashworth and Ransom 2019).12 A stable college wage premium for young workers contrasts
with earlier periods (including the period studied in BLT) where the college wage premium was
12 Valletta (2016) shows a similar trend starting slightly later with the wage premium flattening starting in 2000. Valletta (2016) considers workers age 25-64 whereas Ashworth and Ransom (2019) consider workers age 25-34 which may explain some of the discrepancy.
7
growing. Hence, in the period we study the college wage premium is unlikely to explain
increasing graduation rates.
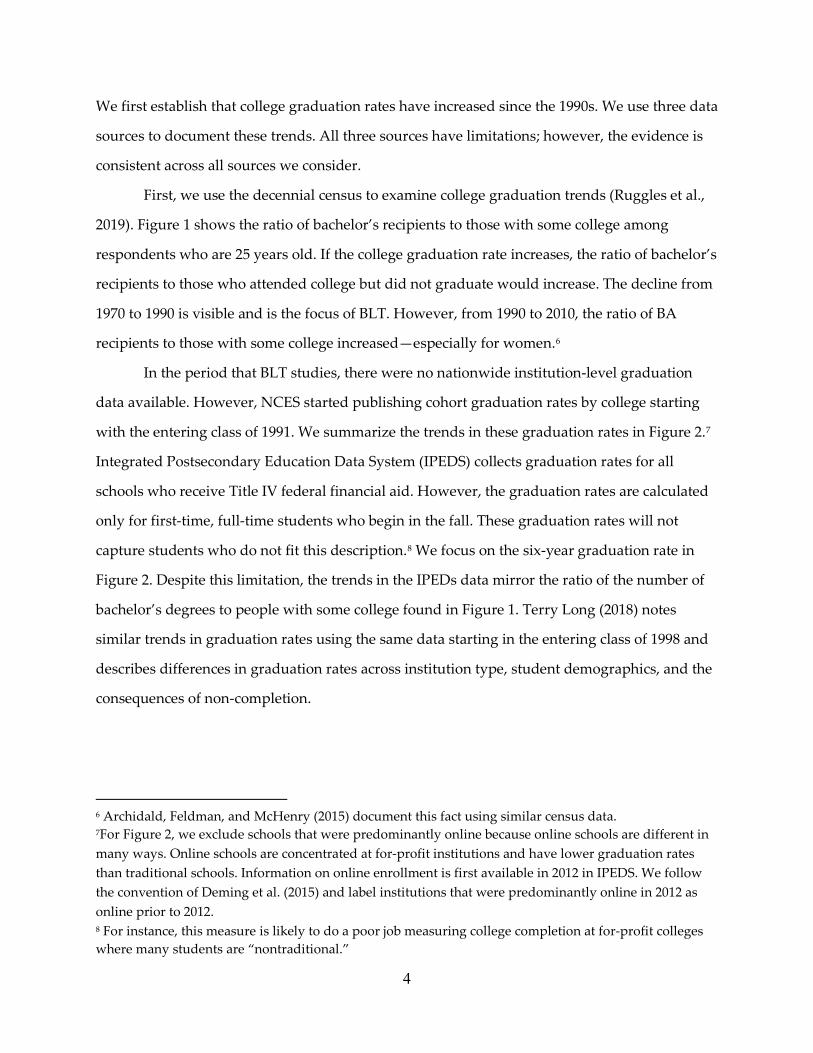
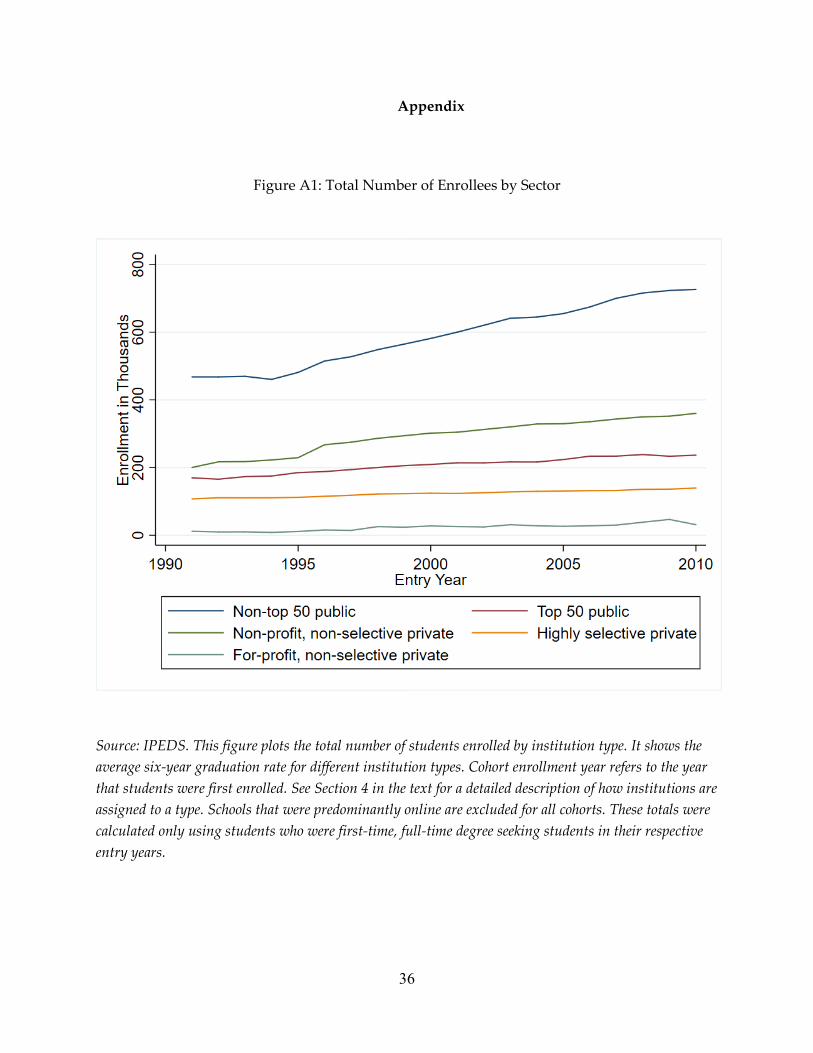
Appendix Figure A1 shows an increasing number of students enrolling in each
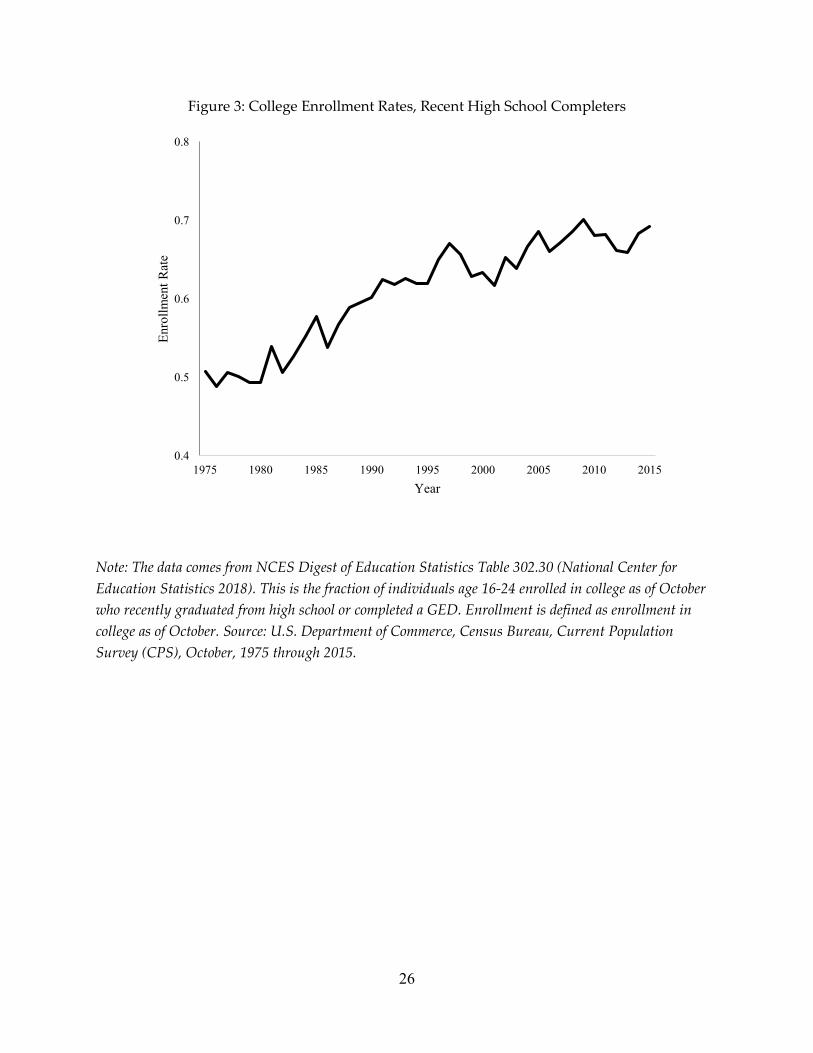
institution type over time. Similarly, Figure 3 shows the fraction of recent high school graduates
attending college. College enrollment steadily grew from 1975 starting at approximately 50
percent and rising to nearly 70 percent. Table 2 shows that college enrollment rose from 69.3
percent in NELS:88 to 78.3 percent in ELS:2002. With a larger fraction of students entering
college, there may be more entrants who are relatively less prepared because as more students
enter college, they likely come from farther down the distribution of student achievement.
Measuring student ability for the marginal college entrant could confound the increase
in college attendance if the increase in college attendance coincided with an increase in
performance. Performance of 17-year-old students on the math and reading portions of
National Assessment of Educational Progress (NAEP) is essentially unchanged since the 1970s
(National Center of Education Statistics 2013). Hence as college enrollment increases, the
average preparation for college entrants would fall because the distribution of student ability is
constant. We would expect college preparation would decrease in the time period studied given
that college enrollment has increased and that performance on the NAEP is unchanged.13
Trends in enrollment and student preparation would predict reduced college completion.14
Students are spending less time studying and more time employed over the time period
we consider. Babcock and Marks (2011) show a drop in the number of hours studied from 1961
to 2003. Neither student demographics including race, gender, and parent education nor
13 Archibald, Feldman, and McHenry (2015) consider the change in preparation among college enrollees. They document decline in preparation as measured by math test scores and reading test scores. They find that student high school GPA matters for college enrollment. However, the increase in high school GPAs is difficult to interpret because GPAs are growing faster in affluent schools than in less affluent schools (Gershenson, 2018). They argue that students matched to schools on the basis of high school GPA reduce the impact of lower average math scores. 14 We assign students their math percentile in the distribution of math test scores. We argue this represents student’s absolute level of preparation because the overall distribution of student preparation is unchanged as discussed. In Table 3, college entrants’ math percentile decreases from the 59th percentile to the 56th percentile. The decline in math percentile is also present among college graduates where it fell from the 71st percentile to the 68th percentile.
8
student SAT scores can explain much of the change in college study habits. Concurrently,
college students increased their labor supply over this period. Scott-Clayton (2012) shows that
average hours worked doubled from 1970 to 2000. However, student labor supply fell during
the Great Recession. All else equal, we would expect declining graduation rates when students
spend more time working for wages during college due to decreased study time, less full-time
enrollment, etc. Trends in student labor supply and study time would predict declining college
graduation rates, except perhaps during the Great Recession.
College has gotten more expensive since the 1990s. Inflation adjusted published tuition
and fees have increased by over 300 percent since 1987. The net price of college accounting for
financial aid has nearly doubled since 1997 for public four-year institutions (CollegeBoard,
2017). The price of college has been shown to affect college completion (Scott-Clayton, 2011;
Castleman and Long, 2016; Bettinger et al., 2019; Denning, Forthcoming). Relatedly, state
support for higher education per student has declined since 1985 (CollegeBoard, 2017), and
state funding for higher education has been shown to affect enrollment and graduation rates
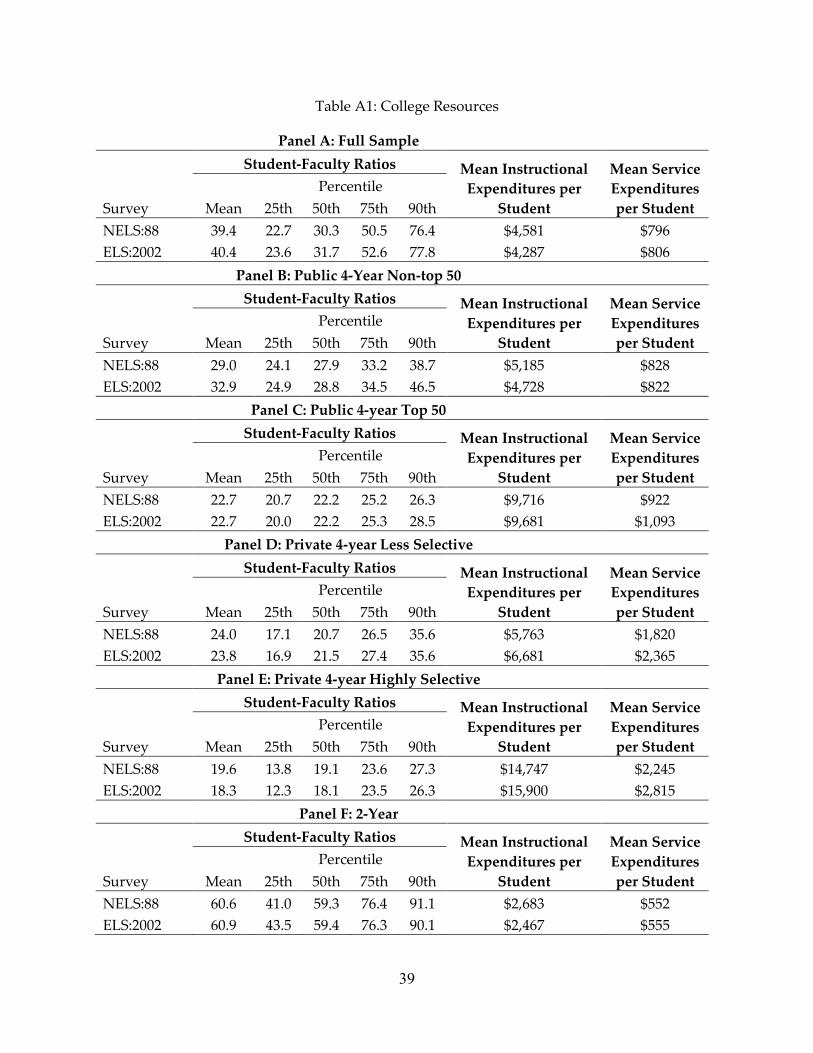
(Deming and Walters, 2017).15 In Appendix Table A1 we compare the student-faculty ratios for
students attending college across NELS:88 and ELS:2002 to get a sense for how resources for
students have changed. We find that the mean student-faculty ratio was nearly the same
increasing from 39.4 to 40.4 while mean instructional expenditures per student fell somewhat
from $4,581 to $4,287.16 Overall, the rising price of college would predict declining graduation
while instructional spending and student-faculty ratios are unlikely to explain much of the
change.
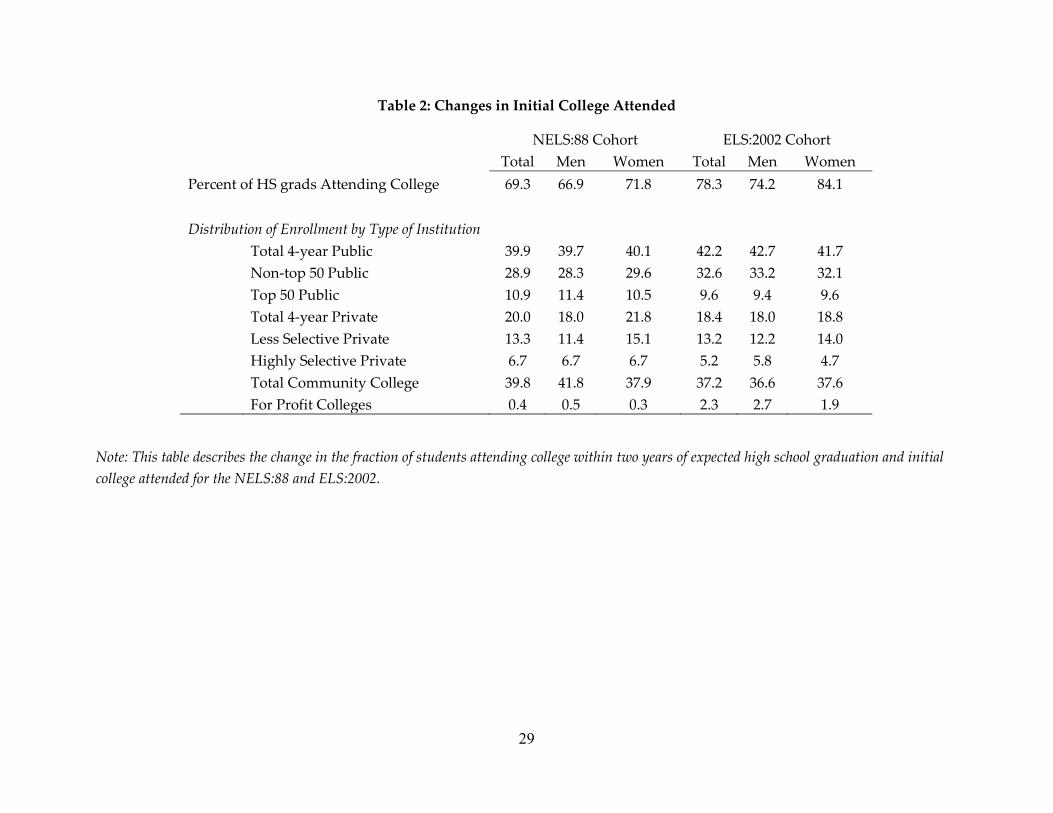
Table 2 shows the changes in initial college attended across the NELS:88 and ELS:2002
cohorts. The share of students attending non-top 50 public and for-profit colleges increased. The
share of students attending highly selective private, less selective private, top 50 public and
community colleges decreased. The pattern of enrollment increases in non-top 50 public
colleges balanced against the decrease in community college attendance and increased for-profit
15 Bailey and Dynarski (2011) document that there have been increases in the income gap in college graduation. 16 We use the Higher Education Price Index to deflate spending.
9
attendance leads to an ambiguous prediction about the overall college completion rate if the
average graduation rate of an institution causally affects college graduation.17
Changing college major choice could affect college completion. To explore the role of
major choice, we explore what graduation rates would be if we changed the distribution of
majors while holding fixed the graduation rates of any particular major. We find that students
have not moved towards higher graduation rate majors over time.
Trends in the college wage premium, student enrollment, student preparation, student
studying, labor supply in college, time spent studying, and the price of college would all predict
decreasing college graduation rates. The patterns for enrollment by institution type yields an
ambiguous prediction. Despite the bulk of the trends predicting decreasing graduation, we
document that the college graduation rate is increasing. These trends foreshadow what we find
in our analysis and present a puzzle. The trends in the variables that explained the decline
documented in BLT will not be able to explain the increase in graduation rates observed from
1990 to 2010.
There has been increased policy attention on college completion during this period.
Additionally, the number of state policies that tie appropriations for higher education to college
completion via performance funding mechanisms has increased. The use of these mechanisms
grew beginning in the 1990s. Evidence on the effect of these mechanisms is mixed with some
studies finding that it affects degree production (Hillman, Tandberg, & Fryer, 2015; Tandberg &
Hillman, 2014; Hillman, Fryar, & Crespín-Trujillo, 2017) and some finding that it does not
(Hillman, Tandberg, & Gross, 2014). Increased attention to graduation and performance-based-
funding gives schools incentive to increase graduation rates. However, even if performance
funding affects graduation it would be an indirect mechanism. For performance funding to
have an effect it must induce schools to change something about the degree production process.
17 This assumption has good empirical support (Cohodes and Goodman, 2014; Zimmerman, 2014; Goodman, Hurwitz, and Smith, 2017).
10
We propose, and test for, an additional channel that may change college completion
rates—standards for degree receipt. If the standards for receiving a degree are relaxed, college
completion rates would grow.18
4. Data
We use micro data to examine the reasons for the increase in college graduation rates.
Specifically, we use two longitudinal surveys sponsored by the National Center for Education
Statistics: the National Education Longitudinal Study of 1988 (NELS:88) and the Education
Longitudinal Study of 2002 (ELS:2002). The NELS:88 and ELS:2002 capture college-going
behavior of the high school classes of 1992 and 2004, respectively. The surveys provide
information on whether a student attended college, the type of college attended, whether the
student graduated from college, and the timing of college attendance and graduation.
The NELS:88 is a nationally representative, longitudinal study of 8th graders in the U.S.
in 1988. The cohort was again surveyed in four follow-ups which occurred in 1990, 1992, 1994,
and 2000. Postsecondary transcripts were also collected in 2000. The ELS:2002 is a nationally
representative, longitudinal study of 10th graders in 2002. There were three follow up surveys
which were administered in 2004, 2006, and 2012, with postsecondary transcripts collected in
2013. Importantly, both surveys include student assessments in math (and other areas) taken
during high school, and we use the math assessments as a measure of student preparedness for
college. Another advantage of these surveys is they contain a host of individual and family
background variables. We use father’s and mother’s educational attainment (no high school
diploma, high school diploma, some college, BA, graduate school), parental income (divided
into income level categories), gender (male), and race/ethnicity (Asian, Hispanic, African
American, White). Following BLT, we impute math test score, mother’s education and father’s
18 Evidence on patterns in “grade-inflation” is mixed with some studies finding support for grade inflation (Rojstaczer and Healy, 2012) and others finding none (Pattison, Grodsky, and Muller, 2013). We will discuss grade inflation in Section 6. Griffith and Sovero (2019) use administrative data from a public research university and find that grades have increased significantly since 1980. They hypothesize that an increasing number of instructors with job uncertainty may face pressures to increase grades, which is borne out empirically.
11
education for both surveys because these data are missing for many students. We also impute
first-year college GPA for both surveys. For NELS, we also impute parental income.19
We follow BLT in how we define college attendance and college completion. We
consider students who attend college within two years of when their high school cohort would
be expected to graduate. The college completion rate is the proportion of students and obtain a
BA within eight years of expected high school graduation.
We also follow BLT in assigning institutions to types which is primarily based on the
2005 U.S. News and World Report college rankings.20 We assign the highest rated 50 public
schools to “the top-50 public” category. The 65 highest rated private universities, the 50 highest
rated liberal arts colleges, and the armed service academies are categorized as “highly selective
private” category.21 Other 4-year public schools are assigned to the “non-top 50 public”
category, and other 4-year not-for-profit private schools were assigned to the “less selective
private” category. Not-for-profit 2-year colleges are assigned to the “community college”
category. Due to the recent rise in for-profit colleges, we created a new category, “for-profit
colleges,” and placed all for-profit colleges in this category.
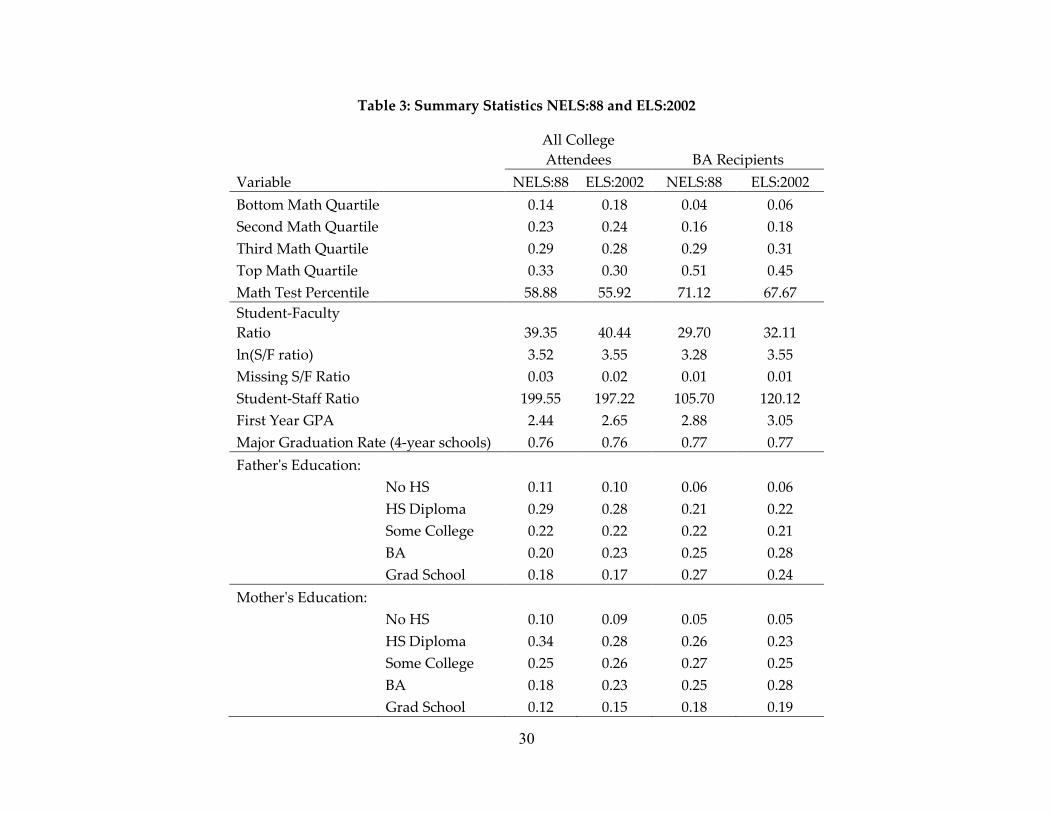
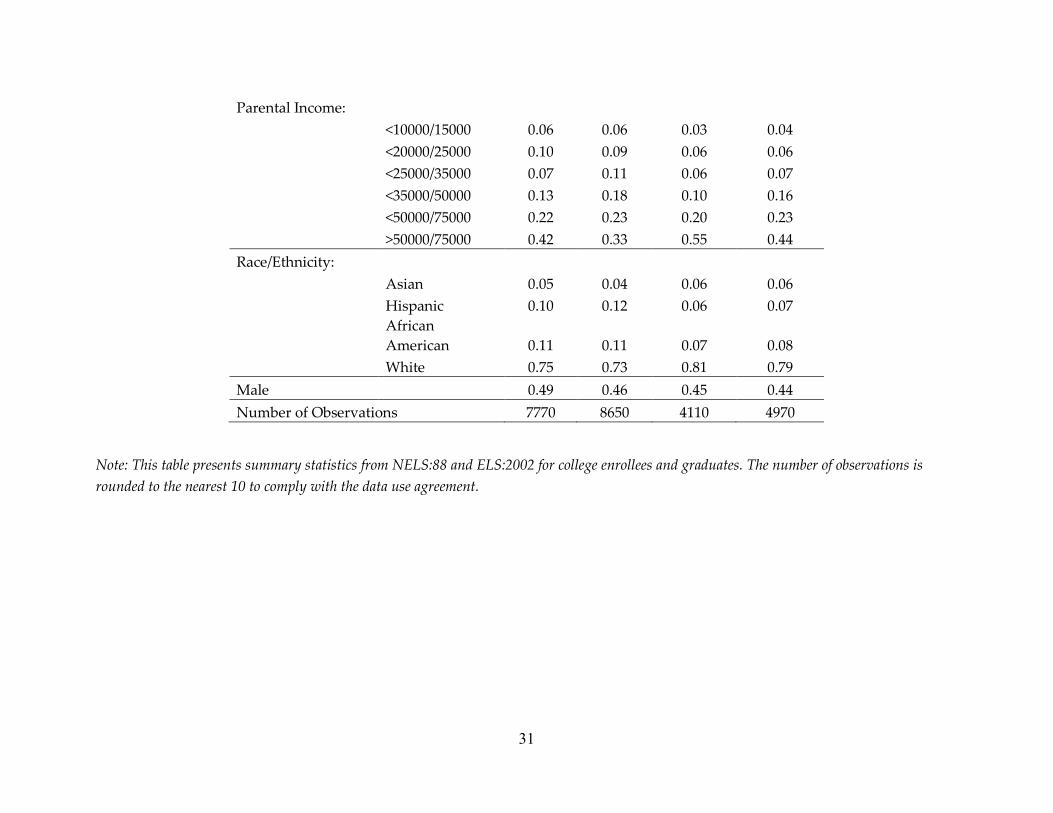
Table 3 presents summary statistics for our two samples. From NELS:88 to ELS:2002
college enrollees had lower math percentiles moving from 58.88 to 55.92. Despite this decline in
preparation, first-year college GPA increased from 2.44 to 2.65. Student-faculty ratios increased
slightly 39.35 to 40.44. Parental education increased from NELS:88 to ELS:2002 where students
whose mother had at least a bachelor’s degree increased by 5 percentage points.
Underrepresented minorities constituted a bit larger fraction of college enrollment in ELS:2002
than in NELS:88. Parental income shifted towards middle incomes. Lastly, the fraction of
college students that are male declined from 49 percent to 46 percent.
19 We follow BLT’s imputation strategy by using multiple imputation by chained equation (MICE) algorithm, implemented by the STATA module “ICE.” See the data appendix for more information on imputation. 20 We deviate from BLT’s assignment due to a few cases, which are described in the appendix. We opted for using the same rankings to aid in comparability and because rankings are quite stable across years. 21 We follow BLT in classifying armed services academies as private rather than public institutions. While they are publically funded, in many ways, e.g. academic ability of students, they are more similar to highly selective private institutions.
12
5. Empirical Strategy
We wish to decompose the increase in college graduation rates into student factors and
institutional factors. In doing this, we closely follow the method used by BLT. The key challenge
arises because we are interested in graduation, which is discrete. Throughout this section both
institutional and student factors will be referred to as 𝑥𝑥𝑗𝑗.
First, we use a logit model to predict college completion in both the NELS:88 and
ELS:2002 samples. This allows for nonlinear effects of any 𝑥𝑥𝑗𝑗 which are likely to be important in
describing changes in graduation rates. If we were using a linear framework, we could simply
take the mean change in observable characteristics (𝑥𝑥𝑗𝑗) across the two periods and multiply it
by the estimated effect of the observable characteristic. However, a nonlinear framework does
not allow this simple decomposition because the effect of changes in a given observable
characteristic not only depends on the mean size of the change, but also where in the
distribution of the characteristic that change occurs. To simulate the overall change in
graduation rates, we use the estimates from the ELS:2002 and the covariates in the NELS:88 to
generate a predicted probability of graduation. Generating how much of the overall change is
due to changes in all characteristics simply compares the predicted graduation rates using
NELS:88 covariates combined with the estimated coefficients from the ELS:2002 to the actual
graduation rates in the ELS:2002.
However, we also wish to examine the effect of a particular 𝑥𝑥𝑗𝑗, which is not as
straightforward. In principle, we would like to generate the distribution of a particular 𝑥𝑥𝑗𝑗 from
the ELS:2002 sample (i.e. the later cohort) in the NELS:88 sample (i.e. the early cohort) while
holding all other variables constant. We follow BLT and do this by matching observations
across samples. We will use an example to illustrate this point—math test score percentile. For
all students in NELS:88 we assign each student a rank in the distribution of math test scores; we
also do this for all students in ELS:2002. We then match each student in the ELS:2002 with the
student who has the same rank in the NELS:88 and assign the test score percentile from the
NELS:88. We break ties randomly. This process ensures that we do not assign students with
13
high math scores with students who we would expect to go to have low math scores.22 After
matching, we then apply the estimates from the ELS:2002 model and see how predicted
graduation probabilities change.23
To interpret these changes causally, we must assume that the logit model of graduation
on 𝑥𝑥𝑗𝑗 accurately captures the causal effect and the relationship between the 𝑥𝑥𝑗𝑗 and graduation is
the same in both time periods. This is a strong assumption that may not hold. However, even if
this strong assumption does not hold, this framework developed in BLT offers a consistent way
to decompose the changes in the graduation rate into the changes in 𝑥𝑥𝑗𝑗.
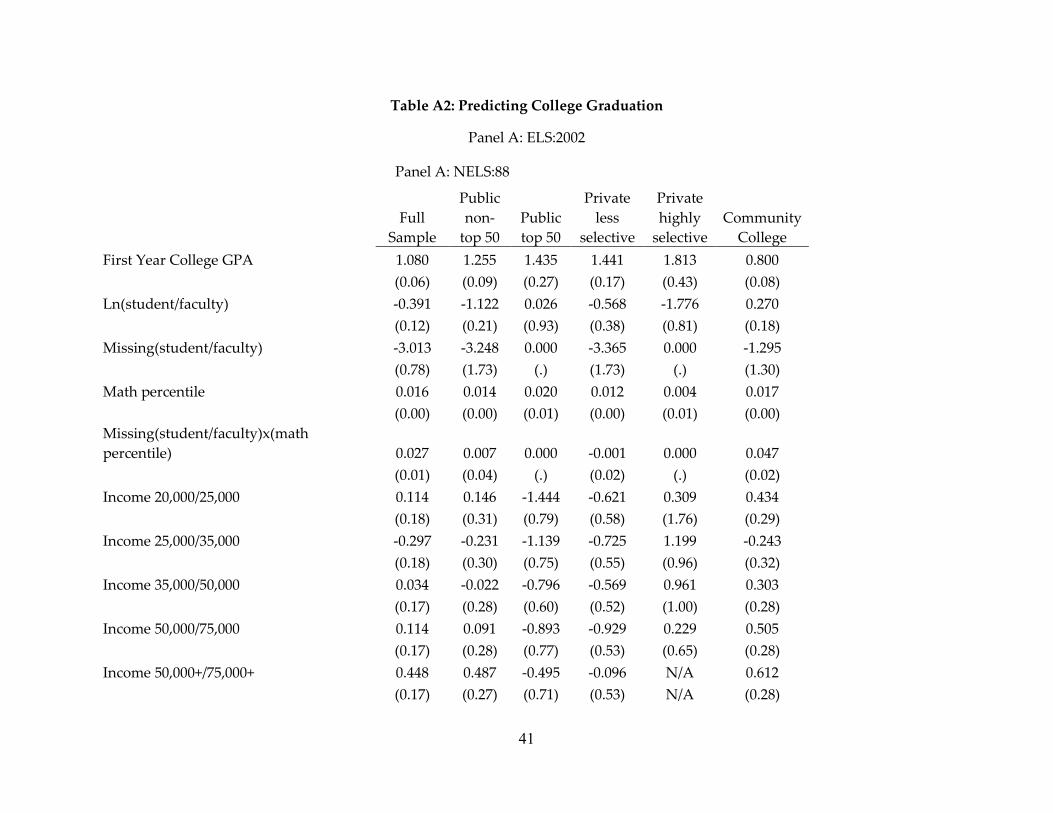
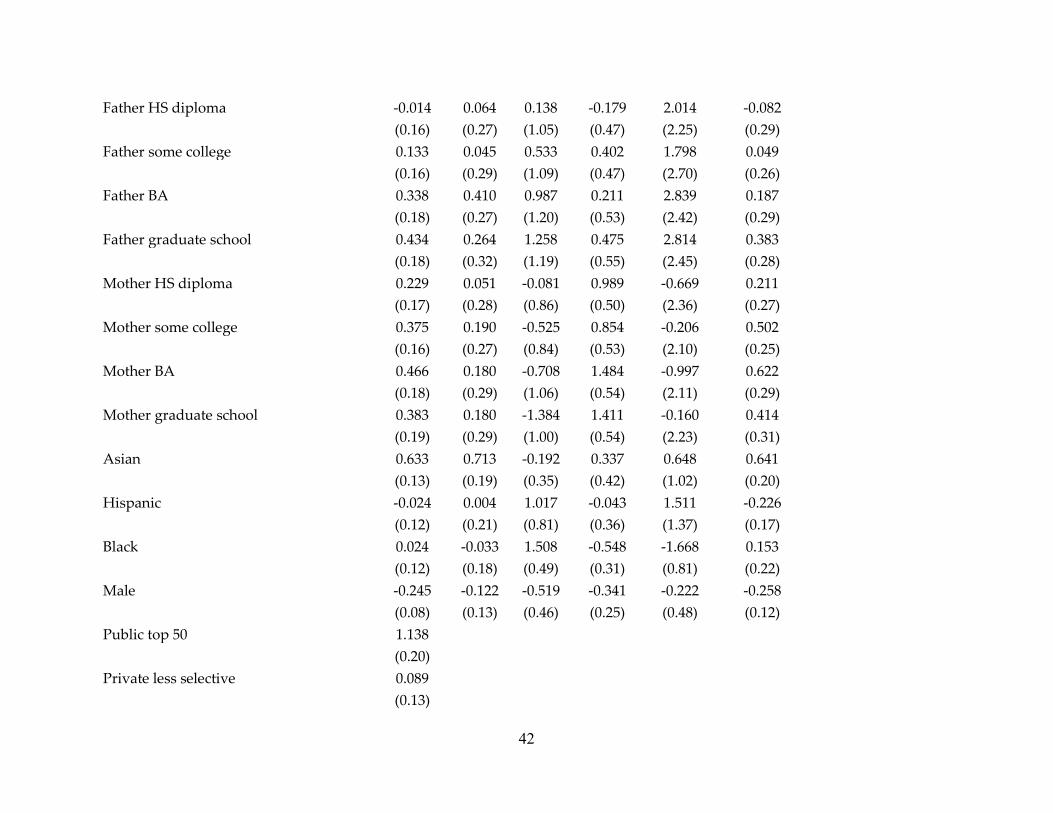
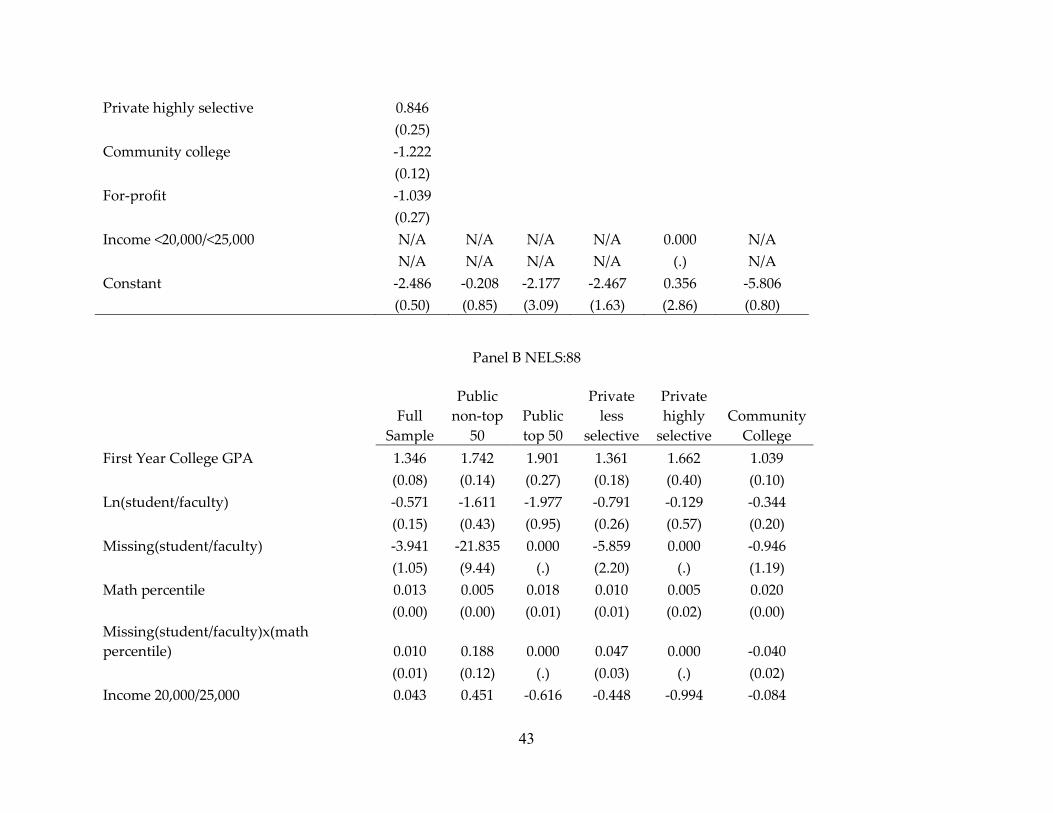
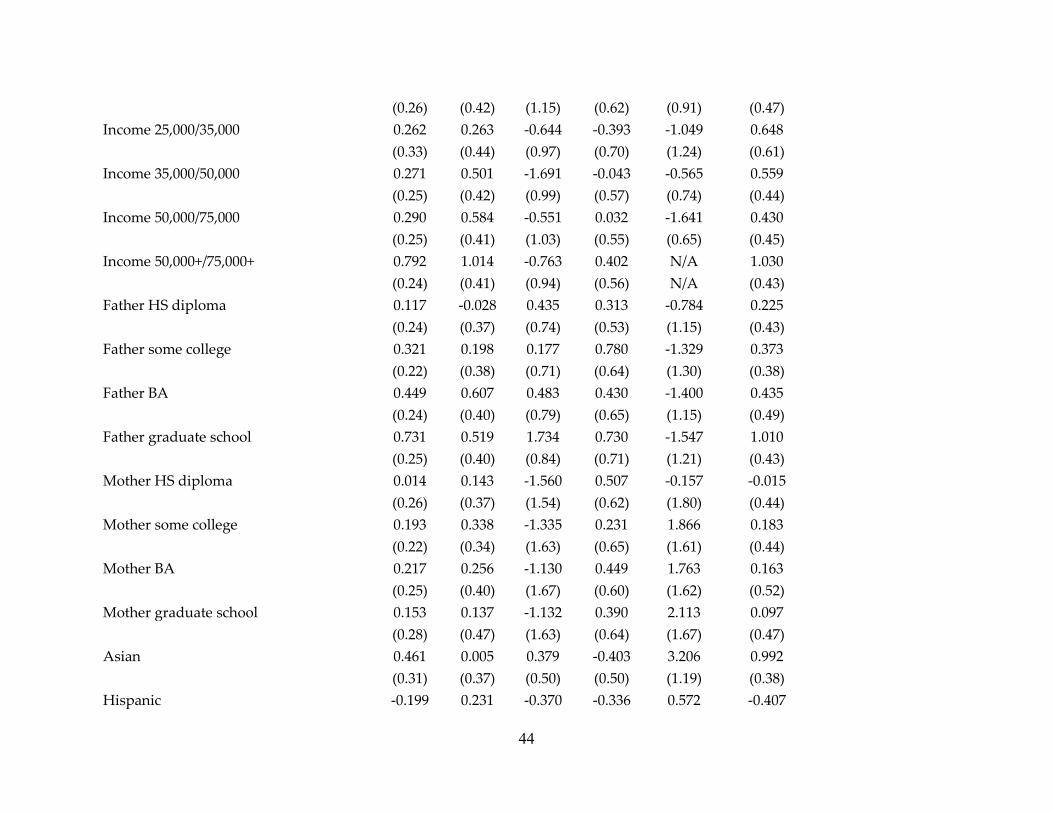
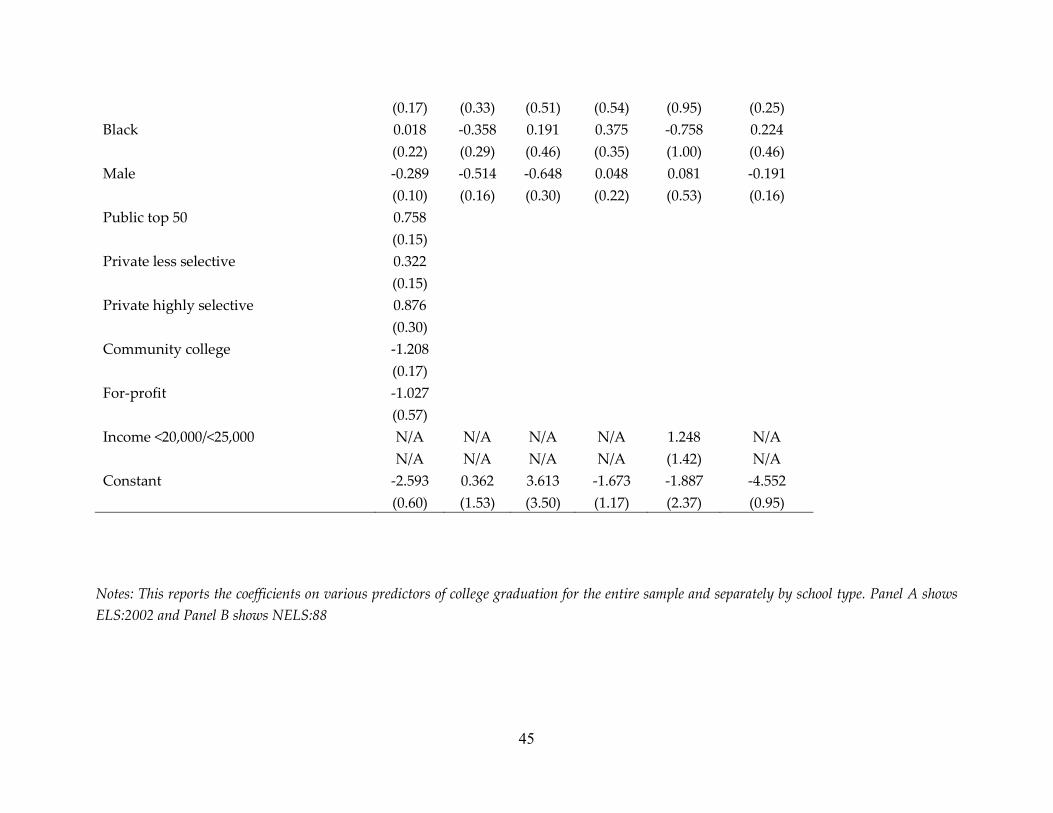
The coefficients from the logit for the whole sample and by school type are presented in
Table A2 in the Appendix with ELS:2002 in Panel A and NELS:88 presented in Panel B. We do
not discuss these in detail but do note that the coefficients have the expected sign. In particular,
a higher student-faculty ratio, lower income, being male, and lower parental educational
attainment are associated with reduced probability of graduation.
6. Results
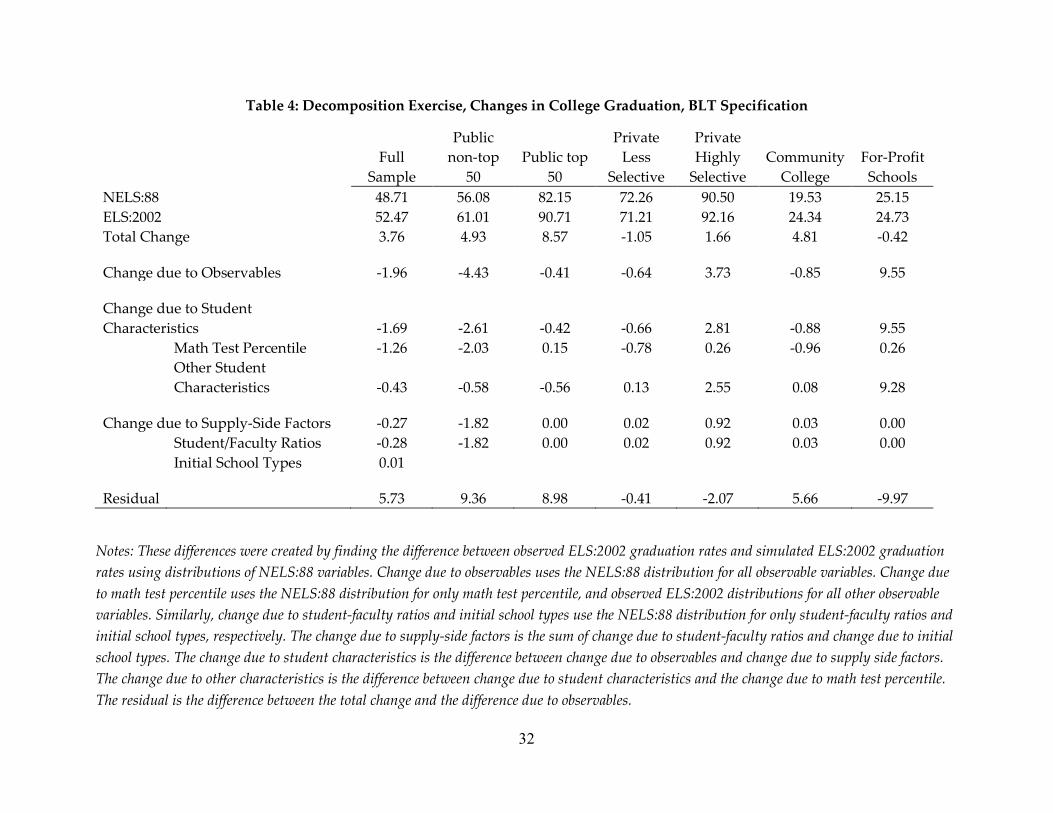
We first start with our base specification which includes measures of student preparedness, the
log of the student-faculty ratio and initial school type in Table 4. This is the same specification
used in BLT for comparability. It decomposes the change in graduation rates into two main
groups. First, we consider changes due to student characteristics (demand side) which include
math percentile and other student characteristics such as parent education, income, and race.
Second, we present changes due to institution-level factors (supply side) which includes
student-faculty ratios and initial school types.
Focusing on the full sample, there is a 3.76 percentage point increase in the probability of
graduation from the NELS:88 cohort to the ELS:2002 cohort. The total explained by observable
characteristics is -1.96. This suggests that covariates would predict that graduation rates would
22 We also reweight ELS:2002 and NELS:88 to have the same number of observations to facilitate matching. For initial college enrolled there is not a natural ranking of school types and so we use propensity score matching to predict which college a student would attend. Following BLT, we used propensity score matching implemented with the STATA module “psmatch2.” 23 Alternatively, we could use the estimates from NELS:88 and distribution of the covariates from ELS:2002. These results are very similar to those presented in the paper.
14
decrease by 1.96 percentage points. Hence, the residual or unexplained change is 5.73 percentage
points or 152 percent of the change is unexplained by covariates. Student preparedness would
predict a decline in graduation rates of 1.26 percentage points. Student-faculty ratios explain a
0.28 percentage point decline and initial school type explains a 0.01 percentage point increase in
graduation rates.
Based on the full sample, Table 4 shows that the distribution of student characteristics
and supply side factors cannot explain much of the increase in graduation rate—in fact, they
predict graduation declines. This finding was previewed in Section 3 where many of the trends
that may affect graduation went in the wrong direction to explain completion rate trends.
Hence, we spend the rest of the paper exploring explanations not considered in BLT.
One reason that previous explanations no longer explain the change in graduation rates
is that the covariates are no longer predictive of graduation. However, Appendix Table A2
reports the coefficients for various covariates. All have the expected sign and are statistically
significant. Further, the coefficients are qualitatively similar across the samples.
6.1 Changing Standards for Degree Receipt
In section 3 we previewed a potential change that could explain increasing graduation
rates despite the changes in student preparation and other covariates—standards for degree
receipt. If degrees have less stringent requirements, graduation rates could increase in the face
of declining student preparedness. Unfortunately, this mechanism is difficult to directly test.
Ideally, there would be a panel containing a measure of the standards of degree receipt. Such a
measure could include hours spent studying, content covered, measures of students learning,
among other items. However, even if such a panel existed, each of these measures is less than
ideal.
We develop an indirect measure for changing standards for degree receipt that focuses
on GPA. We document several things about GPA. First, GPA predicts graduation. Second,
GPAs are increasing over the time frame considered. Third, the growth in GPAs is not well
explained by student observable characteristics. These facts combined with trends in student
study time and employment suggest that standards for degree receipt have changed.
15
GPA predicts graduation
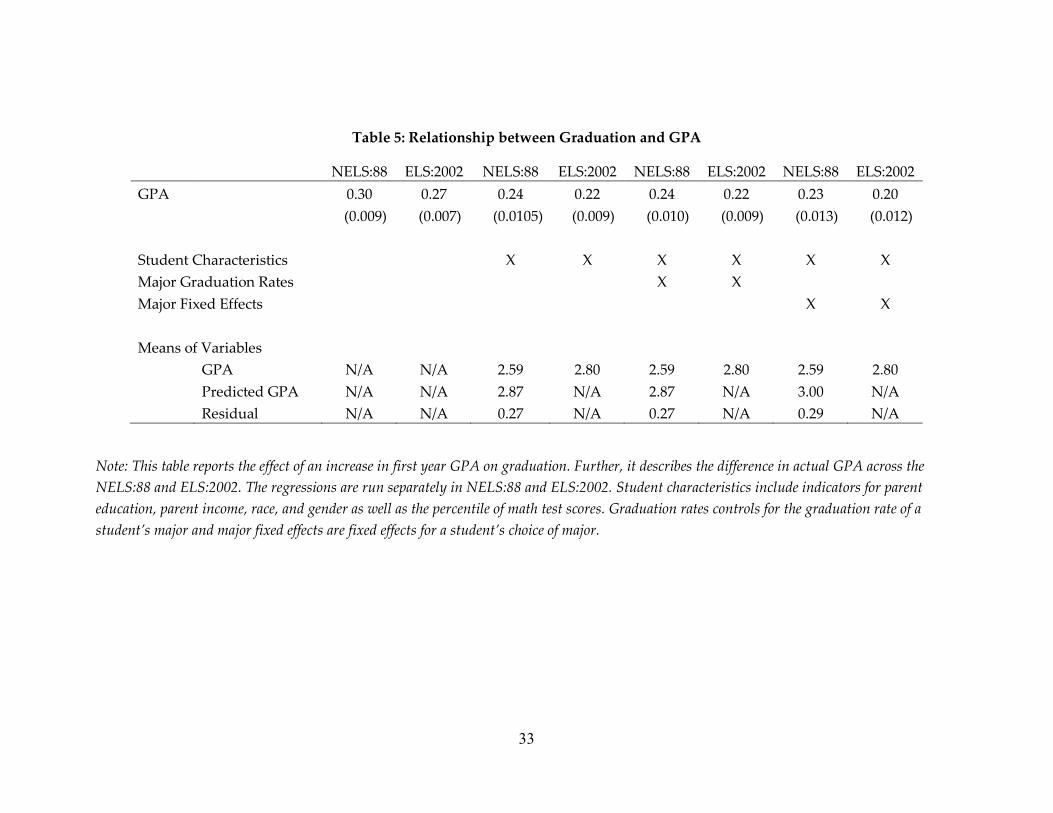
First year college GPA is predictive of graduation. Table 5 presents the coefficients from
a linear probability model where graduation is predicted using a linear effect of GPA. We run
these regressions separately in NELS:88 and ELS:2002. The relationship between GPA and
graduation rate is very similar so we focus on NELS:88 in our discussion. Without controlling
for any other covariates, a one unit increase in GPA is associated with a 30 percentage point
increase in the probability of graduation. After controlling for student characteristics, an
increase in GPA of 1 point is associated with an approximately 24 percentage point increase in
graduation (standard error 1 percentage point). We also control for the graduation rate of the
major that students chose as well as major fixed effects and find that GPA is still highly
predictive of college graduation and very statistically significant.
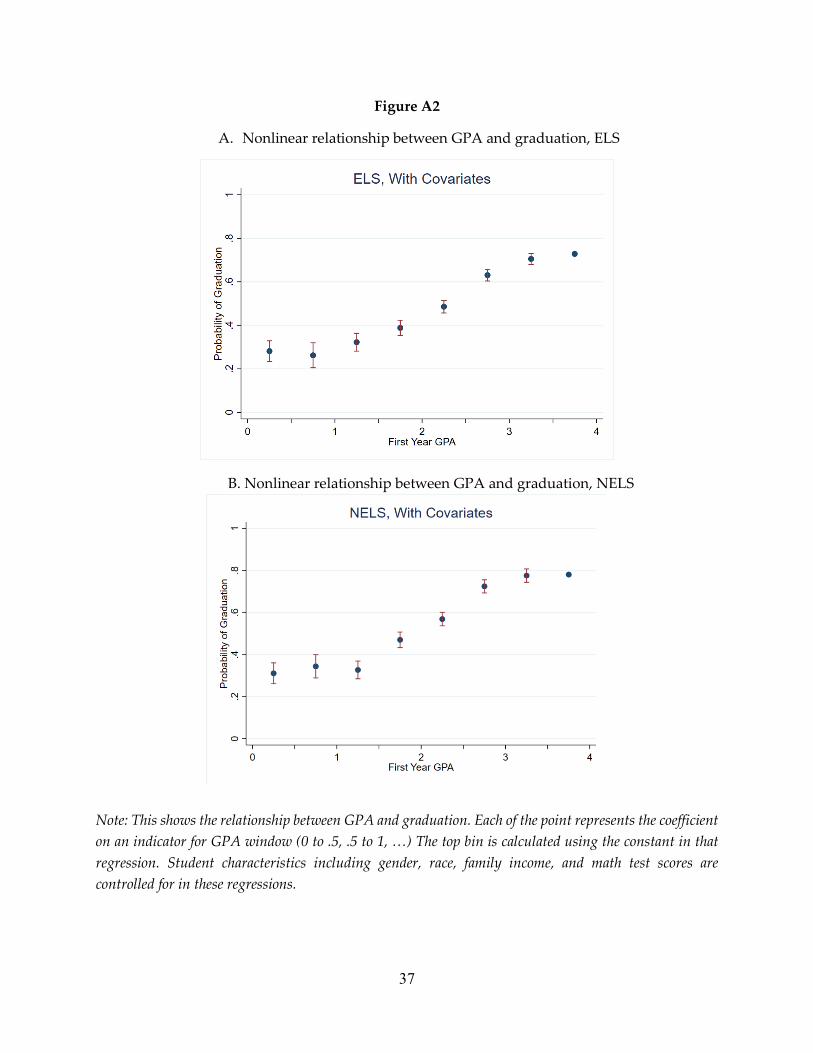
We show that this relationship is somewhat nonlinear in Figure A2. We regress
graduation on bins of GPA while controlling for covariates including demographics, test scores,
and institution type and plot the coefficients and 95% confidence intervals with GPAs larger
than 3.5 being the excluded category. The change in the probability of graduation is largest for
GPAs between 1.0 to 2.5. That is, improvements in GPAs in that range correlate with
meaningful increases in graduation whereas GPAs above or below that range do not change the
probability of graduation as much.
GPAs are increasing over time
Table 3 showed that average GPAs increased from 2.44 to 2.65 among college attendees.
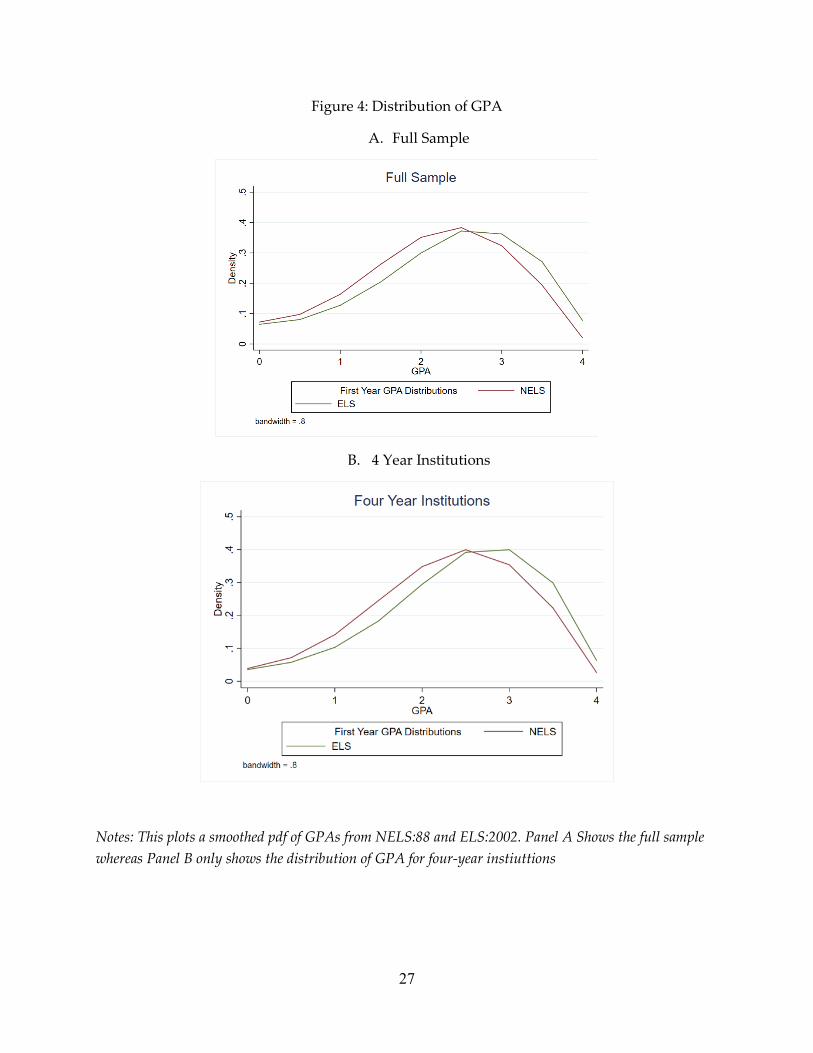
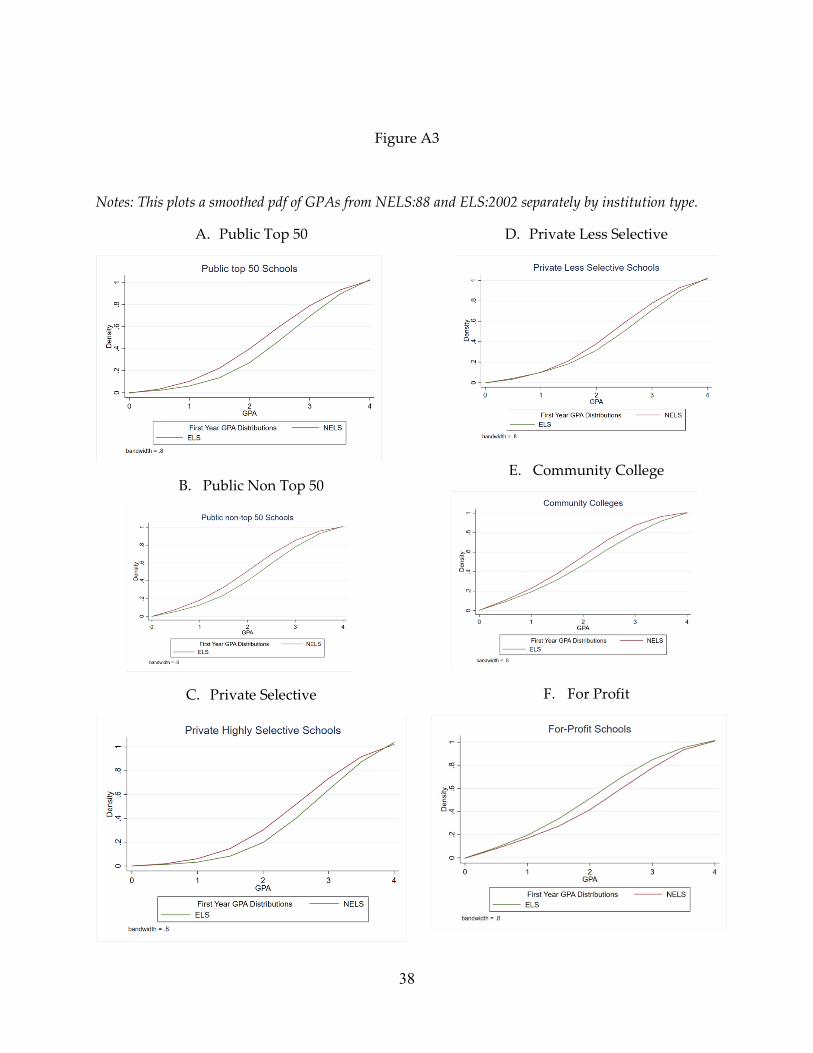
We explore this change in GPA in more detail—where did GPAs increase the most? Figure 4
shows that GPAs increased throughout the distribution for the full sample and when only
considering four-year schools. This is true when considering school types separately as shown
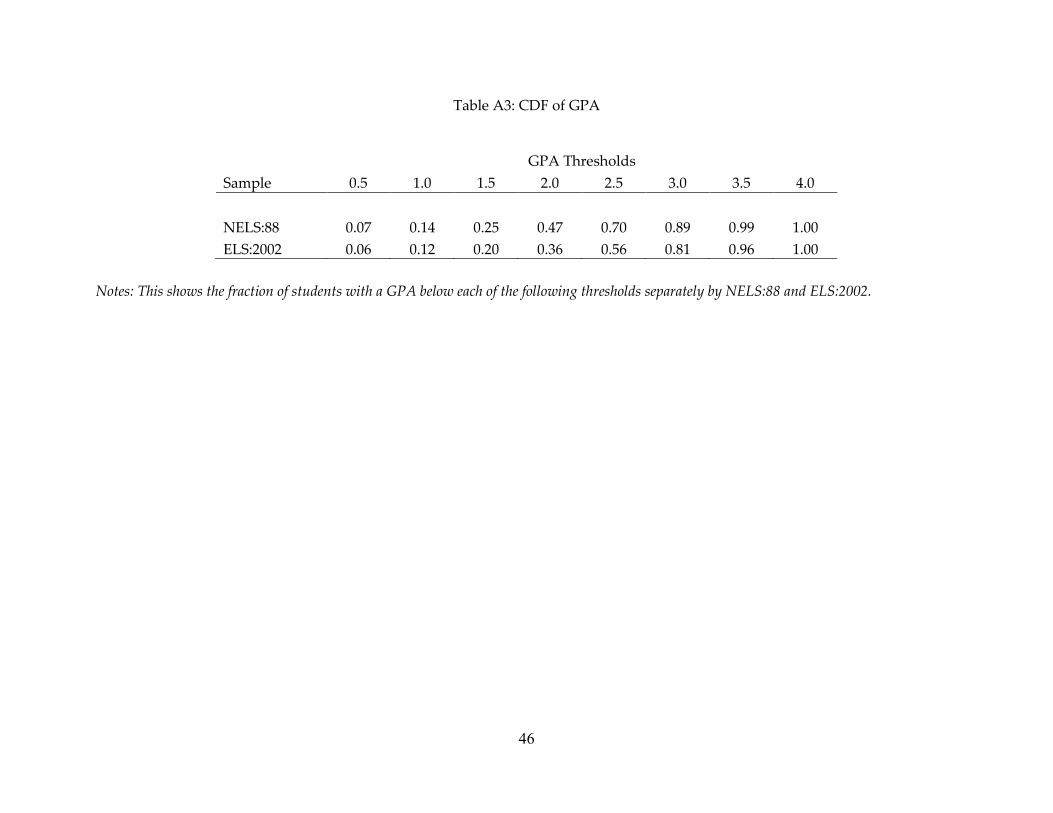
in Appendix Figure A3. Appendix Table A3 shows the cumulative density function of GPAs for
the full sample and reveals that 11 percent more students have a GPA above a 2.0 in ELS:2002
than in NELS:88. This point is notable because many institutions have rules about academic
16
probation requiring GPAs of around 2.0 to continue enrollment.24 Hence, the changes in GPA
occurred where GPA is most predictive of changes in graduation.
Higher GPAs are not explained by changes in student characteristics
GPAs are increasing over time and are not well-explained by changes in student
characteristics. We test this by regressing GPA on math score, demographic characteristics,
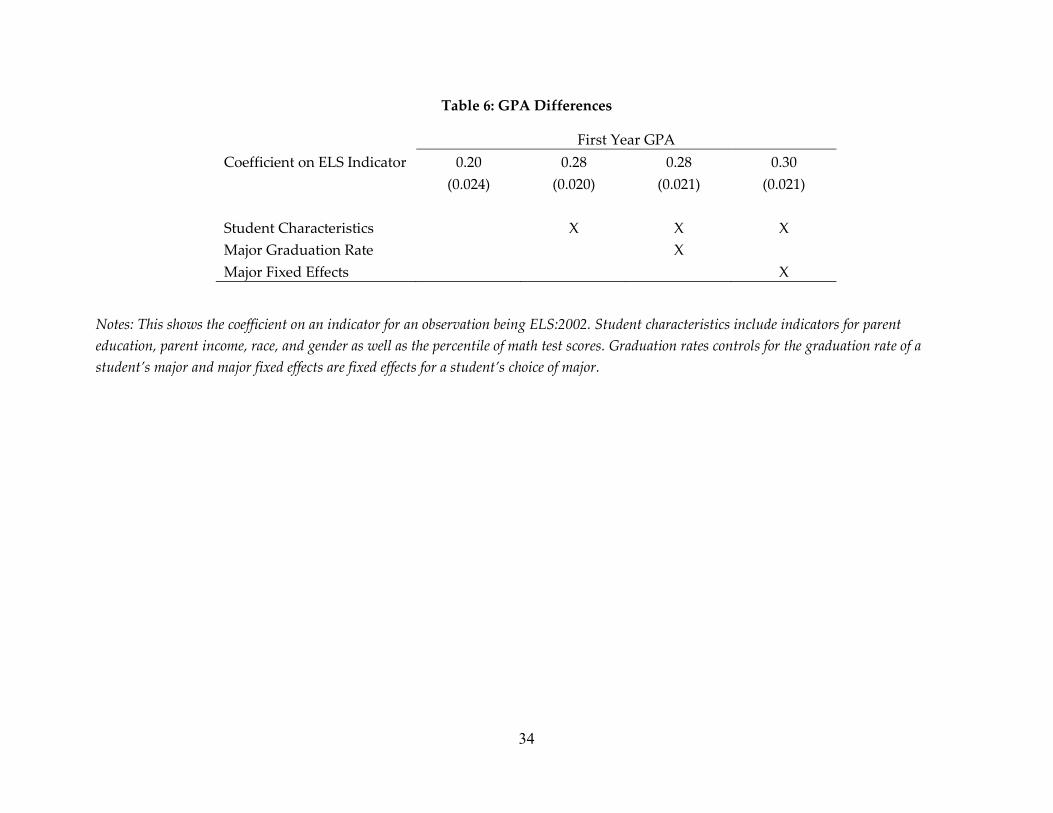
initial school type, and an indicator for being in the later period (being in ELS:2002) in Table 6. If
student characteristics changed in ways that predicted the change in GPA, the ELS:2002
indicator would become smaller with the additional controls. However, additional controls do
not change the effect of GPA substantively and there is a meaningful and statistically significant
coefficient on ELS ranging from 0.20 to 0.30 indicating that GPA is higher in ELS. We interpret
this evidence as the increase in GPA being unexplained by demographics, preparation, or
school type. Put another way, equally prepared students with the same family income, parental
education, gender, and institution type have higher GPAs in ELS:2002 than their counterparts in
NELS:88.
Interpreting these facts about GPA
We have documented that GPAs are higher at the end of our study period than they
were at the beginning and that the increase is not explained by observable student
characteristics. We interpret this evidence as consistent with decreasing standards for degree
receipt. However, other explanations are consistent with higher GPAs. For instance, students
could be studying more. Unfortunately, we do not observe student study time or effort in our
data. However, the trends presented in Babcock and Marks (2011) suggest that time spent
studying declined over this period. Another explanation is that perhaps students are more
efficient at studying. This could be true but is hard to test absent measures of student study. The
gains from efficiency would have to be large enough to exceed the decline in study time.
24 This can also be true for Satisfactory Academic Progress which is required to maintain financial aid eligibility (Schudde and Scott-Clayton, 2016). GPA can also act as a signal about a student’s suitability for college (Arcidiacono et al., 2016).
17
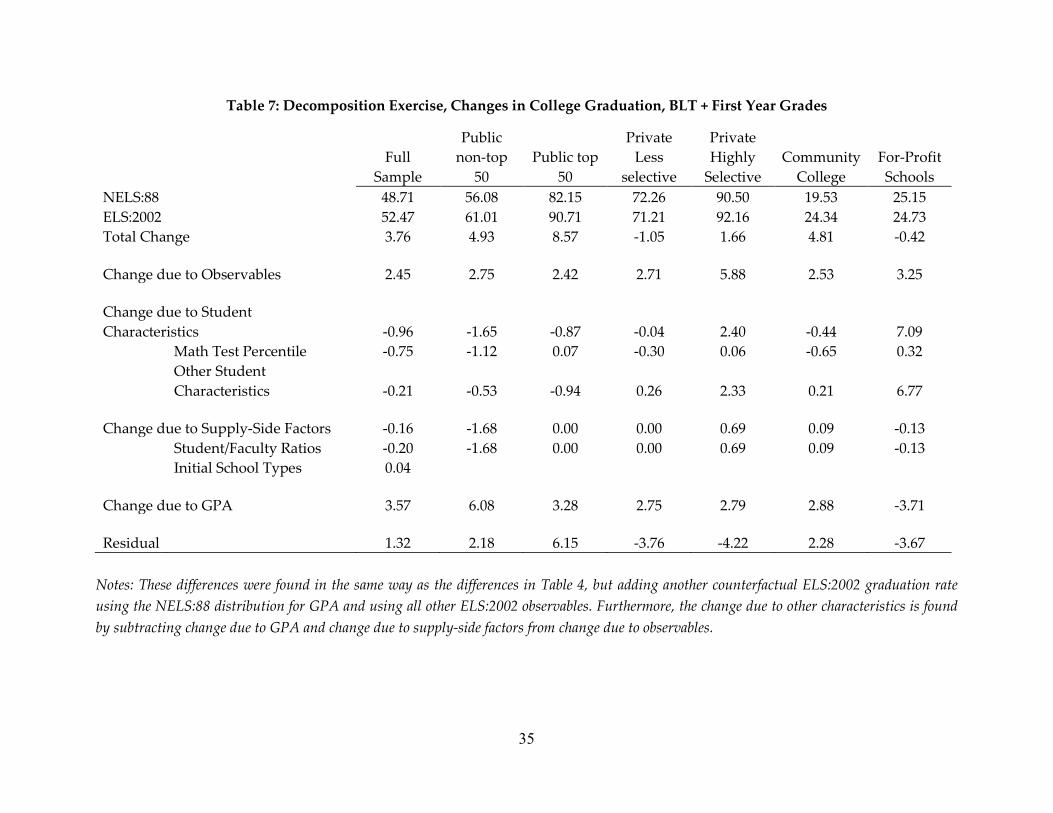
Adding GPA to the decomposition
Given the evidence that GPA is changing over time and that GPA is predictive of
graduation, we show how much of the change in graduation rates can be explained by changes
in GPA. We add GPA to the decomposition exercise since it is increasing over time and
predictive of graduation. We note that this is a “bad control” because it is endogenous to the
type of college a student attends among other things. We include it in the decomposition
analysis in the spirit of looking for a mediator rather than interpreting the effects of changing
GPA causally. Table 7 presents the same decomposition exercise with one notable change to the
specification used by BLT—the inclusion of first year GPA. The addition of GPA substantially
increases the change in graduation rate due to observables. For the full sample, the change due
to observables (including first year GPA) is 2.45 percentage points or 65 percent of the total
change. The change explained by GPA alone is 3.57 or 95 percent of the observed change. The
total change due to observables grows substantially with the inclusion of GPA at all schools. At
public non-top 50s (the largest category) observables explain 56 percent of the change in
graduation. First year GPA is an imperfect proxy for changing standards of degree receipt but
still explains a substantial portion of the observed change.
6.3 Major Choice and Other Explanations
We also investigate changes in student’s major. Trends in student’s major choice could
affect college graduation rates if students have moved to majors with higher graduation rates.
To isolate the effect of major choice, we fix major graduation rates at what they were in NELS:88
and apply them to the actual major choices made in ELS:2002. We find that predicted
graduation rates and actual graduation rates are very similar. In results not presented, we add a
student’s major graduation rate to the decomposition and we assign students the graduation
rate for their chosen major in NELS:88.25
25 For students who start at two-year colleges we do not assign major-specific graduation rates for two reasons. First, there are not that many students and so calculation of graduation rates is noisy. Second, majors are sufficiently different across two- and four-year schools that we do not want to combine the graduation rates at these types of institutions. Hence, we do not consider two-year schools in this table.
18
Another potential explanation for our results is that colleges may have increased their
focus on graduation rates by increasing programs and funding for student success initiatives.
This is a difficult mechanism to test for, however we examine this hypothesis. First, we look at
staff expenditures using data from IPEDS. Institutions report the spending of “other
professional staff” “for the primary purpose of performing academic support, student service,
and institutional support. This measure likely includes staff working on student success
initiatives but also includes things that are unlikely to be related to student success. Trends in
this variable can be seen in Appendix Table A1. Overall, spending on support programs cannot
explain much of the increase in graduation rates because they are largely the same across
cohorts.
7. Discussion and Conclusion
In this paper we carefully document that college graduation rates have increased from the 1990s
to 2010. This represents a change in the pattern documented by BLT. In contrast to BLT, we do
not find that traditional measures of student characteristics or colleges explain much of the
change in graduation rates. Rather, we show that student GPAs increased over this time period
and that this change can explain much of the increase in graduation rates.
We present evidence that the increase in GPA is not explained by observable student or
institution characteristics. Combined with existing work on trends in student study, college
preparation, labor supply, the price of college, and resources per student, our evidence suggests
that standards for degree receipt have changed.
Why did standards for degrees change from the 1990s to 2010? It is hard to know for
sure, but the recent policy focus on college completion rates seems a likely candidate. As
schools face increased scrutiny and, in some cases, increased funding incentives, they may be
responding by increasing graduation rates. The lowest cost way to increase graduation rates is
through changing standards of degree receipt. In support of this interpretation, the increase in
graduation rates is concentrated at public schools who have seen more of their funding tied to
19
graduation. Further, spending per student declined suggesting that colleges did not increase
spending to help students graduate.
Our findings have interesting implications for the returns to college degrees and the
increasing college wage premium, as well as for models of human capital or signaling. In either
a human capital or signaling model of education, declining standards of degree receipt would
predict a declining college wage premium. Our work may explain some of the decline in the
college wage premium that has been observed. In particular, this research suggests that
concurrent with the decline in standards for degree receipt, there was a demand shock for
college-educated labor that has been well documented in several places (Autor, Katz, and
Kearney 2008).
Future work should consider the implications that changing standards for degree receipt
has on other aspects of higher education such as choice of major, the skill composition of the
workforce, and the decision to enroll in graduate school.
20
References
Archibald, R. B., Feldman, D. H., & McHenry, P. (2015). A quality-preserving increase in four-year college attendance. Journal of Human Capital, 9(3), 265-297. Arcidiacono, P., Aucejo, E., Maurel, A., & Ransom, T. (2016). College attrition and the dynamics of information revelation (No. w22325). National Bureau of Economic Research. Ashworth, J., & Ransom, T. (2019). Has the College Wage Premium Continued to Rise? Evidence from Multiple US Surveys. Economics of Education Review, 69, 149-154. Autor, D. H., Katz, L. F., & Kearney, M. S. (2008). Trends in US wage inequality: Revising the revisionists. Review of Economics and Statistics, 90(2), 300-323. Babcock, Philip, and Mindy Marks. "The falling time cost of college: Evidence from half a century of time use data." Review of Economics and Statistics 93, no. 2 (2011): 468-478. Bailey, Martha J., and Susan M. Dynarski. “Inequality in Postsecondary Education” In G.J. Duncan and R.J. Murnane (eds.), Whither Opportunity? Rising Inequality, Schools, and Children’s Life Chances. (Russell Sage: New York, New York, September 2011) Barr, Andrew. “Fighting for Education: Veterans and Financial Aid” (2019). Journal of Labor Economics, 37(2), 509-544.
Bettinger, Eric, Oded Gurantz, Laura Kawano, and Bruce Sacerdote. The long run impacts of merit aid: Evidence from California’s Cal Grant. (2019) American Economic Journal: Economic Policy Bound, John, Michael F. Lovenheim, and Sarah Turner. "Why have college completion rates declined? An analysis of changing student preparation and collegiate resources." American Economic Journal: Applied Economics 2.3 (2010): 129-57. Bound, John, Michael F. Lovenheim, and Sarah Turner. "Increasing time to baccalaureate degree in the United States." Education Finance and Policy 7.4 (2012): 375-424. Castleman, Benjamin L., and Bridget Terry Long. "Looking beyond enrollment: The causal effect of need-based grants on college access, persistence, and graduation." Journal of Labor Economics 34, no. 4 (2016): 1023-1073. Cohodes, S. R., & Goodman, J. S. (2014). Merit aid, college quality, and college completion: Massachusetts' Adams scholarship as an in-kind subsidy. American Economic Journal: Applied Economics, 6(4), 251-85. CollegeBoard. “Trends in College Pricing 2017” Trends in Higher Education Series. (2017)
21
Deming, David J. "Increasing college completion with a federal higher education matching grant." The Hamilton Project, Policy Proposal 3 (2017). Deming, David J., Claudia Goldin, and Lawrence F. Katz. "The for-profit postsecondary school sector: Nimble critters or agile predators?" Journal of Economic Perspectives 26, no. 1 (2012): 139-64. Deming, David J., Claudia Goldin, Lawrence F. Katz, and Noam Yuchtman. "Can online learning bend the higher education cost curve?" American Economic Review 105, no. 5 (2015): 496-501.
Deming, David J., and Christopher R. Walters. "The Impact of State Budget Cuts on US Postsecondary Attainment." (2017) NBER Working Paper No 2373
Denning, Jeffrey T. (Forthcoming) “Born Under a Lucky Star: Financial Aid, College Completion, and Credit Constraints.” Journal of Human Resources.
Denning, Jeffrey T., Benjamin M. Marx, and Lesley J. Turner. (Forthcoming) “ProPelled: The Effects of Grants on Graduation, Earnings, and Welfare.” American Economic Journal: Applied Economics.
Gershenson, S. (2018). Grade Inflation in High Schools (2005–2016).
Goodman, Joshua, Michael Hurwitz, and Jonathan Smith. (2017). College Access, Initial College Choice and Degree Completion. Journal of Labor Economics 35(3), 829-867.
Griffith, A., Sovero V. (2019) “Under Pressure: Grade Inflation by Academics” Working Paper
Hess, F. M., & Hatalsky, L. E. (2018). Elevating College Completion. American Enterprise Institute.
Hillman, N. W., Hicklin Fryar, A., & Crespín-Trujillo, V. (2018). Evaluating the impact of performance funding in Ohio and Tennessee. American Educational Research Journal, 55(1), 144-170.
Hillman, N. W., Tandberg, D. A., & Fryar, A. H. (2015). Evaluating the impacts of “new” performance funding in higher education. Educational Evaluation and Policy Analysis, 37(4), 501-519.
Hillman, N. W., Tandberg, D. A., & Gross, J. P. (2014). Performance funding in higher education: Do financial incentives impact college completions?. The Journal of Higher Education, 85(6), 826-857.
Jaeger, David A. and Marianne E. Page. (1996). “Degrees Matter: New Evidence on Sheepskin Effects in the Returns to Education.” The Review of Economics and Statistics, Vol. 78, No. 4, pp. 733-740
22
National Center for Education Statistics (2013). “The Nation’s Report Card: Trends in Academic Progress 2012.”
National Center for Education Statistics (2018). “Digest of Education Statistics, 2016.”
Oreopoulos, Philip and Petronijevic, Uros. (2013). Making College Worth it: A Review of the Returns to Higher Education. The Future of Children. Vol. 23, No. 1.
Ost, Ben, Pan, Victor, and Douglas A. Webber. (2018). “The Returns to College Persistence for Marginal Students: Regression Discontinuity Evidence from University Dismissal Policies.” Journal of Labor Economics.
Pattison, E., Grodsky, E., & Muller, C. (2013). Is the sky falling? Grade inflation and the signaling power of grades. Educational Researcher, 42(5), 259-265.
Rojstaczer, S., & Healy, C. (2012). Where A is ordinary: The evolution of American college and university grading, 1940–2009. Teachers College Record, 114(7), 1-23.
Steven Ruggles, Sarah Flood, Ronald Goeken, Josiah Grover, Erin Meyer, Jose Pacas, and Matthew Sobek. IPUMS USA: Version 9.0 [dataset]. Minneapolis, MN: IPUMS, 2019. https://doi.org/10.18128/D010.V9.0
Schudde, L., & Scott-Clayton, J. (2016). Pell grants as performance-based scholarships? An examination of satisfactory academic progress requirements in the nation’s largest need-based aid program. Research in Higher Education, 57(8), 943-967.
Scott-Clayton, Judith. "On money and motivation a quasi-experimental analysis of financial incentives for college achievement." Journal of Human Resources 46, no. 3 (2011): 614-646.
Scott-Clayton, Judith. "What explains trends in labor supply among US undergraduates?." National Tax Journal 65, no. 1 (2012): 181.
Shapiro, D., Dundar, A., Huie, F., Wakhungu, P.K., Yuan, X., Nathan, A. & Bhimdiwali, A. (2017, December). “Completing College: A National View of Student Completion Rates – Fall 2011 Cohort" (Signature Report No.14)”. Herndon, VA: National Student Clearinghouse Research Center.
Tandberg, D. A., & Hillman, N. W. (2014). State higher education performance funding: Data, outcomes, and policy implications. Journal of Education Finance, 222-243.
Terry Long, Bridget (2018) “The College Completion Landscape: Trends, Challenges, and Why it Matters” Third Way. May 25, 2018.
Valletta, R. G. (2016). Recent flattening in the higher education wage premium: polarization, skill downgrading, or both? (No. w22935). National Bureau of Economic Research.
23
Zimmerman, Seth D. (2014). The Returns to College Admission for Academically Marginal Students. Journal of Labor Economics 32(4), 711-754.
24
Figures and Tables
Figure 1: Ratio of BA / Some College among 25 year-olds
Notes: Data come from the decennial census downloaded from the Integrated Public Use Microdata series database at IPUMS USA. Following BLT, we calculated the ratio of 25-year-olds having a bachelor’s degree to 25-year-olds with at least some college completed.
25
Figure 2 Graduate Rates by College Sector
Note: Source: IPEDS. This figure plots the average six-year graduation rate for different institution types. Cohort enrollment year refers to the year that students were first enrolled. See Section 4 in the text for a detailed description of how institutions are assigned to a type. Schools that were predominantly online are excluded for all cohorts. These rates were calculated using only students who were full-time, first-time degree seekers in their respective entry years.
26
Figure 3: College Enrollment Rates, Recent High School Completers
Note: The data comes from NCES Digest of Education Statistics Table 302.30 (National Center for Education Statistics 2018). This is the fraction of individuals age 16-24 enrolled in college as of October who recently graduated from high school or completed a GED. Enrollment is defined as enrollment in college as of October. Source: U.S. Department of Commerce, Census Bureau, Current Population Survey (CPS), October, 1975 through 2015.
0.4
0.5
0.6
0.7
0.8
1975 1980 1985 1990 1995 2000 2005 2010 2015
Enro
llmen
t Rat
e
Year
27
Figure 4: Distribution of GPA
A. Full Sample
B. 4 Year Institutions
Notes: This plots a smoothed pdf of GPAs from NELS:88 and ELS:2002. Panel A Shows the full sample whereas Panel B only shows the distribution of GPA for four-year instiuttions
28
Table 1: Changes in College Graduation Rates
Sample NELS:88 ELS:2002 Difference Full Sample 48.7 52.5 3.76**
(1.71) Initial Institution Type
Total Four-year Public 63.2 67.7 4.52*
(2.38) Non-top 50 Public 56.1 61.0 4.93*
(2.59) Top 50 Public 82.1 90.7 8.57***
(2.57) Total Four-year Private 78.4 77.2 -1.14
(2.30) Less Selective Private 72.3 71.2 -1.05
(2.96) Highly Selective Private 90.5 92.2 1.66
(2.76) Total Community College 19.5 24.3 4.81***
(1.70) For-Profit College 25.2 24.7 -0.42
(8.92) All Non-Profit Colleges 48.8 53.0 4.18**
(1.72) All Four-Year Colleges 68.3 70.6 2.33
(1.85)
Note: This table describes the graduation rates for college enrollees by school types for the NELS:88 and ELS:2002.
29
Table 2: Changes in Initial College Attended
NELS:88 Cohort ELS:2002 Cohort
Total Men Women Total Men Women Percent of HS grads Attending College 69.3 66.9 71.8 78.3 74.2 84.1
Distribution of Enrollment by Type of Institution
Total 4-year Public 39.9 39.7 40.1 42.2 42.7 41.7
Non-top 50 Public 28.9 28.3 29.6 32.6 33.2 32.1
Top 50 Public 10.9 11.4 10.5 9.6 9.4 9.6
Total 4-year Private 20.0 18.0 21.8 18.4 18.0 18.8
Less Selective Private 13.3 11.4 15.1 13.2 12.2 14.0
Highly Selective Private 6.7 6.7 6.7 5.2 5.8 4.7
Total Community College 39.8 41.8 37.9 37.2 36.6 37.6 For Profit Colleges 0.4 0.5 0.3 2.3 2.7 1.9
Note: This table describes the change in the fraction of students attending college within two years of expected high school graduation and initial college attended for the NELS:88 and ELS:2002.
30
Table 3: Summary Statistics NELS:88 and ELS:2002
All College Attendees BA Recipients
Variable NELS:88 ELS:2002 NELS:88 ELS:2002 Bottom Math Quartile 0.14 0.18 0.04 0.06 Second Math Quartile 0.23 0.24 0.16 0.18 Third Math Quartile 0.29 0.28 0.29 0.31 Top Math Quartile 0.33 0.30 0.51 0.45 Math Test Percentile 58.88 55.92 71.12 67.67 Student-Faculty Ratio 39.35 40.44 29.70 32.11 ln(S/F ratio) 3.52 3.55 3.28 3.55 Missing S/F Ratio 0.03 0.02 0.01 0.01 Student-Staff Ratio 199.55 197.22 105.70 120.12 First Year GPA 2.44 2.65 2.88 3.05 Major Graduation Rate (4-year schools) 0.76 0.76 0.77 0.77 Father's Education:
No HS 0.11 0.10 0.06 0.06
HS Diploma 0.29 0.28 0.21 0.22
Some College 0.22 0.22 0.22 0.21
BA 0.20 0.23 0.25 0.28 Grad School 0.18 0.17 0.27 0.24 Mother's Education:
No HS 0.10 0.09 0.05 0.05
HS Diploma 0.34 0.28 0.26 0.23
Some College 0.25 0.26 0.27 0.25
BA 0.18 0.23 0.25 0.28 Grad School 0.12 0.15 0.18 0.19
31
Parental Income: <10000/15000 0.06 0.06 0.03 0.04
<20000/25000 0.10 0.09 0.06 0.06
<25000/35000 0.07 0.11 0.06 0.07
<35000/50000 0.13 0.18 0.10 0.16
<50000/75000 0.22 0.23 0.20 0.23 >50000/75000 0.42 0.33 0.55 0.44 Race/Ethnicity:
Asian 0.05 0.04 0.06 0.06
Hispanic 0.10 0.12 0.06 0.07
African American 0.11 0.11 0.07 0.08
White 0.75 0.73 0.81 0.79 Male 0.49 0.46 0.45 0.44 Number of Observations 7770 8650 4110 4970
Note: This table presents summary statistics from NELS:88 and ELS:2002 for college enrollees and graduates. The number of observations is rounded to the nearest 10 to comply with the data use agreement.
32
Table 4: Decomposition Exercise, Changes in College Graduation, BLT Specification
Full Sample
Public non-top
50 Public top
50
Private Less
Selective
Private Highly
Selective Community
College For-Profit Schools
NELS:88 48.71 56.08 82.15 72.26 90.50 19.53 25.15 ELS:2002 52.47 61.01 90.71 71.21 92.16 24.34 24.73 Total Change 3.76 4.93 8.57 -1.05 1.66 4.81 -0.42
Change due to Observables -1.96 -4.43 -0.41 -0.64 3.73 -0.85 9.55
Change due to Student Characteristics -1.69 -2.61 -0.42 -0.66 2.81 -0.88 9.55
Math Test Percentile -1.26 -2.03 0.15 -0.78 0.26 -0.96 0.26
Other Student Characteristics -0.43 -0.58 -0.56 0.13 2.55 0.08 9.28
Change due to Supply-Side Factors -0.27 -1.82 0.00 0.02 0.92 0.03 0.00
Student/Faculty Ratios -0.28 -1.82 0.00 0.02 0.92 0.03 0.00 Initial School Types 0.01
Residual 5.73 9.36 8.98 -0.41 -2.07 5.66 -9.97
Notes: These differences were created by finding the difference between observed ELS:2002 graduation rates and simulated ELS:2002 graduation rates using distributions of NELS:88 variables. Change due to observables uses the NELS:88 distribution for all observable variables. Change due to math test percentile uses the NELS:88 distribution for only math test percentile, and observed ELS:2002 distributions for all other observable variables. Similarly, change due to student-faculty ratios and initial school types use the NELS:88 distribution for only student-faculty ratios and initial school types, respectively. The change due to supply-side factors is the sum of change due to student-faculty ratios and change due to initial school types. The change due to student characteristics is the difference between change due to observables and change due to supply side factors. The change due to other characteristics is the difference between change due to student characteristics and the change due to math test percentile. The residual is the difference between the total change and the difference due to observables.
33
Table 5: Relationship between Graduation and GPA
NELS:88 ELS:2002 NELS:88 ELS:2002 NELS:88 ELS:2002 NELS:88 ELS:2002 GPA 0.30 0.27 0.24 0.22 0.24 0.22 0.23 0.20
(0.009) (0.007) (0.0105) (0.009) (0.010) (0.009) (0.013) (0.012)
Student Characteristics X X X X X X Major Graduation Rates X X Major Fixed Effects X X
Means of Variables
GPA N/A N/A 2.59 2.80 2.59 2.80 2.59 2.80
Predicted GPA N/A N/A 2.87 N/A 2.87 N/A 3.00 N/A Residual N/A N/A 0.27 N/A 0.27 N/A 0.29 N/A
Note: This table reports the effect of an increase in first year GPA on graduation. Further, it describes the difference in actual GPA across the NELS:88 and ELS:2002. The regressions are run separately in NELS:88 and ELS:2002. Student characteristics include indicators for parent education, parent income, race, and gender as well as the percentile of math test scores. Graduation rates controls for the graduation rate of a student’s major and major fixed effects are fixed effects for a student’s choice of major.
34
Table 6: GPA Differences
First Year GPA Coefficient on ELS Indicator 0.20 0.28 0.28 0.30
(0.024) (0.020) (0.021) (0.021)
Student Characteristics X X X Major Graduation Rate X Major Fixed Effects X
Notes: This shows the coefficient on an indicator for an observation being ELS:2002. Student characteristics include indicators for parent education, parent income, race, and gender as well as the percentile of math test scores. Graduation rates controls for the graduation rate of a student’s major and major fixed effects are fixed effects for a student’s choice of major.
35
Table 7: Decomposition Exercise, Changes in College Graduation, BLT + First Year Grades
Full Sample
Public non-top
50 Public top
50
Private Less
selective
Private Highly
Selective Community
College For-Profit Schools
NELS:88 48.71 56.08 82.15 72.26 90.50 19.53 25.15 ELS:2002 52.47 61.01 90.71 71.21 92.16 24.34 24.73 Total Change 3.76 4.93 8.57 -1.05 1.66 4.81 -0.42
Change due to Observables 2.45 2.75 2.42 2.71 5.88 2.53 3.25
Change due to Student Characteristics -0.96 -1.65 -0.87 -0.04 2.40 -0.44 7.09
Math Test Percentile -0.75 -1.12 0.07 -0.30 0.06 -0.65 0.32
Other Student Characteristics -0.21 -0.53 -0.94 0.26 2.33 0.21 6.77
Change due to Supply-Side Factors -0.16 -1.68 0.00 0.00 0.69 0.09 -0.13
Student/Faculty Ratios -0.20 -1.68 0.00 0.00 0.69 0.09 -0.13 Initial School Types 0.04
Change due to GPA 3.57 6.08 3.28 2.75 2.79 2.88 -3.71
Residual 1.32 2.18 6.15 -3.76 -4.22 2.28 -3.67 Notes: These differences were found in the same way as the differences in Table 4, but adding another counterfactual ELS:2002 graduation rate using the NELS:88 distribution for GPA and using all other ELS:2002 observables. Furthermore, the change due to other characteristics is found by subtracting change due to GPA and change due to supply-side factors from change due to observables.
36
Appendix
Figure A1: Total Number of Enrollees by Sector
Source: IPEDS. This figure plots the total number of students enrolled by institution type. It shows the average six-year graduation rate for different institution types. Cohort enrollment year refers to the year that students were first enrolled. See Section 4 in the text for a detailed description of how institutions are assigned to a type. Schools that were predominantly online are excluded for all cohorts. These totals were calculated only using students who were first-time, full-time degree seeking students in their respective entry years.
37
Figure A2
A. Nonlinear relationship between GPA and graduation, ELS
B. Nonlinear relationship between GPA and graduation, NELS
Note: This shows the relationship between GPA and graduation. Each of the point represents the coefficient on an indicator for GPA window (0 to .5, .5 to 1, …) The top bin is calculated using the constant in that regression. Student characteristics including gender, race, family income, and math test scores are controlled for in these regressions.
38
Figure A3
Notes: This plots a smoothed pdf of GPAs from NELS:88 and ELS:2002 separately by institution type.
A. Public Top 50
B. Public Non Top 50
C. Private Selective
D. Private Less Selective
E. Community College
F. For Profit
39
Table A1: College Resources
Panel A: Full Sample Student-Faculty Ratios Mean Instructional
Expenditures per Student
Mean Service Expenditures per Student
Percentile Survey Mean 25th 50th 75th 90th NELS:88 39.4 22.7 30.3 50.5 76.4 $4,581 $796 ELS:2002 40.4 23.6 31.7 52.6 77.8 $4,287 $806
Panel B: Public 4-Year Non-top 50 Student-Faculty Ratios Mean Instructional
Expenditures per Student
Mean Service Expenditures per Student
Percentile Survey Mean 25th 50th 75th 90th NELS:88 29.0 24.1 27.9 33.2 38.7 $5,185 $828 ELS:2002 32.9 24.9 28.8 34.5 46.5 $4,728 $822
Panel C: Public 4-year Top 50 Student-Faculty Ratios Mean Instructional
Expenditures per Student
Mean Service Expenditures per Student
Percentile Survey Mean 25th 50th 75th 90th NELS:88 22.7 20.7 22.2 25.2 26.3 $9,716 $922 ELS:2002 22.7 20.0 22.2 25.3 28.5 $9,681 $1,093
Panel D: Private 4-year Less Selective Student-Faculty Ratios Mean Instructional
Expenditures per Student
Mean Service Expenditures per Student
Percentile Survey Mean 25th 50th 75th 90th NELS:88 24.0 17.1 20.7 26.5 35.6 $5,763 $1,820 ELS:2002 23.8 16.9 21.5 27.4 35.6 $6,681 $2,365
Panel E: Private 4-year Highly Selective Student-Faculty Ratios Mean Instructional
Expenditures per Student
Mean Service Expenditures per Student
Percentile Survey Mean 25th 50th 75th 90th NELS:88 19.6 13.8 19.1 23.6 27.3 $14,747 $2,245 ELS:2002 18.3 12.3 18.1 23.5 26.3 $15,900 $2,815
Panel F: 2-Year Student-Faculty Ratios Mean Instructional
Expenditures per Student
Mean Service Expenditures per Student
Percentile Survey Mean 25th 50th 75th 90th NELS:88 60.6 41.0 59.3 76.4 91.1 $2,683 $552 ELS:2002 60.9 43.5 59.4 76.3 90.1 $2,467 $555
40
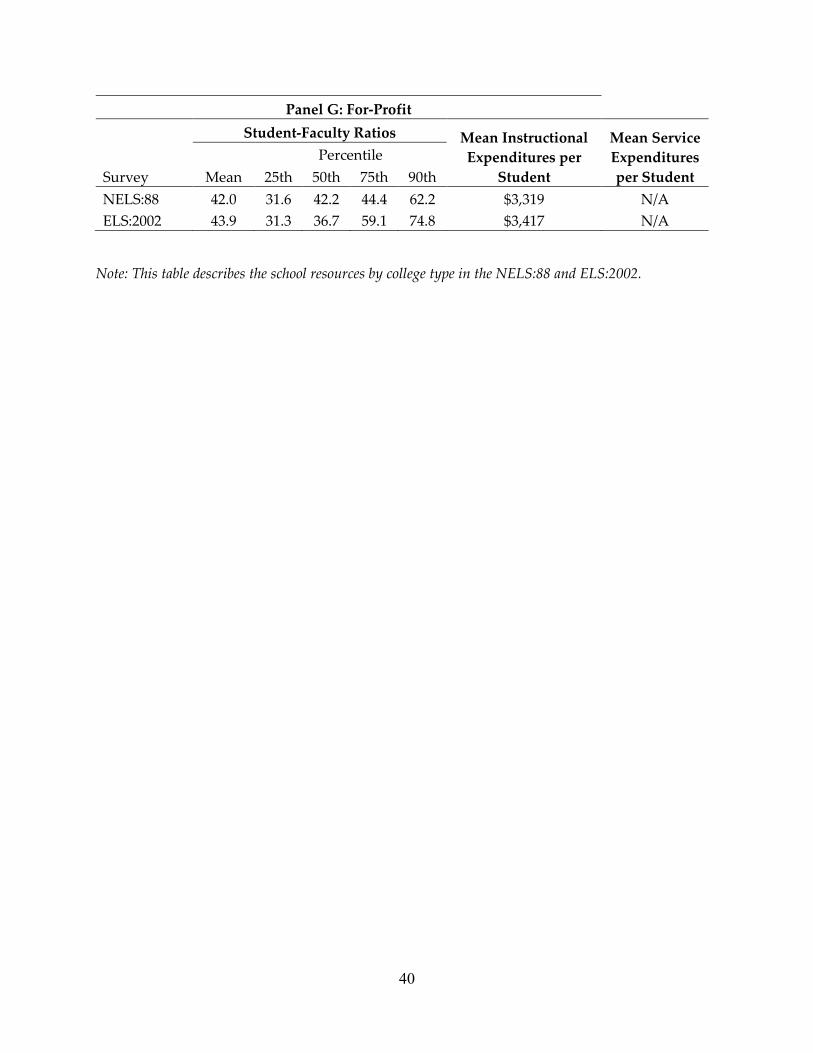
Panel G: For-Profit Student-Faculty Ratios Mean Instructional
Expenditures per Student
Mean Service Expenditures per Student
Percentile Survey Mean 25th 50th 75th 90th NELS:88 42.0 31.6 42.2 44.4 62.2 $3,319 N/A ELS:2002 43.9 31.3 36.7 59.1 74.8 $3,417 N/A
Note: This table describes the school resources by college type in the NELS:88 and ELS:2002.
41
Table A2: Predicting College Graduation
Panel A: ELS:2002
Panel A: NELS:88
Full
Sample
Public non-
top 50 Public top 50
Private less
selective
Private highly
selective Community
College First Year College GPA 1.080 1.255 1.435 1.441 1.813 0.800
(0.06) (0.09) (0.27) (0.17) (0.43) (0.08) Ln(student/faculty) -0.391 -1.122 0.026 -0.568 -1.776 0.270
(0.12) (0.21) (0.93) (0.38) (0.81) (0.18) Missing(student/faculty) -3.013 -3.248 0.000 -3.365 0.000 -1.295
(0.78) (1.73) (.) (1.73) (.) (1.30) Math percentile 0.016 0.014 0.020 0.012 0.004 0.017
(0.00) (0.00) (0.01) (0.00) (0.01) (0.00) Missing(student/faculty)x(math percentile) 0.027 0.007 0.000 -0.001 0.000 0.047
(0.01) (0.04) (.) (0.02) (.) (0.02) Income 20,000/25,000 0.114 0.146 -1.444 -0.621 0.309 0.434
(0.18) (0.31) (0.79) (0.58) (1.76) (0.29) Income 25,000/35,000 -0.297 -0.231 -1.139 -0.725 1.199 -0.243
(0.18) (0.30) (0.75) (0.55) (0.96) (0.32) Income 35,000/50,000 0.034 -0.022 -0.796 -0.569 0.961 0.303
(0.17) (0.28) (0.60) (0.52) (1.00) (0.28) Income 50,000/75,000 0.114 0.091 -0.893 -0.929 0.229 0.505
(0.17) (0.28) (0.77) (0.53) (0.65) (0.28) Income 50,000+/75,000+ 0.448 0.487 -0.495 -0.096 N/A 0.612
(0.17) (0.27) (0.71) (0.53) N/A (0.28)
42
Father HS diploma -0.014 0.064 0.138 -0.179 2.014 -0.082
(0.16) (0.27) (1.05) (0.47) (2.25) (0.29) Father some college 0.133 0.045 0.533 0.402 1.798 0.049
(0.16) (0.29) (1.09) (0.47) (2.70) (0.26) Father BA 0.338 0.410 0.987 0.211 2.839 0.187
(0.18) (0.27) (1.20) (0.53) (2.42) (0.29) Father graduate school 0.434 0.264 1.258 0.475 2.814 0.383
(0.18) (0.32) (1.19) (0.55) (2.45) (0.28) Mother HS diploma 0.229 0.051 -0.081 0.989 -0.669 0.211
(0.17) (0.28) (0.86) (0.50) (2.36) (0.27) Mother some college 0.375 0.190 -0.525 0.854 -0.206 0.502
(0.16) (0.27) (0.84) (0.53) (2.10) (0.25) Mother BA 0.466 0.180 -0.708 1.484 -0.997 0.622
(0.18) (0.29) (1.06) (0.54) (2.11) (0.29) Mother graduate school 0.383 0.180 -1.384 1.411 -0.160 0.414
(0.19) (0.29) (1.00) (0.54) (2.23) (0.31) Asian 0.633 0.713 -0.192 0.337 0.648 0.641
(0.13) (0.19) (0.35) (0.42) (1.02) (0.20) Hispanic -0.024 0.004 1.017 -0.043 1.511 -0.226
(0.12) (0.21) (0.81) (0.36) (1.37) (0.17) Black 0.024 -0.033 1.508 -0.548 -1.668 0.153
(0.12) (0.18) (0.49) (0.31) (0.81) (0.22) Male -0.245 -0.122 -0.519 -0.341 -0.222 -0.258
(0.08) (0.13) (0.46) (0.25) (0.48) (0.12) Public top 50 1.138
(0.20) Private less selective 0.089
(0.13)
43
Private highly selective 0.846 (0.25)
Community college -1.222 (0.12)
For-profit -1.039 (0.27)
Income <20,000/<25,000 N/A N/A N/A N/A 0.000 N/A
N/A N/A N/A N/A (.) N/A Constant -2.486 -0.208 -2.177 -2.467 0.356 -5.806 (0.50) (0.85) (3.09) (1.63) (2.86) (0.80)
Panel B NELS:88
Full
Sample
Public non-top
50 Public top 50
Private less
selective
Private highly
selective Community
College First Year College GPA 1.346 1.742 1.901 1.361 1.662 1.039
(0.08) (0.14) (0.27) (0.18) (0.40) (0.10) Ln(student/faculty) -0.571 -1.611 -1.977 -0.791 -0.129 -0.344
(0.15) (0.43) (0.95) (0.26) (0.57) (0.20) Missing(student/faculty) -3.941 -21.835 0.000 -5.859 0.000 -0.946
(1.05) (9.44) (.) (2.20) (.) (1.19) Math percentile 0.013 0.005 0.018 0.010 0.005 0.020
(0.00) (0.00) (0.01) (0.01) (0.02) (0.00) Missing(student/faculty)x(math percentile) 0.010 0.188 0.000 0.047 0.000 -0.040
(0.01) (0.12) (.) (0.03) (.) (0.02) Income 20,000/25,000 0.043 0.451 -0.616 -0.448 -0.994 -0.084
44
(0.26) (0.42) (1.15) (0.62) (0.91) (0.47) Income 25,000/35,000 0.262 0.263 -0.644 -0.393 -1.049 0.648
(0.33) (0.44) (0.97) (0.70) (1.24) (0.61) Income 35,000/50,000 0.271 0.501 -1.691 -0.043 -0.565 0.559
(0.25) (0.42) (0.99) (0.57) (0.74) (0.44) Income 50,000/75,000 0.290 0.584 -0.551 0.032 -1.641 0.430
(0.25) (0.41) (1.03) (0.55) (0.65) (0.45) Income 50,000+/75,000+ 0.792 1.014 -0.763 0.402 N/A 1.030
(0.24) (0.41) (0.94) (0.56) N/A (0.43) Father HS diploma 0.117 -0.028 0.435 0.313 -0.784 0.225
(0.24) (0.37) (0.74) (0.53) (1.15) (0.43) Father some college 0.321 0.198 0.177 0.780 -1.329 0.373
(0.22) (0.38) (0.71) (0.64) (1.30) (0.38) Father BA 0.449 0.607 0.483 0.430 -1.400 0.435
(0.24) (0.40) (0.79) (0.65) (1.15) (0.49) Father graduate school 0.731 0.519 1.734 0.730 -1.547 1.010
(0.25) (0.40) (0.84) (0.71) (1.21) (0.43) Mother HS diploma 0.014 0.143 -1.560 0.507 -0.157 -0.015
(0.26) (0.37) (1.54) (0.62) (1.80) (0.44) Mother some college 0.193 0.338 -1.335 0.231 1.866 0.183
(0.22) (0.34) (1.63) (0.65) (1.61) (0.44) Mother BA 0.217 0.256 -1.130 0.449 1.763 0.163
(0.25) (0.40) (1.67) (0.60) (1.62) (0.52) Mother graduate school 0.153 0.137 -1.132 0.390 2.113 0.097
(0.28) (0.47) (1.63) (0.64) (1.67) (0.47) Asian 0.461 0.005 0.379 -0.403 3.206 0.992
(0.31) (0.37) (0.50) (0.50) (1.19) (0.38) Hispanic -0.199 0.231 -0.370 -0.336 0.572 -0.407
45
(0.17) (0.33) (0.51) (0.54) (0.95) (0.25) Black 0.018 -0.358 0.191 0.375 -0.758 0.224
(0.22) (0.29) (0.46) (0.35) (1.00) (0.46) Male -0.289 -0.514 -0.648 0.048 0.081 -0.191
(0.10) (0.16) (0.30) (0.22) (0.53) (0.16) Public top 50 0.758
(0.15) Private less selective 0.322
(0.15) Private highly selective 0.876
(0.30) Community college -1.208
(0.17) For-profit -1.027
(0.57) Income <20,000/<25,000 N/A N/A N/A N/A 1.248 N/A
N/A N/A N/A N/A (1.42) N/A Constant -2.593 0.362 3.613 -1.673 -1.887 -4.552 (0.60) (1.53) (3.50) (1.17) (2.37) (0.95)
Notes: This reports the coefficients on various predictors of college graduation for the entire sample and separately by school type. Panel A shows ELS:2002 and Panel B shows NELS:88
46
Table A3: CDF of GPA
GPA Thresholds Sample 0.5 1.0 1.5 2.0 2.5 3.0 3.5 4.0
NELS:88 0.07 0.14 0.25 0.47 0.70 0.89 0.99 1.00 ELS:2002 0.06 0.12 0.20 0.36 0.56 0.81 0.96 1.00
Notes: This shows the fraction of students with a GPA below each of the following thresholds separately by NELS:88 and ELS:2002.


![DIUIN PAPE EIE - IZA Institute of Labor Economicsftp.iza.org/dp12418.pdf3 [Figure 1 is about here] I begin the discussion by 3providing evidence on the variability of σ in Figure](https://img.pdfslide.net/doc/110x75/5e727b879b7e1b1d48318dd0/diuin-pape-eie-iza-institute-of-labor-3-figure-1-is-about-here-i-begin-the-discussion.jpg)