Embed Size (px)
Citation preview
A NATION OF IMMIGRANTS? DIVERGING PERCEPTIONS OF IMMIGRANTS INCREASINGLY MARKING PARTISAN DIVIDES
Findings from the 2019 American Values Survey

A NATION OF IMMIGRANTS? DIVERGING PERCEPTIONS OF IMMIGRANTS INCREASINGLY MARKING PARTISAN DIVIDES
Findings from the 2019 American Values Survey
AcknowledgementsThe survey was made possible by The Carnegie Corporation of New York, the Unitarian Universalist Veatch Program at Shelter Rock, and The New World Foundation. The report was written by:
• Robert P. Jones, PhD, CEO
• Natalie Jackson, PhD, Director of Research
• Diana Orces, PhD, Research Associate
• Oyindamola Bola, Research Assistant
Additionally, the authors would like to thank:
The communications and external affairs team: • J. Jioni Palmer, Senior Director of Communications and External Affairs
• Jordun Lawrence, Senior External Affairs Associate
• Brianna Tucker, Editorial Associate
• David Tigabu, Digital Media Associate
• Douglas Barclay, Editorial Content Associate
• Molly Igoe, Communications and External Affairs Assistant
The operations team:• Sean Sands, Chief of Staff
• Anna Gergen, Operations Assistant
• Tim Duffy, Graphic Designer
Research support from:• Ian Huff, Research Associate
• Daniel Greenberg, Research Assistant
We would also like to thank Kivvit for providing communications outreach.
PRRI 1023 15th Street NW, 9th Floor Washington D.C. 20005 www.prri.org For more information, contact [email protected]
Contents7 The Current Context:
Reshaping Immigration Policy in the Trump Era
10 Immigration as a Critical Issue
12 Anxieties About Cultural Change
16 Attitudes Toward Immigrants
21 U.S. Immigration Policy
30 Overall Support for Restrictive Immigration Policies
36 Appendix I. Regression Output
38 Appendix II. Survey Methodology
40 Appendix III. About PRRI

FINDINGS FROM THE 2019 AMERICAN VALUES SURVEY 7
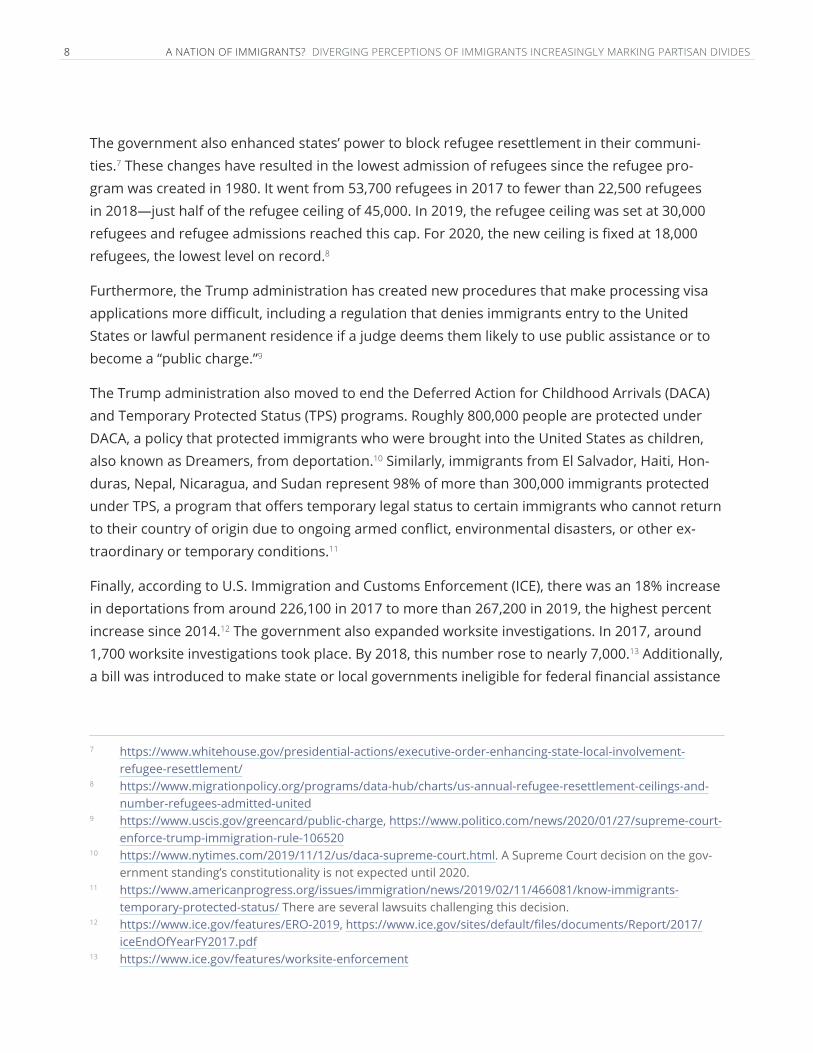
The Current Context: Reshaping Immigration Policy in the Trump EraThe American immigration landscape changed significantly since the election of President Donald Trump, with 2018 showing the smallest number of foreign-born people entering the country in a decade. In 2018, the foreign-born population in the United States stood at 44.7 million, with about half consisting of naturalized citizens (22.6 million),1 a quarter of legal residents (11.5 million),2 and the remaining quarter of undocumented immigrants (10.6 million).3 The largest declines in the influx of immigrants were among non-U.S. citizens from Latin America, predom-inantly from Mexico. Since 2010, the number of immigrants from Mexico declined, while the number of immigrants coming from Asia—primarily from China and India—increased. Even though overall immigration has slowed down, it paradoxically increased in Trump-voting states and decreased most in states that already had large foreign-born populations.4
The sharp decline in immigrant flows is unusual during times of economic expansion and is likely an outcome of the Trump administration’s anti-immigration policies and stances. In addition to his promise of building a wall and actions to keep migrants—even those seeking asylum as political refugees—from entering the country at the U.S. southern border, Trump has focused ad-ditional efforts to reshape U.S. immigration policy on people from specific countries, especially by establishing a travel ban for individuals from several Muslim-majority countries (which expanded to six more countries in January 2020).5 Perhaps the most extreme measure of all these policies was the administration’s policy of separating children from their parents at the U.S.-Mexico bor-der from April 2018 until June 2018. New estimates indicate that nearly 5,500 immigrant children were separated from their parents.6
1 https://www.brookings.edu/blog/the-avenue/2019/10/01/us-foreign-born-gains-are-smallest-in-a-decade-except-in-trump-states/
2 https://www.migrationpolicy.org/article/frequently-requested-statistics-immigrants-and-immigration-united-states#Permanent%20Immigration
3 https://journals.sagepub.com/doi/10.1177/2331502420906125 4 https://www.brookings.edu/blog/the-avenue/2019/10/01/us-foreign-born-gains-are-smallest-in-a-decade-
except-in-trump-states/5 The travel bans indefinitely halted the granting of visas to applicants from Iran, Libya, Syria, Yemen, Somalia,
North Korea, Venezuela, and most recently, Nigeria, Eritrea, Sudan, Tanzania, Kyrgyzstan, and Myanmar. https://www.nytimes.com/2018/07/01/world/americas/travel-ban-trump-how-it-works.html, https://www.nytimes.com/interactive/2018/06/27/us/politics/trump-travel-ban-effects.html, https://www.nytimes.com/2020/02/02/world/africa/trump-travel-ban.html
6 https://time.com/5678313/trump-administration-family-separation-lawsuits/
8 A NATION OF IMMIGRANTS? DIVERGING PERCEPTIONS OF IMMIGRANTS INCREASINGLY MARKING PARTISAN DIVIDES
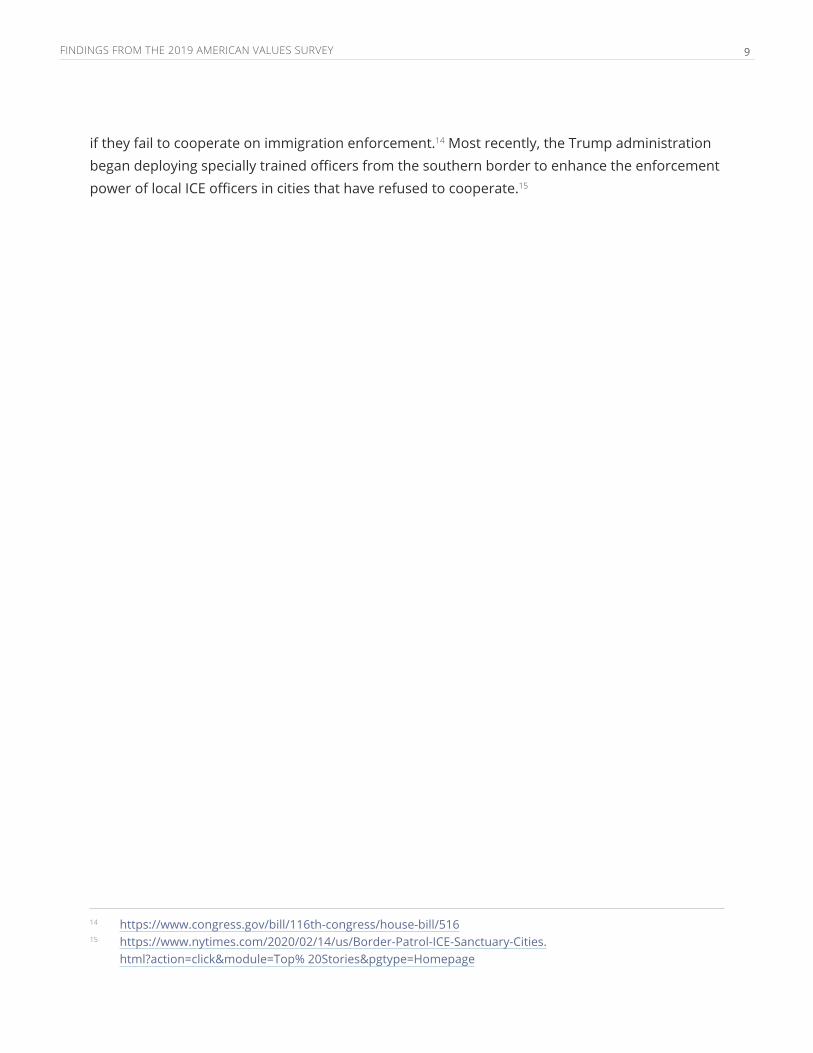
The government also enhanced states’ power to block refugee resettlement in their communi-ties.7 These changes have resulted in the lowest admission of refugees since the refugee pro-gram was created in 1980. It went from 53,700 refugees in 2017 to fewer than 22,500 refugees in 2018—just half of the refugee ceiling of 45,000. In 2019, the refugee ceiling was set at 30,000 refugees and refugee admissions reached this cap. For 2020, the new ceiling is fixed at 18,000 refugees, the lowest level on record.8
Furthermore, the Trump administration has created new procedures that make processing visa applications more difficult, including a regulation that denies immigrants entry to the United States or lawful permanent residence if a judge deems them likely to use public assistance or to become a “public charge.”9
The Trump administration also moved to end the Deferred Action for Childhood Arrivals (DACA) and Temporary Protected Status (TPS) programs. Roughly 800,000 people are protected under DACA, a policy that protected immigrants who were brought into the United States as children, also known as Dreamers, from deportation.10 Similarly, immigrants from El Salvador, Haiti, Hon-duras, Nepal, Nicaragua, and Sudan represent 98% of more than 300,000 immigrants protected under TPS, a program that offers temporary legal status to certain immigrants who cannot return to their country of origin due to ongoing armed conflict, environmental disasters, or other ex-traordinary or temporary conditions.11
Finally, according to U.S. Immigration and Customs Enforcement (ICE), there was an 18% increase in deportations from around 226,100 in 2017 to more than 267,200 in 2019, the highest percent increase since 2014.12 The government also expanded worksite investigations. In 2017, around 1,700 worksite investigations took place. By 2018, this number rose to nearly 7,000.13 Additionally, a bill was introduced to make state or local governments ineligible for federal financial assistance
7 https://www.whitehouse.gov/presidential-actions/executive-order-enhancing-state-local-involvement-refugee-resettlement/
8 https://www.migrationpolicy.org/programs/data-hub/charts/us-annual-refugee-resettlement-ceilings-and-number-refugees-admitted-united
9 https://www.uscis.gov/greencard/public-charge, https://www.politico.com/news/2020/01/27/supreme-court-enforce-trump-immigration-rule-106520
10 https://www.nytimes.com/2019/11/12/us/daca-supreme-court.html. A Supreme Court decision on the gov-ernment standing’s constitutionality is not expected until 2020.
11 https://www.americanprogress.org/issues/immigration/news/2019/02/11/466081/know-immigrants-temporary-protected-status/ There are several lawsuits challenging this decision.
12 https://www.ice.gov/features/ERO-2019, https://www.ice.gov/sites/default/files/documents/Report/2017/iceEndOfYearFY2017.pdf
13 https://www.ice.gov/features/worksite-enforcement
FINDINGS FROM THE 2019 AMERICAN VALUES SURVEY 9
if they fail to cooperate on immigration enforcement.14 Most recently, the Trump administration began deploying specially trained officers from the southern border to enhance the enforcement power of local ICE officers in cities that have refused to cooperate.15
14 https://www.congress.gov/bill/116th-congress/house-bill/51615 https://www.nytimes.com/2020/02/14/us/Border-Patrol-ICE-Sanctuary-Cities.
html?action=click&module=Top% 20Stories&pgtype=Homepage
10 A NATION OF IMMIGRANTS? DIVERGING PERCEPTIONS OF IMMIGRANTS INCREASINGLY MARKING PARTISAN DIVIDES
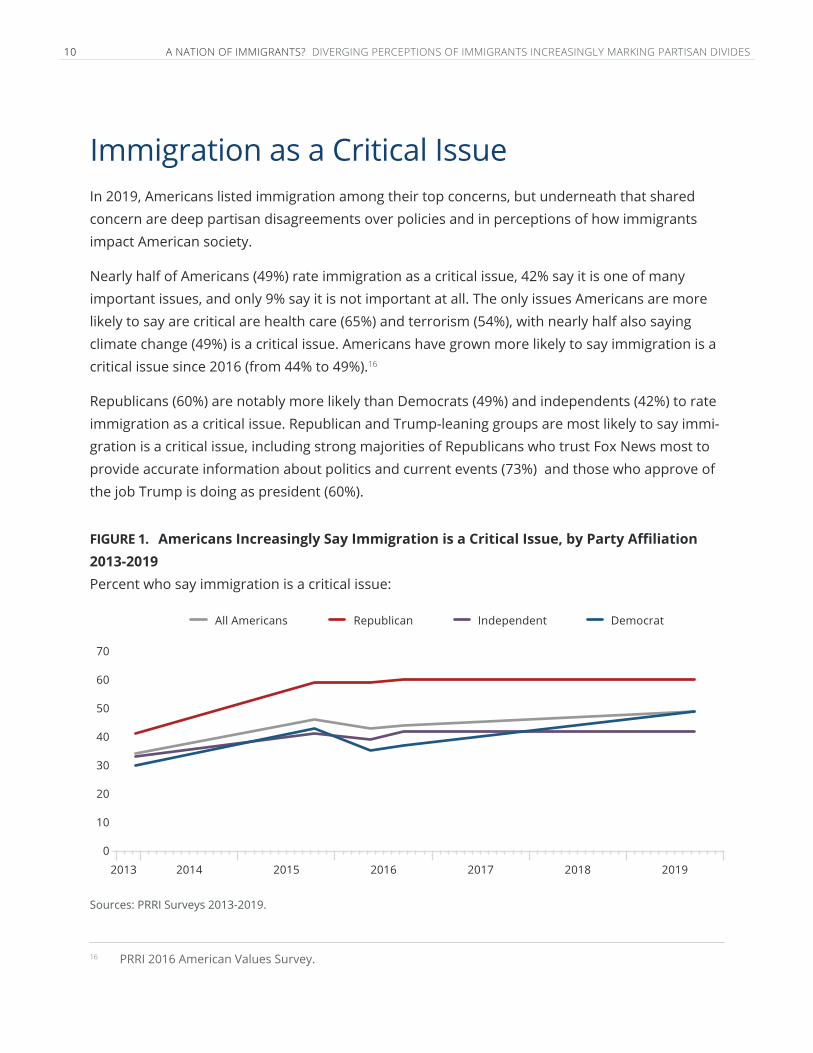
Immigration as a Critical IssueIn 2019, Americans listed immigration among their top concerns, but underneath that shared concern are deep partisan disagreements over policies and in perceptions of how immigrants impact American society.
Nearly half of Americans (49%) rate immigration as a critical issue, 42% say it is one of many important issues, and only 9% say it is not important at all. The only issues Americans are more likely to say are critical are health care (65%) and terrorism (54%), with nearly half also saying climate change (49%) is a critical issue. Americans have grown more likely to say immigration is a critical issue since 2016 (from 44% to 49%).16
Republicans (60%) are notably more likely than Democrats (49%) and independents (42%) to rate immigration as a critical issue. Republican and Trump-leaning groups are most likely to say immi-gration is a critical issue, including strong majorities of Republicans who trust Fox News most to provide accurate information about politics and current events (73%) and those who approve of the job Trump is doing as president (60%).
16 PRRI 2016 American Values Survey.
FIGURE 1. Americans Increasingly Say Immigration is a Critical Issue, by Party Affiliation 2013-2019Percent who say immigration is a critical issue:
Sources: PRRI Surveys 2013-2019.
0
50
70
30
2013 2014 2015 2016 2017 2018 2019
IndependentRepublicanAll Americans
40
60
20
10
Democrat
FINDINGS FROM THE 2019 AMERICAN VALUES SURVEY 11
There are no strong patterns among Christian groups, but religiously unaffiliated Americans (37%) are notably less likely to say they see immigration as a critical issue.
Majorities of multiracial (58%)17 and Hispanic (54%) Americans as well as nearly half of Americans who identify as another race (49%), white (48%), or black (45%) say immigration is a critical issue. Among whites, those without a college degree (51%) are notably more likely than those with a four-year college degree (42%) to rate immigration as a critical issue.
Concerns about immigration increase with age. Nearly four in ten (38%) young Americans say im-migration is a critical issue, compared to nearly half (46%) of Americans ages 30-49 and majorities of those ages 50-64 (54%) and senior Americans ages 65 and older (58%).
Generally speaking, Americans who hold more negative views of immigrants are more likely to say immigration is a critical issue. For example, 63% of those who say immigrants are a burden to the country because they take our jobs, housing, and health care say immigration is a critical issue, compared to 41% of those who say immigrants strengthen our country because of their hard work and talents.
17 There are 98 multiracial respondents in this survey.
12 A NATION OF IMMIGRANTS? DIVERGING PERCEPTIONS OF IMMIGRANTS INCREASINGLY MARKING PARTISAN DIVIDES
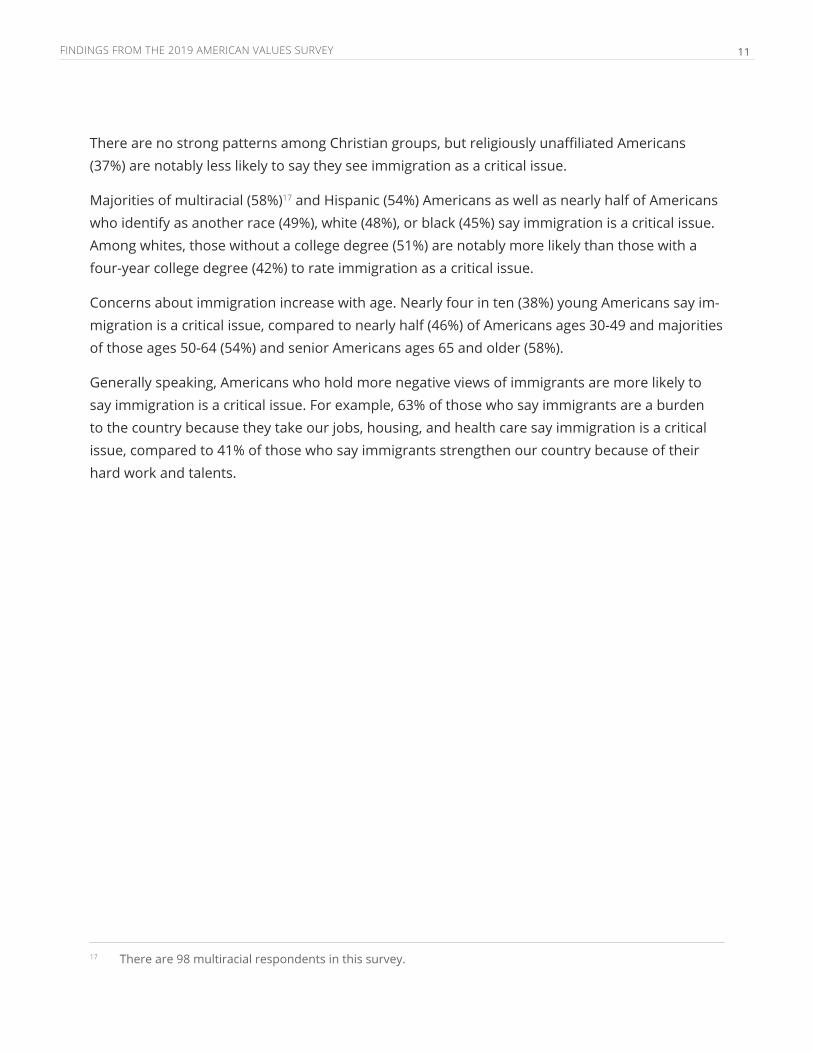
Anxieties About Cultural ChangeConcerns About Newcomers as a Threat to Traditional American Customs and ValuesJust under four in ten (39%) Americans say newcomers threaten traditional American customs and values, compared to approximately six in ten (59%) who say that the growing number of new-comers from other countries strengthens American society. By comparison, in 2016, Americans were more evenly split: 46% said newcomers threaten traditional American customs and values, compared to 44% who said newcomers strengthen American society.
Republicans (71%) are much more likely than independents (35%), and Democrats (20%) to say newcomers threaten American society. Independents and Democrats are less likely to say this now than they were in 2016 (45% and 29%, respectively). Republicans have not significantly shifted from 73% saying newcomers threaten society in 2016. But there is variation among Republicans: eight in ten (82%) Republicans who trust Fox News most among news sources say newcomers are a threat to American traditions, compared to 63% of Republicans who report a different primary news source.
Two-thirds (68%) of Americans who approve of President Trump’s job in office say newcomers threaten traditional American values, compared to only 20% among those who disapprove of the president. Notably, the vast majority (80%) of Trump supporters who say there is nothing Presi-dent Trump could do to lose their support agree that newcomers threaten American traditions.
Among religious groups, white evangelicals stand out in their perceptions of newcomers to the country as a threat: Two-thirds (67%) of white evangelical Protestants say newcomers are a threat to American traditions. About half of white mainline Protestants (51%) and white Catholics (50%) agree. Other religious groups’ adherents are less likely to say immigrants are a threat: Less than one-third of members of non-Christian religions (31%), black Protestants (30%), and Hispanic Protestants (29%), hold this view. Hispanic Catholics (22%) and the religiously unaffiliated (22%) are the least likely to say that newcomers are a threat to American customs and values.
Those who say that America has always been a Christian nation (44%) or that the U.S. was once a Christian nation but is not anymore (45%) are more likely than those who say that America was never a Christian nation (16%) to agree that immigrants threaten American society. Those who view America no longer being a Christian nation as a bad thing are more than twice as likely as those who view this change as a good thing to say that newcomers threaten the U.S. (57% vs. 25%).
Nearly half (46%) of whites say newcomers threaten America, including a majority (54%) of whites without college degrees, compared to only 31% of whites with college degrees. About one-third
FINDINGS FROM THE 2019 AMERICAN VALUES SURVEY 13
(32%) of black Americans say that newcomers threaten the United States, as do about three in ten Americans of other races (31%) and multiracial Americans (30%), and 24% of Hispanic Americans.
Perceptions of immigrants as a threat increase with age with a notable break around age 50. About one in four (24%) young Americans ages 18-29 say that newcomers threaten American so-ciety, which increases to 37% among those ages 30-49. Nearly half of those ages 50-64 (47%) and seniors ages 65 and older (48%) say the same.
About four in ten Midwesterners (43%), Northeasterners (42%), and Southerners (40%), compared to one-third (33%) of Westerners, agree that newcomers negatively impact American society.
A slim majority (51%) of respondents who say that immigration is a critical issue agree that new-comers threaten American society, compared to 20% among Americans who say that immigra-tion is not that important an issue.
All Americans
White evangelical Protestant
White mainline Protestant
White Catholic
Other Christian
Non-Christian religion
Black Protestant
Hispanic Protestant
Hispanic Catholic
Religiously unaffiliated
FIGURE 2. Americans’ Perceptions of Immigrants as Threats or Invaders, by Religious AffiliationPercent who agree:
Source: PRRI 2019 American Values Survey.
0 20 40 7060204070 60 10 30 50103050
Immigrants threaten traditional American customs and values.
Immigrants are invading our country and replacing our cultural and ethnic background.
39 36
67 66
51 42
50 47
44 46
31 27
30 38
29 28
22 20
22 17
14 A NATION OF IMMIGRANTS? DIVERGING PERCEPTIONS OF IMMIGRANTS INCREASINGLY MARKING PARTISAN DIVIDES
Perceptions of Immigrants as “Invaders” More than one-third (36%) of Americans agree with the statement “immigrants are invading our country and replacing our cultural and ethnic background,” compared to six in ten (62%) who disagree.
One in five (20%) Democrats and three in ten (31%) independents believe that immigrants are invading America, compared to more than six in ten (63%) Republicans. This sentiment is even stronger among Republicans who trust Fox News the most among news sources (78%). Nearly as many of Trump supporters who say that there is nothing Trump could do to lose their support (77%) agree, as do 63% of those who approve of Trump’s job in office.
Two-thirds (66%) of white evangelical Protestants say that immigrants are invading the United States, the only religious group with majority agreement on the question. Just under half of white Catholics (47%) and around four in ten white mainline Protestants (42%), and black Protestants (38%) also agree. Fewer Hispanic Protestants (28%), non-Christians religious adherents (27%), Hispanic Catholics (20%) and religiously unaffiliated Americans (17%) share this view.
About four in ten Americans who say the U.S. was once a Christian nation (42%) or has always been a Christian nation (40%) agree that immigrants are invading the U.S. and replacing American culture and ethnic values. Interestingly, respondents who say that the U.S. was once a Christian nation and see this change as a negative (50%) are notably more likely than those who see this change as a positive (29%) to perceive immigrants are invaders.
Notable minorities of respondents of all races agree that immigrants are invading the country and replacing cultural values: About four in ten white Americans (40%) and black Americans (37%) agree, as do just under one-third of multiracial Americans (32%) and Americans of other races (31%). Fewer Hispanic Americans (22%) agree with this sentiment. Educational attainment separates whites, as those without college degrees (48%) are more likely than those with degrees (27%) to agree that immigrants are invading the United States.
This sentiment that immigrants are invaders increases as income decreases: Respondents who earn annual incomes of $100,000 or more (26%) are less likely than those who earn between $50,000 and $100,000 (36%), $30,000 and $50,000 (35%), and less than $30,000 (45%) to agree that immigrants are invading the country.
Agreement with this idea also increases as age increases: Just over one in four (26%) young Amer-icans ages 18-29 and about three in ten (31%) Americans ages 30-49 agree with the statement that immigrants are invading and replacing American culture. But more than four in ten Ameri-cans ages 50-64 (43%) and ages 65 and over (45%) agree with the sentiment.
FINDINGS FROM THE 2019 AMERICAN VALUES SURVEY 15
Americans who live in the West (28%) are less likely than those who live in the South (41%), North-east (37%), or Midwest (35%) to agree that immigrants are invading the country.
Americans who say that immigration is a critical issue are three times more likely than those who say that immigration is not that important an issue to agree that immigrants are invading the country (51% vs. 17%).
16 A NATION OF IMMIGRANTS? DIVERGING PERCEPTIONS OF IMMIGRANTS INCREASINGLY MARKING PARTISAN DIVIDES
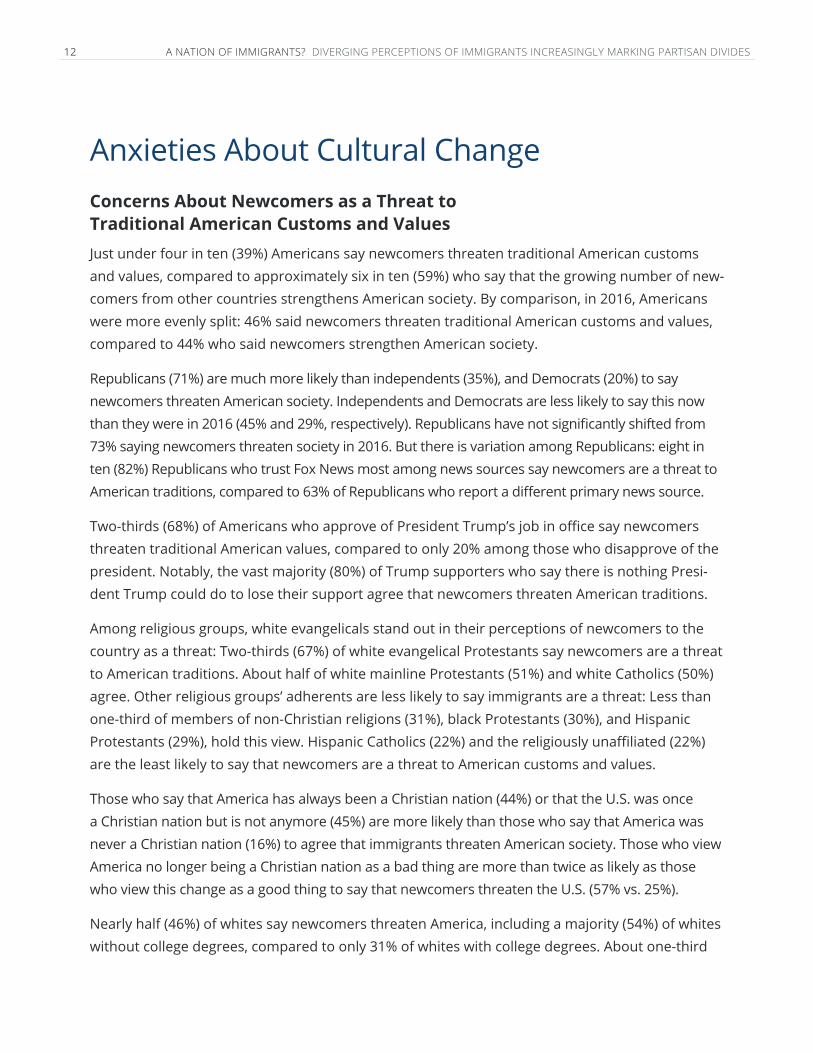
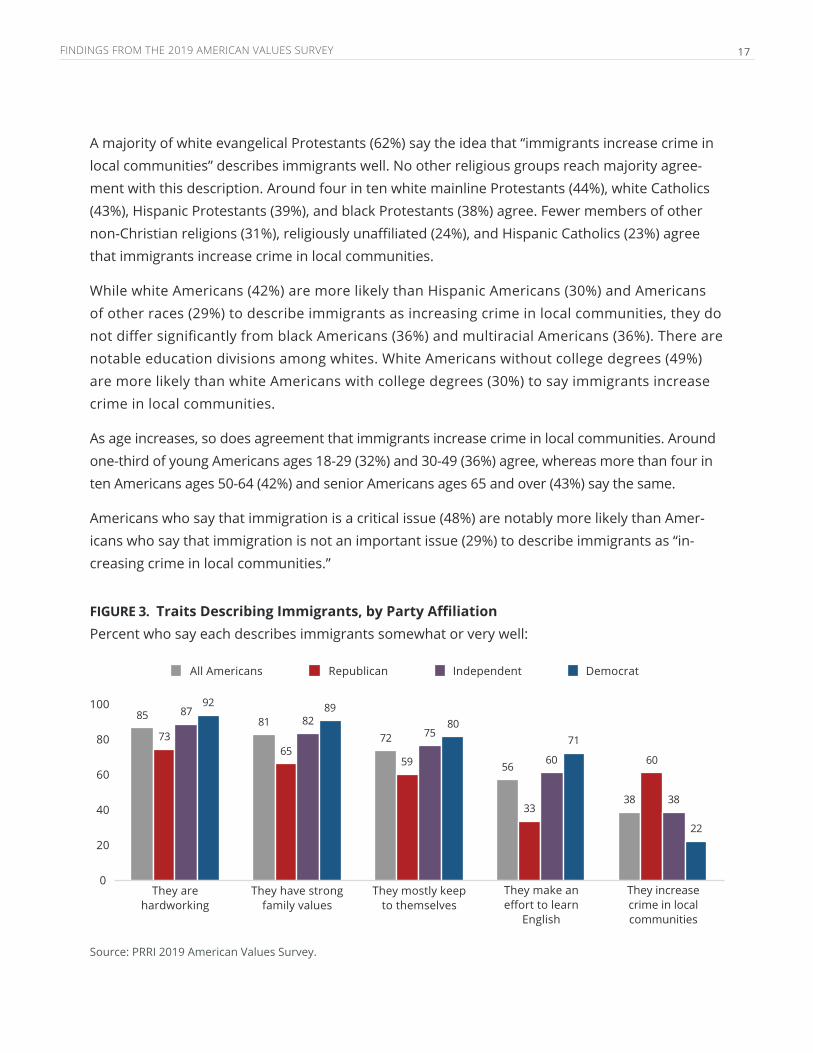
Attitudes Toward ImmigrantsDespite mixed views regarding immigrants’ impact on the country, Americans largely view immi-grants in a positive light. The vast majority of Americans say the phrase “hardworking” describes immigrants who are coming to the United States today either somewhat (45%) or very (40%) well. A similar proportion of Americans say “strong family values” describes immigrants somewhat (50%) or very (31%) well. Most Americans say the idea that immigrants “mostly keep to them-selves” describes them somewhat (55%) or very (17%) well, while fewer Americans think the idea that immigrants “make an effort to learn English” describe them somewhat (39%) or very well (17%). Americans have become less likely to say that immigrants “mostly keep to themselves” (from 79% in 2016 to 72% today) and more likely to say they “make an effort to learn English” (from 51% in 2016 to 56% today).
Since these questions correlate very strongly, a 4-point composite index was developed to measure where each respondent stands from very favorable to very unfavorable in their overall attitudes toward immigrants. On the index, most (89%) Americans perceive immigrants favorably, while roughly one in ten (11%) view immigrants negatively. These favorable views are remarkably consistent across partisanship, ideology, religious affiliation, gender, age, education, race, and even among those who indicated they will support Donald Trump (76%) in the 2020 election.
Do Immigrants Make an Effort to Learn English?It is worth noting, however, that Americans are more conflicted when they think specifically about immigrants’ willingness to learn English. Only one-third (33%) of Republicans think immigrants make an effort to learn English, compared to majorities of Democrats (71%) and independents (60%).
There are also differences by religious affiliation on this question. Majorities of Hispanic Protes-tants (76%), Hispanic Catholics (71%), religiously unaffiliated Americans (71%), black Protestants (63%), and those who identify with non-Christian religions (60%) describe immigrants as making an effort to learn English. Around half (49%) of white mainline Protestants think the same, and about four in ten (42%) white Catholics, and white evangelical Protestants (37%) say immigrants make this effort.
Do Immigrants Increase Crime in Local Communities?Despite their overwhelmingly positive attitudes about immigrants’ work ethic and family values, nearly four in ten Americans (38%) agree that immigrants increase crime in local communities. Republicans (60%) are about three more times more likely than Democrats (22%) to say that this attribute describes immigrants well. Independents (38%) resemble Americans overall.
FINDINGS FROM THE 2019 AMERICAN VALUES SURVEY 17
A majority of white evangelical Protestants (62%) say the idea that “immigrants increase crime in local communities” describes immigrants well. No other religious groups reach majority agree-ment with this description. Around four in ten white mainline Protestants (44%), white Catholics (43%), Hispanic Protestants (39%), and black Protestants (38%) agree. Fewer members of other non-Christian religions (31%), religiously unaffiliated (24%), and Hispanic Catholics (23%) agree that immigrants increase crime in local communities.
While white Americans (42%) are more likely than Hispanic Americans (30%) and Americans of other races (29%) to describe immigrants as increasing crime in local communities, they do not differ significantly from black Americans (36%) and multiracial Americans (36%). There are notable education divisions among whites. White Americans without college degrees (49%) are more likely than white Americans with college degrees (30%) to say immigrants increase crime in local communities.
As age increases, so does agreement that immigrants increase crime in local communities. Around one-third of young Americans ages 18-29 (32%) and 30-49 (36%) agree, whereas more than four in ten Americans ages 50-64 (42%) and senior Americans ages 65 and over (43%) say the same.
Americans who say that immigration is a critical issue (48%) are notably more likely than Amer-icans who say that immigration is not an important issue (29%) to describe immigrants as “in-creasing crime in local communities.”
FIGURE 3. Traits Describing Immigrants, by Party Affiliation Percent who say each describes immigrants somewhat or very well:
Source: PRRI 2019 American Values Survey.
20
100
80
0
40
60
They are hardworking
They have strong family values
They mostly keep to themselves
They make an effort to learn
English
They increase crime in local communities
IndependentRepublicanAll Americans Democrat
85
73
8792
81
65
8289
72
59
7580
56
33
60
71
38
60
38
22
18 A NATION OF IMMIGRANTS? DIVERGING PERCEPTIONS OF IMMIGRANTS INCREASINGLY MARKING PARTISAN DIVIDES
Immigrants as Strength or Burden?A majority (60%) of Americans say immigrants today strengthen our country because of their hard work and talents, while fewer than four in ten (38%) Americans say that immigrants are a burden on the country because they take jobs, housing, and health care.
There are stark differences in opinions about the contributions of immigrants by party affiliation, and this gap has grown over the past decade. In March 2010, a majority (55%) of Democrats and about one-third (35%) of Republicans said that immigrants strengthen our country because of their hard work and talents, but today Democrats (79%) are more than twice as likely as Republicans (31%) to express the same view. Independents mirror closely Americans overall with a majority (62%) saying that immigrants strengthen our country, a significant increase since 2010 (45%).
Substantial majorities of Hispanic Catholics (81%), the religiously unaffiliated (76%), Hispanic Protestants (75%), non-Christian religious adherents (70%), and black Protestants (65%) say that immigrants strengthen America. About half of white mainline Protestants (50%), and white Cath-olics (45%) agree, while white evangelical Protestants are the least likely to say that immigrants strengthen America (34%).
Although a majority (53%) of white Americans say immigrants strengthen America, they are the least likely racial group to say this. Hispanic Americans (78%), multiracial Americans (68%), Americans of other races (67%), and black Americans (65%) are all more likely than whites to say immigrants strengthen the country. Among white Americans, more than four in ten (44%) without a college degree, compared to a substantial majority with a college degree (70%), degree say im-migrants strengthen America.
Young Americans (74%) are more likely to say that immigrants strengthen America than Ameri-cans ages 30-49 (62%), ages 50-64 (53%), and senior Americans ages 65 and over (51%). Higher-in-come Americans are also more likely to say immigrants strengthen the country: Americans with a household income of over $100,000 (70%) are more likely to view immigrants as strengthening America, compared to those who earn between $50,000 and $100,000 (61%), those earning be-tween $30,000 and $50,000 (59%), and those earning less than $30,000 (52%).
Even though majorities of Americans in all regions agree with the idea that immigrants strength-en America because of their hard work and talents, Westerners (67%) are more likely to agree than Southerners (60%), Northeasterners (56%), and Midwesterners (55%).
Americans who say that immigration is a critical issue are evenly divided over whether immi-grants strengthen (50%) or burden America (48%). By contrast, a large majority (76%) of those who do not regard immigration as that important of an issue are more likely to say immigrants strengthen the country.
FINDINGS FROM THE 2019 AMERICAN VALUES SURVEY 19
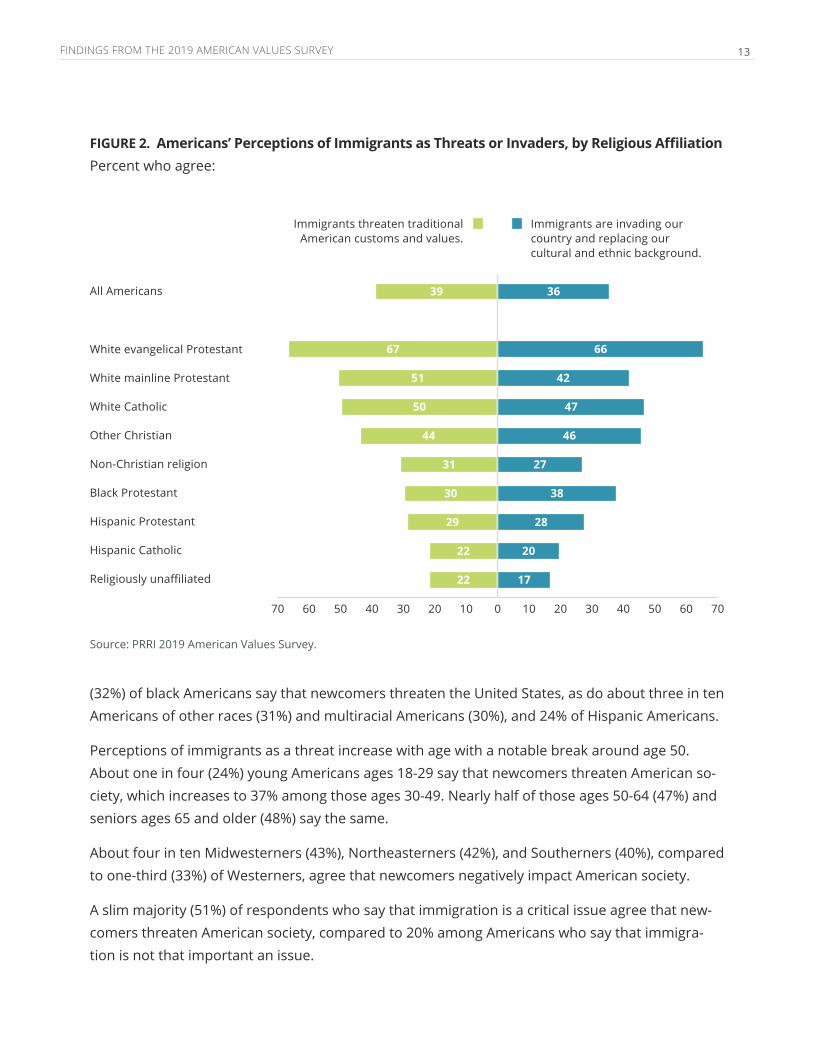
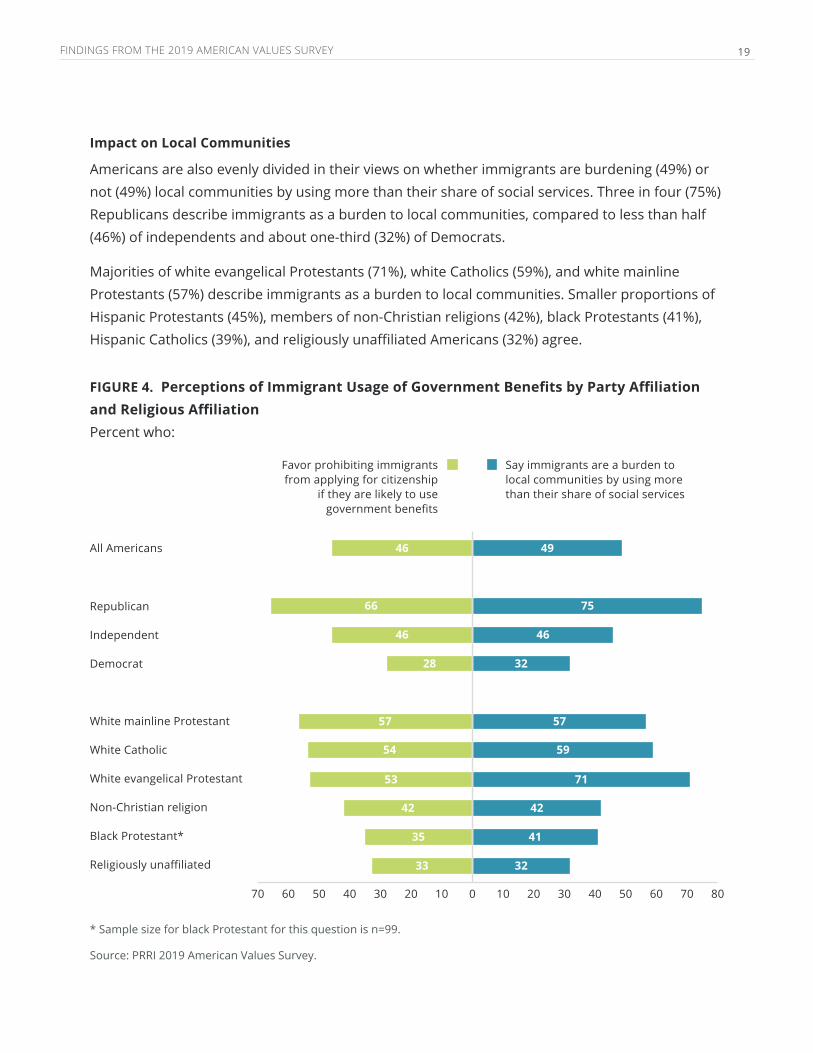
Impact on Local Communities
Americans are also evenly divided in their views on whether immigrants are burdening (49%) or not (49%) local communities by using more than their share of social services. Three in four (75%) Republicans describe immigrants as a burden to local communities, compared to less than half (46%) of independents and about one-third (32%) of Democrats.
Majorities of white evangelical Protestants (71%), white Catholics (59%), and white mainline Protestants (57%) describe immigrants as a burden to local communities. Smaller proportions of Hispanic Protestants (45%), members of non-Christian religions (42%), black Protestants (41%), Hispanic Catholics (39%), and religiously unaffiliated Americans (32%) agree.
All Americans
Republican
Independent
Democrat
White mainline Protestant
White Catholic
White evangelical Protestant
Non-Christian religion
Black Protestant*
Religiously unaffiliated
FIGURE 4. Perceptions of Immigrant Usage of Government Benefits by Party Affiliation and Religious AffiliationPercent who:
* Sample size for black Protestant for this question is n=99.
Source: PRRI 2019 American Values Survey.
0 20 40 807060204070 60 10 30 50103050
Favor prohibiting immigrants from applying for citizenship
if they are likely to use government benefits
Say immigrants are a burden to local communities by using more than their share of social services
46 49
66
57
42
46
53
35
28
54
33
75
57
42
46
71
41
32
59
32
20 A NATION OF IMMIGRANTS? DIVERGING PERCEPTIONS OF IMMIGRANTS INCREASINGLY MARKING PARTISAN DIVIDES
White Americans (53%) are more likely to describe immigrants as a burden to local communi-ties, compared to black (42%) and Hispanic Americans (40%). Multiracial (50%) and other race (46%) Americans fall in between the white and black and Hispanic groups. White Americans without college degrees express more unfavorable opinions than white college-educated Amer-icans (59% vs. 44%).
Men (53%) are more likely than women (46%) to describe immigrants as a burden to local com-munities. Young Americans (36%) are less likely than Americans ages 30-49 (50%), ages 50-64 (54%), and senior Americans ages 65 and over (55%) to describe immigrants as being a burden to local communities.
The So-called “Public Charge” Rule: Linking Citizenship to Use of Government Benefits
Americans are evenly divided on whether potential government benefit use should disqualify undocumented immigrants from applying for citizenship if they are likely to become “public charges.” About half (46%) support, and a slim majority (52%) oppose, prohibiting applications for citizenship from undocumented immigrants if they are considered likely to use government benefits, such as health insurance.
Two-thirds (66%) of Republicans, compared to less than half (46%) of independents and less than three in ten (28%) Democrats, favor a policy that would prohibit applications for citizenship from undocumented immigrants deemed likely to use government benefits (become public charges).
Majorities of white mainline Protestants (57%), white Catholics (54%), and white evangelical Prot-estants (53%) support a policy that would disqualify undocumented immigrants from applying for citizenship if they are deemed likely to use government benefits. Just over four in ten (42%) members of non-Christian religions, and about one-third of black Protestants (35%) and religious-ly unaffiliated Americans (33%) support this policy.
There are sizable differences in the perspectives of white and nonwhite Americans. White (48%) Americans are notably more likely than Hispanic (40%) and black Americans (33%) to favor this policy. White Americans without a college degree express more support for this policy than white college-educated Americans (54% vs 41%).
Fewer than four in ten (37%) young Americans ages 18-29 favor prohibiting undocumented immi-grants from applying for citizenship if they are considered public charges, compared to nearly half of Americans ages 30-49 (47%), ages 50-64 (49%), and senior Americans ages 65 and over (46%).
FINDINGS FROM THE 2019 AMERICAN VALUES SURVEY 21
U.S. Immigration PolicyImmigration Policies of Inclusion
Creating a Path to Citizenship for Those Living in the U.S. Illegally
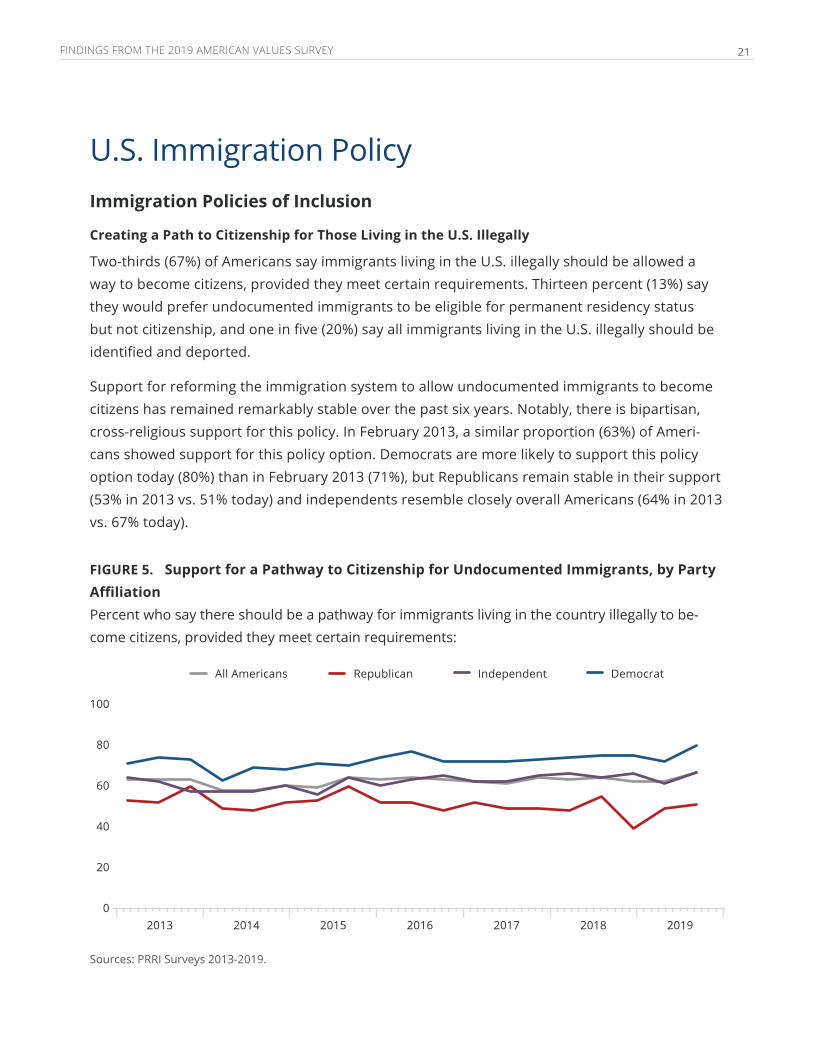
Two-thirds (67%) of Americans say immigrants living in the U.S. illegally should be allowed a way to become citizens, provided they meet certain requirements. Thirteen percent (13%) say they would prefer undocumented immigrants to be eligible for permanent residency status but not citizenship, and one in five (20%) say all immigrants living in the U.S. illegally should be identified and deported.
Support for reforming the immigration system to allow undocumented immigrants to become citizens has remained remarkably stable over the past six years. Notably, there is bipartisan, cross-religious support for this policy. In February 2013, a similar proportion (63%) of Ameri-cans showed support for this policy option. Democrats are more likely to support this policy option today (80%) than in February 2013 (71%), but Republicans remain stable in their support (53% in 2013 vs. 51% today) and independents resemble closely overall Americans (64% in 2013 vs. 67% today).
FIGURE 5. Support for a Pathway to Citizenship for Undocumented Immigrants, by Party AffiliationPercent who say there should be a pathway for immigrants living in the country illegally to be-come citizens, provided they meet certain requirements:
Sources: PRRI Surveys 2013-2019.
0
60
100
20142013 2015 2016 2017 2018 2019
40
80
20
IndependentRepublicanAll Americans Democrat
22 A NATION OF IMMIGRANTS? DIVERGING PERCEPTIONS OF IMMIGRANTS INCREASINGLY MARKING PARTISAN DIVIDES
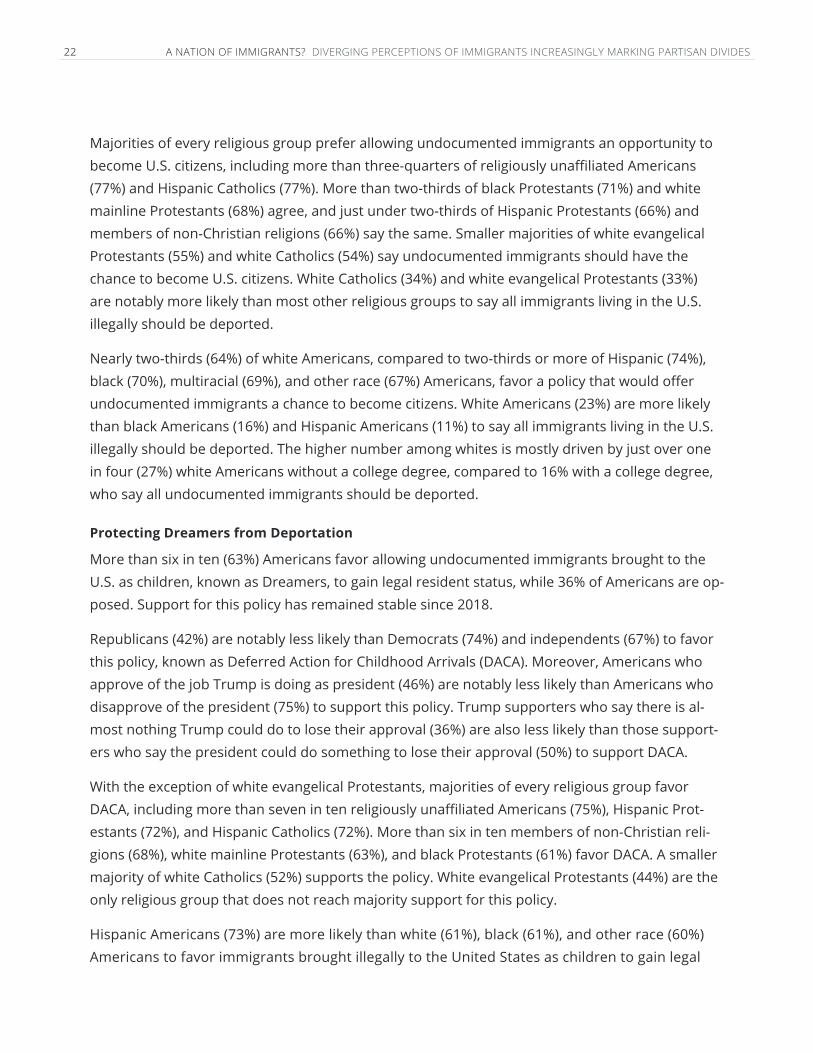
Majorities of every religious group prefer allowing undocumented immigrants an opportunity to become U.S. citizens, including more than three-quarters of religiously unaffiliated Americans (77%) and Hispanic Catholics (77%). More than two-thirds of black Protestants (71%) and white mainline Protestants (68%) agree, and just under two-thirds of Hispanic Protestants (66%) and members of non-Christian religions (66%) say the same. Smaller majorities of white evangelical Protestants (55%) and white Catholics (54%) say undocumented immigrants should have the chance to become U.S. citizens. White Catholics (34%) and white evangelical Protestants (33%) are notably more likely than most other religious groups to say all immigrants living in the U.S. illegally should be deported.
Nearly two-thirds (64%) of white Americans, compared to two-thirds or more of Hispanic (74%), black (70%), multiracial (69%), and other race (67%) Americans, favor a policy that would offer undocumented immigrants a chance to become citizens. White Americans (23%) are more likely than black Americans (16%) and Hispanic Americans (11%) to say all immigrants living in the U.S. illegally should be deported. The higher number among whites is mostly driven by just over one in four (27%) white Americans without a college degree, compared to 16% with a college degree, who say all undocumented immigrants should be deported.
Protecting Dreamers from Deportation
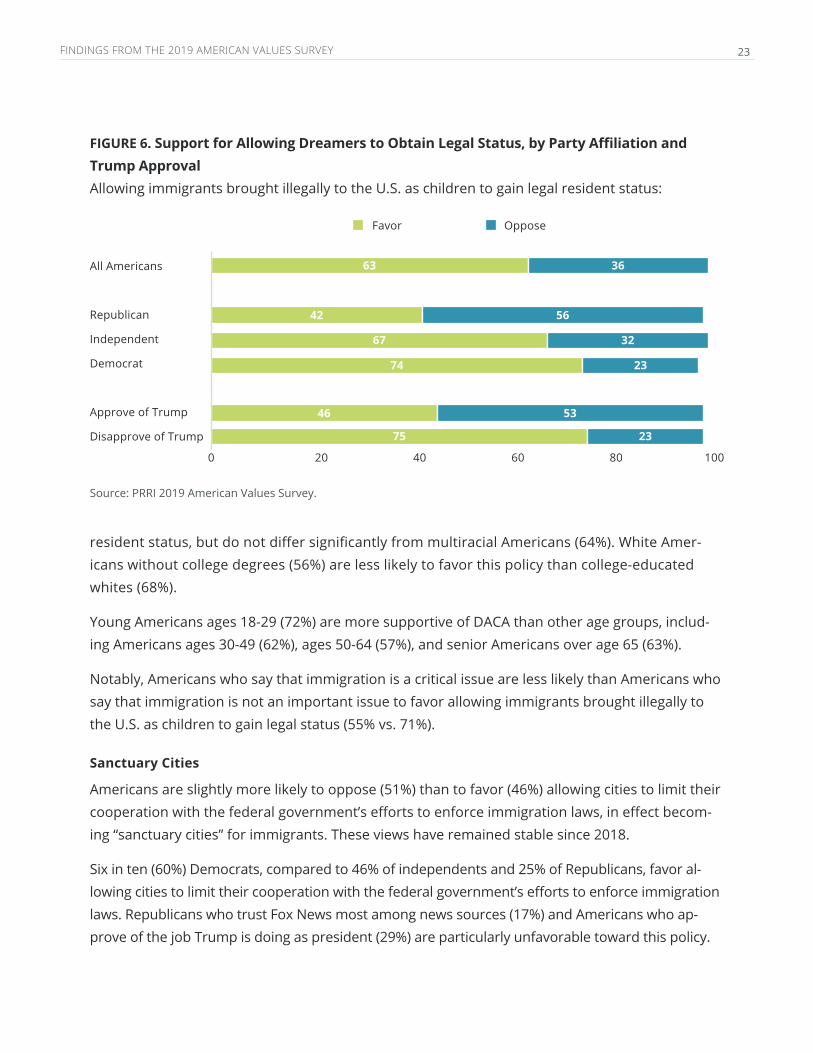
More than six in ten (63%) Americans favor allowing undocumented immigrants brought to the U.S. as children, known as Dreamers, to gain legal resident status, while 36% of Americans are op-posed. Support for this policy has remained stable since 2018.
Republicans (42%) are notably less likely than Democrats (74%) and independents (67%) to favor this policy, known as Deferred Action for Childhood Arrivals (DACA). Moreover, Americans who approve of the job Trump is doing as president (46%) are notably less likely than Americans who disapprove of the president (75%) to support this policy. Trump supporters who say there is al-most nothing Trump could do to lose their approval (36%) are also less likely than those support-ers who say the president could do something to lose their approval (50%) to support DACA.
With the exception of white evangelical Protestants, majorities of every religious group favor DACA, including more than seven in ten religiously unaffiliated Americans (75%), Hispanic Prot-estants (72%), and Hispanic Catholics (72%). More than six in ten members of non-Christian reli-gions (68%), white mainline Protestants (63%), and black Protestants (61%) favor DACA. A smaller majority of white Catholics (52%) supports the policy. White evangelical Protestants (44%) are the only religious group that does not reach majority support for this policy.
Hispanic Americans (73%) are more likely than white (61%), black (61%), and other race (60%) Americans to favor immigrants brought illegally to the United States as children to gain legal
FINDINGS FROM THE 2019 AMERICAN VALUES SURVEY 23
resident status, but do not differ significantly from multiracial Americans (64%). White Amer-icans without college degrees (56%) are less likely to favor this policy than college-educated whites (68%).
Young Americans ages 18-29 (72%) are more supportive of DACA than other age groups, includ-ing Americans ages 30-49 (62%), ages 50-64 (57%), and senior Americans over age 65 (63%).
Notably, Americans who say that immigration is a critical issue are less likely than Americans who say that immigration is not an important issue to favor allowing immigrants brought illegally to the U.S. as children to gain legal status (55% vs. 71%).
Sanctuary Cities
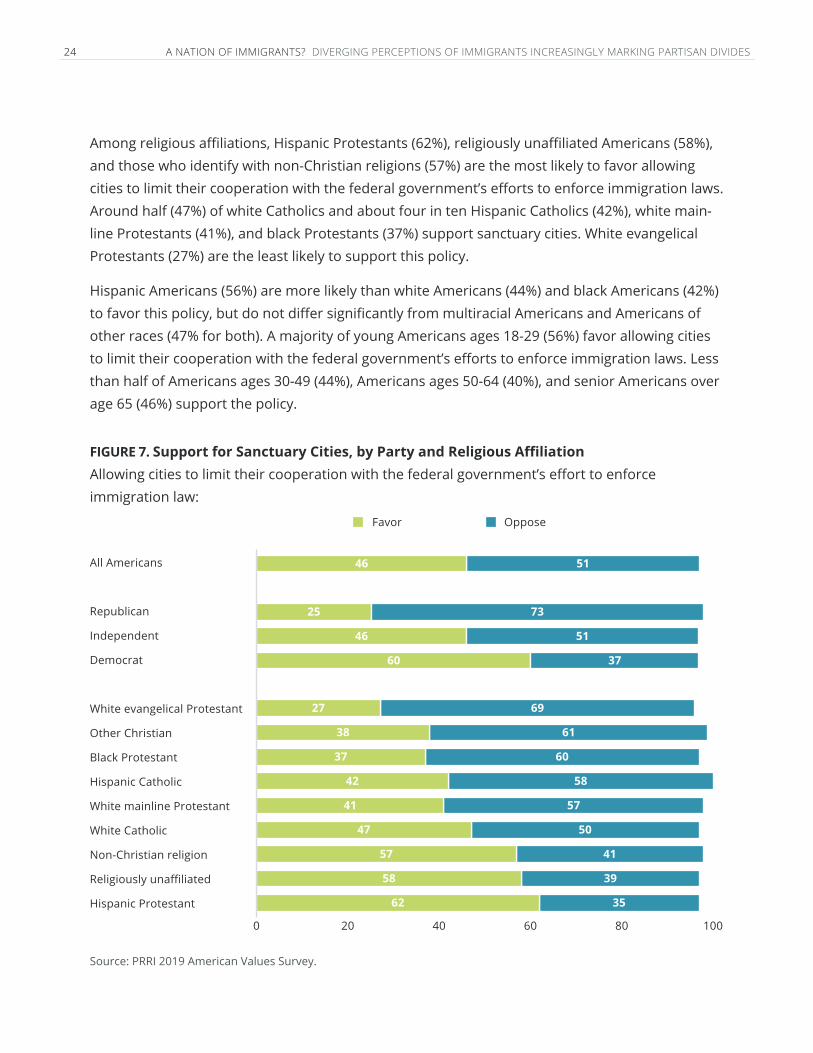
Americans are slightly more likely to oppose (51%) than to favor (46%) allowing cities to limit their cooperation with the federal government’s efforts to enforce immigration laws, in effect becom-ing “sanctuary cities” for immigrants. These views have remained stable since 2018.
Six in ten (60%) Democrats, compared to 46% of independents and 25% of Republicans, favor al-lowing cities to limit their cooperation with the federal government’s efforts to enforce immigration laws. Republicans who trust Fox News most among news sources (17%) and Americans who ap-prove of the job Trump is doing as president (29%) are particularly unfavorable toward this policy.
FIGURE 6. Support for Allowing Dreamers to Obtain Legal Status, by Party Affiliation and Trump ApprovalAllowing immigrants brought illegally to the U.S. as children to gain legal resident status:
Source: PRRI 2019 American Values Survey.
20 40 100800
All Americans
Republican
Independent
Democrat
Approve of Trump
Disapprove of Trump
60
Favor Oppose
36
56
32
23
53
23
63
42
67
74
46
75
24 A NATION OF IMMIGRANTS? DIVERGING PERCEPTIONS OF IMMIGRANTS INCREASINGLY MARKING PARTISAN DIVIDES
Among religious affiliations, Hispanic Protestants (62%), religiously unaffiliated Americans (58%), and those who identify with non-Christian religions (57%) are the most likely to favor allowing cities to limit their cooperation with the federal government’s efforts to enforce immigration laws. Around half (47%) of white Catholics and about four in ten Hispanic Catholics (42%), white main-line Protestants (41%), and black Protestants (37%) support sanctuary cities. White evangelical Protestants (27%) are the least likely to support this policy.
Hispanic Americans (56%) are more likely than white Americans (44%) and black Americans (42%) to favor this policy, but do not differ significantly from multiracial Americans and Americans of other races (47% for both). A majority of young Americans ages 18-29 (56%) favor allowing cities to limit their cooperation with the federal government’s efforts to enforce immigration laws. Less than half of Americans ages 30-49 (44%), Americans ages 50-64 (40%), and senior Americans over age 65 (46%) support the policy.
FIGURE 7. Support for Sanctuary Cities, by Party and Religious AffiliationAllowing cities to limit their cooperation with the federal government’s effort to enforce immigration law:
Source: PRRI 2019 American Values Survey.
20 40 100800
All Americans
Republican
Independent
Democrat
White evangelical Protestant
Other Christian
Black Protestant
Hispanic Catholic
White mainline Protestant
White Catholic
Non-Christian religion
Religiously unaffiliated
Hispanic Protestant
60
Favor Oppose
5146
69
61
60
57
41
35
27
38
58
50
39
37
42
47
58
41
57
62
7325
5146
3760
FINDINGS FROM THE 2019 AMERICAN VALUES SURVEY 25
Immigration Policies of Exclusion
Separating Children from their Families
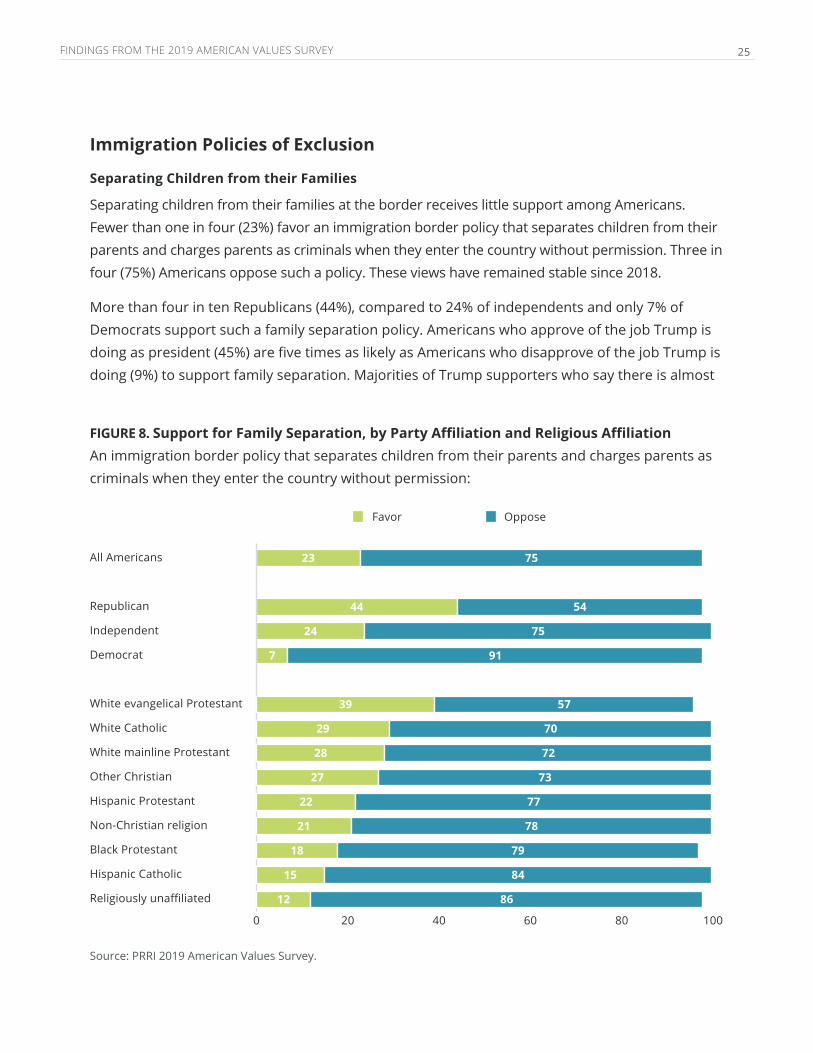
Separating children from their families at the border receives little support among Americans. Fewer than one in four (23%) favor an immigration border policy that separates children from their parents and charges parents as criminals when they enter the country without permission. Three in four (75%) Americans oppose such a policy. These views have remained stable since 2018.
More than four in ten Republicans (44%), compared to 24% of independents and only 7% of Democrats support such a family separation policy. Americans who approve of the job Trump is doing as president (45%) are five times as likely as Americans who disapprove of the job Trump is doing (9%) to support family separation. Majorities of Trump supporters who say there is almost
FIGURE 8. Support for Family Separation, by Party Affiliation and Religious AffiliationAn immigration border policy that separates children from their parents and charges parents as criminals when they enter the country without permission:
Source: PRRI 2019 American Values Survey.
20 40 100800
All Americans
Republican
Independent
Democrat
White evangelical Protestant
White Catholic
White mainline Protestant
Other Christian
Hispanic Protestant
Non-Christian religion
Black Protestant
Hispanic Catholic
Religiously unaffiliated
60
Favor Oppose
23 75
44 54
39 57
22 77
21 78
24 75
28 72
29 70
27 73
7 91
18 79
15 84
12 86
26 A NATION OF IMMIGRANTS? DIVERGING PERCEPTIONS OF IMMIGRANTS INCREASINGLY MARKING PARTISAN DIVIDES
nothing Trump could do to lose their approval (56%) and Republicans who trust Fox News most among news sources to provide accurate information about politics and current events (54%) support family separations at the border.
While one might think that “family values” would prevail among religious groups, who have claimed that mantle, white evangelical Protestants show the highest support among religious groups for a policy that separates children from their families at the border. Nearly four in ten (39%) white evangelical Protestants support this policy, compared to 29% of white Catholics, 28% of white mainline Protestants, 22% of Hispanic Protestants, and 21% of non-Christians. Fewer than one in five black Protestants (18%), Hispanic Catholics (15%), and religiously unaffiliated Americans (12%) favor immigrant family separations at the border.
Multiracial (29%) and white (27%) Americans are notably more likely than black (18%), Hispanic (17%), and other race (15%) Americans to support family separations. White Americans without college degrees (30%) are also more likely than white college-educated Americans (20%) to support this policy. Men (29%) are more supportive than women (18%) of separating families at the border.
Building a Wall on America’s Southern Border
A majority (56%) of Americans oppose building a wall along the U.S. border with Mexico, a significant drop from 63% in 2017; support for this policy has increased from 36% in 2017 to 42% today.
Not surprisingly, more than eight in ten (83%) Republicans support Trump’s border wall idea, while an identical number of Democrats oppose it (83%). Independents roughly mirror Americans in general (60% oppose vs. 39% support). Attitudes among Democrats have remained relative-ly stable since 2017, while Republicans have grown more supportive of this policy (73% in 2017 vs. 83% today). Only small percentages of Americans who approve of the job Trump is doing as president (15%), Trump supporters who say there is almost nothing Trump could do to lose their approval (8%), and Republicans trust Fox News most among news sources to provide accurate information about politics and current events (6%) oppose this policy.
Majorities of all nonwhite and non-Christian religious groups oppose building a wall along the U.S.-Mexico border, including Hispanic Catholics (79%), religiously unaffiliated Americans (76%), black Protestants (71%), Hispanic Protestants (69%), and members of non-Christian religions (67%). Opposition dips below half among white mainline Protestants (46%), white Catholics (42%), and white evangelical Protestants (23%).
White Americans are evenly divided between opposition (49%) and support (50%) for this policy. Majorities of all other races, including about seven in ten Hispanic (73%), black (71%), and other
FINDINGS FROM THE 2019 AMERICAN VALUES SURVEY 27
race (66%) Americans, as well as a majority (54%) of multiracial Americans, oppose building a wall along the U.S.-Mexico border. White Americans’ preferences become clearer when accounting for education: A majority (60%) of white college-educated Americans, compared to about four in ten (42%) white Americans without a college degree, oppose the construction of a wall along Ameri-ca’s southern border.
Opinions also vary by age. More than seven in ten (71%) young adults ages 18-29 and six in ten (60%) Americans ages 30-49 oppose the construction of a wall along the U.S.-Mexico border. About half of senior Americans (48%) and middle-aged Americans (48%) oppose this policy.
Interestingly, Westerners (65%) are more likely than Southerners (55%) and Midwesterners (51%) to oppose building a wall on America’s southern border, but do not differ significantly from Northeasterners (56%).
Preventing Refugees from Entering the U.S.
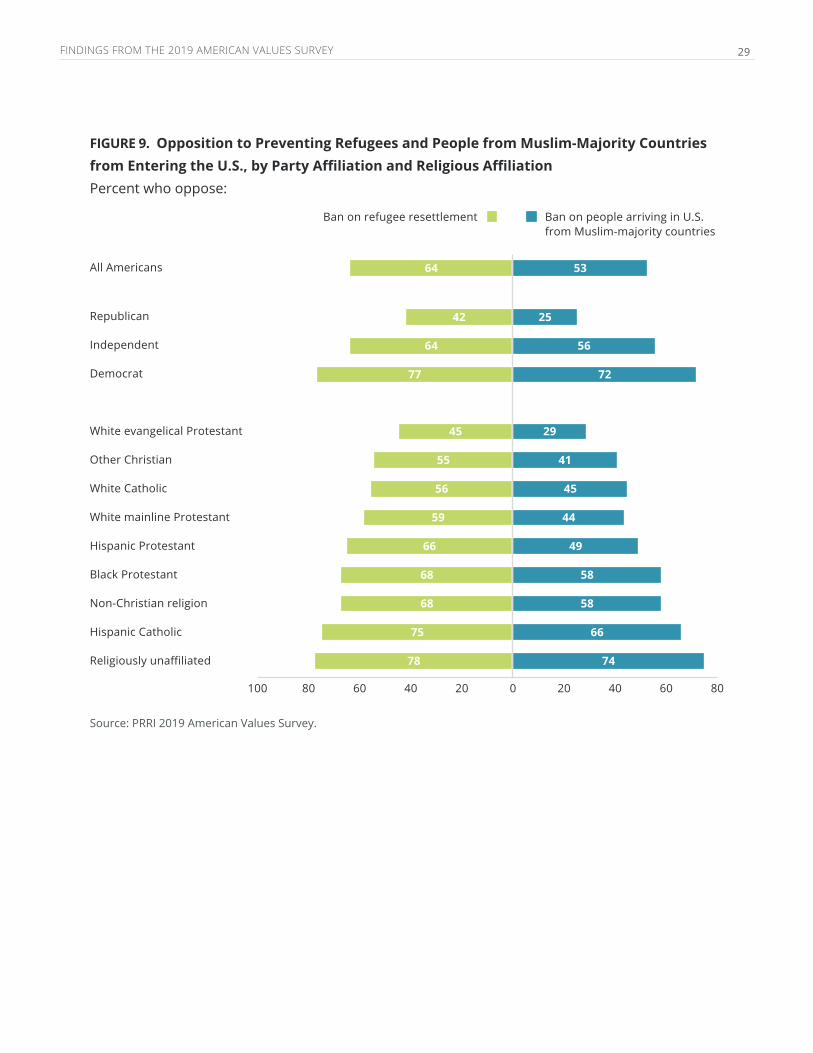
A majority (64%) of Americans oppose passing a law to prevent refugees from entering the Unit-ed States, compared to just over one-third (35%) who support it. More than three in four (77%) Democrats and almost two-thirds (64%) of independents, compared to only 42% of Republicans, oppose the passage of a law that would prevent refugees from entering the United States.
Majorities of almost all religious groups oppose passing legislation that prevents refugees from entering the United States, including large shares of the religiously unaffiliated (78%), Hispanic Catholics (75%), members of non-Christian religions (68%), black Protestants (68%), and Hispan-ic Protestants (66%). Majorities of white mainline Protestants (59%), and white Catholics (56%) also oppose banning refugees. By contrast, less than half of white evangelical Protestants (45%) oppose such a policy.
Majorities of Hispanic (70%), multiracial (69%), other race (65%), black (65%), and white (61%) Americans oppose a ban on refugees entering the U.S. White Americans with college degrees (76%), however, are more likely than white Americans without college degrees (53%) to oppose this policy.
A substantial majority of young Americans ages 18-29 (72%) oppose passing a law to prevent ref-ugees from entering the United States, compared to about six in ten Americans ages 30-49 (64%), middle-aged Americans ages 50-64 (56%), and senior Americans ages 65 and over (63%).
Westerners (71%) are more likely to oppose a ban on refugees entering the U.S., compared to Mid-westerners (61%) and Southerners (60%), but do not differ notably from Northeasterners (65%).
28 A NATION OF IMMIGRANTS? DIVERGING PERCEPTIONS OF IMMIGRANTS INCREASINGLY MARKING PARTISAN DIVIDES
Banning Travel from Muslim-Majority Countries
A slim majority of Americans (53%) oppose temporarily preventing people from some majority Muslim countries from entering the U.S., compared to four in ten (45%) who support this policy. Americans have grown slightly more supportive of this policy since October 2017 (40% vs. 45% in 2019), whereas no significant change emerges in the proportion of those who oppose this policy during the same period (55% in 2017 vs. 53% in 2019).
More than seven in ten (72%) Democrats and a majority (56%) of independents oppose a tem-porary ban on Muslims from coming to the U.S., while one in four (25%) Republicans oppose it. Opposition to the travel ban is also particularly low among Americans who approve of the job Trump is doing as president (25%), Republicans who trust Fox News most among news sources (16%), and among Trump supporters who say there is almost nothing Trump could do to lose their approval (14%).
Majorities or near-majorities of nonwhite Christians and non-Christians oppose temporari-ly preventing people from some majority Muslims countries from entering the U.S., including the religiously unaffiliated (74%), Hispanic Catholics (66%), black Protestants (58%), members of non-Christian religions (58%), and Hispanic Protestants (49%). More than four in ten white Catholics (45%) and white mainline Protestants (44%) also oppose this policy. White evangelical Protestants (29%) are by far the least likely to oppose this policy.
White Americans are evenly divided on this policy with 49% opposed and 49% in favor, while most multiracial (62%), Hispanic (60%), black (58%), and other race (57%) Americans oppose a ban on Muslims. However, white Americans with a college degree are much more likely to oppose temporarily preventing people from some majority Muslim countries from entering the U.S. than whites without a college education (64% vs. 41%, respectively).
Senior Americans ages 65 and older (49%) and those ages 50-64 (42%) are less likely than those ages 30-49 (56%), and especially those 18-29 (65%), to oppose temporarily preventing Muslims from entering the United States.
Majorities of Westerners (63%), Northeasterners (56%) and Midwesterners (52%) oppose a tem-porary ban on Muslims. By contrast, less than half (46%) of Southerners oppose the policy.
Interestingly, Americans who say that immigration is a critical issue are notably less likely to oppose (43%) a temporary ban on Muslims than those who say that immigration is not an im-portant issue (65%).
FINDINGS FROM THE 2019 AMERICAN VALUES SURVEY 29
FIGURE 9. Opposition to Preventing Refugees and People from Muslim-Majority Countries from Entering the U.S., by Party Affiliation and Religious AffiliationPercent who oppose:
Source: PRRI 2019 American Values Survey.
All Americans
Republican
Independent
Democrat
White evangelical Protestant
Other Christian
White Catholic
White mainline Protestant
Hispanic Protestant
Black Protestant
Non-Christian religion
Hispanic Catholic
Religiously unaffiliated
0 20 40 80602040100 80 60
Ban on refugee resettlement Ban on people arriving in U.S. from Muslim-majority countries
64 53
42 25
64 56
77 72
45 29
55 41
56 45
59 44
66 49
68 58
68 58
75 66
78 74
30 A NATION OF IMMIGRANTS? DIVERGING PERCEPTIONS OF IMMIGRANTS INCREASINGLY MARKING PARTISAN DIVIDES
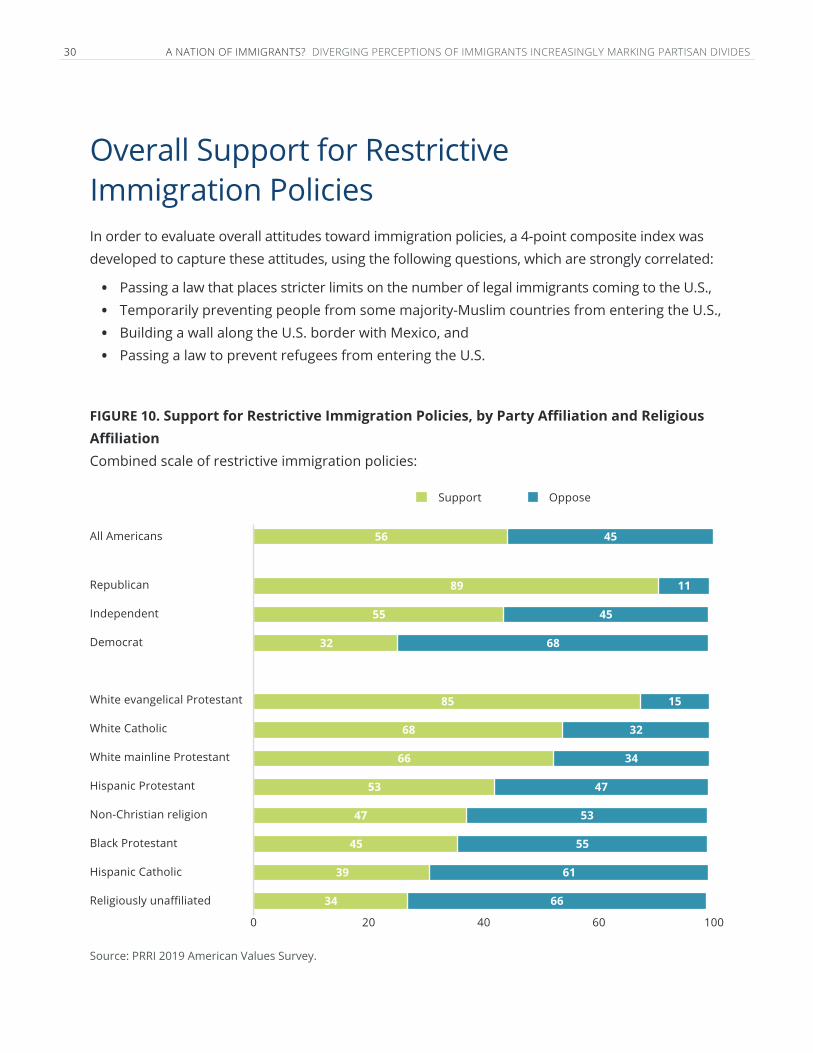
Overall Support for Restrictive Immigration PoliciesIn order to evaluate overall attitudes toward immigration policies, a 4-point composite index was developed to capture these attitudes, using the following questions, which are strongly correlated:
• Passing a law that places stricter limits on the number of legal immigrants coming to the U.S., • Temporarily preventing people from some majority-Muslim countries from entering the U.S., • Building a wall along the U.S. border with Mexico, and• Passing a law to prevent refugees from entering the U.S.
FIGURE 10. Support for Restrictive Immigration Policies, by Party Affiliation and Religious AffiliationCombined scale of restrictive immigration policies:
Source: PRRI 2019 American Values Survey.
All Americans
Republican
Independent
Democrat
White evangelical Protestant
White Catholic
White mainline Protestant
Hispanic Protestant
Non-Christian religion
Black Protestant
Hispanic Catholic
Religiously unaffiliated
20 40 100600
Support Oppose
56 45
89 11
55 45
32 68
85 15
68 32
66 34
53 47
47 53
45 55
39 61
34 66
FINDINGS FROM THE 2019 AMERICAN VALUES SURVEY 31
Each question was combined using an additive scale that was then converted into a 4-point scale where a score of 1 indicates strong support, 2 indicates moderate support, 3 indicates moderate opposition, and 4 indicates strong opposition to restrictive immigration policies. Using this scale, a majority (56%) of Americans moderately support or strongly support these restrictive immigra-tion policies, while nearly half (45%) moderately oppose or strongly oppose them.
Nearly nine in ten Republicans (89%) moderately support or strongly support restrictive immi-gration policies, and only 11% moderately oppose or strongly oppose them. The opposite is true among Democrats: More than three in ten (32%) favor these restrictive immigration policies, while the vast majority (68%) oppose them. Independents closely resemble Americans in general (55% favor vs. 45% oppose).
Among religious groups, white Christian groups stand out in their support for restrictive immigra-tion policies. White evangelical Protestants (85%), white Catholics (68%), and white mainline Prot-estants (66%) are more likely than others to favor placing restrictions on immigration. Support for restrictive policies is much lower among Hispanic Protestants (53%), non-Christians (47%), black Protestants (45%), Hispanic Catholics (39%), and religiously unaffiliated (34%) Americans.
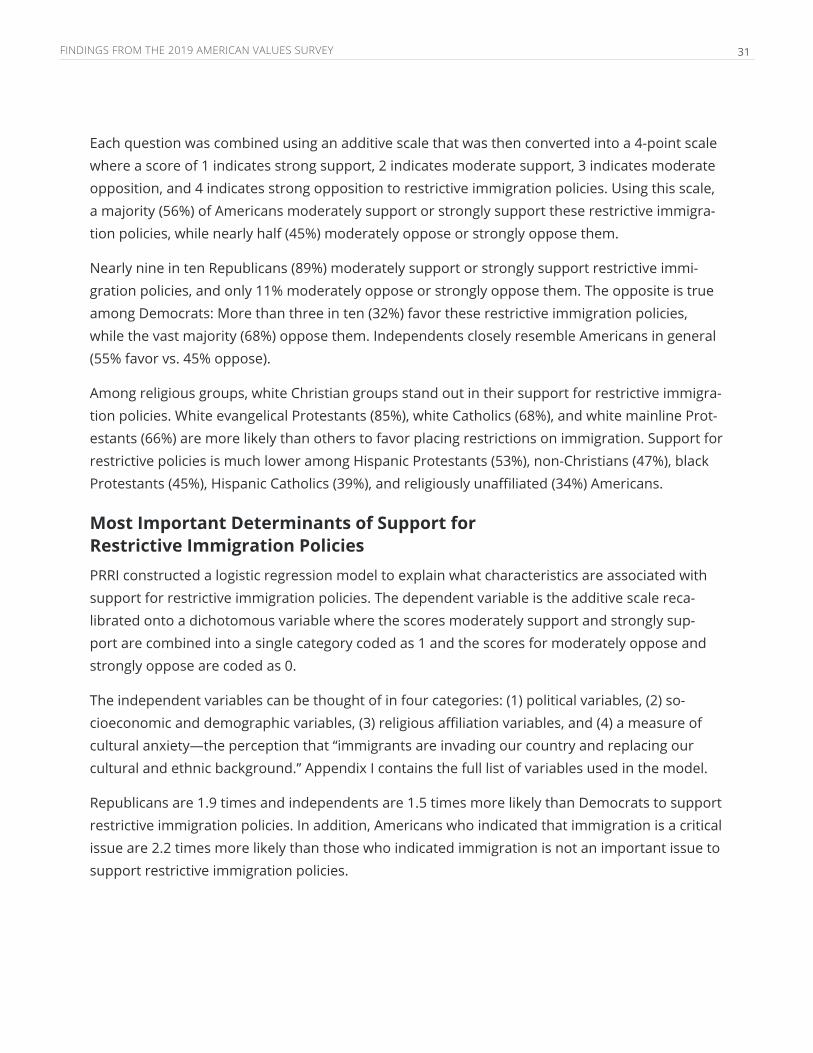
Most Important Determinants of Support for Restrictive Immigration PoliciesPRRI constructed a logistic regression model to explain what characteristics are associated with support for restrictive immigration policies. The dependent variable is the additive scale reca-librated onto a dichotomous variable where the scores moderately support and strongly sup-port are combined into a single category coded as 1 and the scores for moderately oppose and strongly oppose are coded as 0.
The independent variables can be thought of in four categories: (1) political variables, (2) so-cioeconomic and demographic variables, (3) religious affiliation variables, and (4) a measure of cultural anxiety—the perception that “immigrants are invading our country and replacing our cultural and ethnic background.” Appendix I contains the full list of variables used in the model.
Republicans are 1.9 times and independents are 1.5 times more likely than Democrats to support restrictive immigration policies. In addition, Americans who indicated that immigration is a critical issue are 2.2 times more likely than those who indicated immigration is not an important issue to support restrictive immigration policies.
32 A NATION OF IMMIGRANTS? DIVERGING PERCEPTIONS OF IMMIGRANTS INCREASINGLY MARKING PARTISAN DIVIDES
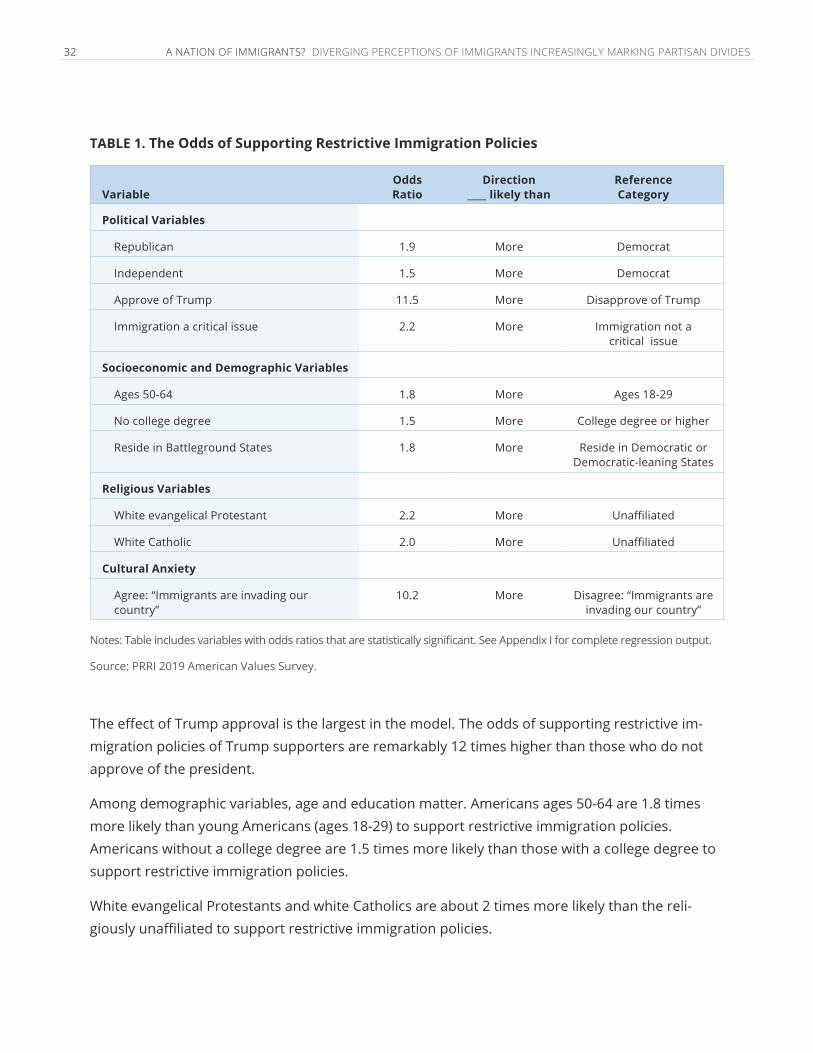
TABLE 1. The Odds of Supporting Restrictive Immigration Policies
VariableOdds Ratio
Direction ____ likely than
Reference Category
Political Variables
Republican 1.9 More Democrat
Independent 1.5 More Democrat
Approve of Trump 11.5 More Disapprove of Trump
Immigration a critical issue 2.2 More Immigration not a critical issue
Socioeconomic and Demographic Variables
Ages 50-64 1.8 More Ages 18-29
No college degree 1.5 More College degree or higher
Reside in Battleground States 1.8 More Reside in Democratic or Democratic-leaning States
Religious Variables
White evangelical Protestant 2.2 More Unaffiliated
White Catholic 2.0 More Unaffiliated
Cultural Anxiety
Agree: “Immigrants are invading our country”
10.2 More Disagree: “Immigrants are invading our country”
Notes: Table includes variables with odds ratios that are statistically significant. See Appendix I for complete regression output.
Source: PRRI 2019 American Values Survey.
The effect of Trump approval is the largest in the model. The odds of supporting restrictive im-migration policies of Trump supporters are remarkably 12 times higher than those who do not approve of the president.
Among demographic variables, age and education matter. Americans ages 50-64 are 1.8 times more likely than young Americans (ages 18-29) to support restrictive immigration policies. Americans without a college degree are 1.5 times more likely than those with a college degree to support restrictive immigration policies.
White evangelical Protestants and white Catholics are about 2 times more likely than the reli-giously unaffiliated to support restrictive immigration policies.
FINDINGS FROM THE 2019 AMERICAN VALUES SURVEY 33
Cultural anxiety also has a substantial effect on the model—the second-largest after Trump approval. Those who agree that “immigrants are invading our country and replacing our cultural and ethnic background” are 10.2 times more likely than those who disagree with the statement to support restrictive immigration policies.
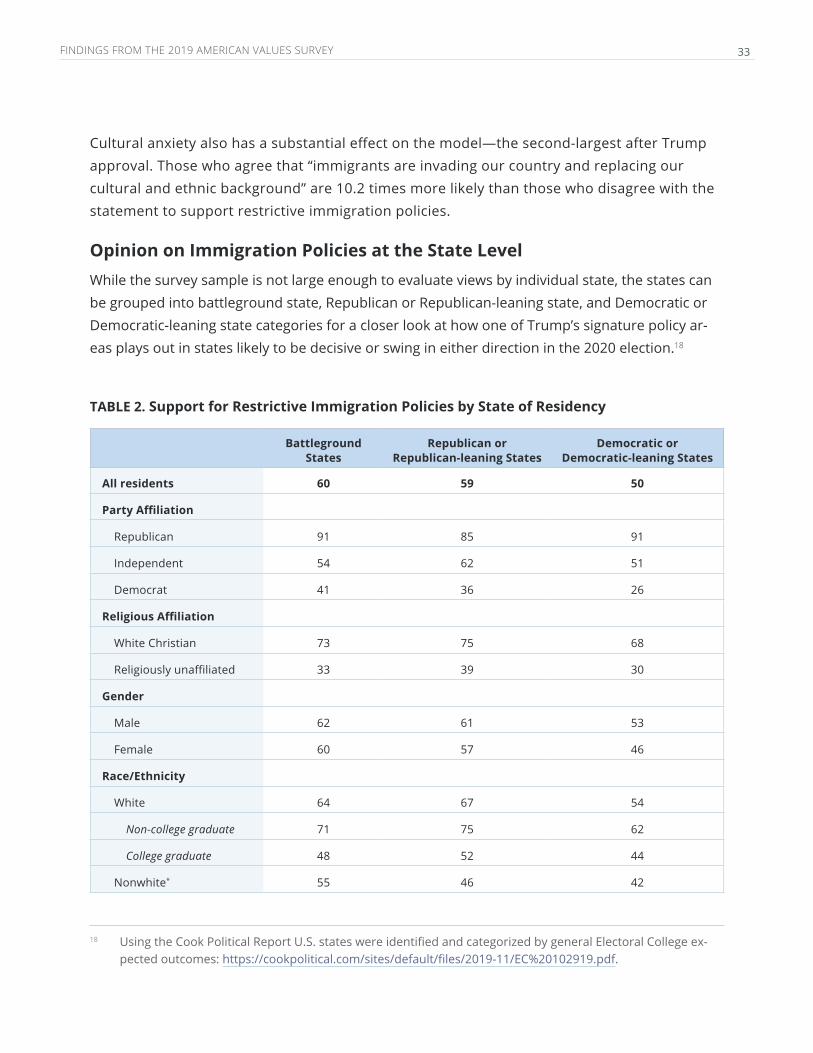
Opinion on Immigration Policies at the State LevelWhile the survey sample is not large enough to evaluate views by individual state, the states can be grouped into battleground state, Republican or Republican-leaning state, and Democratic or Democratic-leaning state categories for a closer look at how one of Trump’s signature policy ar-eas plays out in states likely to be decisive or swing in either direction in the 2020 election.18
TABLE 2. Support for Restrictive Immigration Policies by State of Residency
Battleground States
Republican or Republican-leaning States
Democratic or Democratic-leaning States
All residents 60 59 50
Party Affiliation
Republican 91 85 91
Independent 54 62 51
Democrat 41 36 26
Religious Affiliation
White Christian 73 75 68
Religiously unaffiliated 33 39 30
Gender
Male 62 61 53
Female 60 57 46
Race/Ethnicity
White 64 67 54
Non-college graduate 71 75 62
College graduate 48 52 44
Nonwhite* 55 46 42
18 Using the Cook Political Report U.S. states were identified and categorized by general Electoral College ex-pected outcomes: https://cookpolitical.com/sites/default/files/2019-11/EC%20102919.pdf.
34 A NATION OF IMMIGRANTS? DIVERGING PERCEPTIONS OF IMMIGRANTS INCREASINGLY MARKING PARTISAN DIVIDES
Battleground States
Republican or Republican-leaning States
Democratic or Democratic-leaning States
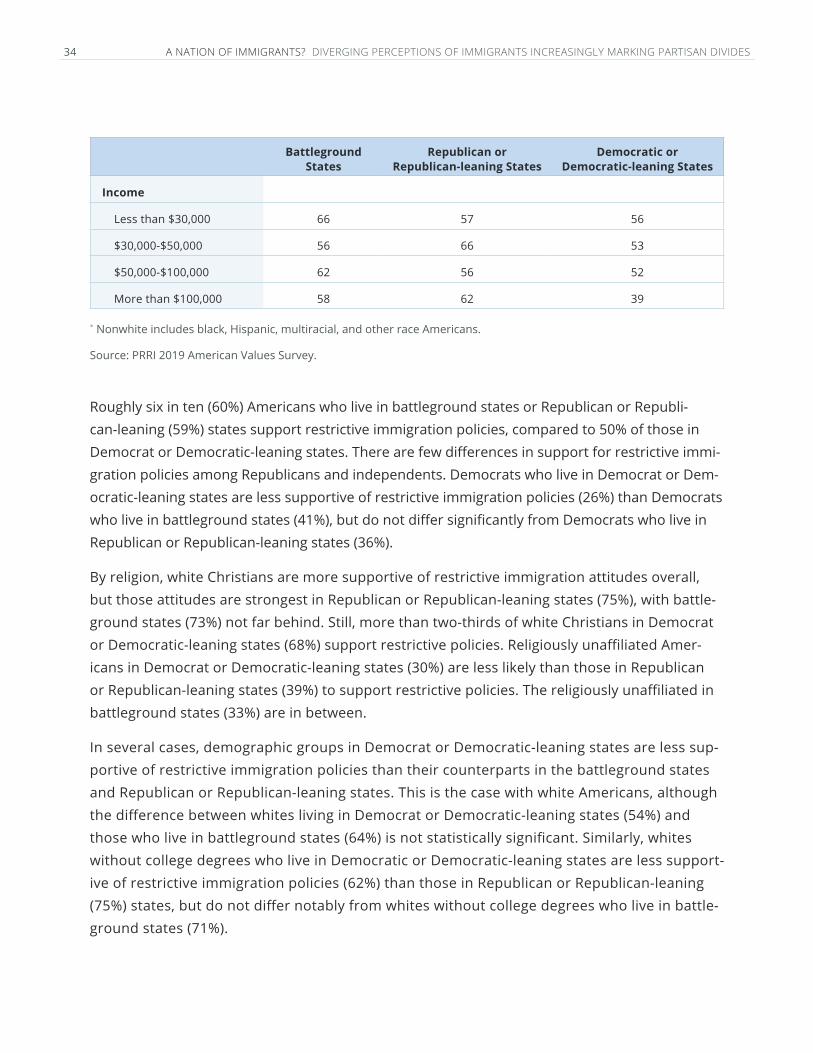
Income
Less than $30,000 66 57 56
$30,000-$50,000 56 66 53
$50,000-$100,000 62 56 52
More than $100,000 58 62 39
* Nonwhite includes black, Hispanic, multiracial, and other race Americans.
Source: PRRI 2019 American Values Survey.
Roughly six in ten (60%) Americans who live in battleground states or Republican or Republi-can-leaning (59%) states support restrictive immigration policies, compared to 50% of those in Democrat or Democratic-leaning states. There are few differences in support for restrictive immi-gration policies among Republicans and independents. Democrats who live in Democrat or Dem-ocratic-leaning states are less supportive of restrictive immigration policies (26%) than Democrats who live in battleground states (41%), but do not differ significantly from Democrats who live in Republican or Republican-leaning states (36%).
By religion, white Christians are more supportive of restrictive immigration attitudes overall, but those attitudes are strongest in Republican or Republican-leaning states (75%), with battle-ground states (73%) not far behind. Still, more than two-thirds of white Christians in Democrat or Democratic-leaning states (68%) support restrictive policies. Religiously unaffiliated Amer-icans in Democrat or Democratic-leaning states (30%) are less likely than those in Republican or Republican-leaning states (39%) to support restrictive policies. The religiously unaffiliated in battleground states (33%) are in between.
In several cases, demographic groups in Democrat or Democratic-leaning states are less sup-portive of restrictive immigration policies than their counterparts in the battleground states and Republican or Republican-leaning states. This is the case with white Americans, although the difference between whites living in Democrat or Democratic-leaning states (54%) and those who live in battleground states (64%) is not statistically significant. Similarly, whites without college degrees who live in Democratic or Democratic-leaning states are less support-ive of restrictive immigration policies (62%) than those in Republican or Republican-leaning (75%) states, but do not differ notably from whites without college degrees who live in battle-ground states (71%).
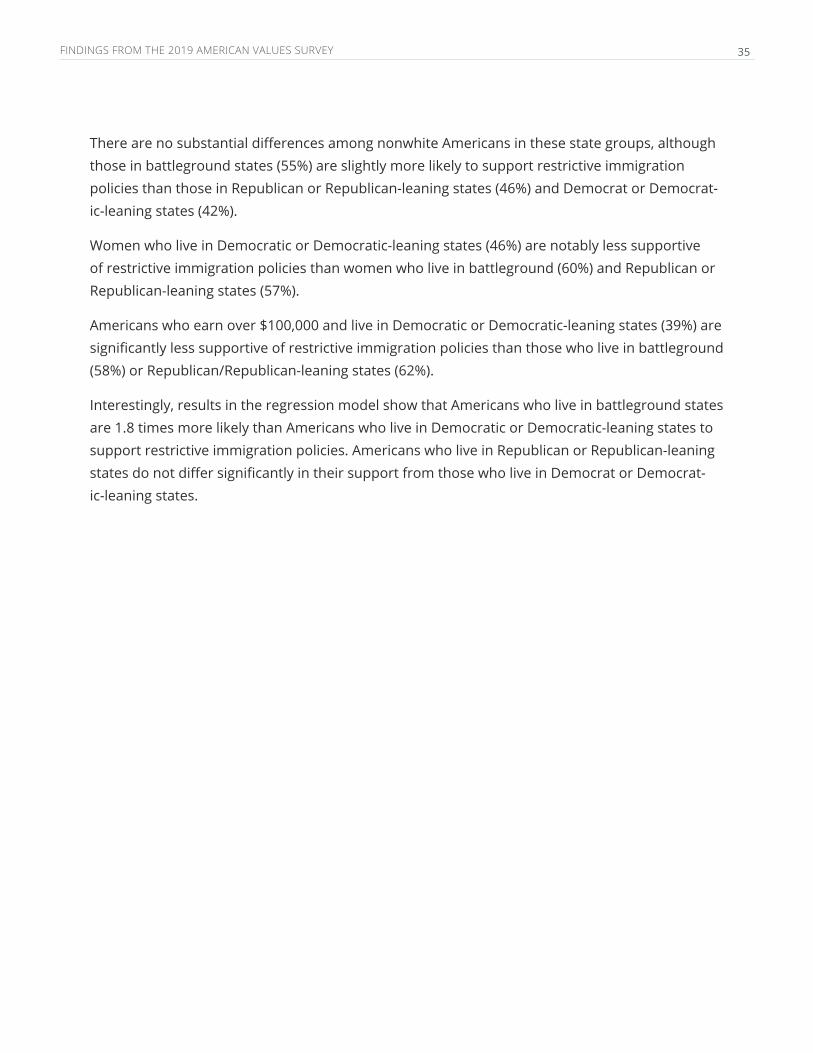
FINDINGS FROM THE 2019 AMERICAN VALUES SURVEY 35
There are no substantial differences among nonwhite Americans in these state groups, although those in battleground states (55%) are slightly more likely to support restrictive immigration policies than those in Republican or Republican-leaning states (46%) and Democrat or Democrat-ic-leaning states (42%).
Women who live in Democratic or Democratic-leaning states (46%) are notably less supportive of restrictive immigration policies than women who live in battleground (60%) and Republican or Republican-leaning states (57%).
Americans who earn over $100,000 and live in Democratic or Democratic-leaning states (39%) are significantly less supportive of restrictive immigration policies than those who live in battleground (58%) or Republican/Republican-leaning states (62%).
Interestingly, results in the regression model show that Americans who live in battleground states are 1.8 times more likely than Americans who live in Democratic or Democratic-leaning states to support restrictive immigration policies. Americans who live in Republican or Republican-leaning states do not differ significantly in their support from those who live in Democrat or Democrat-ic-leaning states.
36 A NATION OF IMMIGRANTS? DIVERGING PERCEPTIONS OF IMMIGRANTS INCREASINGLY MARKING PARTISAN DIVIDES
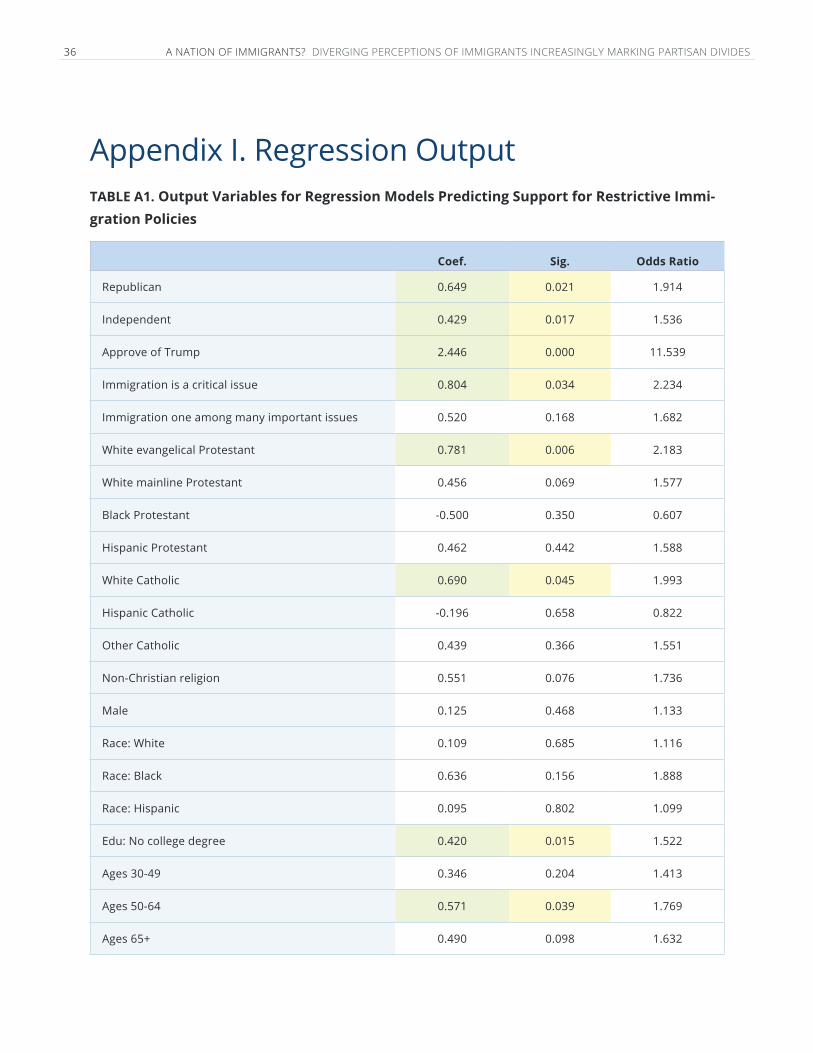
Appendix I. Regression OutputTABLE A1. Output Variables for Regression Models Predicting Support for Restrictive Immi-gration Policies
Coef. Sig. Odds Ratio
Republican 0.649 0.021 1.914
Independent 0.429 0.017 1.536
Approve of Trump 2.446 0.000 11.539
Immigration is a critical issue 0.804 0.034 2.234
Immigration one among many important issues 0.520 0.168 1.682
White evangelical Protestant 0.781 0.006 2.183
White mainline Protestant 0.456 0.069 1.577
Black Protestant -0.500 0.350 0.607
Hispanic Protestant 0.462 0.442 1.588
White Catholic 0.690 0.045 1.993
Hispanic Catholic -0.196 0.658 0.822
Other Catholic 0.439 0.366 1.551
Non-Christian religion 0.551 0.076 1.736
Male 0.125 0.468 1.133
Race: White 0.109 0.685 1.116
Race: Black 0.636 0.156 1.888
Race: Hispanic 0.095 0.802 1.099
Edu: No college degree 0.420 0.015 1.522
Ages 30-49 0.346 0.204 1.413
Ages 50-64 0.571 0.039 1.769
Ages 65+ 0.490 0.098 1.632
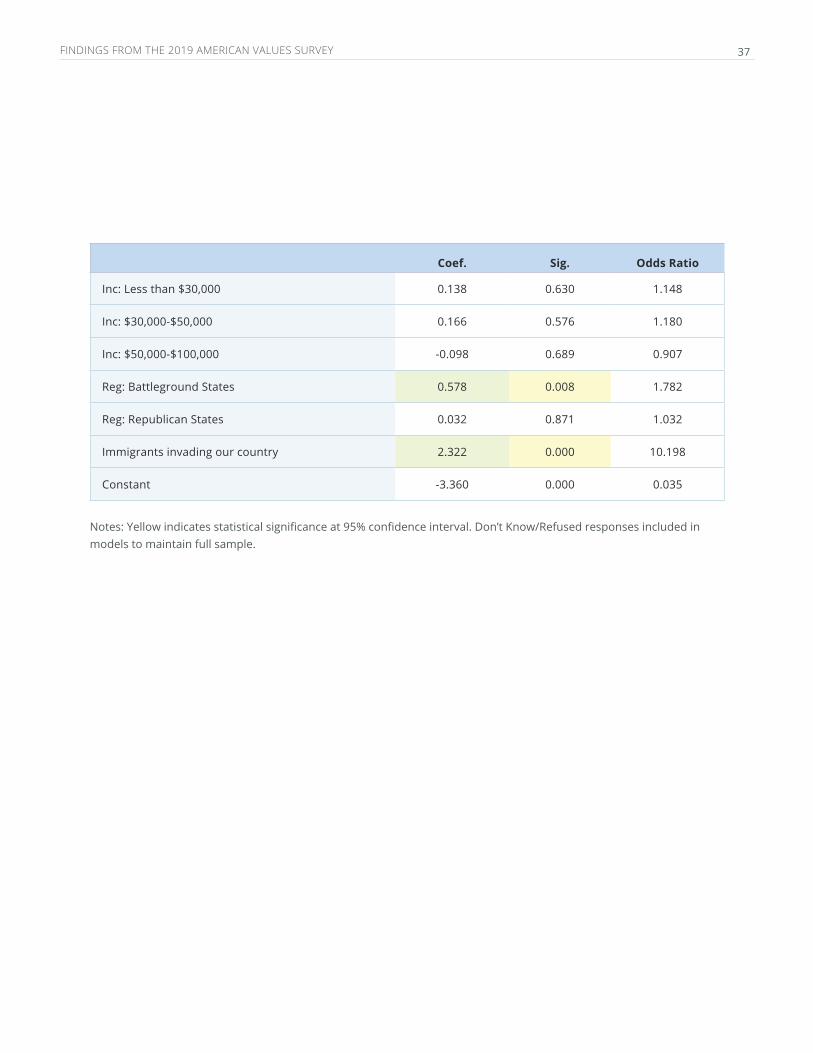
FINDINGS FROM THE 2019 AMERICAN VALUES SURVEY 37
Coef. Sig. Odds Ratio
Inc: Less than $30,000 0.138 0.630 1.148
Inc: $30,000-$50,000 0.166 0.576 1.180
Inc: $50,000-$100,000 -0.098 0.689 0.907
Reg: Battleground States 0.578 0.008 1.782
Reg: Republican States 0.032 0.871 1.032
Immigrants invading our country 2.322 0.000 10.198
Constant -3.360 0.000 0.035
Notes: Yellow indicates statistical significance at 95% confidence interval. Don’t Know/Refused responses included in models to maintain full sample.
38 A NATION OF IMMIGRANTS? DIVERGING PERCEPTIONS OF IMMIGRANTS INCREASINGLY MARKING PARTISAN DIVIDES
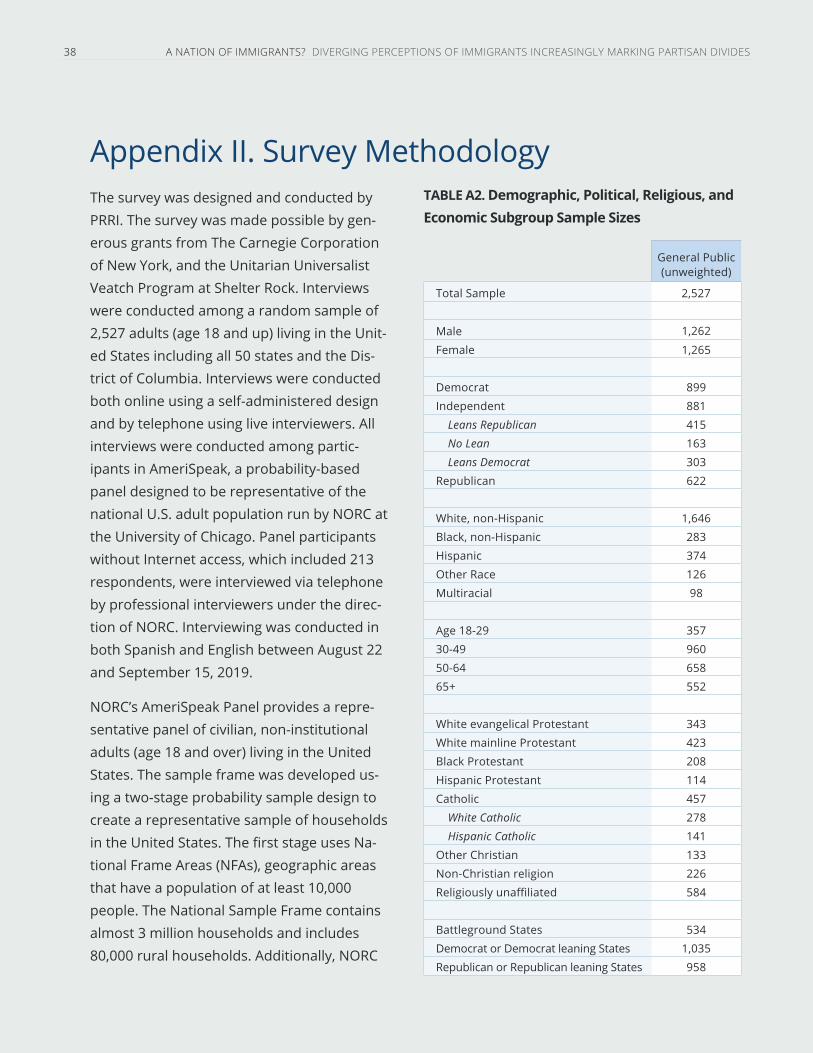
Appendix II. Survey MethodologyThe survey was designed and conducted by PRRI. The survey was made possible by gen-erous grants from The Carnegie Corporation of New York, and the Unitarian Universalist Veatch Program at Shelter Rock. Interviews were conducted among a random sample of 2,527 adults (age 18 and up) living in the Unit-ed States including all 50 states and the Dis-trict of Columbia. Interviews were conducted both online using a self-administered design and by telephone using live interviewers. All interviews were conducted among partic-ipants in AmeriSpeak, a probability-based panel designed to be representative of the national U.S. adult population run by NORC at the University of Chicago. Panel participants without Internet access, which included 213 respondents, were interviewed via telephone by professional interviewers under the direc-tion of NORC. Interviewing was conducted in both Spanish and English between August 22 and September 15, 2019.
NORC’s AmeriSpeak Panel provides a repre-sentative panel of civilian, non-institutional adults (age 18 and over) living in the United States. The sample frame was developed us-ing a two-stage probability sample design to create a representative sample of households in the United States. The first stage uses Na-tional Frame Areas (NFAs), geographic areas that have a population of at least 10,000 people. The National Sample Frame contains almost 3 million households and includes 80,000 rural households. Additionally, NORC
TABLE A2. Demographic, Political, Religious, and Economic Subgroup Sample Sizes
General Public (unweighted)
Total Sample 2,527
Male 1,262
Female 1,265
Democrat 899
Independent 881
Leans Republican 415
No Lean 163
Leans Democrat 303
Republican 622
White, non-Hispanic 1,646
Black, non-Hispanic 283
Hispanic 374
Other Race 126
Multiracial 98
Age 18-29 357
30-49 960
50-64 658
65+ 552
White evangelical Protestant 343
White mainline Protestant 423
Black Protestant 208
Hispanic Protestant 114
Catholic 457
White Catholic 278
Hispanic Catholic 141
Other Christian 133
Non-Christian religion 226
Religiously unaffiliated 584
Battleground States 534
Democrat or Democrat leaning States 1,035
Republican or Republican leaning States 958
FINDINGS FROM THE 2019 AMERICAN VALUES SURVEY 39
oversampled housing units in segments (Census tracts or block groups) that include hard-to-reach populations, including young adults, Hispanics and African Americans. Panel recruitment proceeded in two stages. First, a mail solicitation is sent to a randomly selected household along with follow-up telephone calls and email solicitations if necessary. In the second stage, house-holds that have not responded to the initial inquiry or follow-ups receive an enhanced incentive offer and a personal visit from NORC field interviewers. Members typically participate in panel surveys two or three times a month. For more information about AmeriSpeak, please visit: http://amerispeak.norc.org
The weighting is accomplished in two separate stages. First, panel base weights are calculated for every household based on the probability of selection from the NORC National Frame, the sampling frame that is used to sample housing units for AmeriSpeak. Household level weights are then assigned to each eligible adult in every recruited household. In the second stage, sample demographics are balanced to match target population parameters for gender, age, education, race and Hispanic ethnicity, and division (U.S. Census definitions), housing type, and telephone usage. The telephone usage parameter came from an analysis of the National Health Interview Survey. All other weighting parameters are derived from an analysis of the U.S. Census Bureau’s Current Population Survey.
The sample weighting is accomplished using an iterative proportional fitting (IFP) process that simultaneously balances the distributions of all variables. Weights were trimmed to prevent in-dividual interviews from having too much influence on the final results. The use of these weights in statistical analysis ensures that the demographic characteristics of the sample closely approxi-mate the demographic characteristics of the target populations.
The margin of error for the survey is +/- 2.8 percentage points at the 95% level of confidence. The design effect for the survey is 1.83. In addition to sampling error, surveys may also be subject to error or bias due to question wording, context and order effects.
40 A NATION OF IMMIGRANTS? DIVERGING PERCEPTIONS OF IMMIGRANTS INCREASINGLY MARKING PARTISAN DIVIDES
Appendix III. About PRRI PRRI PRRI is a nonprofit, nonpartisan organization dedicated to research at the intersection of religion, values, and public life.
Our mission is to help journalists, opinion leaders, scholars, clergy, and the general public better understand debates on public policy issues and the role of religion and values in American public life by conducting high quality public opinion surveys and qualitative research.
PRRI is a member of the American Association for Public Opinion Research (AAPOR), the Ameri-can Political Science Association (APSA), and the American Academy of Religion (AAR), and follows the highest research standards of independence and academic excellence.
We are also a member organization of the National Council on Public Polls, an association of polling organizations established in 1969, which sets the highest professional standards for public opinion researchers. PRRI is also a supporting organization of the Transparency Initiative at AAPOR, an initiative to place the value of openness at the center of the public opinion research profession.
As a nonpartisan, independent research organization, PRRI does not take positions on, nor do we advocate for, particular policies. Research supported by our funders reflects PRRI’s commitment to independent inquiry and academic rigor. Research findings and conclusions are never altered to accommodate other interests, including those of funders, other organizations, or government bodies and officials.
History
Since PRRI’s founding in 2009, our research has become a standard source of trusted in- forma-tion among journalists, scholars, policy makers, clergy, and the general public. PRRI research has been cited in thousands of media stories and academic publications and plays a leading role in deepening public understanding of the changing religious landscape and its role in shap-ing American politics.
For a full list of recent projects, see our research page: http://www.prri.org/research/
PRRI also maintains a lively online presence on Facebook (http://www.facebook.com/prripoll) and Twitter (http://www.twitter.com/prripoll).


PRRI 1023 15th Street NW, Floor Nine Washington D.C. 20005 www.prri.org