Embed Size (px)
Citation preview
Molecular Biology of the CellVol. 15, 506–519, February 2004
Diverse Effects of Methylseleninic Acid on theTranscriptional Program of Human Prostate CancerCellsHongjuan Zhao,* Michael L. Whitfield,† Tong Xu,‡ David Botstein,†and James D. Brooks*§
Departments of *Urology, †Genetics, and ‡Hematology, Stanford University School of Medicine,Stanford, California 94305
Submitted July 17, 2003; Revised October 14, 2003; Accepted October 17, 2003Monitoring Editor: Keith Yamamoto
Methylseleninic acid (MSA) has been shown to have potent anticancer activity and is an excellent compound for studyingthe anticancer effects of selenium in vitro. To gain insights into the effects of MSA in prostate cancer, we characterizedthe global transcriptional response of LNCaP, an androgen-sensitive human prostate cancer cell line, to MSA by usinghigh-density cDNA microarrays. We identified 951 genes whose expression shows striking dose- and time-dependentchanges in response to 3–30 �M MSA over the time course of 48 h. Transcript levels of many cell cycle-regulated geneschange in response to MSA, suggesting that MSA inhibits proliferation. Consistent with these gene expression changes,cell proliferation, monitored by carboxyfluoroscein succinimidyl ester staining, was decreased after MSA treatment, andan accumulation of cells at G0/G1 phase was detected by flow cytometry. Surprisingly, MSA also modulated expressionof many androgen-regulated genes, suppressed androgen receptor (AR) expression at both mRNA and protein level, anddecreased levels of prostate specific antigen secreted into the medium. Low concentrations of MSA also inducedsignificant increases in transcript levels of phase 2 detoxification enzymes and induced NADPH dehydrogenase, quinone1 enzymatic activity, a surrogate marker of global phase 2 enzyme activity. Our results suggest that MSA may protectagainst prostate cancer by inhibiting cell proliferation, by modulating the expression of AR and AR-regulated genes andby inducing carcinogen defenses.
INTRODUCTION
Increasing evidence suggests that selenium compoundshave promise as prostate cancer preventive agents. Severalepidemiological studies have shown an inverse associationbetween selenium levels in the serum or toenails and thesubsequent risk of developing prostate cancer (Willett et al.,1983; Yoshizawa et al., 1998; Helzlsouer et al., 2000; Nomuraet al., 2000; Brooks et al., 2001a). Animal and human inter-vention trials have shown that a daily supplementation withselenium-containing compounds reduces the risk of severalmalignancies, particularly human prostate cancer (Ip andWhite, 1987; el-Bayoumy, 1994; Reddy et al., 1994; Clark etal., 1996, 1998; Medina et al., 2001; Rao et al., 2001; Davis et al.,2002; Duffield-Lillico et al., 2002). The Nutritional Preventionof Cancer Trial, for instance, showed significantly lowerincidence of prostate cancer diagnosis in subjects random-ized to receive 200 �g of selenized yeast after 6.4 and 7.4 yrof follow-up, as well as reduced total cancer incidence (Clarket al., 1996; Duffield-Lillico et al., 2002). Although this studyhas been criticized for its use of secondary endpoints, it has
provided compelling rationale for the recently initiated Se-lenium and Vitamin E Cancer Prevention Trial (SELECT), a12-year prospective, randomized trial involving 32,000 men(Hoque et al., 2001; Klein et al., 2001).
The inverse relationship between selenium intake andprostate cancer risk has prompted a great deal of interest inunderstanding the mechanisms of selenium chemopreven-tion. Diverse forms of selenium have been shown to affect avariety of biological processes important in carcinogenesis(Ip, 1998; Combs, 2001; El-Bayoumy, 2001; Fleming et al.,2001; Ganther, 2001; Kim and Milner, 2001; Lu and Jiang,2001; Youn et al., 2001). Selenium compounds have beenshown to inhibit cell proliferation and induce apoptosis, andthese are thought to be major mechanisms by which sele-nium prevents tumor initiation or progression (Ip et al.,2000a; Combs, 2001; Ganther, 2001; Lu, 2001). Selenium com-pounds also protect cells against oxidative stress and geneticdamage, and block tumor angiogenesis (El-Bayoumy, 2001;Lu and Jiang, 2001). However, a comprehensive understand-ing of the mechanisms underlying selenium’s anticancereffects is currently lacking.
Monomethylated forms of selenium are highly potent andefficacious chemopreventive agents. Methylselenocysteine(MSC) and methylseleninic acid (MSA) have been shown tobe more active in cancer prevention than inorganic selenite,or selenomethionine, the form of selenium being used inSELECT (Ip et al., 1991; Ip, 1998; Combs, 2001; Hoque et al.,2001; Klein et al., 2001). It is believed that they are the directprecursors of methylselenol, possibly the key metaboliteresponsible for selenium’s anticancer activity. Whereas MSC
Article published online ahead of print. Mol. Biol. Cell 10.1091/mbc.E03–07–0501. Article and publication date are available atwww.molbiolcell.org/cgi/doi/10.1091/mbc.E03–07–0501.
§ Corresponding author. E-mail address: [email protected] used: AR, androgen receptor; CFSE, carboxyfluo-roscein succinimidyl ester; GAPDH, glyceraldehyde-3-phos-phate dehydrogenase; MSA, methylseleninic acid; MSC, meth-ylselenocysteine; NQO1, NADPH dehydrogenase, quinone 1;PSA, prostate-specific antigen.
506 © 2004 by The American Society for Cell Biology
requires the action of cysteine conjugate �-lyase or relatedlyases to be converted to methylselenol, MSA does not (An-dreadou et al., 1996; Ganther and Lawrence, 1997; Ip, 1998; Ipet al., 2000b). It is 10 times more potent than MSC in affectingbiological processes in vitro, probably because of limited�-lyase activity in cultured eukaryotic cells (Ip et al., 2000b).
Therefore, MSA is an ideal compound for studying theanticancer effects of selenium in vitro.
DNA microarrays provide a genome-wide view of thebiological processes affected by cellular perturbations andoffer an opportunity to gain new insights into the mecha-nisms by which preventive agents exert their effects (Wil-
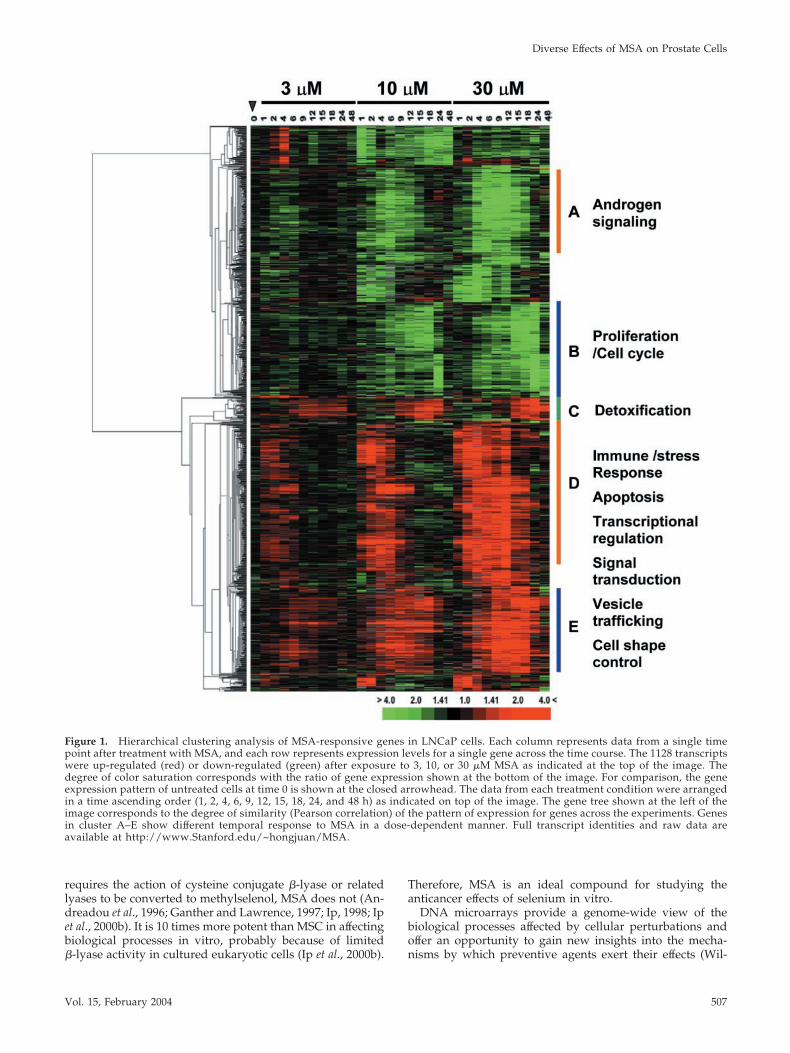
Figure 1. Hierarchical clustering analysis of MSA-responsive genes in LNCaP cells. Each column represents data from a single timepoint after treatment with MSA, and each row represents expression levels for a single gene across the time course. The 1128 transcriptswere up-regulated (red) or down-regulated (green) after exposure to 3, 10, or 30 �M MSA as indicated at the top of the image. Thedegree of color saturation corresponds with the ratio of gene expression shown at the bottom of the image. For comparison, the geneexpression pattern of untreated cells at time 0 is shown at the closed arrowhead. The data from each treatment condition were arrangedin a time ascending order (1, 2, 4, 6, 9, 12, 15, 18, 24, and 48 h) as indicated on top of the image. The gene tree shown at the left of theimage corresponds to the degree of similarity (Pearson correlation) of the pattern of expression for genes across the experiments. Genesin cluster A–E show different temporal response to MSA in a dose-dependent manner. Full transcript identities and raw data areavailable at http://www.Stanford.edu/~hongjuan/MSA.
Diverse Effects of MSA on Prostate Cells
Vol. 15, February 2004 507
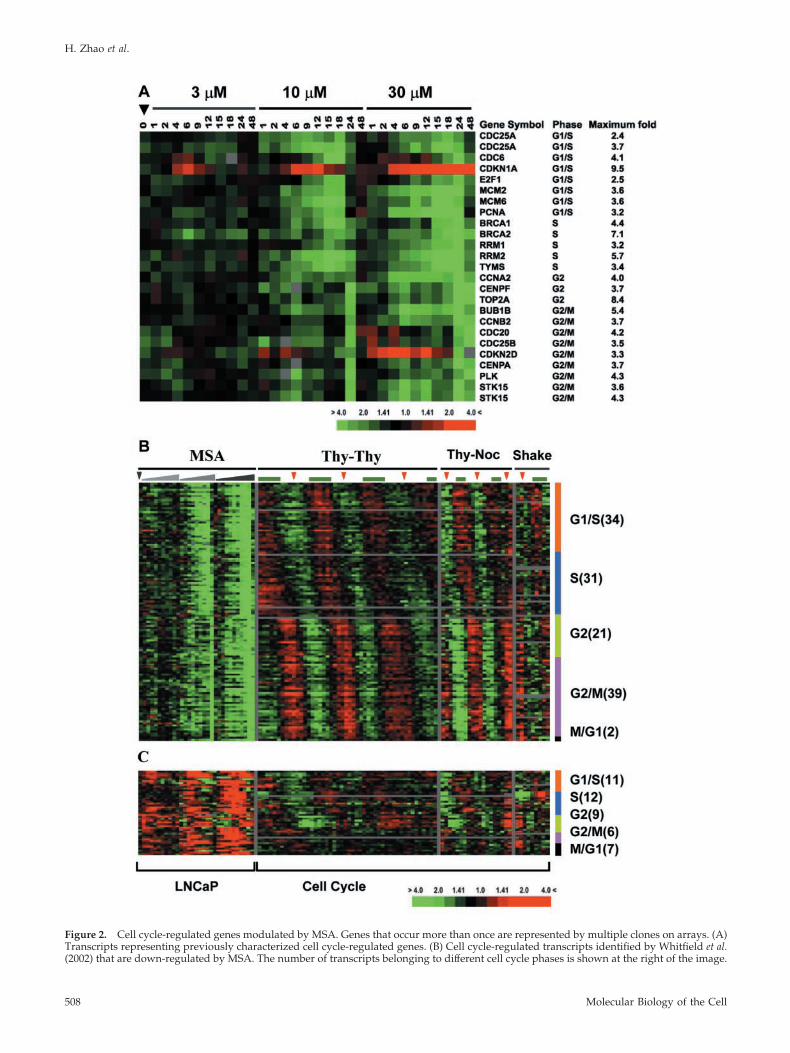
Figure 2. Cell cycle-regulated genes modulated by MSA. Genes that occur more than once are represented by multiple clones on arrays. (A)Transcripts representing previously characterized cell cycle-regulated genes. (B) Cell cycle-regulated transcripts identified by Whitfield et al.(2002) that are down-regulated by MSA. The number of transcripts belonging to different cell cycle phases is shown at the right of the image.
H. Zhao et al.
Molecular Biology of the Cell508
liams and Brooks, 2001). Herein, we have undertaken asystematic evaluation of the changes in gene expression thatresult from treatment of the androgen-sensitive prostate can-cer cell line LNCaP with MSA. We identified 1128 clonesrepresenting 951 genes whose expression levels are affectedby MSA in a time- and dose-dependent manner. The tran-scriptional profiles and confirmatory experiments suggestthat MSA causes cell accumulation at G0/G1 modulates theexpression of androgen receptor (AR) and its regulatedgenes, and induces enzymes that detoxify carcinogens.
MATERIALS AND METHODS
Cell Culture and TreatmentLNCaP cells were cultured in RPMI 1640 medium with 2 mM l-glutamine,100 U/ml penicillin/100 �g/ml streptomycin (Invitrogen, Carlsbad, CA), and5% defined fetal bovine serum that contributed 13 nM selenium to themedium (Hyclone Laboratories, Logan, UT). When cells reached �40–60%confluence, the medium was changed, and 12–24 h later the cells were treatedwith 3, 10, or 30 �M MSA (pH adjusted to 7.0) (Selenium Technologies,Lubbock, TX). The doses used in this study were chosen based on previousstudies using MSA in vitro and reported selenium levels in human serum (Ipet al., 2000b; Nomura et al., 2000; Brooks et al., 2001a; Jiang et al., 2001; Sinhaet al., 2001; Dong et al., 2002; Zhu et al., 2002). At several time points afterexposure, total RNA was harvested as described below. Untreated cellscultured in parallel were used as controls for each time point.
Total RNA IsolationMedium was aspirated from each 150-mm cell culture plate, and 5 ml ofTRIzol solution (Invitrogen) was added. After 5 min of gentle agitation,lysates were extracted with chloroform, and the organic and aqueous layerswere separated using Phase Lock Gel (Eppendorf-5 Prime, Inc., Boulder, CO).Total RNA was precipitated with isopropanol and further purified withRNeasy mini kit (QIAGEN, Valenica, CA). The concentration of total RNAwas determined using an MBA 2000 spectrometer (PerkinElmer Life Sciences,Boston, MA), and the integrity of total RNA was assessed using a 2100Bioanalyzer (Agilent Technologies, Palo Alto, CA).
cDNA Microarray HybridizationsFluorescently labeled cDNA probes were prepared from 70 �g of total RNAisolated from MSA-treated cells (Cy5 labeled) and control cells (Cy3 labeled)by reverse transcription with an Oligo dT primer 5�-TTTTTTTTTTTTTTTT-3�(QIAGEN) as described previously (Zhao et al., 2002). Labeled probes fromMSA-treated and control cells for each time point were mixed and hybridizedovernight to spotted cDNA microarrays with 42,941 elements (Stanford Func-tional Genomics Facility). Microarray slides were then washed to removeunbound probe and analyzed as described previously (Zhao et al., 2002).
Data Processing and AnalysisFluorescence intensities for each fluoroprobe were acquired using an Axonscanner 4000B and analyzed with GenePix Pro3.0 software (Axon Instru-ments, Union City, CA). Spots of poor quality were removed from furtheranalysis by visual inspection. Data files containing fluorescence ratios wereentered into the Stanford Microarray Database where biological data wereassociated with fluorescence ratios, and genes were selected for further anal-ysis (Sherlock et al., 2001). Only spots with a signal intensity �150% abovebackground in both Cy5 and Cy3 channels in at least 80% of the microarrayexperiments were used in the subsequent analysis. We arbitrarily selectedtranscripts whose expression level varied at least twofold after treatmentcompared with controls in at least three of the experiments examined. Priorwork has shown that twofold variations in expression reliably reflect changesin expression levels measured by other methods (Blader et al., 2001; Jones and
Arvin, 2003). The genes in the resulting data table were ordered by theirpatterns of gene expression by using hierarchical clustering analysis (Eisen etal., 1998) and visualized using Treeview software (http://rana.lbl.gov/Eisen-Software.htm). The data for all 1128 clones as well as the primary data areavailable at http://www.stanford.edu/�hongjuan/MSA.
Cell Proliferation and Cell Cycle AssayCell proliferation was determined using 5- or 6-(N-succinimidyloxycarbonyl)-3�,6�-O,O�-diacetylfluorescein (CFSE) (Dojindo Molecular Technologies,Gaithersburg, MD) staining (Lyons, 2000; Groszer et al., 2001) Untreated cellswere stained with 1 �M CFSE in RPMI 1640 medium at 37°C for 10 min beforebeing seeded in 60-mm plates with fresh media. After cells were culturedovernight, the media were again changed to eliminate residual CFSE that mayhave leaked from the cells. Half of the plates were treated with MSA fordifferent lengths of time and harvested by trypsinization, and the remaininguntreated plates cultured in parallel were used as controls. The absoluteintensity of CFSE within each cell was measured by flow cytometry, and theaverage intensity of CFSE within the population calculated using Flow Josoftware (http://www.flowjo.com/v4/html/overview.html).
Cell cycle distribution was determined by propidium iodide (PI) (Sigma-Aldrich, St. Louis, MO) staining. After aspirating the media, treated andcontrol cells were collected by trypsinization and washed with 1� phosphate-buffered saline. Duplicate samples were collected for each growth condition.Cells were fixed with 70% ice-cold ethanol overnight and stained with PI (20�g/ml) in presence of RNase A (300 �g/ml) at 37°C for 30 min. The DNAcontent of the cells was determined by flow cytometry, and cell cycle distri-bution was analyzed with Flow Jo software.
Western BlottingTreated and control cells were lysed with 1 ml of radioimmunoprecipitationassay buffer (pH 7.4, 50 mM Tris-HCl, 1% NP-40, 0.25% Na-deoxycholate, 150mM NaCl, 1 mM EDTA, 1 mM phenylmethylsulfonyl fluoride, 1 �g/mlaprotinin). The cell lysate was passed through a 21-gauge needle to shear thecellular DNA. Protein concentration was determined using a BCA proteinassay kit (Pierce Chemical, Rockford, IL). Ten to 15 �g of protein wasseparated using a 4–20% Tris-HCl precast gel (Bio-Rad, Hercules, CA), andtransferred to a Hybond-P membrane (Amersham Life Sciences, ArlingtonHeights, IL). AR was detected with a rabbit polyclonal antibody against theamino terminus of human AR, sc-816 (Santa Cruz Biotechnology, Santa Cruz,CA) and visualized with an ECL Plus kit (Amersham Biosciences, Piscataway,NJ). Glyceraldehyde-3-phosphate dehydrogenase (GAPDH) was detectedwith a monoclonal mouse anti-rabbit antibody, MoAb 6C5, which reacts withhuman GAPDH (Research Diagnostics, Flanders, NJ). AR and GAPDH signalintensities were quantified with a GS-700 densitometer (Bio-Rad).
Determination of Secreted Prostate-specific Antigen (PSA)LevelsMedia from MSA-treated and control cells cultured on a 24-well plate wasaspirated and stored at �80°C. PSA concentration in the thawed medium wasmeasured using a human prostate specific antigen ELISA kit (Alpha Diag-nostic International, San Antonio, TX) and was normalized to total protein ofcells cultured in the same well where the medium was taken.
NADPH Dehydrogenase, Quinone 1 (NQO1) EnzymaticActivity AssayAfter aspirating the media, treated and control cells cultured in a 96-well platewere lysed with 200 �l of 0.08% digitonin (Sigma-Aldrich)/2 mM EDTA (pH8.0) at 37°C for 30 min. NQO1 enzymatic activity was assessed in triplicate bythe menadione-coupled reduction of tetrazolium dye as described previously(Brooks et al., 2001b). Enzymatic activity for each sample was averaged acrossthe triplicate and normalized to total cell protein in each sample.
RESULTS
MSA Affects Gene Expression in LNCaP Cells in a Dose-and Time-dependent MannerTo study systematically the effects of MSA in human pros-tate cancer cells in vitro, we characterized the temporalprogram of gene expression induced by treating LNCaPcells with three different concentrations of MSA. Thirty-onesamples (10 samples/concentration over the course of 48 hplus one sample from untreated cells) were analyzed onmicroarrays containing �42,941 features representing�29,587 different human genes as inferred from UNIGENEclusters. The 1128 clones representing 951 genes displayedchanges in expression levels of at least twofold after MSAtreatment compared with controls in at least three samples.
Figure 2 (cont). The effect of MSA on expression of these genes isshown to the left organized in the same order as in A. The patternof these genes across multiple cell cycles in HeLa cells is shown tothe right. Thy-Thy indicates a double thymidine block to synchro-nize cells at S phase before release. Thy-Noc indicates a thymidine-nocodazole block to synchronize cells at mitosis before release.Shake indicates cells collected with an automated cell shaker thatwere used as synchronized in mitosis. The green bar above eachcolumn represents S phase, and the red arrowheads indicate mitosisas estimated by flow cytometry or bromodeoxyuridine labeling. (C)Cell cycle-regulated transcripts identified by Whitfield et al. (2002)that are up-regulated by MSA.
Diverse Effects of MSA on Prostate Cells
Vol. 15, February 2004 509
Many of the transcripts represent poorly characterized genesor expressed sequence tags. The data for the 1128 transcriptswere ordered by their patterns of gene expression by hier-archical clustering (Eisen et al., 1998) (Figure 1). The com-plete data set, including raw data, is available at http://www.stanford.edu/�hongjuan/MSA.
MSA produced discrete, reproducible, time- and dose-dependent changes in gene expression in LNCaP cells. Ex-pression changes were largely similar among cells treatedwith 3, 10, and 30 �M MSA; however, with higher concen-trations of MSA, changes in gene expression were larger inboth the magnitude and duration. The number of transcriptswhose expression increased or decreased was similar (541and 587, respectively). Approximately one-half of the tran-scripts showed changes within 1–2 h after treatment withpeak variation occurring within 8 h and returned to baselineexpression levels by 24 h (Figure 1, clusters A and D). Manyof the functionally characterized genes in cluster A areknown to be involved in androgen signaling pathways. Theremaining transcripts were delayed in their response, withexpression changes that peaked between 12 and 24 h andthat remained apparent at 48 h (Figure 1, clusters B, C, andE). These included genes involved in cell cycle regulation(cluster B) and phase 2 detoxification enzymes (cluster C).Known genes in clusters D and E are involved in diversebiological processes, including immune and stress responses(IGSF3, IGSF4, and NFIL3), apoptosis regulation (BIRC2,BIRC3, and TNFAIP3), transcriptional regulation (ATF3,ELF3, and MAD), signal transduction (JAK1, ARHB, andSH3BP5), tumor suppression (MEN1, ING1, and IRF1), ves-icle trafficking (SEC24D, STX1A, and RAB31), and cell shapecontrol (KLHL2, WASF1, and MAP1B).
MSA Changes Expression of Cell Cycle-regulated GenesMSA has been shown to inhibit cell growth through itseffects on the cell cycle in several model systems, althoughnot in the LNCaP cell line. A subset of the 1128 transcripts(Figure 1, cluster B) modulated by MSA in LNCaP cellsrepresent known cell cycle-regulated genes (Figure 2A). Togain insight into the effect of MSA on cell cycle-regulatedgenes, we compared these 1128 transcripts to a set of 1134transcripts (representing �850 genes) that vary periodicallyas synchronized HeLa cells pass through the cell cycle(Whitfield et al., 2002). In the latter data set, all 1134 tran-scripts were grouped according to the phase in the cell cyclewhere their expression peaked. Between the MSA and cellcycle data sets, 172 transcripts were found in common. The127 transcripts that showed decreased expression were dis-tributed throughout all phases of the cell cycle and includedgenes involved in DNA replication initiation (CDC6, MCM2,and MCM6), DNA repair (PCNA), and cell cycle control(CDC25A and E2F1) expressed in G1/S phase, DNA repli-cation (RRM1, RRM2, and TYMS) expressed in S phase,chromosome condensation and organization (TOP2A andCENPA), mitotic spindle checkpoint (CDC20 and BUB1B),and centrosome duplication (PLK and STK15) expressed inG2 and M phase (Figure 2B). There were 45 clones in com-mon between the data sets that were up-regulated by MSAthat, again, were distributed throughout all phases of the cellcycle. These transcripts show periodic expression in HeLacells with an expression pattern that was the inverse of thegenes that are down-regulated by MSA. In this set of tran-scripts are known inhibitors of proliferation, most notablyCDKN1A (p21), CDKN2D (p19), and CDKN1C (p57), all ofwhich are potent negative regulators of G1 cyclin/cdk com-plexes (Sherr and Roberts, 1999; Gitig and Koff, 2000). This
suggests that induction of this set of genes by MSA maymodulate decreased proliferation in LNCaP cells.
The distribution of transcripts affected by MSA across allphases of the cell cycle suggested that MSA might causeLNCaP cells to exit the cell cycle, rather than induce anarrest at a specific cell cycle phase or slow cell cycle progres-sion. In the HeLa cell cycle experiments, cell cycle arrest wasassociated with high expression of transcripts typically ex-pressed during the phase of the cell cycle at which arrestoccurs (see Thy-Thy, Thy-Noc, and Shake off in Figure 2B).In LNCaP treated with MSA, on the other hand, expres-sion variations of cell cycle-regulated transcripts were notselectively associated with any particular phase of the cellcycle; cell cycle-regulated transcripts typically expressedin a particular phase of the cell cycle (i.e., G1, S, or G2/M)all showed decreased expression and the transcripts thatdisplayed increased expression are known to inhibit cellproliferation. These expression changes, therefore, sug-gest that cells are exiting the cell cycle in response toMSA, rather than arresting at a particular phase in the cellcycle.
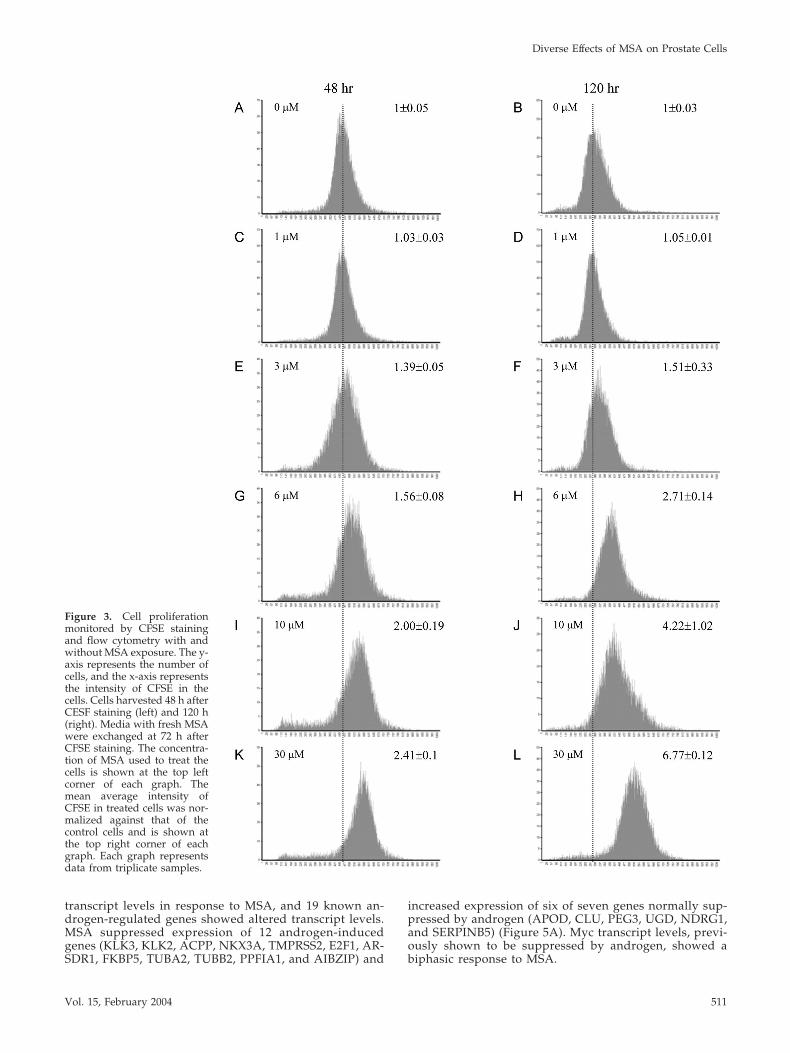
MSA Inhibits Cell Proliferation by Induction of CellAccumulation at G0/G1Based on the expression changes in the cell cycle-regulatedgenes, we assessed the effect of MSA on the proliferation ofthe LNCaP cells after pulse exposure to CFSE. CFSE diffusesfreely into cells where it is converted to a fluorescentlytagged membrane impermeable dye that is retained in thecytoplasm. With each round of cell division, the retainedCFSE is partitioned equally to daughter cells and the relativeintensity of the dye becomes decreased by half. At concen-trations between 3 and 30 �M, MSA produced a dose-dependent inhibition of LNCaP cell growth, evident by thesignificantly higher mean intensity of CFSE in treated cellscompared with controls (Figure 3). CFSE levels in MSA-treated cells remained high relative to control cells up to 48 hand then the inhibitory effect began to diminish (our unpub-lished data). Exchange of the medium at 72 h and retreat-ment with MSA produced growth inhibition out to 120 hsimilar in magnitude to that produced by the first treatment.Therefore, as predicted from gene expression profiling, MSAinhibits LNCaP cell growth and cells retain sensitivity to thisinhibition with repeated treatments.
To evaluate whether the decreased proliferation we ob-served was most consistent with cell cycle arrest or exit fromthe cell cycle, we performed flow cytometry on MSA-treatedand untreated LNCaP cells. The proportion of cells at G0/G1, S, and G2/M phase was determined after 24-h exposureto different concentrations of MSA. Cells treated with 3, 6,10, and 30 �M MSA all showed an increase in the percentageof cells at G0/G1 phase with a corresponding depletion ofcells in S and G2/M phase (Figure 4). The most pronouncedeffects were seen with 6 and 10 �M MSA, where the fractionof cells in S and G2/M phase decreased by 66 and 63%,respectively. We did not see evidence of apoptosis at any ofthe doses tested. These results are most consistent with MSAinducing either G1 arrest or causing cells to exit the cell cycle(G0).
MSA Modulates Transcript Levels of AR and Androgen-responsive GenesTo our surprise, we found that MSA modulated the ex-pression of AR and a group of well-characterized andro-gen-regulated genes in a time- and dose-dependent man-ner. Two clones representing AR showed decreased
H. Zhao et al.
Molecular Biology of the Cell510
transcript levels in response to MSA, and 19 known an-drogen-regulated genes showed altered transcript levels.MSA suppressed expression of 12 androgen-inducedgenes (KLK3, KLK2, ACPP, NKX3A, TMPRSS2, E2F1, AR-SDR1, FKBP5, TUBA2, TUBB2, PPFIA1, and AIBZIP) and
increased expression of six of seven genes normally sup-pressed by androgen (APOD, CLU, PEG3, UGD, NDRG1,and SERPINB5) (Figure 5A). Myc transcript levels, previ-ously shown to be suppressed by androgen, showed abiphasic response to MSA.
Figure 3. Cell proliferationmonitored by CFSE stainingand flow cytometry with andwithout MSA exposure. The y-axis represents the number ofcells, and the x-axis representsthe intensity of CFSE in thecells. Cells harvested 48 h afterCESF staining (left) and 120 h(right). Media with fresh MSAwere exchanged at 72 h afterCFSE staining. The concentra-tion of MSA used to treat thecells is shown at the top leftcorner of each graph. Themean average intensity ofCFSE in treated cells was nor-malized against that of thecontrol cells and is shown atthe top right corner of eachgraph. Each graph representsdata from triplicate samples.
Diverse Effects of MSA on Prostate Cells
Vol. 15, February 2004 511
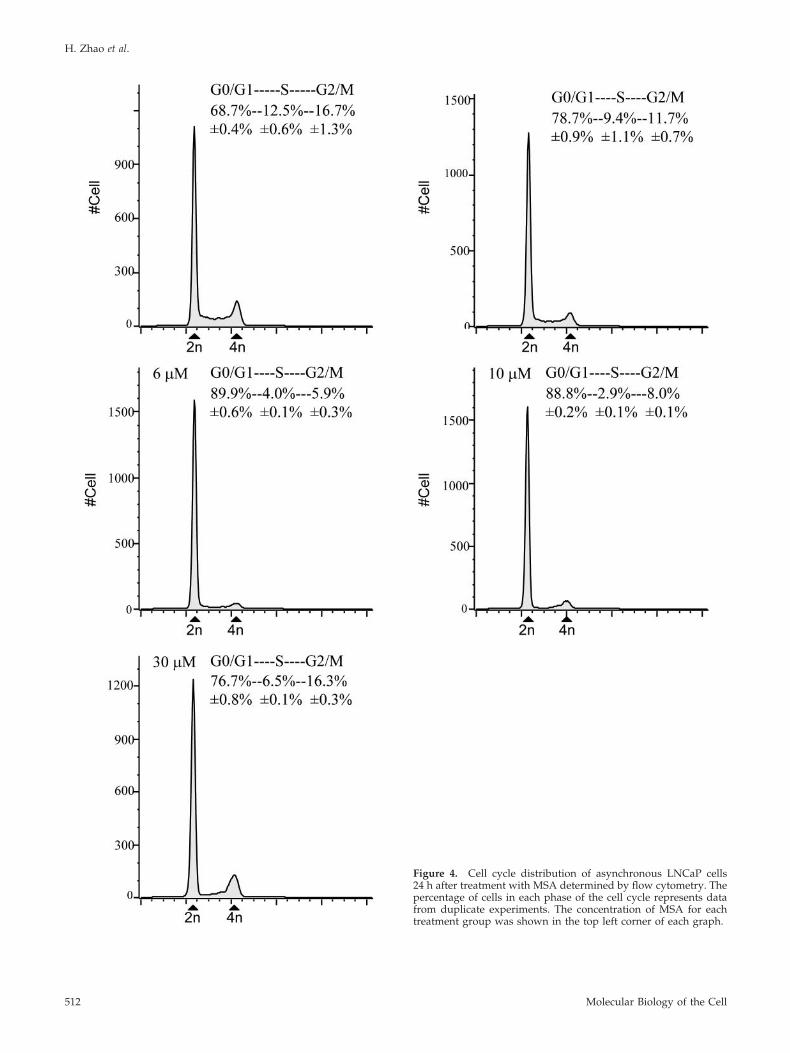
Figure 4. Cell cycle distribution of asynchronous LNCaP cells24 h after treatment with MSA determined by flow cytometry. Thepercentage of cells in each phase of the cell cycle represents datafrom duplicate experiments. The concentration of MSA for eachtreatment group was shown in the top left corner of each graph.
H. Zhao et al.
Molecular Biology of the Cell512
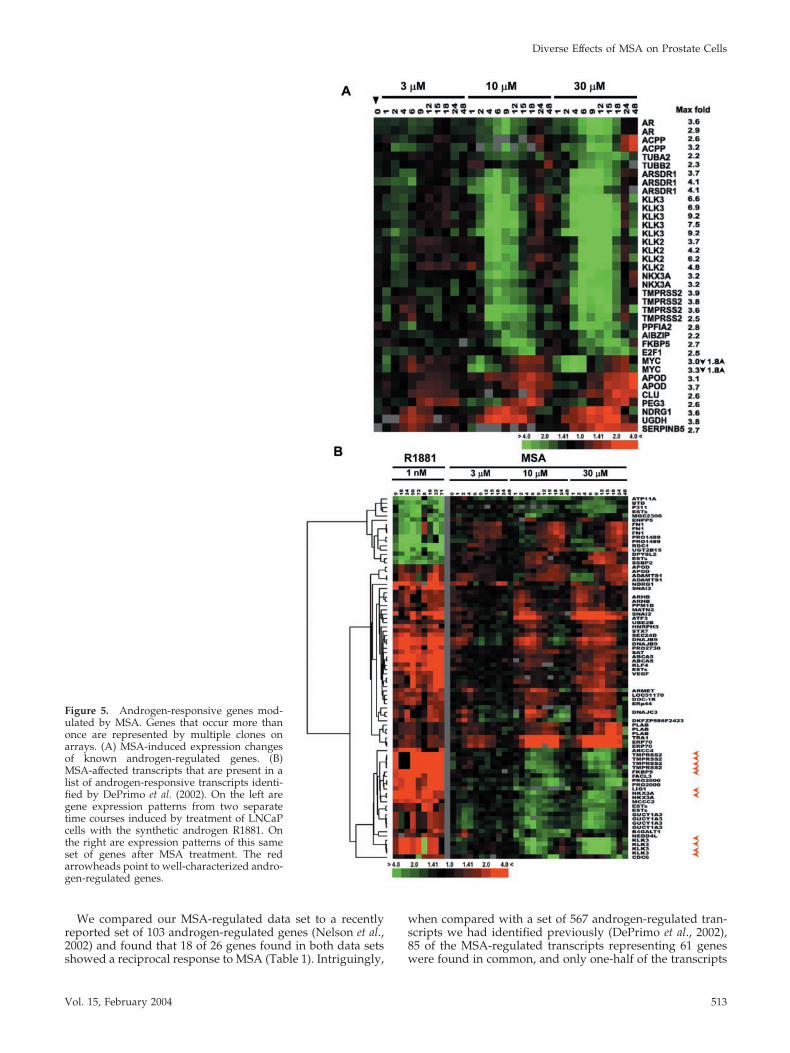
We compared our MSA-regulated data set to a recentlyreported set of 103 androgen-regulated genes (Nelson et al.,2002) and found that 18 of 26 genes found in both data setsshowed a reciprocal response to MSA (Table 1). Intriguingly,
when compared with a set of 567 androgen-regulated tran-scripts we had identified previously (DePrimo et al., 2002),85 of the MSA-regulated transcripts representing 61 geneswere found in common, and only one-half of the transcripts
Figure 5. Androgen-responsive genes mod-ulated by MSA. Genes that occur more thanonce are represented by multiple clones onarrays. (A) MSA-induced expression changesof known androgen-regulated genes. (B)MSA-affected transcripts that are present in alist of androgen-responsive transcripts identi-fied by DePrimo et al. (2002). On the left aregene expression patterns from two separatetime courses induced by treatment of LNCaPcells with the synthetic androgen R1881. Onthe right are expression patterns of this sameset of genes after MSA treatment. The redarrowheads point to well-characterized andro-gen-regulated genes.
Diverse Effects of MSA on Prostate Cells
Vol. 15, February 2004 513
were reciprocally regulated (Figure 5B). Therefore, compar-ison of the MSA expression data set to this larger androgen-regulated data set suggested that MSA has mixed effects onandrogen-responsive genes.
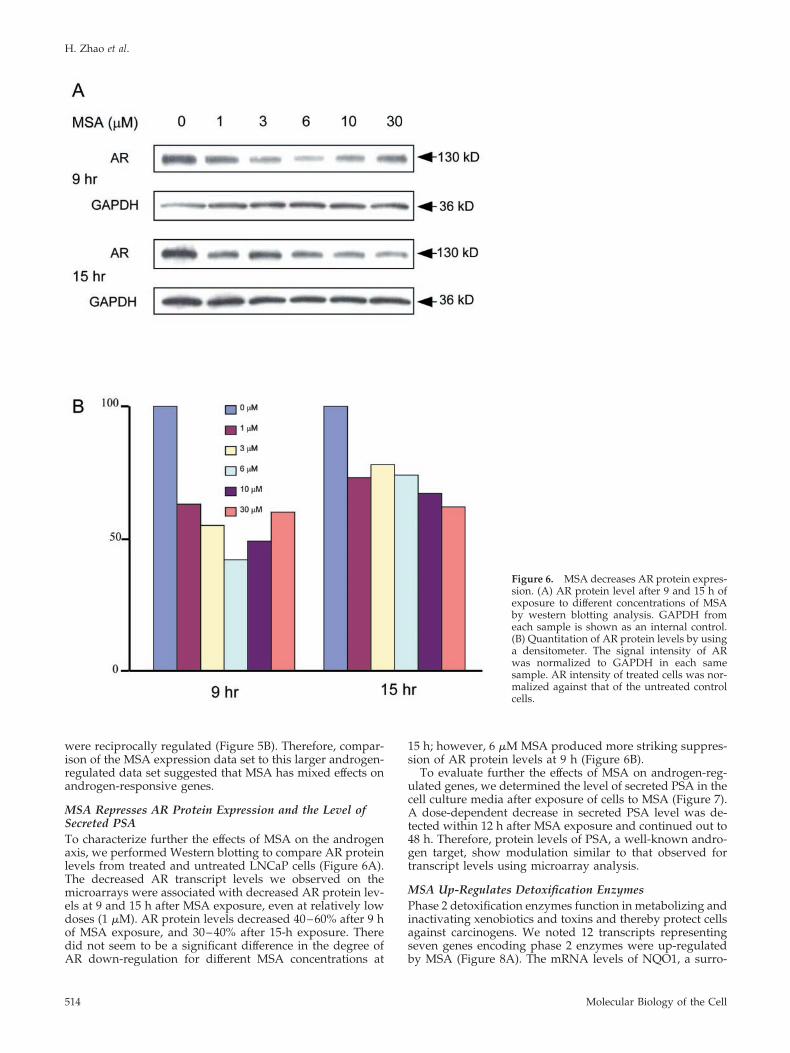
MSA Represses AR Protein Expression and the Level ofSecreted PSATo characterize further the effects of MSA on the androgenaxis, we performed Western blotting to compare AR proteinlevels from treated and untreated LNCaP cells (Figure 6A).The decreased AR transcript levels we observed on themicroarrays were associated with decreased AR protein lev-els at 9 and 15 h after MSA exposure, even at relatively lowdoses (1 �M). AR protein levels decreased 40–60% after 9 hof MSA exposure, and 30–40% after 15-h exposure. Theredid not seem to be a significant difference in the degree ofAR down-regulation for different MSA concentrations at
15 h; however, 6 �M MSA produced more striking suppres-sion of AR protein levels at 9 h (Figure 6B).
To evaluate further the effects of MSA on androgen-reg-ulated genes, we determined the level of secreted PSA in thecell culture media after exposure of cells to MSA (Figure 7).A dose-dependent decrease in secreted PSA level was de-tected within 12 h after MSA exposure and continued out to48 h. Therefore, protein levels of PSA, a well-known andro-gen target, show modulation similar to that observed fortranscript levels using microarray analysis.
MSA Up-Regulates Detoxification EnzymesPhase 2 detoxification enzymes function in metabolizing andinactivating xenobiotics and toxins and thereby protect cellsagainst carcinogens. We noted 12 transcripts representingseven genes encoding phase 2 enzymes were up-regulatedby MSA (Figure 8A). The mRNA levels of NQO1, a surro-
Figure 6. MSA decreases AR protein expres-sion. (A) AR protein level after 9 and 15 h ofexposure to different concentrations of MSAby western blotting analysis. GAPDH fromeach sample is shown as an internal control.(B) Quantitation of AR protein levels by usinga densitometer. The signal intensity of ARwas normalized to GAPDH in each samesample. AR intensity of treated cells was nor-malized against that of the untreated controlcells.
H. Zhao et al.
Molecular Biology of the Cell514
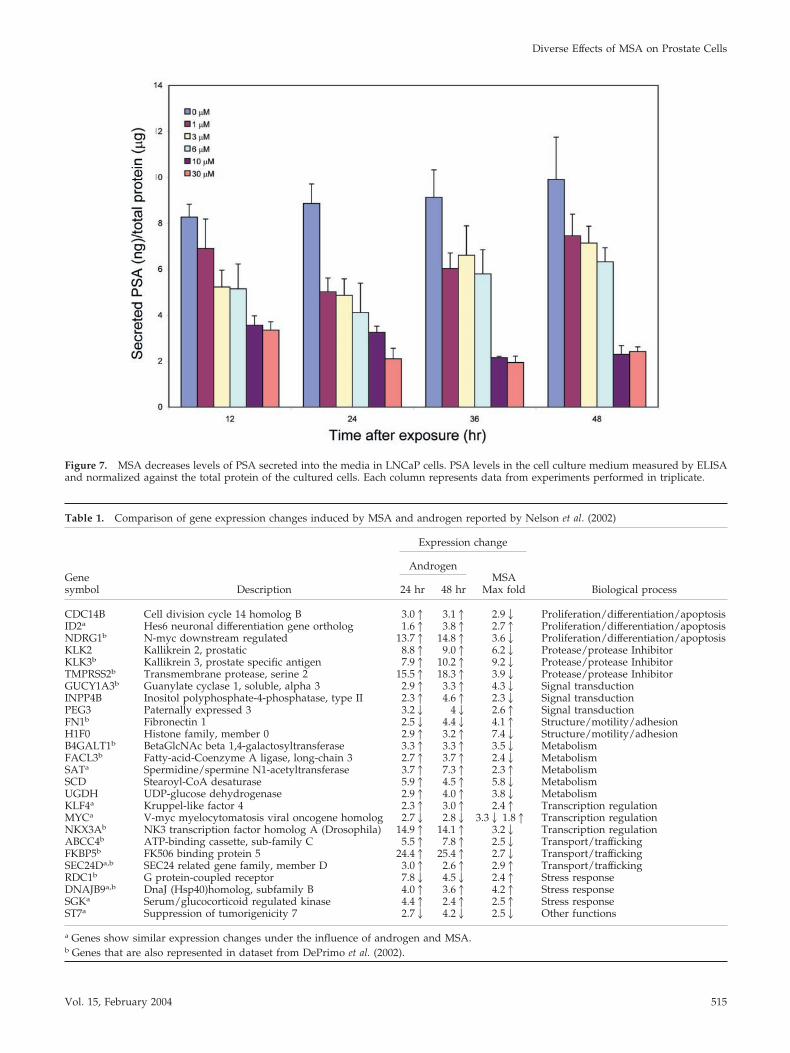
Figure 7. MSA decreases levels of PSA secreted into the media in LNCaP cells. PSA levels in the cell culture medium measured by ELISAand normalized against the total protein of the cultured cells. Each column represents data from experiments performed in triplicate.
Table 1. Comparison of gene expression changes induced by MSA and androgen reported by Nelson et al. (2002)
Genesymbol Description
Expression change
Biological process
AndrogenMSA
Max fold24 hr 48 hr
CDC14B Cell division cycle 14 homolog B 3.01 3.11 2.92 Proliferation/differentiation/apoptosisID2a Hes6 neuronal differentiation gene ortholog 1.61 3.81 2.71 Proliferation/differentiation/apoptosisNDRG1b N-myc downstream regulated 13.71 14.81 3.62 Proliferation/differentiation/apoptosisKLK2 Kallikrein 2, prostatic 8.81 9.01 6.22 Protease/protease InhibitorKLK3b Kallikrein 3, prostate specific antigen 7.91 10.21 9.22 Protease/protease InhibitorTMPRSS2b Transmembrane protease, serine 2 15.51 18.31 3.92 Protease/protease InhibitorGUCY1A3b Guanylate cyclase 1, soluble, alpha 3 2.91 3.31 4.32 Signal transductionINPP4B Inositol polyphosphate-4-phosphatase, type II 2.31 4.61 2.32 Signal transductionPEG3 Paternally expressed 3 3.22 42 2.61 Signal transductionFN1b Fibronectin 1 2.52 4.42 4.11 Structure/motility/adhesionH1F0 Histone family, member 0 2.91 3.21 7.42 Structure/motility/adhesionB4GALT1b BetaGlcNAc beta 1,4-galactosyltransferase 3.31 3.31 3.52 MetabolismFACL3b Fatty-acid-Coenzyme A ligase, long-chain 3 2.71 3.71 2.42 MetabolismSATa Spermidine/spermine N1-acetyltransferase 3.71 7.31 2.31 MetabolismSCD Stearoyl-CoA desaturase 5.91 4.51 5.82 MetabolismUGDH UDP-glucose dehydrogenase 2.91 4.01 3.82 MetabolismKLF4a Kruppel-like factor 4 2.31 3.01 2.41 Transcription regulationMYCa V-myc myelocytomatosis viral oncogene homolog 2.72 2.82 3.32 1.81 Transcription regulationNKX3Ab NK3 transcription factor homolog A (Drosophila) 14.91 14.11 3.22 Transcription regulationABCC4b ATP-binding cassette, sub-family C 5.51 7.81 2.52 Transport/traffickingFKBP5b FK506 binding protein 5 24.41 25.41 2.72 Transport/traffickingSEC24Da,b SEC24 related gene family, member D 3.01 2.61 2.91 Transport/traffickingRDC1b G protein-coupled receptor 7.82 4.52 2.41 Stress responseDNAJB9a,b DnaJ (Hsp40)homolog, subfamily B 4.01 3.61 4.21 Stress responseSGKa Serum/glucocorticoid regulated kinase 4.41 2.41 2.51 Stress responseST7a Suppression of tumorigenicity 7 2.72 4.22 2.52 Other functions
a Genes show similar expression changes under the influence of androgen and MSA.b Genes that are also represented in dataset from DePrimo et al. (2002).
Diverse Effects of MSA on Prostate Cells
Vol. 15, February 2004 515
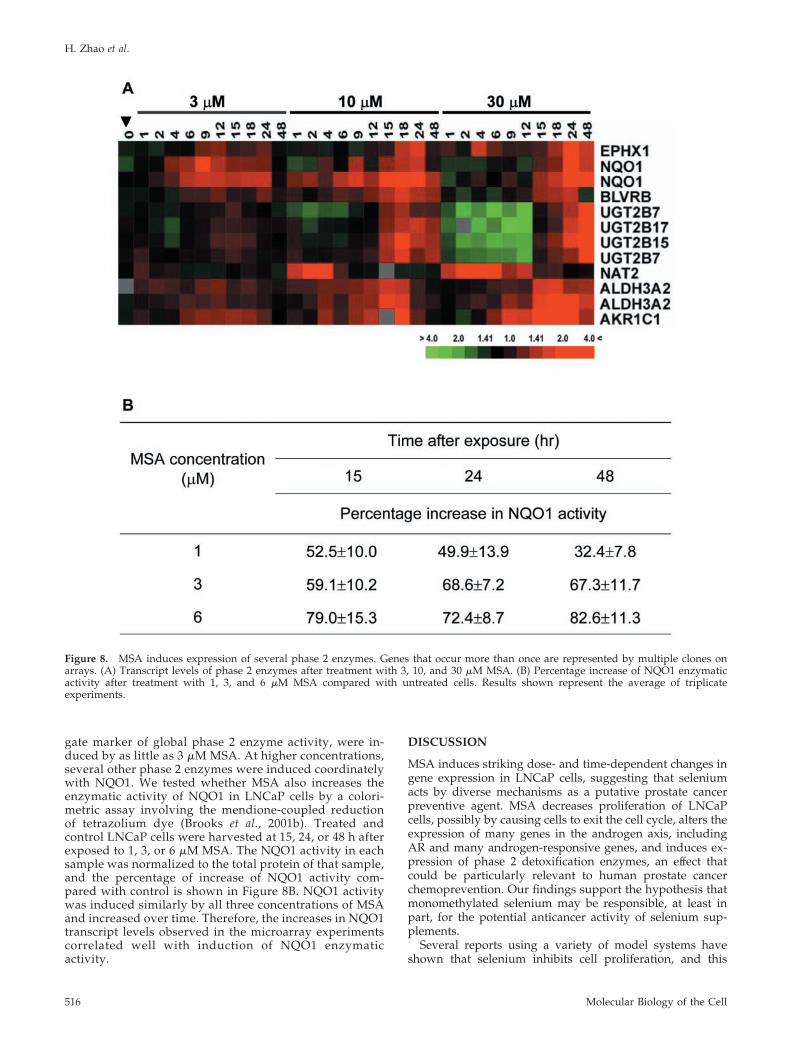
gate marker of global phase 2 enzyme activity, were in-duced by as little as 3 �M MSA. At higher concentrations,several other phase 2 enzymes were induced coordinatelywith NQO1. We tested whether MSA also increases theenzymatic activity of NQO1 in LNCaP cells by a colori-metric assay involving the mendione-coupled reductionof tetrazolium dye (Brooks et al., 2001b). Treated andcontrol LNCaP cells were harvested at 15, 24, or 48 h afterexposed to 1, 3, or 6 �M MSA. The NQO1 activity in eachsample was normalized to the total protein of that sample,and the percentage of increase of NQO1 activity com-pared with control is shown in Figure 8B. NQO1 activitywas induced similarly by all three concentrations of MSAand increased over time. Therefore, the increases in NQO1transcript levels observed in the microarray experimentscorrelated well with induction of NQO1 enzymaticactivity.
DISCUSSION
MSA induces striking dose- and time-dependent changes ingene expression in LNCaP cells, suggesting that seleniumacts by diverse mechanisms as a putative prostate cancerpreventive agent. MSA decreases proliferation of LNCaPcells, possibly by causing cells to exit the cell cycle, alters theexpression of many genes in the androgen axis, includingAR and many androgen-responsive genes, and induces ex-pression of phase 2 detoxification enzymes, an effect thatcould be particularly relevant to human prostate cancerchemoprevention. Our findings support the hypothesis thatmonomethylated selenium may be responsible, at least inpart, for the potential anticancer activity of selenium sup-plements.
Several reports using a variety of model systems haveshown that selenium inhibits cell proliferation, and this
Figure 8. MSA induces expression of several phase 2 enzymes. Genes that occur more than once are represented by multiple clones onarrays. (A) Transcript levels of phase 2 enzymes after treatment with 3, 10, and 30 �M MSA. (B) Percentage increase of NQO1 enzymaticactivity after treatment with 1, 3, and 6 �M MSA compared with untreated cells. Results shown represent the average of triplicateexperiments.
H. Zhao et al.
Molecular Biology of the Cell516
inhibition is thought to underlie selenium chemoprevention(Ip et al., 2000a; Combs, 2001; Ganther, 2001; Lu, 2001).Decreased proliferation has been attributed to cell cyclearrest, although in prostate cancer cell lines no consistentpattern of arrest has been observed. After treatment withsodium selenite or selenomethionine, growth arrest has beenreported in the G1 and G2/M phases of the cell cycle,depending on the prostate cancer cell line in which thesecompounds were tested (Redman et al., 1998; Menter et al.,2000; Venkateswaran et al., 2002; Bhamre et al., 2003). Thislack of consistency may be due to innate differences betweenthe cell lines or to differences in metabolism of the forms ofselenium used in these studies. Based on compelling evi-dence that methylselenol is largely responsible for the che-mopreventive activities of selenium compounds, we usedMSA in our studies because it can be converted directly intomethylselenol in vitro (Ip et al., 2000b). MSA produced adose-dependent inhibition of cell growth of LNCaP with anaccumulation of cells in G0/G1 phase. Similar inhibition ofproliferation and accumulation of cells in G0/G1 has beenobserved in breast cancer and endothelial cells treated withMSA (Sinha et al., 2001; Wang et al., 2001; Dong et al., 2002).
We noted that a striking decrease in expression of manycell cycle-regulated genes from all phases of the cell cycleaccompanied growth inhibition in LNCaP cells. Microarrayanalysis has been used in mammary cancer cells and PC-3prostate cancer cells, and down-regulation of cell cycle-regulated genes has been observed along with increasedexpression of CDK inhibitors (Dong et al., 2002, 2003). Inthese reports, decreased proliferation had been attributed tocell cycle arrest due to modulation of key regulators of thecell cycle, many of which are seen in our data set. Compar-ison of our data set to genes whose expression varies peri-odically as HeLa cells pass through the cell cycle provides abroader view of the effects of MSA on the cell cycle. Thecoordinate, decreased expression of genes involved in allphases of the cell cycle coupled with the increased expres-sion of CDK-inhibitors (CDKN1A, CDKN2D, and CDKN1C)suggest MSA causes LNCaP cells to exit the cell cycle, ratherthan inducing an arrest at a specific phase in the cell cycle.Whether this is the primary mechanism by which seleniumcompounds inhibit cell growth awaits further study. Cer-tainly, assessment of the effects of other forms of seleniumon the expression of cell cycle genes in prostate cells couldprovide additional information on the means by which se-lenium compounds inhibit prostate cancer growth. Ulti-mately, it will be necessary to evaluate the effects of sele-nium on prostate cancer growth in vivo, and the cell cycle-regulated genes identified in this and other studies couldserve as biomarkers of response.
Perhaps the most striking observation from our microar-ray experiments is that MSA produced changes in transcriptlevels of AR and AR-regulated genes. Androgens are criticalto prostate carcinogenesis, and androgen deprivation ther-apy is a mainstay of prostate cancer treatment. MSA sup-presses the expression of AR at both mRNA and proteinlevels, decreases transcript levels of PSA, and decreases PSAprotein excretion into the media. A small set of well-charac-terized androgen-regulated genes, including those with an-drogen response regulatory elements, show expressionchanges that are reciprocal to those induced by androgen.Comparison of the MSA data set with a large data set ofgenes modulated in response to androgens shows thatmany, but not all, androgen-regulated genes show expres-sion changes opposite to what is seen after treatment withandrogens. Some genes were regulated similarly in the twodata sets, suggesting that MSA has mixed effects on the
transcription of AR-regulated genes. It is possible that genesthat are regulated similarly by MSA and androgens are notdirect targets of androgen signaling pathways. For instance,androgen treatment of LNCaP cells is known to producecellular stress by inducing an oxidative burst, and inductionof stress response genes has been observed with expressionprofiling after androgen treatment (Xu et al., 2001; DePrimoet al., 2002). Therefore, the transcripts regulated similarly byandrogens and MSA (DNAJB9, ATF3, and VEGF) mightreflect cellular stress or other pathways that have been acti-vated secondarily.
Effects of selenium on AR and AR-regulated genes in pros-tate cancer cell lines have not been observed with other sele-nium compounds; in fact, two reports have shown that sel-enomethionine does not have an effect on AR function or PSAsecretion in LNCaP cells (Zhang et al., 2002; Bhamre et al., 2003).One possible explanation for the lack of effect of selenomethi-onine on androgen-regulated genes is its poor conversion tomethylselenol in vitro. Intriguingly, men supplemented withselenized yeast do show small but significant decreases in theirserum PSA levels compared with control subjects, suggestingthe possibility that selenium compounds can affect AR-regulated genes in vivo where they can be metabolized tomethylselenol (El-Bayoumy et al., 2002). In addition, effects ofMSA on AR-regulated genes in PC-3 cells were not observedby Dong et al. (2002, 2003), suggesting that MSA may affecttranscription of AR-regulated genes through AR.
It is tempting to speculate that MSA blocks proliferation inprostate cells through its effects on AR and AR-regulatedgenes. Consistent with our findings, Venkateswaran et al.(200) observed that selenomethionine did not affect thegrowth of wild-type (AR-null) PC-3 prostate cancer celllines, but did inhibit growth of PC-3 cells stably expressingAR. However, three other groups have observed growthinhibition by selenium compounds in prostate cancer celllines that do not express AR (Redman et al., 1998; Menter etal., 2000; Dong et al., 2003). Additional work will be neces-sary to understand the role of MSA on androgen signalingpathways and cell growth.
Our studies suggest that enhancement of detoxification isanother mechanism that underlies the chemopreventive ef-fects of MSA. MSA up-regulates mRNA levels of severalphase 2 enzymes, including EPHX1, NQO1, NAT2, andmembers of the UGTB family, as well as the enzymaticactivity of NQO1. We have observed similar induction ofNQO1 enzymatic activity in LNCaP cells treated with so-dium selenite and selenium dioxide (Brooks et al., 2002),demonstrating that several forms of selenium are capable ofinducing phase 2 enzymatic activity in prostate cells. Induc-tion of phase 2 enzymatic activity has been proposed as apromising avenue of prostate cancer prevention after thediscovery that virtually all human prostate cancers and pre-cursor lesions (PIN) lose expression of the phase 2 enzymeglutathione S-transferase � (GSTP1) (DePrimo et al., 2001;Nelson et al., 2001). Global induction of phase 2 enzymes byselenium compounds might compensate for the loss ofGSTP1 expression that occurs early in prostate carcinogen-esis thereby and protect vulnerable prostatic epithelial cellsagainst genome damage.
In summary, we have characterized the global transcrip-tional response program of LNCaP to MSA. The expressionchanges we observed imply that MSA exerts its anticanceractivity through diverse mechanisms, including inhibition ofcell proliferation, modulation of the expression of AR and itsregulated genes, and induction of enzymes involved in car-cinogen detoxification. Therefore, this data set provides apotential resource for understanding the modes of action of
Diverse Effects of MSA on Prostate Cells
Vol. 15, February 2004 517
MSA and serves as a source for candidate biomarkers ofselenium’s effects that could be measured in vivo. Discoveryof such markers could help in the design and interpretationof selenium intervention trials currently in progress.
ACKNOWLEDGMENTS
We thank Dr. Zijie Sun for generously providing LNCaP cells, Dr. JohnHiggins for critical review of this manuscript, the Stanford FunctionalGenomics Facility for production of the high-quality microarrays used in thisstudy, and the Stanford Microarray Database group for support on datastorage and analysis. This work was supported by the Department of Defense(DAMD17-98-1-8555), the Doris Duke Foundation (T98064) and the OxnardFoundation to J.D.B. M.L.W. is supported by a National Research Service AwardPostdoctoral Fellowship from the National Human Genome Research Institute(HG00220) and by a grant from the Scleroderma Research Foundation.
REFERENCES
Andreadou, I., Menge, W.M., Commandeur, J.N., Worthington, E.A., andVermeulen, N.P. (1996). Synthesis of novel Se-substituted selenocysteine de-rivatives as potential kidney selective prodrugs of biologically active selenolcompounds: evaluation of kinetics of beta-elimination reactions in rat renalcytosol. J. Med. Chem. 39, 2040–2046.
Bhamre, S., Whitin, J.C., and Cohen, H.J. (2003). Selenomethionine does notaffect PSA secretion independent of its effect on LNCaP cell growth. Prostate54, 315–321.
Blader, I.J., Manger, I.D., and Boothroyd, J.C. (2001). Microarray analysisreveals previously unknown changes in Toxoplasma gondii-infected humancells. J. Biol. Chem. 276, 24223–24231.
Brooks, J.D., Goldberg, M.F., Nelson, L.A., Wu, D., and Nelson, W.G. (2002).Identification of potential prostate cancer preventive agents through induc-tion of quinone reductase in vitro. Cancer Epidemiol. Biomarkers Prev. 11,868–875.
Brooks, J.D., Metter, E.J., Chan, D.W., Sokoll, L.J., Landis, P., Nelson, W.G.,Muller, D., Andres, R., and Carter, H.B. (2001a). Plasma selenium level beforediagnosis and the risk of prostate cancer development. J. Urol. 166, 2034–2038.
Brooks, J.D., Paton, V.G., and Vidanes, G. (2001b). Potent induction of phase2 enzymes in human prostate cells by sulforaphane. Cancer Epidemiol. Bi-omarkers Prev. 10, 949–954.
Clark, L.C., et al. (1996). Effects of selenium supplementation for cancerprevention in patients with carcinoma of the skin. A randomized controlledtrial. Nutritional Prevention of Cancer Study Group. J. Am. Med. Assoc. 276,1957–1963.
Clark, L.C., et al. (1998). Decreased incidence of prostate cancer with seleniumsupplementation: results of a double-blind cancer prevention trial. Br. J. Urol.81, 730–734.
Combs, G.F., Jr. (2001). Considering the mechanisms of cancer prevention byselenium. Adv. Exp. Med. Biol. 492, 107–117.
Davis, C.D., Zeng, H., and Finley, J.W. (2002). Selenium-enriched broccolidecreases intestinal tumorigenesis in multiple intestinal neoplasia mice. J.Nutr. 132, 307–309.
DePrimo, S.E., Diehn, M., Nelson, J.B., Reiter, R.E., Matese, J., Fero, M.,Tibshirani, R., Brown, P.O., and Brooks, J.D. (2002). Transcriptional programsactivated by exposure of human prostate cancer cells to androgen. GenomeBiol. 3, RESEARCH0032.
DePrimo, S.E., Shinghal, R., Vidanes, G., and Brooks, J.D. (2001). Prevention ofprostate cancer. Hematol. Oncol. Clin. North Am. 15, 445–457.
Dong, Y., Ganther, H.E., Stewart, C., and Ip, C. (2002). Identification ofmolecular targets associated with selenium-induced growth inhibition inhuman breast cells using cDNA microarrays. Cancer Res. 62, 708–714.
Dong, Y., Zhang, H., Hawthorn, L., Ganther, H.E., and Ip, C. (2003). Delin-eation of the molecular basis for selenium-induced growth arrest in humanprostate cancer cells by oligonucleotide array. Cancer Res. 63, 52–59.
Duffield-Lillico, A.J., Reid, M.E., Turnbull, B.W., Combs, G.F., Jr., Slate, E.H.,Fischbach, L.A., Marshall, J.R., and Clark, L.C. (2002). Baseline characteristicsand the effect of selenium supplementation on cancer incidence in a random-ized clinical trial: a summary report of the Nutritional Prevention of CancerTrial. Cancer Epidemiol. Biomarkers Prev. 11, 630–639.
Eisen, M.B., Spellman, P.T., Brown, P.O., and Botstein, D. (1998). Clusteranalysis and display of genome-wide expression patterns. Proc. Natl. Acad.Sci. USA 95, 14863–14868.
el-Bayoumy, K. (1994). Evaluation of chemopreventive agents against breastcancer and proposed strategies for future clinical intervention trials. Carcino-genesis 15, 2395–2420.
El-Bayoumy, K. (2001). The protective role of selenium on genetic damageand on cancer. Mutat. Res. 475, 123–139.
El-Bayoumy, K., Richie, J.P., Jr., Boyiri, T., Komninou, D., Prokopczyk, B.,Trushin, N., Kleinman, W., Cox, J., Pittman, B., and Colosimo, S. (2002).Influence of selenium-enriched yeast supplementation on biomarkers of oxi-dative damage and hormone status in healthy adult males: a clinical pilotstudy. Cancer Epidemiol. Biomarkers Prev. 11, 1459–1465.
Fleming, J., Ghose, A., and Harrison, P.R. (2001). Molecular mechanisms ofcancer prevention by selenium compounds. Nutr. Cancer 40, 42–49.
Ganther, H.E. (2001). Selenium metabolism and mechanisms of cancer pre-vention. Adv. Exp. Med. Biol. 492, 119–130.
Ganther, H.E., and Lawrence, J.R. (1997). Chemical transformations of sele-nium in living organisms. Improved forms of selenium for cancer prevention.Tetrahedron 53, 12299–112310.
Gitig, D.M., and Koff, A. (2000). Cdk pathway: cyclin-dependent kinases andcyclin-dependent kinase inhibitors. Methods Mol. Biol. 142, 109–123.
Groszer, M., Erickson, R., Scripture-Adams, D.D., Lesche, R., Trumpp, A.,Zack, J.A., Kornblum, H.I., Liu, X., and Wu, H. (2001). Negative regulation ofneural stem/progenitor cell proliferation by the Pten tumor suppressor genein vivo. Science 294, 2116–2118.
Helzlsouer, K.J., Huang, H.Y., Alberg, A.J., Hoffman, S., Burke, A., Norkus,E.P., Morris, J.S., and Comstock, G.W. (2000). Association between alpha-tocopherol, gamma-tocopherol, selenium, and subsequent prostate cancer.J. Natl. Cancer Inst. 92, 2018–2023.
Hoque, A., et al. (2001). Molecular epidemiologic studies within the Seleniumand Vitamin E Cancer Prevention Trial (SELECT). Cancer Causes Control 12,627–633.
Ip, C. (1998). Lessons from basic research in selenium and cancer prevention.J. Nutr. 128, 1845–1854.
Ip, C., Hayes, C., Budnick, R.M., and Ganther, H.E. (1991). Chemical form ofselenium, critical metabolites, and cancer prevention. Cancer Res. 51, 595–600.
Ip, C., Thompson, H.J., and Ganther, H.E. (2000a). Selenium modulation ofcell proliferation and cell cycle biomarkers in normal and premalignant cellsof the rat mammary gland. Cancer Epidemiol. Biomarkers Prev. 9, 49–54.
Ip, C., Thompson, H.J., Zhu, Z., and Ganther, H.E. (2000b). In vitro and in vivostudies of methylseleninic acid: evidence that a monomethylated seleniummetabolite is critical for cancer chemoprevention. Cancer Res. 60, 2882–2886.
Ip, C., and White, G. (1987). Mammary cancer chemoprevention by inorganicand organic selenium: single agent treatment or in combination with vitaminE and their effects on in vitro immune functions. Carcinogenesis 8, 1763–1766.
Jiang, C., Wang, Z., Ganther, H., and Lu, J. (2001). Caspases as key executorsof methyl selenium-induced apoptosis (anoikis) of DU-145 prostate cancercells. Cancer Res. 61, 3062–3070.
Jones, J.O., and Arvin, A.M. (2003). Microarray analysis of host cell genetranscription in response to Varicella-Zoster virus infection of human t cellsand fibroblasts in vitro and scidhu skin xenografts in vivo. J. Virol. 77,1268–1280.
Kim, Y.S., and Milner, J. (2001). Molecular targets for selenium in cancerprevention. Nutr. Cancer 40, 50–54.
Klein, E.A., Thompson, I.M., Lippman, S.M., Goodman, P.J., Albanes, D.,Taylor, P.R., and Coltman, C. (2001). SELECT: the next prostate cancer pre-vention trial. Selenum and Vitamin E Cancer Prevention Trial. J. Urol. 166,1311–1315.
Lu, J. (2001). Apoptosis and angiogenesis in cancer prevention by selenium.Adv. Exp. Med. Biol. 492, 131–145.
Lu, J., and Jiang, C. (2001). Antiangiogenic activity of selenium in cancerchemoprevention: metabolite-specific effects. Nutr. Cancer 40, 64–73.
Lyons, A.B. (2000). Analysing cell division in vivo and in vitro using flowcytometric measurement of CFSE dye dilution. J. Immunol. Methods 243,147–154.
Medina, D., Thompson, H., Ganther, H., and Ip, C. (2001). Se-methylseleno-cysteine: a new compound for chemoprevention of breast cancer. Nutr. Can-cer 40, 12–17.
Menter, D.G., Sabichi, A.L., and Lippman, S.M. (2000). Selenium effects onprostate cell growth. Cancer Epidemiol. Biomarkers Prev. 9, 1171–1182.
Nelson, P.S., Clegg, N., Arnold, H., Ferguson, C., Bonham, M., White, J.,Hood, L., and Lin, B. (2002). The program of androgen-responsive genes inneoplastic prostate epithelium. Proc. Natl. Acad. Sci. USA 99, 11890–11895.
H. Zhao et al.
Molecular Biology of the Cell518
Nelson, W.G., De Marzo, A.M., Deweese, T.L., Lin, X., Brooks, J.D., Putzi, M.J.,Nelson, C.P., Groopman, J.D., and Kensler, T.W. (2001). Preneoplastic prostatelesions: an opportunity for prostate cancer prevention. Ann. N.Y. Acad. Sci.952, 135–144.
Nomura, A.M., Lee, J., Stemmermann, G.N., and Combs, G.F., Jr. (2000).Serum selenium and subsequent risk of prostate cancer. Cancer Epidemiol.Biomarkers Prev. 9, 883–887.
Rao, C.V., Wang, C.Q., Simi, B., Rodriguez, J.G., Cooma, I., El-Bayoumy, K.,and Reddy, B.S. (2001). Chemoprevention of colon cancer by a glutathioneconjugate of 1,4-phenylenebis(methylene)selenocyanate, a novel organosele-nium compound with low toxicity. Cancer Res. 61, 3647–3652.
Reddy, B.S., Upadhyaya, P., Simi, B., and Rao, C.V. (1994). Evaluation oforganoselenium compounds for potential chemopreventive properties in co-lon carcinogenesis. Anticancer Res. 14, 2509–2514.
Redman, C., Scott, J.A., Baines, A.T., Basye, J.L., Clark, L.C., Calley, C., Roe,D., Payne, C.M., and Nelson, M.A. (1998). Inhibitory effect of selenomethi-onine on the growth of three selected human tumor cell lines. Cancer Lett.125, 103–110.
Sherlock, G., et al. (2001). The Stanford microarray database. Nucleic AcidsRes. 29, 152–155.
Sherr, C.J., and Roberts, J.M. (1999). CDK inhibitors: positive and negativeregulators of G1-phase progression. Genes Dev. 13, 1501–1512.
Sinha, R., Unni, E., Ganther, H.E., and Medina, D. (2001). Methylseleninicacid, a potent growth inhibitor of synchronized mouse mammary epithelialtumor cells in vitro. Biochem. Pharmacol. 61, 311–317.
Venkateswaran, V., Klotz, L.H., and Fleshner, N.E. (2002). Selenium modula-tion of cell proliferation and cell cycle biomarkers in human prostate carci-noma cell lines. Cancer Res. 62, 2540–2545.
Wang, Z., Jiang, C., Ganther, H., and Lu, J. (2001). Antimitogenic and pro-apoptotic activities of methylseleninic acid in vascular endothelial cells and
associated effects on PI3K-AKT, ERK, JNK and p38 MAPK signaling. CancerRes. 61, 7171–7178.
Whitfield, M.L., et al. (2002). Identification of genes periodically expressed inthe human cell cycle and their expression in tumors. Mol. Biol. Cell 13,1977–2000.
Willett, W.C., Polk, B.F., Morris, J.S., Stampfer, M.J., Pressel, S., Rosner, B.,Taylor, J.O., Schneider, K., and Hames, C.G. (1983). Prediagnostic serumselenium and risk of cancer. Lancet 2, 130–134.
Williams, E.D., and Brooks, J.D. (2001). New molecular approaches for iden-tifying novel targets, mechanisms, and biomarkers for prostate cancer che-mopreventive agents. Urology 57, 100–102.
Xu, L.L., Su, Y.P., Labiche, R., Segawa, T., Shanmugam, N., McLeod, D.G.,Moul, J.W., and Srivastava, S. (2001). Quantitative expression profile of an-drogen-regulated genes in prostate cancer cells and identification of prostate-specific genes. Int. J. Cancer 92, 322–328.
Yoshizawa, K., Willett, W.C., Morris, S.J., Stampfer, M.J., Spiegelman, D.,Rimm, E.B., and Giovannucci, E. (1998). Study of prediagnostic selenium levelin toenails and the risk of advanced prostate cancer. J. Natl. Cancer Inst. 90,1219–1224.
Youn, B.W., Fiala, E.S., and Sohn, O.S. (2001). Mechanisms of organoseleniumcompounds in chemoprevention: effects on transcription factor-DNA binding.Nutr. Cancer 40, 28–33.
Zhang, Y., Ni, J., Messing, E.M., Chang, E., Yang, C.R., and Yeh, S. (2002).Vitamin E succinate inhibits the function of androgen receptor and the ex-pression of prostate-specific antigen in prostate cancer cells. Proc. Natl. Acad.Sci. USA 99, 7408–7413.
Zhao, H., Hastie, T., Whitfield, M.L., Borresen-Dale, A.L., and Jeffrey, S.S.(2002). Optimization and evaluation of T7 based RNA linear amplificationprotocols for cDNA microarray analysis. BMC Genomics 3, 31
Zhu, Z., Jiang, W., Ganther, H.E., and Thompson, H.J. (2002). Mechanisms ofcell cycle arrest by methylseleninic acid. Cancer Res. 62, 156–164.
Diverse Effects of MSA on Prostate Cells
Vol. 15, February 2004 519