Embed Size (px)
Citation preview

Quest Journals Journal of Research in Business and Management Volume 9 ~ Issue 5 (2021) pp: 22-36 ISSN(Online):2347-3002
www.questjournals.org
*Corresponding Author: Wawan Rustiawan 22 | Page
Research Paper
Diversification of Rubber Products as a Business Resilience
Strategy; A Conceptual Paper
Wawan Rustiawan1, Dhian Tyas Untari
2, Wastam Wahyu Hidayat
3, Tri
Widyastuti4, Sugeng Suroso
5
Student of Magister Management, Faculty of Economic and Business, Bhayangkara Jakarta Raya University,
Jakarta
ABSTRACT Rubber industry is one of the priority industries, because the huge potential of land will support the fulfillment
of the needs of rubber products industry raw materials in the long term. Implementation of product
diversification in the field of rubber products is needed because it affects the increasing number of consumers
and sales. This increase shows that consumers have been satisfied with the diversity of products offered, with
the choice of products and functions in each industry can lead to increased sales and corporate profits.
The method used is the approach (BCG) by using Microsoft Excel software. Desain includes data collection
through field observation and secondary data to related parties.
The results of the study explained that in 2020 on the analysis of product diversification there are 2 products in the quadrant position of Cow, namely motor mounting products, where in this position the product is in the
position of a strategy developed namely product development. In the Star quadrant, the strategy that can be
done is to receive a large investment to maintain and strengthen the dominant position. Furthermore, in the
Question mark position that is Wire Bush products in this position the organization must conduct intensive
strategies (market penetration, market development, or product development) or continue to sell its products.
KEYWORDS: Product Diversification, Durability, BCG Matrix
Received 25 May, 2021; Revised: 06 June, 2021; Accepted 08 June, 2021 © The author(s) 2021.
Published with open access at www.questjournals.org
I. INTRODUCTION In the 19th century, the world's rubber industry began to develop. The main motivation comes from
technological updates. In the 19th and 20th centuries, important changes occurred in the rubber industry. Wild
rubber from plantations in Brazil and Africa was replaced by rubber from Asia. Changes in natural rubber
production methods and geographic location have led to significant increases in productivity. The dramatic
increase in natural rubber has been helped not only by expanding the use of modern production technologies,
but especially through ongoing research on the maintenance of nurseries and trees dedicated to rubber
production (Ministry of Industry 2018)
Indonesia is a country with very large rubber plantations, although it was only introduced in 1864 only
about 150 years since the beginning of its development, in 2005 the area of rubber plantations in Indonesia
reached 3.2 million hectares. Northern regions of Indonesia, such as North Sumatra, South Sumatra, Riau, Jambi
and West Kalimantan. Indonesian rubber plantations are 85% owned by the people, 7% by the state and 8% by large private plantations (Ministry of Industry 2018).
The prospect of growing the rubber industry has resulted in the conversion of many commercial
plantations such as cocoa, coffee and tea to rubber plantations every year. This shift expanded the area of
Indonesian rubber plantations to 3.65 million hectares in 2015. Due to low domestic rubber consumption, up to
85% of Indonesian rubber production is exported abroad, although such as footwear, rubber gloves, rubber
threads and tires. . The export value of rubber commodities provides a large enough input for the country's
foreign exchange so that this commodity is important for Indonesia (Indonesia-investmen.com)
However, with the above achievements, compared to the potential rubber plantation areas owned by
Indonesia and other countries that are not the same size as the rubber industry, Indonesian rubber production is
still far below expectations. Indonesia's rubber production per hectare is only 1,080 kg, while Thailand's rubber

Diversification of Rubber Products as a Business Resilience Strategy; A Conceptual Paper
*Corresponding Author: Wawan Rustiawan 23 | Page
production per hectare is 1,800 kg. Even Vietnam and Malaysia have higher productivity, respectively 1,720 kg
/ ha and 1,510 kg / ha.
Thailand, Malaysia and Indonesia are the three largest rubber producers in the world, which are able to
meet more than 70% of world rubber demand. For small farmers or small farmers in Indonesia, Malaysia and
Thailand, most rubber producers asked the three countries to consider further strategies so that the value of
rubber sales would not decrease. Commodity cooperation is not new, it is very common in international
relations. Commodity cooperation is basically to strengthen the relationship between producers and producers or between producers and consumers. If they cultivate, sell and provide or receive technical assistance together, the
cooperation will be very beneficial, all of which are for the advancement of farmers.
As the second largest rubber producer in the world, Indonesia's rubber supply is very important for the
global market. Since the 1980s, the output of the Indonesian rubber industry has continued to grow. Most of the
country's rubber production (about 80%) is produced by small farmers. Therefore, the role of the government
and private plantations in the domestic rubber industry is still small.
The rubber industry is one of the priority industries, because the huge land potential will support the
long-term fulfillment of the rubber products industry's raw material needs. This is in line with the National
Industrial Development Master Plan (RIPIN) which is regulated in Law Number 3 concerning Industry 2014
and Government Regulation Number 14 concerning RIPIN 2015 2035/2015 (Source: Ministry of Industry,
2015). In early 2016, the government launched discussions and immediately issued a Joint Decree (SKB) on the regulation of natural rubber absorption. Previously, regulations were formulated in the form of instructions from
the President, but quick action was needed so that natural rubber was more absorbed by the domestic industry
and market. Therefore, the regulatory products to be issued could be in the form of decisions between the
relevant ministries and commissions. This could be in the form of a ministerial regulation.
Indonesian rubber production is quite high and deserves to be taken into account in the world market.
From year to year, Indonesian rubber production is increasing, until now Indonesia is the second largest rubber
producer after Thailand. The potential of Indonesian natural rubber forces to be developed. Natural rubber can
be processed into goods / products to support community activities. World rubber consumption is increasing
from year to year. Based on data from the IRSG (2019), rubber consumption in 2016 was 12.6 million tons,
increasing in 2017 to 13.5 million tons. The increase in rubber consumption was partly due to the growing
development of the automotive industry in various countries, especially China.
The implementation of product diversification in the rubber product sector is needed because it has an effect on increasing the number of consumers and sales. This increase shows that consumers are satisfied with
the diversity of products offered, with the choice of products and functions in each industry, which can lead to
increased sales and company profits.
We can see that today's marketing is more concerned with sales and the relationship between
companies and consumers, which can create profits for the company, and the company's business continuity can
continue to grow to achieve the goals to be achieved. Diversification strategy is one of the important factors in
running the business of a company, which certainly contributes greatly to the overall performance of the
company.
Product diversification is to diversify risk, that is, the possible loss of a certain product can be
compensated for, and can also be converted from a larger profit obtained from other products. Broadly speaking,
the formulation of a product diversification strategy has various objectives, including: 1) When the existing product market reaches maturity in the product life cycle (PLC), it will increase growth. 2) Stability is achieved
by diversifying the risk of profit fluctuation.
II. LITERATUR REVIEW Definition of Diversification
One of the earliest ideas in economic development theory is related to the degree of specialization or
diversification of a country's production and trade structure. According to (J. Paul Peter & Donnelly, 2015)
Diversification is a strategy that can enable an organization to develop into new and even unrelated businesses.
It involves finding new products (usually through acquisitions) for customers who are currently unserved. Diversification is a strategy that can lead an organization into an entirely new and even unrelated
business. This involves finding new products (often through acquisitions) for customers who are not currently
being served, according to strategist Richard Rumelt in the book (Wheelen et al., 2018). When the company's
growth has not changed and its original business growth opportunities are exhausted, the company begins to
consider diversification. This usually occurs when the industry is integrated, matures, and most of the
companies that survive have used vertical and horizontal growth strategies to reach their growth limits. Unless a
competitor can expand its business into less mature markets, if the company is to continue growing, there may
be no choice but to diversify. The two basic diversification strategies are concentric and combined, and both
require very complex management techniques to keep company elements in relatively consistent directions.

Diversification of Rubber Products as a Business Resilience Strategy; A Conceptual Paper
*Corresponding Author: Wawan Rustiawan 24 | Page
According to (Philip Kotler, Armstrong, Harris, et al., 2017) Diversification is the growth of a
company through starting or acquiring a business outside the company's products and markets. The company
must develop a strategy not only to grow its business portfolio, but also to streamline it. There are many reasons
why a company may want to leave the product or market. The company may have grown too fast or entered an
area of inexperience. This can occur when a company enters too many international markets without proper
research, or when it introduces a new product that does not offer superior customer value. The market
environment may change, making some company products or markets less profitable. For example, in difficult economic times, many firms cut through weaker and less profitable products and markets to focus the
company's more limited resources on the strongest.
Diversification strategy represents important information about the intent and quality of a company. In
particular, different product diversification strategies are driven by different factors, and have different value
propositions and performance implications (Hoskisson and Hitt in (Wang et al., 2019).
Any industry chosen for diversification must be attractive enough to generate a stable and high return
on investment and provide the potential for each business unit to achieve greater synergy than the entity itself.
Many strategists believe that the company should "stick to the weave" and not deviate from the company's basic
capabilities.
According to (Lynch, 2015) Diversification strategy occurs when an organization moves from one
dominant product or business area to another business area, which may or may not be related to its original business. According to (Lamb et al., 2018) Diversification is a strategy to increase sales by introducing new
products to new markets. Diversification strategies can be risky when companies enter foreign markets.
However, this can be very profitable when a company enters a market with little or no competition.
According to (Kerin & Hartley, 2017) Diversification is a marketing strategy to develop new products
and sell them in new markets. Companies do not only need to formulate strategies to expand their business
portfolios. The company may be growing too fast, or it may not have enough experience in the field. The market
environment can change, which can reduce the profitability of a particular company's product or market. For
example, in times of economic hardship, many companies concentrate their limited resources on the strongest
products and markets by undermining weaker and less profitable products and markets. Certain products or
business units are susceptible to aging and death. When a company discovers that a brand or business is
unprofitable or is no longer in line with its overall strategy, it must carefully prune, harvest, or let go. Weak
companies usually need undue attention from managers. Managers should focus on promising growth opportunities rather than wasting energy saving on dwindling opportunities.
According to (Armstrong, 2017) Realizing a company development diversification strategy by starting
or acquiring a business outside the company's current products and markets. And according to (Philip; Kotler et
al., 2016) Diversification is a strategy to achieve company growth by starting or buying a business outside of the
current product and market. When a company finds that its brand or business is not profitable or is no longer in
line with its overall strategy, it must trim, harvest or abandon the brand or business. Watch Out. Weak
companies usually need undue attention from managers. This is the main reason outsourcing activities require
attention but do not generate customer value and company profitability.
The same principle applies here. Managers should focus on promising growth opportunities, not waste
energy trying to save fading ones.
According to (Taneja & Joshi, 2019) The concept of diversification is increasingly important with the modern theory of portfolio management developed by the Nobel prize winner, Professor Harry Markowitz who
emphasizes that "Don't put all your eggs in the same basket" and is inspired by the modern portfolio selection
theory that assumes diversification as a means. to reduce a country's dependence on certain products or a very
limited number of primary products which are generally exported before processing.
According to (Hitt et al., 2017) Product diversification is a major form of corporate strategy, which
involves the market and the scope of the industry in which firms compete, and "how managers buy, create and
sell different businesses to match skills and profits with opportunities offered to the company "
Diversification Analysis
According to (Kerin& Hartley, 2017) Diversification analysis is a technique that helps companies seek
growth opportunities from between current and new markets and current and new products. For any market, there are current products (what the company is selling now) and new products (what the company might sell in
the future). And for any product, there is a current market (an existing company customer) and a new market (a
company's potential customer). The very purpose of the product diversification strategy is to minimize a risk.
According to Tjiptono in (Hardjono&Utari, 2016) in general, a diversification strategy was developed with
various objectives including increasing product life cycle (PLC) growth, maintaining stability by spreading
profit fluctuations and increasing credibility in the capital market.
Diversification of Rubber Products as a Business Resilience Strategy; A Conceptual Paper
*Corresponding Author: Wawan Rustiawan 25 | Page
According to FandyTjiptono in (Hardjono & Utari, 2016), there are several benefits of a diversification strategy,
namely:
1. Companies can deploy full capacity because they are not dependent on one product.
2. Maximizing profit by expanding the company.
3. New discoveries that benefit potential customers.
4. The company does not depend on just one market.
Definition of Products
According to (Kerin& Hartley, 2017) Products are a type of commodity, service or idea, consisting of a
set of tangible and intangible attributes that meet consumer needs, and can be obtained by exchanging money or
other valuables. Products can be classified based on buyer's intention. Consumer products are items that are
purchased for personal satisfaction and family needs. Business products are purchased for use in company
operations, for resale, or for making other products. Consumer products can be further divided into convenience,
shopping, specialties, and non-purchased products. A product item is a version of a specific product that can be
defined as different offerings among the organization's products. A product line is a group of closely related product items that are considered units for marketing, technical, or end use considerations. The aggregate, or
total, group of products the organization provides to customers is called the product mix. The product mix width
is measured by the number of product lines the company offers. Product mix depth is the average number of
different products offered in each product line.
According to (Pride & Ferrell, 2016) "A product is a commodity, service or idea obtained through
exchange. It can be tangible or intangible, including functional, social and psychological uses or benefits. A
product is a service, service, or idea that is received. This can be tangible or intangible and includes utility,
functional, social, and psychological benefits. The definition includes tangible products (canned roasted beans,
airplane engines), intangible products (such as hairdressing services or management consulting), and ideas (such
as public health information).
Meanwhile, according to (Svend Hollensen, 2015) Products are the object of the exchange process,
goods offered by producers or suppliers to potential customers in exchange for something else that the supplier considers to be equal or of greater value. Usually, this other thing is money. In the absence of money, we have
to engage in bartering or counter-trading, in which commodities are exchanged for other commodities.
Therefore, to be able to exchange it, a person must have a demand for the goods concerned and be willing to
exchange money or other assets that are considered valuable. Two very important ideas are introduced when
discussing demand preferences and alternative capabilities. Preference determines the level of consumer
preference for a product, and substitution capacity reflects the extent to which one product can replace another
product. The latter qualification is very important to marketers because it is similar to a brand switch.
According to (J. Paul Peter & Donnelly, 2015) Every product that can meet needs and can provide
market attention, is obtained, used or consumed, the product is strong and has wide variations. The product
provided has three interdependent elements: a core product, additional functionality, and a symbolic or
experiential benefit. The core product consists of the basic uses or the main advantages of the product, and usually can meet the basic needs of consumers. However, most consumers like other features and services.
Apart from core uses or product advantages, other functions also provide added value or attributes. Other
product features usually include special benefits such as free installation, warranty, product information, repair
or maintenance promises, shipping, training or finance.
According to (Philip Kotler, Armstrong, Ang, et al., 2017) Products are anything that can be offered to
the market to get attention, acquisition, use, or consumption that can satisfy wants or needs. Products include not
only physical objects, but also services, events, people, places, organizations, ideas or a combination of these
entities. Services are basically intangible products consisting of sales, benefits provided or satisfaction, such as
banking services, hotels, tax preparation and home decoration. The product is more than a real set of functions.
Each product or service provided to customers can be viewed from three levels. Core customer values
encompass the core interests that consumers seek to solve problems when buying products.
Products are the physical, psychological and social satisfaction that buyers derive from purchasing, ownership and consumption, and products are key elements of products across markets. Marketing mix planning
begins with manufactured products that provide value to target customers. This product forms the basis for the
company to build profitable customer relationships. A company's market quotes usually include tangible goods
and services. In extreme cases, market products may contain items that are purely tangible, such as soap,
toothpaste or salt; There are no support services for this product.
According to (Lamb et al., 2018) A product is everything a person obtains in exchange, whether it is
favorable or unfavorable. Products are everything, both profitable and unfavorable, that a person receives in
exchange. High quality product refers to a product that makes customer satisfaction with the product exceed
their expectations, and this product makes people want to buy the product even more. According to (Perreault et
Diversification of Rubber Products as a Business Resilience Strategy; A Conceptual Paper
*Corresponding Author: Wawan Rustiawan 26 | Page
al., 2017) Product means the need-satisfying offering of a firm. A product means an offer that satisfies the needs
of a company. The product idea as a potential customer satisfaction or benefit is very important. Many business
managers are involved in the technical details involved in producing a product. But most customers think of a
product in terms of the total satisfaction it provides. That satisfaction may require a "total" product offering that
is truly a combination of excellent service, physical goods along with the right features, helpful instructions, a
convenient package, a trustworthy warranty, and perhaps even a familiar name that satisfies consumers. . in the
past. From the various opinions which the experts above can synthesize, the definition of a product is a
finished product that is able to offer functions that consumers consider useful or satisfying so that companies are
ready to exchange money, or other units of value to get it.
Business Resilience Strategy
According to Umar in (Arta & Hamsal, 1387) Strategy is a gradual (continuous improvement) and
continuous operation, which is carried out based on the customer's view of future expectations.The world of
business is constantly changing, and organizations that manage to manage change effectively can continue to
adapt their bureaucracy, strategy, and organizational culture to these changes, so that companies can withstand
the impact and succeed against the deadly forces of their competitors.
According to Haryadi in (Nurbaiti & Gunawan, 2015) Business strategy is defined as a method used by companies to compete, including achievement, achievement, and maintaining a competitive advantage in the
industry. Business strategy is very important in an organization or company, because without a clear strategy a
company or industry cannot compete with other companies or industries. Therefore, companies are required to
carry out careful calculations in choosing the business strategy to be implemented, because this also makes an
important contribution to improving company performance.
Companies that want to survive must be able to develop business strategies that are in line with market
developments in their environment. In this case the company must continue to excel and foster an innovative
culture by continuing to build lines of communication and complement each other. In this case, the company
must find a strategy for improvement, development and enhancement of innovation as well as new strategic
dynamics in the company's business (Dewi Faeni, 2015).
In essence, the company must have reliable abilities from both managers and employees in order to
complement and cover up the weaknesses of each party. In the long run, customers and markets need higher value and greater profits from the products produced by the company. If the company players are able to meet
these expectations, the company can dominate the fundamental business arena. In essence, corporate actors need
to foster a culture of innovation in business conditions, product innovation and foster value and benefits for both
new and existing customers. At the initial level, company players can produce products at lower prices and also
make offers with values and profits that are higher than the price offered. In essence, companies need to
differentiate between prices and costs so that they can build a customer base that believes products are made by
qualified employees.
Strategy formulation is the same as formulating a vision and mission, breaking down opportunities and
external threats facing the company, understanding the internal strengths and weaknesses of the company,
formulating long-term goals, looking for alternative strategies, and choosing certain strategies to achieve goals.
The strategy formulation framework is divided into three (three). The stages are: the input stage, the matching stage and the decision-making stage. In a decision phase involving only one technology, the matrix uses input
information from stage 1 to objectively evaluate the alternative strategies identified in stage 2. The matching
phase focuses on creating alternative strategies that make sense for a variety of factors. -Main external and
internal factors. The input phase contains the basic input information needed to formulate a strategy. The
matching phase focuses on creating a wise alternative strategy by considering the main external and internal
factors. 3) The decision-making phase involves only one technology, namely the Quantitative Strategic Planning
Matrix (QSPM), which shows the relative attractiveness of various strategy alternatives. This provides an
objective basis for choosing alternative strategies (Fitrio, 2019).
III. RESEARCH METHOD
In the data analysis will be described how to process data, presentation of data and statistical analysis.
The data analysis used is by Matrix BCG method.
In performing data processing and data analysis, researchers used SPSS program version 17.00. SPSS
is used to make it easier to process data, so that the results are fast and precise.
Boston Consulting Group (BCG) analysis method is a method of drafting a strategic business unit plan
by classifying the company's profit potential (Kotler, Putra, 2014). The BCG matrix contains 4 quadrants. This
quadrant describes the location of business units based on market growth and market share. The four quadrants
or categories are:

Diversification of Rubber Products as a Business Resilience Strategy; A Conceptual Paper
*Corresponding Author: Wawan Rustiawan 27 | Page
1. Dogs have a low market share and low growth rate, so it will not make or consume much money. These
departments usually "break even" and make small amounts of money to maintain business market share. In the
dog position, the market share of this product is low and the market conditions are growing slightly. This
position requires investment, because due to weak internal and external positions, human resources and finances
are very low, so businesses are usually liquidated, divested or laid off. When a department becomes a dog,
dismissal is probably the best strategy that can be done, because after cutting costs and assets drastically, many
dogs return and become a viable and profitable business.
2. Question Mark This category has a relatively low market share, but competes in a fast-growing
industry. Usually these companies have high cash requirements and low cash income. This business is called a
question mark because organizations have to decide whether to reinforce these differences by implementing
intensification strategies or selling them. This business unit requires a lot of capital to retain its share, let alone
add it. Management should seriously think about which question marks are trying to be stars and which ones should be thrown away.
3. Star (Stat) This category provides long-term growth and the best profit opportunities for organizations.
Sectors with relatively higher market share and higher levels of industrial growth should receive substantial
investment to maintain and consolidate their dominant positions. This category is the market leader, but that
doesn't mean it will provide positive cash flow for the company, as it has to spend a lot of money to win the
market and anticipate competitors.
4. Cash Cow/Dairy Cows This category has a relatively high market share, but competes in slow-growing
industries. They are called dairy cows because they make more money than they need, so they are often milked.
It has a relatively high market share but competes in slow-growing industries. Since many of today's dairy cows
are past stars, it is necessary to strive to maintain the status of the dairy sector for as long as possible. This well-
known and successful SBU requires a small investment to maintain its market share. This SBU generates large amounts of funds, which companies use to pay bills and support other SBU that need to invest.
The relative market share position is placed on the X axis in the BCG matrix. The Y axis is used for the growth
rate of industrial sellers. The numbers on the X and Y axes above are often used, but for certain companies in
certain conditions and situations the figures can be changed according to needs, for example due to changes in
industry standards or changes in the economic situation.

Diversification of Rubber Products as a Business Resilience Strategy; A Conceptual Paper
*Corresponding Author: Wawan Rustiawan 28 | Page
information:
a. The vertical axis (market growth rate) indicates the annual growth rate at which products or services
are sold.
b. The horizontal axis (market share relative) represents the market share of SBU (Strategic Business
Units) relative to the larger part of the competitor market.
IV. ANALYSIS AND DISCUSSION
The calculation of pt Fitria Jaya Lestari's market share analysis is measured by comparing the sales
volume of rubber products at PT Fitria Jaya Lestari with its competitors, pt BSQ and PT YKT. The data used to
calculate the market share is the data on the sales volume of PT Fitria Jaya Lestari products in 2020 and the
sales volume of competitor clothing products in 2019. Market share data of PT Fitria Jaya Lestari and PT BSQ
and PT YKT companies are presented in the following table:
Table 4.1 Market Share of PT Fitria Jaya Lestari
2018 Market Share 2019 Market Share 2020 Market Share
PT, BSQ 7,200,000,000 20.9% 7,200,000,000 23.2% 6,500,000,000 24.3%
PT, YKT 24,000,000,000 69.6% 21,000,000,000 67.7% 18,000,000,000 67.4%
PT, Fitria 3,296,564,515 9.6% 2,800,522,850.00 9.0% 2,202,058,025 8.2%
Perusahaan
Tahun
Source : Data processed, 2020
Based on the results of the data analysis in the table above shows that the market share of PT Fitria
Jaya Lestari in 2020 is very low at 8.2%. The low market share in rubber products companies is thought to be
due to the increasing number of competitors who offer cheaper prices and quality compared to PT Fitria Jaya
Lestari products. The condition is feared to jeopardize the company's growth over the next few years. In contrast
to the higher market share conditions of PT YKT and PT BSQ when compared to PT Fitria Jaya Lestari which is
67% and 24% in 2020 and in 2020 there is also a corona pandemic that affects the rubber industry sector where many partner companies working with rubber sector companies are experiencing the impact of decreasing
rubber goods production orders. The distribution of market share of both companies for each year can be seen in
the following explanation:
a. Market share of PT Fitria Jaya Lestari and its competitors in 2018
The market share of PT Fitria Jaya Lestari and its competitors in 2018 is presented in the following figure.
Source : Data processed, 2020
Figure 4.2 Market Share of PT Fitria Jaya Lestari and its competitors in 2018
If seen in the picture above, it can be known that the market share of PT Fitria Jaya Lestari in 2018 is lower
(9%) compared to its competitor PT YKT (70%) and PT BSQ (21%).
b. Market share of PT Fitria Jaya Lestari and its competitors in 2019
Diversification of Rubber Products as a Business Resilience Strategy; A Conceptual Paper
*Corresponding Author: Wawan Rustiawan 29 | Page
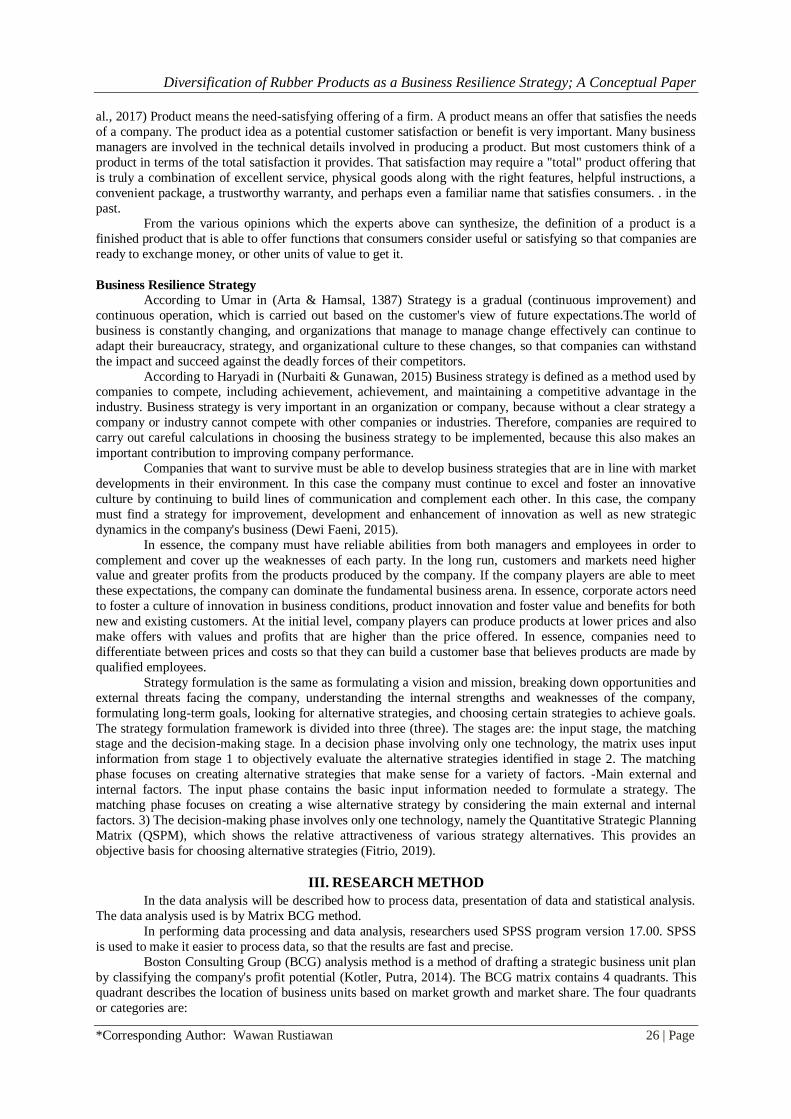
The market share of PT Fitria Jaya Lestari and its competitors in 2019 is presented in the following figure.
Source : Data processed, 2020
Figure 4.3 Market Share of PT Fitria Jaya Lestari and its competitors in 2019
The results of the above market share analysis show that PT Fitria Jaya Lestari has an unsustainable market
share that tends to have no significant movement, from 2018 to 2019 of 9%. While the market share of PT YKT
and PT BSQ has a fairly high market share of 68% and 23%. c. Market share of PT Fitria Jaya Lestari and its competitors in 2020
Here is the market share of PT Fitria Jaya Lestari and its competitors in 2016, where:
Source : Data processed, 2020
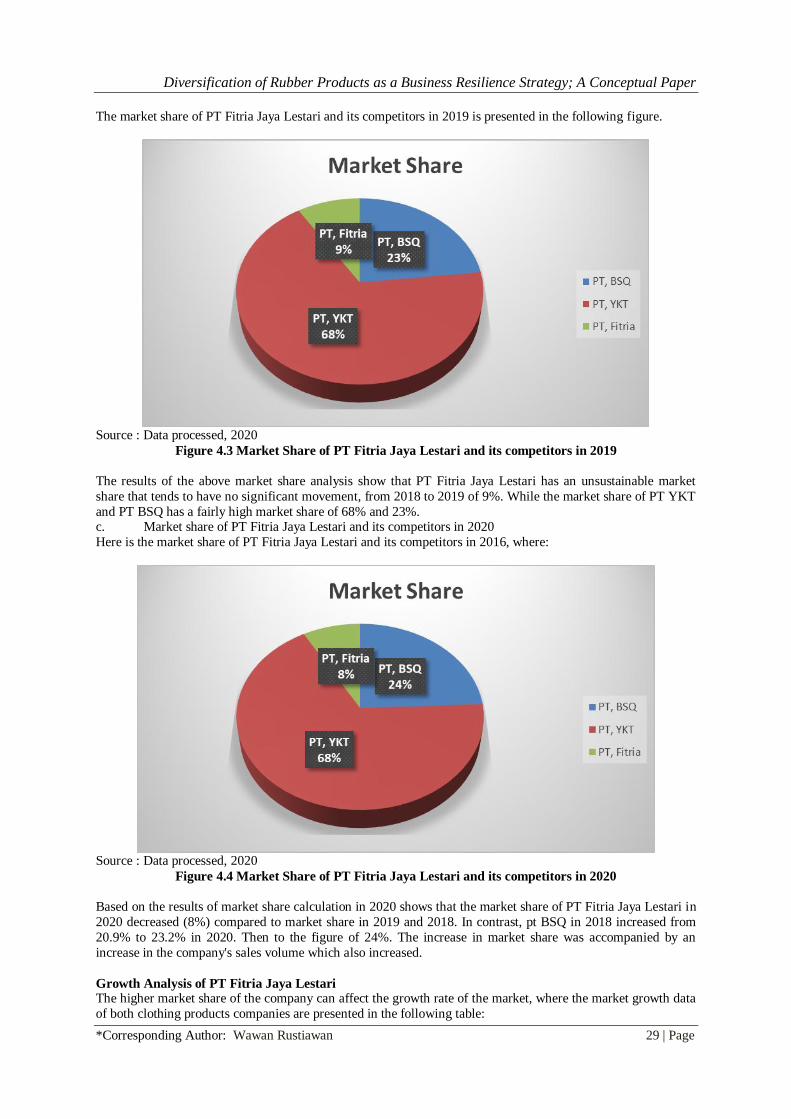
Figure 4.4 Market Share of PT Fitria Jaya Lestari and its competitors in 2020
Based on the results of market share calculation in 2020 shows that the market share of PT Fitria Jaya Lestari in
2020 decreased (8%) compared to market share in 2019 and 2018. In contrast, pt BSQ in 2018 increased from
20.9% to 23.2% in 2020. Then to the figure of 24%. The increase in market share was accompanied by an
increase in the company's sales volume which also increased.
Growth Analysis of PT Fitria Jaya Lestari The higher market share of the company can affect the growth rate of the market, where the market growth data
of both clothing products companies are presented in the following table:

Diversification of Rubber Products as a Business Resilience Strategy; A Conceptual Paper
*Corresponding Author: Wawan Rustiawan 30 | Page
Table 4.2 Market Growth of PT Fitria Jaya Lestari
2019 Pertumbuhan Pasar 2020 Pertumbuhan Pasar
PT, BSQ -496,041,665 0.0% -598,464,825 -9.7%
PT, YKT -3,000,000,000 -12.5% -3,000,000,000 -14.3%
PT, Fitria -496041665.00 -15.0% -598,464,825 -21.4%
Perusahaan
Source : Data processed, 2020
In more detail, the amount of market growth of both companies for each year is described as follows.
a. Market growth of PT Fitria Jaya Lestari and its competitors in 2019
Here is the market growth of PT Fitria Jaya Lestari and its competitors in 2019.
Source : Data processed, 2020
Figure 4.5 Market Growth of PT Fitria Jaya Lestari and its competitors in 2019
The above market growth analysis shows that PT Fitria Jaya Lestari experienced market growth of 0% while its
competitors PT YKT and PT BSQ also did not experience market growth from PT Fitria Jaya Lestari of -15%
and -12.5%. b. Market growth of PT Fitria Jaya Lestari and its competitors in 2020
The results of market growth analysis from PT Fitria Jaya Lestari and its competitor companies in 2020 are
presented in the following figure.

Diversification of Rubber Products as a Business Resilience Strategy; A Conceptual Paper
*Corresponding Author: Wawan Rustiawan 31 | Page
Source : Data processed, 2020
Figure 4.6 Market Growth of PT Fitria Jaya Lestari and its competitors in 2020
Figure 4.6 above shows that PT Fitria Jaya Lestari has experienced a decrease in market growth in 2020 of -
21%. The magnitude of the decline in market growth is thought to be caused by the impact of pandemics and
diversification of products that have not entered the market when the coronavirus outbreak and caused sales can
not run well. Furthermore, for the market growth of competitor companies, namely PT YKT and PT BSQ, the
company decreased to -14% and 9.7% in 2020.
Table 4.3 Growth Data of PT Fitria Jaya Lestari
year MARKET SHARE RELATIVE MARKET MARKET GROWTH Revenue
2019 9.0% 0.13 -15.0% 2,800,522,850
2020 8.2% 0.12 -21.4% 2,202,058,025
Based on market share data and market growth of PT Fitria Jaya Lestari and PT YKT can be known the position
of the company is seen from BCG Matrix below.
Source : Data processed, 2020
Figure 4.7 Matrix BCG Relative Market PT Fitria Jaya Lestari in 2020
Diversification of Rubber Products as a Business Resilience Strategy; A Conceptual Paper
*Corresponding Author: Wawan Rustiawan 32 | Page
PT Fitria Jaya Lestari's position in 2019 is in the Cash Cow position with a market share of 9% is quite
high, growth is also relatively very low at -15% but in 2020 there is a quadrant shift that is shifting to the
quadrant of dogs in Matrix BCG has been proven by a very low market share in 2020 of 8.2% and growth that is
also relatively very low by -21.4%. This condition causes PT Fitria Jaya Lestari to carry out an excellent
strategy to save the company by minimizing weaknesses and threats by utilizing the company's strengths and
opportunities.
4.1 Matrix BCG PT Fitria Jaya Lestari In Product Diversification
Based on the BCG matrix of PT Fitria Jaya Lestari in 2019 and 2020, the following BCG matrix can be created:
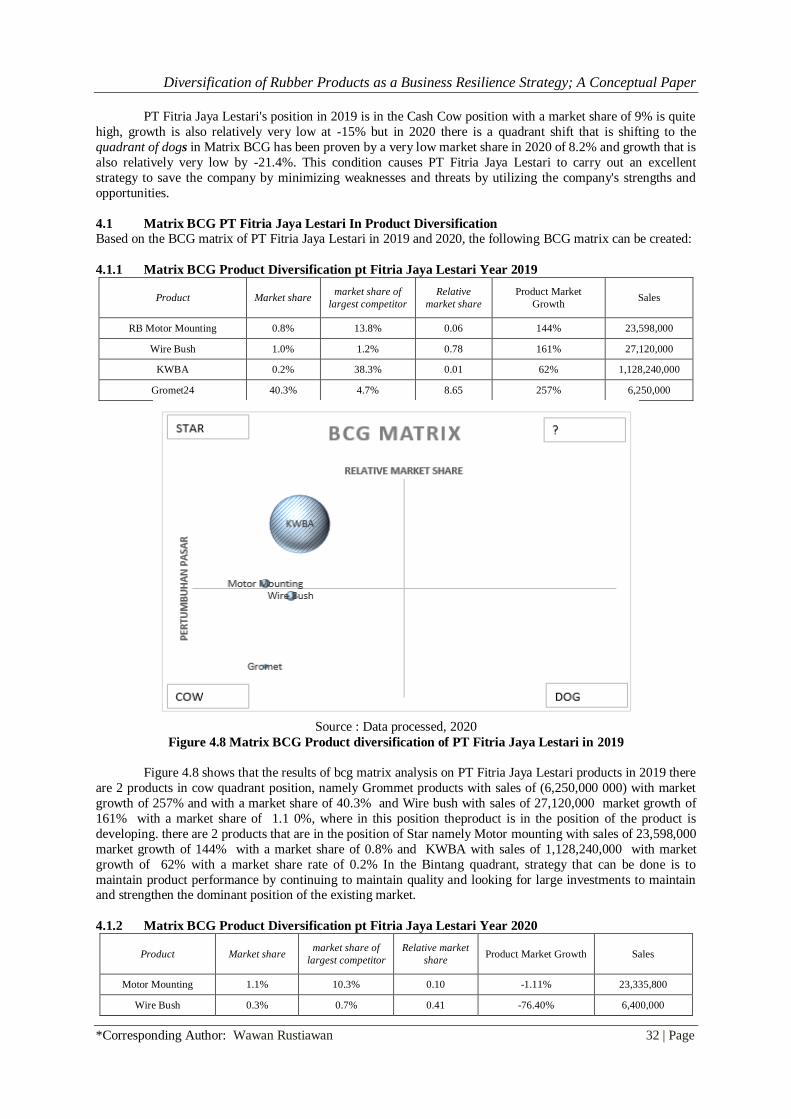
4.1.1 Matrix BCG Product Diversification pt Fitria Jaya Lestari Year 2019
Product Market share market share of
largest competitor
Relative
market share
Product Market
Growth Sales
RB Motor Mounting 0.8% 13.8% 0.06 144% 23,598,000
Wire Bush 1.0% 1.2% 0.78 161% 27,120,000
KWBA 0.2% 38.3% 0.01 62% 1,128,240,000
Gromet24 40.3% 4.7% 8.65 257% 6,250,000
Source : Data processed, 2020
Figure 4.8 Matrix BCG Product diversification of PT Fitria Jaya Lestari in 2019
Figure 4.8 shows that the results of bcg matrix analysis on PT Fitria Jaya Lestari products in 2019 there
are 2 products in cow quadrant position, namely Grommet products with sales of (6,250,000 000) with market
growth of 257% and with a market share of 40.3% and Wire bush with sales of 27,120,000 market growth of
161% with a market share of 1.1 0%, where in this position theproduct is in the position of the product is
developing. there are 2 products that are in the position of Star namely Motor mounting with sales of 23,598,000
market growth of 144% with a market share of 0.8% and KWBA with sales of 1,128,240,000 with market
growth of 62% with a market share rate of 0.2% In the Bintang quadrant, strategy that can be done is to
maintain product performance by continuing to maintain quality and looking for large investments to maintain and strengthen the dominant position of the existing market.
4.1.2 Matrix BCG Product Diversification pt Fitria Jaya Lestari Year 2020
Product Market share market share of
largest competitor
Relative market
share Product Market Growth Sales
Motor Mounting 1.1% 10.3% 0.10 -1.11% 23,335,800
Wire Bush 0.3% 0.7% 0.41 -76.40% 6,400,000

Diversification of Rubber Products as a Business Resilience Strategy; A Conceptual Paper
*Corresponding Author: Wawan Rustiawan 33 | Page
KWBA 0.2% 34.4% 0.01 -97.10% 32,763,625
Gromet 1.5% 9.3% 0.16 -16.00% 5,250,000
Source : Data processed, 2020
Source : Data processed, 2020
Figure 4.9 Matrix BCG Product diversification of PT Fitria Jaya Lestari in 2020
Figure 4.9 shows that the results of bcg matrix analysis on PT Fitria Jaya Lestari products in 2020 there
have been several changes in position due to economic factors in 2020 is a very difficult year in which in 2020
there is a coronavirus pandemic in which all sectors of the industry are affected as a result of many products in
reduced demand, the change results in a decrease in sales and there are 2 products in the cow quadrant position
that is motor mounting products with sales of (23,335,800) with market growth-1.11% and with a market share
of 1.1% and grommet with sales (5,250,000) market growth of-16% with a market share of 1.5% , where in this position the product is in a developed strategy position that is product development. there is 1 product that is in
star position namely KWBA with sales (32,763,625) with market growth that decreased by -97% with a market
share rate of 0.2% In the Bintang quadrant , the strategy that can be done is to receive a large investment to
maintain and strengthen the dominant position. Furthermore, the Question mark position is Wire Bush products
with sales (27,120,000) with market growth that decreased by -76.4% with a market share rate of 0.3% in this
position the organization must carry out intensive strategies (market penetration, market development, or
product development) or continue to sell its products.
V. DISCUSSION The results of this study, if viewed as a whole, show that the condition of products processed with BCG
Matrix can be known some conditions of the position of the product to be maintained or continued to be
produced.
The quadrant position of PT Fitria Jaya Lestari based on the calculation on the basis of market growth
rate and market share of PT Fitria Jaya Lestari's business using Boston Consulting Group (BCG) matrix, the
quadrant position obtained in the BCG (Boston Consulting Group) matrix in 2020 is in the dog quadrant which
means that PT Fitria Jaya Lestari has a relatively low market share of 8.2%.
Furthermore, the results of the analysis of bcg product diversification matrix at PT Fitria Jaya Lestari in
2020 there have been several changes in position because economic factors in 2020 is a very difficult year
where in 2020 there is a coronavirus pandemic in which all industry sectors are affected as a result of many
products in reduced demand, the change results in a decrease in sales and there are 2 products in cow quadrant position that is motor mounting products with sales of (23,335,800) with market growth-1.11% and with a
market share of 1.1% and grommet with sales (5,250,000) market growth of -16% with a market share of 1.5% ,
where in this position the product is in a position of developed strategy that is product development. there is 1
product that is in star position namely KWBA with sales (32,763,625) with market growth that decreased by -
97% with a market share rate of 0.2% In the Bintang quadrant, the strategy that can be done is to receive a large
investment to maintain and strengthen the dominant position. Furthermore, the Question mark position is Wire
Bush products with sales (27,120,000) with market growth that decreased by -76.4% with a market share rate of
0.3% in this position the organization must carry out intensive strategies (market penetration, market
development, or product development) or continue to sell its products.

Diversification of Rubber Products as a Business Resilience Strategy; A Conceptual Paper
*Corresponding Author: Wawan Rustiawan 34 | Page
Based on the results of the quarant processed, PT Fitria Jaya Lestari must adopt a defensive or survival
strategy in becoming a company that has a resilient resilience in the face of rubber industry competition, and
save the company's position by using its own funds to meet the needs of infrastructure (such as machines used)
so that the production process is not limited. The output can be increased in a shorter time. Adding more modern
machines can increase PT Fitria Jaya Lestari's revenue and increase its ability to compete with competitors.
PT Fitria Jaya Lestari's next strategy in realizing cash cow is to implement a new policy related to
recruitment of workers whose requirements are in accordance with the field of work pursued, starting with educated qualifications, skills and experience of prospective employees, so as to have resources. . Quality, high-
performance human resources. The existence of quality human resources will affect the performance and
production of employees, the higher the quality of human resources, it is expected that the company's revenue
will increase.
The strategy for PT Fitria Jaya Lestari to be a question mark is to position the company by cooperating
with suppliers of raw materials products that still pay attention to the quality and price of raw materials, so that
there are no excessive costs. In addition, question marks can also be achieved by expanding the scope of product
distribution, while putting product quality first.
Then to get a star position, PT Fitria Jaya Lestari can implement marketing strategies by creating a
more quality product design according to the needs of consumers. PT Fitria Jaya Lestari can penetrate the
marketing market of its products through advertising on social media and various communication media. This is because the sector has a relatively high market share and a high rate of industrial growth. The strategy
formulated is; integration of forward, backward and horizontal; market penetration; market development;
product development; and joint ventures. This position provides the best long-term growth and profit
opportunities for the organization
This strategy is in accordance with the research (Putra, 2014) The strategy that can be taken is to maintain the
position of the star. Variables that affect the growth of public poly visitors include:
1. Product Quality. Increase innovation and maintain product quality, so that the market response to the
product is getting better.
2. Quality of service. Improving quality of service from various sides to provide comfort for buyers both
for service at the time of purchase and after-sales service.
3. Marketing Communication Improves marketing communication so that the brand image or brand
image of the product remains embedded in the consumer's mind. 4. Distribution Network Expands the distribution network.
This is in line with Rufaidah's view in (Sulasih, 2020) that the alternative strategy that the company can
use in business resilience is if the company is in one of Matrix's positions at Boston Consulting Group (BCG)
then the company's strategy that can be adopted is: if the company is in a star position then the company's
strategy is integration. Backward, forward, and horizontal integration. If the company is a star then the strategy
applied by the company is backward integration, forward integration and horizontal integration. If the company
is in the quadrant of the money tree, the company can use product development strategies, diversification, depreciation or divestment.
VI. CONCLUSION Based on the results of observation and analysis of the data described in chapter four, the author can give the
following conclusions:
1. PT Fitria Jaya Lestari has experienced a decrease in market growth in 2020 of -21%. The magnitude of
the decline in market growth is thought to be caused by the impact of pandemics and diversification of products
that have not entered the market when the coronavirus outbreak and caused sales can not run well.
2. In 2019 posisi company is in the quadrant of Cash Cow position with a fairly high market share of 9%, growth is also relatively very low which is decreasing by -15% but in 2020 there is a quadrant shift that is
shifting to the quadrant of dogsin matrix BCG has been proven by a very low market share in 2020 which is
8.2% and experienced an increasingly significant decrease of -21.4%.
2) In 2020 in the product diversification analysis there are 2 products in cow quadrant position, namely
motor mounting products with sales of (23,335,800) marketgrowth-1.11% and with a market share of 1.1% and
grommet with sales (5,250,000) market growth-16% with a market share of 1.5% , where in this position the
product is in the position of the developed strategy that is the productdevelopment. there is 1 product that is in
the position of Star kwba with sales (32,763,625) with market growth that decreased by -97% with a market
share rate of 0.2% In the Bintang quadrant, the strategy that can be done is to receive a large investment to
maintain and strengthen the dominant position. Furthermore, the Question mark position is Wire Bush products
with sales (27,120,000) with market growth that decreased by -76.4% with a market share rate of 0.3% in this
Diversification of Rubber Products as a Business Resilience Strategy; A Conceptual Paper
*Corresponding Author: Wawan Rustiawan 35 | Page
position the organization must carry out intensive strategies (market penetration,market development, orproduct
development) or continue to sell its products.
Suggestion
Based on the conclusions of the results of the study can be put forward several suggestions, as follows:
1. Alternative business strategy of PT Fitria Jaya Lestari really minimizes the weaknesses and threats that exist by utilizing and maximizing the strengths and opportunities that have, can meet the needs of the market,
while maintaining the quality of products.
2. It is expected that PT Fitria Jaya Lestari on motor mounting products plans and implements a new
product diversification build strategy on mounting engines to further increase the sales volume of products can
compete with competitor companies in the market share.
3. It is expected that PT Fitria Jaya Lestari on grommet products in the position of cow maintain product quality continuously and conduct QC checks with good standards
4. It is expected that PT Fitria Jaya Lestari on KWBA products maintains the market and increases sales
and is looking for new consumers to mercovery product sales growth.
5. It is expected that PT Fitria Jaya Lestari on Wire bush products is establishing cooperation on the
provider of raw materials products that still pay attention to the quality and price of raw materials so that the
costs incurred are also not too bloated
REFERENCESS [1]. Ali, S., Haider Hashmi, S., & Mehmood, T. (2016). Corporate Diversification And Firm Performance: An Inverted U-Shaped
Hypothesis. International Journal Of Organizational Leadership, 5(4), 393–410.
[2]. Armstrong, G. (2017). Marketing : An Introduction. In Pearson Canada: Vol. №3.
[3]. Arora, A. K., & Raju, M. S. S. (2015). The Effect Of Product Diversification On The Adoption And Implementation Of Activity
Based Costing. Ojas, 8–10.
[4]. Arta, A., & Hamsal, M. (1387). Analisis Penetapan Strategi Bisnis Dan Posisi Persaingan Pt. Wom Finance Jakarta . 8(1), 97–121.
[5]. Bilgili, B., Özkul, E., & Candan, B. (2016). An Outlook On “All Inclusive” System As A Product Diversification Strategy In Terms
Of Consumer Attitudes. Procedia - Social And Behavioral Sciences, 235(October), 493–504.
[6]. Creswell, J. W., & Creswell, J. D. (2018). Research Design : Qualitative, Quantitative, And Mixed Methods Approaches. Sage.
[7]. Dewi Faeni. (2015). Karakteristik Manajer, Pembaruan Sdm, Strategi Pemasaran, Motivasi Bermitra, Orientasi Kerja, Standarisasi
Kerja, Terhadap Ketahanan Bisnis Ukm Dalam Persaingan Usaha: Study Ukm Di Jakarta Indonesia.Jurnal Ekonomika Dan
Manajemen, 4(1), 1689–1699.
[8]. Fitrio, T. (2019). Strategi Bisnis Rumah Bolu Za Rengat. Media Mahardhika, 17(2), 360.
[9]. Gozgor, G., & Can, M. (2017). Export Product Diversification And The Environmental Kuznets Curve : Evidence From Turkey.
Environmental Science And Pollution Research, 78410.
[10]. Hardjono, & Utari, R. A. (2016). Pengaruh Strategi Diversifikasi Dan Diferensiasi Produk Terhadap Loyalitas Konsumen Pada
Kedai Pissbroo Di Kabupaten Situbondo.
[11]. Hilman, H. (2015). Significance Of Studying Product Diversification, Geographic Diversification, And Their Interaction Impacts
For Malaysian Companies: A Literature Review. Asian Social Science, 11(10), 238–250.
[12]. Hitt, M. A., Ireland, R. D., & Hoskisson, R. E. (2017). Strategic Management Competitiveness & Globalization Concepts And
Cases. In Cengage Learning (12th Ed., Vol. 143, Issue 1878). Cengage.
[13]. Hu, G., Can, M., Paramati, S. R., Doğan, B., & Fang, J. (2020). The Effect Of Import Product Diversification On Carbon
Emissions: New Evidence For Sustainable Economic Policies. Economic Analysis And Policy, 65(January), 198–210.
[14]. J. Paul Peter, & Donnelly, J. H. (2015). A Preface To Marketing Management. In Mcgraw-Hill Education (4th Ed.).
[15]. Karthik, D., George, R., & Singla, C. (2015). International Diversification And Firm Performance : The Contingent Influence Of
Product Diversification. Indian Institute Of Management.
[16]. Kerin, R. A., & Hartley, S. W. (2017). Marketing (13th Ed.). Mcgraw-Hill Education.
[17]. Kotler, Philip;, Armstrong, G., & Parment, A. (2016). Principles Of Marketing. In Pearson Education (2nd Ed.).
[18]. Kotler, Philip, Armstrong, G., Ang, S. H., Tan, C. T., Yau, O. H.-M., & Leong, S. M. (2017). Principles Of Marketing ( An Asian
Perspective ). In Efikasi Diri Dan Pemahaman Konsep Ipa Dengan Hasil Belajar Ilmu Pengetahuan Alam Siswa Sekolah Dasar
Negeri Kota Bengkulu (16th Ed., Vol. 6). Pearson Eduication.
[19]. Kotler, Philip, Armstrong, G., Harris, L. C., & Piercy, N. (2017). Principles Of Marketing. In Pearson Education Limited (16th Ed.,
Vol. 53, Issue 9).
[20]. Lamb, C. W., Hair, J. F., & Mcdaniel, C. (2018). Mktg11. Cengage Learning.
[21]. Leza, T., Rajan, S., & Kuma, B. (2016). Determinants Of Product Diversification Among Micro And Small Enterprises In Wolaita
Zone, Ethiopia: An Econometric Analysis. 16(4).
[22]. Lynch, R. (2015). Strategic Management (7th Ed., Issue January). Pearson.
[23]. Miyanoshita, T., & Kanama, D. (2017). Internationalization Strategies And Product Diversification In The Japanese Food Industry.
5, 506–516.
[24]. Munyiri, M. W., Kariuki, D. P., & Opiyo, M. O. (2016). Influence Of Financial Policy On Financial Performance Of Commercial
Banks Listed In Nairobi Securities Exchange,Kenya. The Strategic Journal Of Business & Change Management, 5(2), 1592–1614.
[25]. Nurbaiti, A., & Gunawan, B. (2015). Pengaruh Kepemilikan Keluarga Terhadap Kinerja Perusahaan: Strategi Bisnis Sebagai
Variabel Pemoderasi. 1–10.
[26]. Oh, C. H., Sohl, T., & Rugman, A. M. (2015). Regional And Product Diversification And The Performance Of Retail
Multinationals. Journal Of International Management, 21(3), 220–234.
[27]. Overchenko, N. (2019). Impact Of Corporate Diversification On Company Performance And Risk. Instituto Politécnico De
Bragança.
[28]. Perreault, W. D., Cannon, J. P., & Mccarthy, E. J. (2017). Essentials Of Marketing: A Marketing Strategy Planning Approach (12th

Diversification of Rubber Products as a Business Resilience Strategy; A Conceptual Paper
*Corresponding Author: Wawan Rustiawan 36 | Page
Ed.). Mcgraw-Hill Education.
[29]. Prada, P. G., Rodriguez, M. J. D., & Jordán, D. R. (2017). A Deeper Look Into The Geographic And Product Diversification-
Performance Relationship.November.
[30]. Pride, W. M., & Ferrell, O. C. (2016). Marketing (18th Ed.). Cengage Learning.
[31]. Puente Riofrio, M., & Andrade Dominguez, F. (2016). Relación Entre La Diversificación De Productos Y La Rentabilidad
Empresarial / Relationship Between Product Diversification And Corporate Profitability. Revista Ciencia Unemi, 9(18), 73.
[32]. Putra, Y. S. (2014). Analisis Matriks Boston Consulting Grup ( Bcg ) Pada Sepeda Motor Merek Honda (Studi Kasus Pada Pt. Astra
Honda Motor Tahun 2013). Among Makarti, 2(1), 1–22.
[33]. Shi, B., Baranoff, E., & Sager, T. (2016). Product Diversification In Health Insurance With Comprehensive Coverage Benefits U.S.
Health Insurers. Journal Of International & Interdisciplinary Business Research, 3(1), 14.
[34]. Srinivasan, S., Thenmozhi, M., & Vijayaraghavan, P. (2016). Product Diversification Deciphered. Global Business And
Management Research: An International Journal, 8, 16–19.
[35]. Sun, W., & Govind, R. (2017). Geographic Diversification , Product Diversification , And Firm Cash Flow Volatility : The
Moderating Effect Of Firm Dynamic Capability. Journal Of Strategic Marketing, 4488(February), 1–22.
[36]. Svend Hollensen. (2015). Marketing Management : A Relationship Approach. In Pearson Education Limited (3rd Ed.).
[37]. Taneja, R., & Joshi, R. M. (2019). An Enquiry Into India’s Export Market And Product Diversification. Indianjournals.
[38]. Tang, C., Tang, Y., & Su, S. (2019). R&D Internationalization, Product Diversification And International Performance For
Emerging Market Enterprises: An Empirical Study On Chinese Enterprises. European Management Journal, 37(4), 529–539.
[39]. Villagra, E. S., Easdale, M. H., Giraudo, C. G., & Bonvissuto, G. L. (2015). Productive And Income Contributions Of Sheep, Goat,
And Cattle, And Different Diversification Schemes In Smallholder Production Systems Of Northern Patagonia, Argentina. Springer
Science Business Media Dordrecht, 47(7), 1373–1380.
[40]. Wang, X. A., Wan, W. P., & Yiu, D. W. (2019). Product Diversification Strategy, Business Group Affiliation, And Ipo
Underpricing: A Study Of Chinese Firms. Strategic Entrepreneurship Journal, 13(2), 179–198.
[41]. Wheelen, T. L., Hunger, J. D., Hoffman, A. N., & Bamford, C. E. (2018). Strategic Management And Business Policy. In Journal
Of The Operational Research Society (15th Ed., Vol. 41, Issue 1). Https://Doi.Org/10.1057/Jors.1990.13