Embed Size (px)
Citation preview
www.scholarsresearchlibrary.comt Available online a
Scholars Research Library
Annals of Biological Research, 2014, 5 (11):20-31 (http://scholarsresearchlibrary.com/archive.html)
ISSN 0976-1233 CODEN (USA): ABRNBW
20 Scholars Research Library
Diversity analysis of indica rice accessions (Oryza sativa L.) using morphological and SSR markers
Israt Nadia1, A.K.M. Mohiuddin 1*, Shahanaz Sultana2 and Jannatul Ferdous2
1Department of Biotechnology and Genetic Engineering, Mawlana Bhashani Science and
Technology University, Tangail-1902, Bangladesh 2Biotechnology Division, Bangladesh Rice Research Institute, Gazipur, Bangladesh
_____________________________________________________________________________________________ ABSTRACT
Morphological and molecular characterization of twenty six landraces rice and four high yielding rice accessions were studied to observe genetic diversity assessment and identification of superior genotypes for crop improvement program. Fourteen morphological and twenty seven DNA based molecular markers, simple sequence repeat (SSR), were used extensively to carry out this study. A wide range of morphological diversity was found among the rice accessions tested and it was grouped into 4 clusters based on morphological markers using Unweighted Pair Group Method with Arithmetic Means (UPGMA) cluster tree analysis at a cut-off similarity coefficient 0.98%. Landraces accession, Kaliboro, found significantly different in number total tiller, number effective tiller, and panicle length. On the other hand, high yielding rice varieties showed maximum number spikelet per spike in BR 11 and number grain filled in BRRI Dhan 34. Khirshapati, Tulshimala, Katijul and BR11 showed significant different in two or more morphological traits. Genetic diversity was also assessed using a set of 27 SSR markers which generated 321 polymorphic alleles. Polymorphism information content (PIC) values ranged between 0.6806 (RM 11) and 0.9416 (RM 474) with an average of 0.8414. Dendrogram was constructed based on the Nei’s genetic distance calculated from 27 SSR markers generated from the 30 rice accessions. Genetic similarity analysis using UPGMA, all 30 accessions were grouped into 6 clusters based on SSR markers’ data at a cut-off similarity coefficient 0.17%. This morphological and SSR marker based genetical diversity analysis could be useful for cultivar/accessions/ genotype identification and parental selection for breeding program. Keywords: Diversity, morphology, rice, SSR, UPGM, dendrogram, breeding program Abbreviations: SSR-simple sequence repeat, UPGMA- unweighted pair group method with arithmetic means, PIC-polymorphism information content, BRRI-Bangladesh Rice Research Institute _____________________________________________________________________________________________
INTRODUCTION
Rice (Oryza sativa L.) is believed to have evolved around 130 million years ago [1]. It is the seed of the monocot plants, have two domesticated species: Oryza sativa, the most common, grown throughout Asia, Australia, the Americas and Africa; and Oryza glaberrima, grown on a small scale in western Africa. As a cereal grain, it is the most widely consumed staple food for more than half of the world population and is one of the most important food crops grown worldwide [2]. It is the grain with the second-highest worldwide production, after maize (corn) [3]. It is also grown over 10.37 million hectares under the diverse eco-systems subject to irrigated, rainfed, aerobic and deep water conditions in three distinct seasons [4]. Rice is becoming more and more important to feed the ever increasing world population necessitating continued improvement in terms of yield, grain quality and stress resistance. Continuous study on genetic diversity is very
A.K.M. Mohiuddin et al Annals of Biological Research, 2014, 5 (11):20-31 ______________________________________________________________________________
21 Scholars Research Library
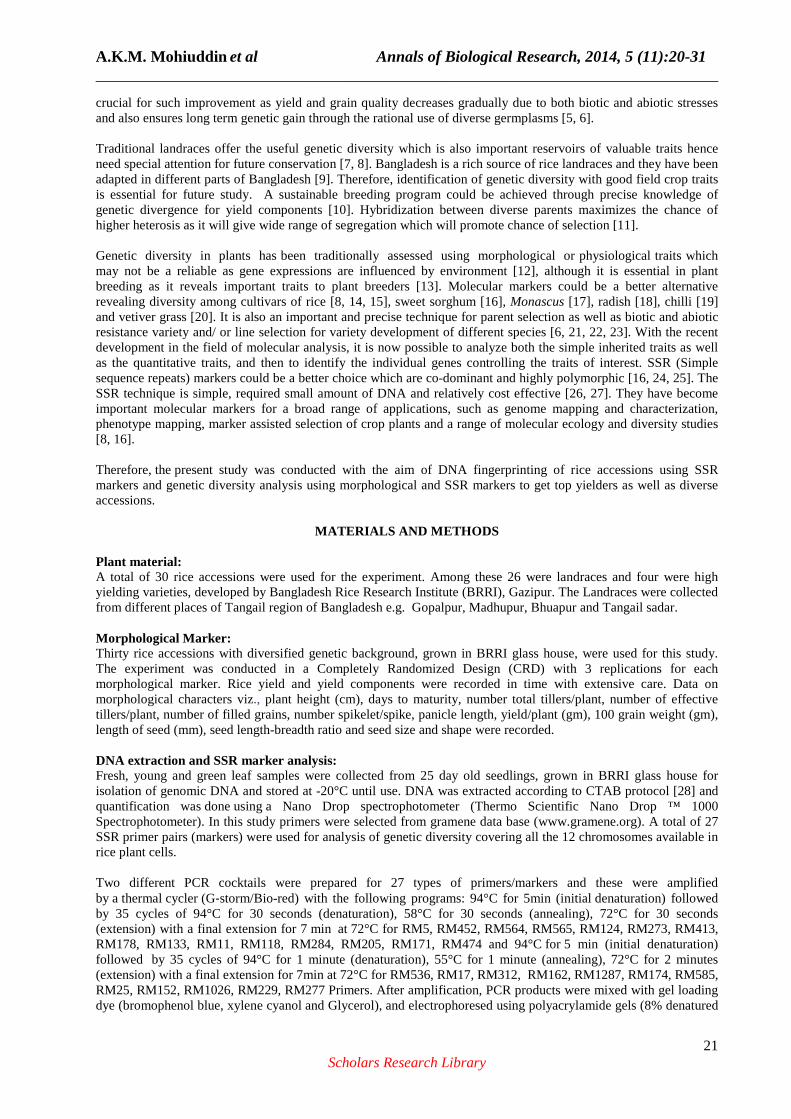
crucial for such improvement as yield and grain quality decreases gradually due to both biotic and abiotic stresses and also ensures long term genetic gain through the rational use of diverse germplasms [5, 6]. Traditional landraces offer the useful genetic diversity which is also important reservoirs of valuable traits hence need special attention for future conservation [7, 8]. Bangladesh is a rich source of rice landraces and they have been adapted in different parts of Bangladesh [9]. Therefore, identification of genetic diversity with good field crop traits is essential for future study. A sustainable breeding program could be achieved through precise knowledge of genetic divergence for yield components [10]. Hybridization between diverse parents maximizes the chance of higher heterosis as it will give wide range of segregation which will promote chance of selection [11]. Genetic diversity in plants has been traditionally assessed using morphological or physiological traits which may not be a reliable as gene expressions are influenced by environment [12], although it is essential in plant breeding as it reveals important traits to plant breeders [13]. Molecular markers could be a better alternative revealing diversity among cultivars of rice [8, 14, 15], sweet sorghum [16], Monascus [17], radish [18], chilli [19] and vetiver grass [20]. It is also an important and precise technique for parent selection as well as biotic and abiotic resistance variety and/ or line selection for variety development of different species [6, 21, 22, 23]. With the recent development in the field of molecular analysis, it is now possible to analyze both the simple inherited traits as well as the quantitative traits, and then to identify the individual genes controlling the traits of interest. SSR (Simple sequence repeats) markers could be a better choice which are co-dominant and highly polymorphic [16, 24, 25]. The SSR technique is simple, required small amount of DNA and relatively cost effective [26, 27]. They have become important molecular markers for a broad range of applications, such as genome mapping and characterization, phenotype mapping, marker assisted selection of crop plants and a range of molecular ecology and diversity studies [8, 16]. Therefore, the present study was conducted with the aim of DNA fingerprinting of rice accessions using SSR markers and genetic diversity analysis using morphological and SSR markers to get top yielders as well as diverse accessions.
MATERIALS AND METHODS
Plant material: A total of 30 rice accessions were used for the experiment. Among these 26 were landraces and four were high yielding varieties, developed by Bangladesh Rice Research Institute (BRRI), Gazipur. The Landraces were collected from different places of Tangail region of Bangladesh e.g. Gopalpur, Madhupur, Bhuapur and Tangail sadar. Morphological Marker: Thirty rice accessions with diversified genetic background, grown in BRRI glass house, were used for this study. The experiment was conducted in a Completely Randomized Design (CRD) with 3 replications for each morphological marker. Rice yield and yield components were recorded in time with extensive care. Data on morphological characters viz., plant height (cm), days to maturity, number total tillers/plant, number of effective tillers/plant, number of filled grains, number spikelet/spike, panicle length, yield/plant (gm), 100 grain weight (gm), length of seed (mm), seed length-breadth ratio and seed size and shape were recorded. DNA extraction and SSR marker analysis: Fresh, young and green leaf samples were collected from 25 day old seedlings, grown in BRRI glass house for isolation of genomic DNA and stored at -20°C until use. DNA was extracted according to CTAB protocol [28] and quantification was done using a Nano Drop spectrophotometer (Thermo Scientific Nano Drop ™ 1000 Spectrophotometer). In this study primers were selected from gramene data base (www.gramene.org). A total of 27 SSR primer pairs (markers) were used for analysis of genetic diversity covering all the 12 chromosomes available in rice plant cells. Two different PCR cocktails were prepared for 27 types of primers/markers and these were amplified by a thermal cycler (G‐storm/Bio-red) with the following programs: 94°C for 5min (initial denaturation) followed by 35 cycles of 94°C for 30 seconds (denaturation), 58°C for 30 seconds (annealing), 72°C for 30 seconds (extension) with a final extension for 7 min at 72°C for RM5, RM452, RM564, RM565, RM124, RM273, RM413, RM178, RM133, RM11, RM118, RM284, RM205, RM171, RM474 and 94°C for 5 min (initial denaturation) followed by 35 cycles of 94°C for 1 minute (denaturation), 55°C for 1 minute (annealing), 72°C for 2 minutes (extension) with a final extension for 7min at 72°C for RM536, RM17, RM312, RM162, RM1287, RM174, RM585, RM25, RM152, RM1026, RM229, RM277 Primers. After amplification, PCR products were mixed with gel loading dye (bromophenol blue, xylene cyanol and Glycerol), and electrophoresed using polyacrylamide gels (8% denatured
A.K.M. Mohiuddin et al Annals of Biological Research, 2014, 5 (11):20-31 ______________________________________________________________________________
22 Scholars Research Library
poly‐acrylamide) for manual genotyping. 5µl of the amplification products were resolved by running the gel in 1×TBE buffer for 1 to 2 hrs (depending on the allele size) at around 90 volts. The gels were stained in ethidium bromide and documented using ultraviolet light box (Alfa-imager) of gel documentation unit. Band scoring: The image of gel was saved as JPEG format and imported to Alpha-Ease FC 5.0 software (Alpha Innotech, USA). The allele size was measured compared to DNA ladder. The absent and present of bands were scored in a binary model with 0 and 1, respectively. The clear and reproducible bands those are >50 bp were used for band scoring. Data analysis: Morphological marker The analysis of variance (ANOVA) was done using PROC ANOVA of the Statistical Analysis System (SAS 9.1) for all morphological quantitative characters. The t-test was performed for mean comparison when accession differences were significant. Relationship of 30 accessions was analyzed based on Euclidean coefficient by NTSYS-PC software, Version 2.1a [29]. This similarity matrix was used to generate a dendrogram using the Unweighted Pair Group Method with Arithmetic Means (UPGMA) method of SHAN. Molecular markers Data from the primers were analyzed to obtain the information on genetic diversity of the rice accessions. The summary statistics including the number of alleles per locus, major allele frequency, gene diversity, Polymorphism Information Content (PIC) values were determined using Power Marker V3.25 [30]. The allele frequency data from Power Marker Version-3.25 was used to export the data in binary format (allele presence =1 and allele absence =0) for further analysis with NTSYS-PC Version 2.5 [29]. NTSYS-PC data were further used to construct a UPGMA (unweighted pair group method with arithmetic means) dendrogram showing the distance-based interrelationship among the accessions by using the software TREEVIEW. The genetic distance value obtained based on Nei (1972) [31] procedure was computed using the formula as describe in the POPGENE (version-1.31) software user manual.
RESULTS
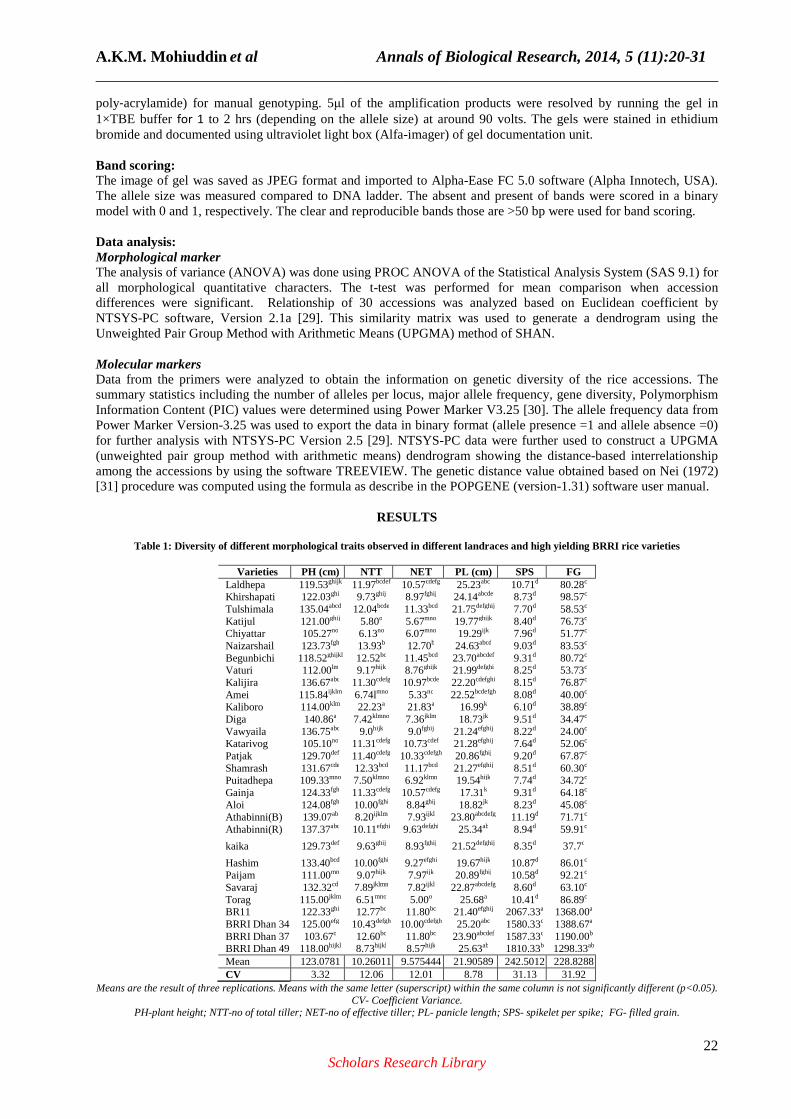
Table 1: Diversity of different morphological traits observed in different landraces and high yielding BRRI rice varieties
Varieties PH (cm) NTT NET PL (cm) SPS FG Laldhepa 119.53ghijk 11.97bcdef 10.57cdefg 25.23abc 10.71d 80.28c Khirshapati 122.03ghi 9.73ghij 8.97fghij 24.14abcde 8.73d 98.57c Tulshimala 135.04abcd 12.04bcde 11.33bcd 21.75defghij 7.70d 58.53c Katijul 121.00ghij 5.80o 5.67mno 19.77ghijk 8.40d 76.73c Chiyattar 105.27no 6.13no 6.07mno 19.29ijk 7.96d 51.77c Naizarshail 123.73fgh 13.93b 12.70b 24.63abcd 9.03d 83.53c Begunbichi 118.52ghijkl 12.52bc 11.45bcd 23.70abcdef 9.31d 80.72c Vaturi 112.00lm 9.17hijk 8.76ghijk 21.99defghi 8.25d 53.73c Kalijira 136.67abc 11.30cdefg 10.97bcde 22.20cdefghi 8.15d 76.87c Amei 115.84ijklm 6.74lmno 5.33no 22.52bcdefgh 8.08d 40.00c Kaliboro 114.00klm 22.23a 21.83a 16.99k 6.10d 38.89c Diga 140.86a 7.42klmno 7.36jklm 18.73jk 9.51d 34.47c Vawyaila 136.75abc 9.0hijk 9.0fghij 21.24efghij 8.22d 24.00c Katarivog 105.10no 11.31cdefg 10.73cdef 21.28efghij 7.64d 52.06c Patjak 129.70def 11.40cdefg 10.33cdefgh 20.86fghij 9.20d 67.87c Shamrash 131.67cde 12.33bcd 11.17bcd 21.27efghij 8.51d 60.30c Puitadhepa 109.33mno 7.50klmno 6.92klmn 19.54hijk 7.74d 34.72c Gainja 124.33fgh 11.33cdefg 10.57cdefg 17.31k 9.31d 64.18c Aloi 124.08fgh 10.00fghi 8.84ghij 18.82jk 8.23d 45.08c Athabinni(B) 139.07ab 8.20ijklm 7.93ijkl 23.80abcdefg 11.19d 71.71c Athabinni(R) 137.37abc 10.11efghi 9.63defghi 25.34ab 8.94d 59.91c
kaika 129.73def 9.63ghij 8.93fghij 21.52defghij 8.35d 37.7c
Hashim 133.40bcd 10.00fghi 9.27efghi 19.67hijk 10.87d 86.01c Paijam 111.00mn 9.07hijk 7.97ijk 20.89fghij 10.58d 92.21c Savaraj 132.32cd 7.89jklmn 7.82ijkl 22.87abcdefg 8.60d 63.10c Torag 115.00jklm 6.51mno 5.00o 25.68a 10.41d 86.89c BR11 122.33ghi 12.77bc 11.80bc 21.40efghij 2067.33a 1368.00a BRRI Dhan 34 125.00efg 10.43defgh 10.00cdefgh 25.20abc 1580.33c 1388.67a BRRI Dhan 37 103.67o 12.60bc 11.80bc 23.90abcdef 1587.33c 1190.00b BRRI Dhan 49 118.00hijkl 8.73hijkl 8.57hijk 25.63ab 1810.33b 1298.33ab Mean 123.0781 10.26011 9.575444 21.90589 242.5012 228.8288 CV 3.32 12.06 12.01 8.78 31.13 31.92
Means are the result of three replications. Means with the same letter (superscript) within the same column is not significantly different (p<0.05). CV- Coefficient Variance.
PH-plant height; NTT-no of total tiller; NET-no of effective tiller; PL- panicle length; SPS- spikelet per spike; FG- filled grain.

A.K.M. Mohiuddin et al Annals of Biological Research, 2014, 5 (11):20-31 ______________________________________________________________________________
23 Scholars Research Library
Diversity Analysis by Morphological markers: Morphological traits of each accession were measured on five randomly chosen plants in each replication. A wide range of morphological diversity in fourteen different traits was found significant in the rice accessions, both landraces and high yielding varieties (Table 1). The plant height (PH) varied significantly from 103.67 cm (BRRI Dhan 37) to 140.86cm (Diga) and panicle length (PL) ranged from 16.99 cm in Kaliboro to 25.68 cm in Torag found significantly different. On the other hand, maximum number of total tiller (NTT) in Kaliboro (22.23) found significantly different in Katijul with minimum number (5.80). Significant number of effective tiller (NET) found in Kaliboro (21.83) maximum compare to Torag (5.0) accession (Table 1). Two most important morphological traits, spikelet per spike (SPS) and filled grain (FG), on the other hand, significantly observed maximum in two high yielding rice varieties e.g. BR 11 and BRRI Dhan 34 and minimum in landraces rice accessions e.g. Kaliboro and Vawyaila, respectively (Table 1). Another important morphological trait e.g. hundred grain weight (HGW) significantly observed lowest in Khirshapati (0.83gm) and highest in Katijul (2.67gm) (Table 2). Both seed length and seed length-breadth ration also observed lowest in landrace accession, e.g. Tulshimala and highest in Athabinni (B). On the other hand, yield per plant, an important quantitative trait found maximum in BRRI Dhan 34 and minimum in Vawyaila. Maturity date found higher in high yielding rice variety, e.g. BR11, however, lower in Khirshapati (Table 2). Six different types of grain size and shape were found in diversity analysis study of 30 rice accessions (Table 2). Medium-medium seed size and shape found in maximum number of rice accession (thirteen) including BR11 and BRRI Dhan 49. On the other hand, short-medium found in eleven including two high yielding rice accessions e.g. BRRI Dhan 34 and BRRI Dhan 37. Short-slender and short-bold shape and size observed in two accessions each. Katarivog and Athabinni (B) landraces showed medium-slender and long-slender shape and size, respectively (Table 2).
Table 2: Diversity of different morphological traits observed in different landraces and high yielding BRRI rice varieties
Varieties HGW (gm) YPP (gm) SL (cm) LBR MD (days) SS and S Laldhepa 2.50ab 16.65bc 5.66bcd 5.99bcd 120 MM Khirshapati 0.83n 5.34jklmn 4.42klm 4.42klm 109 SM Tulshimala 0.96mn 4.55lmn 4.11m 4.11m 116 SM Katijul 2.67a 11.40defg 6.24b 6.24a 114 MM Chiyattar 2.04efg 6.64ijklmn 5.56defg 5.56defg 110 MM Naizarshail 1.63jk 12.98cd 5.58defg 5.58defg 122 MM Begunbichi 0.96mn 7.11hijklmn 4.40klm 4.40klm 122 SM Vaturi 2.54ab 9.23defghi 5.59defg 5.59defg 113 MM Kalijira 0.90mn 7.24hijklmn 4.24m 4.24m 114 SM Amei 1.86ghi 4.35mn 4.38lm 4.38lm 112 SS Kaliboro 1.93fghi 9.06efghij 5.19fghij 5.19fghij 113 SM Diga 2.11def 5.12klmn 5.60defg 5.60defg 115 MM Vawyaila 1.83hi 3.40n 5.32efghi 5.32efghi 115 SM Katarivog 1.75ij 7.34hijklm 6.13bc 6.13bc 122 MS Patjak 2.17de 10.60defgh 5.57defg 5.57defg 115 MM Shamrash 2.07def 11.84def 5.50defgh 5.50defgh 122 SM Puitadhepa 2.10def 4.46lmn 5.68cdef 5.68cdef 122 MM Ganja 1.61jk 8.09fghijklm 5.67cdef 5.67cdef 121 MM Aloi 2.03efgh 6.63ijklmn 5.61defg 5.61defg 127 MM Athabinni(B) 2.27cd 8.94efghijk 6.80a 6.80abcde 119 LS Athabinni(R) 1.80ij 7.13hijklmn 4.89kij 4.89ijk 127 SS Kaika 2.44bc 9.76defghi 5.78bcde 5.78bcde 126 MM Hashim 1.54kl 8.31fghijkl 5.02hij 5.02hij 124 SM Paijam 1.48kl 9.68dehghi 5.48efgh 5.48efgh 123 SM Shavaraj 2.39bc 12.56de 5.14ghij 5.14ghij 116 SB Torag 2.07def 7.54ghijklm 4.80jkl 4.80jkl 113 SB BR11 2.38bc 11.81def 5.75bcde 5.75bcde 142.67 MM BRRI Dhan34 1.08m 21.63a 4.49klm 4.49klm 136.33 SM BRRI Dhan37 1.39l 19.32ab 5.49defgh 5.49defgh 120 SM BRRI Dhan49 1.79ij 19.38ab 5.69cdef 5.69cdef 142 MM Mean 1.840911 9.602889 5.336822 2.590574 CV 6.55 24.71 5.81 35.03
Means are the result of three replications. Means with the same letter (superscript) within the same column is not significantly different (p<0.05). CV- Coefficient Variance
HGW- hundred grain weight; YPP-yield per plant; SL- seed length; LBR-length breadth ratio; MD- maturity date; SS and S- seed size and shape.
Clustering of Genotypes using UPGMA methods: Cluster analysis, based on fourteen morphological traits found in 30 rice accessions, revealed a dendrogram obtained through UPGMA cluster tree analysis. It led to the grouping of the 30 rice accessions into four major clusters at a
A.K.M. Mohiuddin et al Annals of Biological Research, 2014, 5 (11):20-31 ______________________________________________________________________________
24 Scholars Research Library
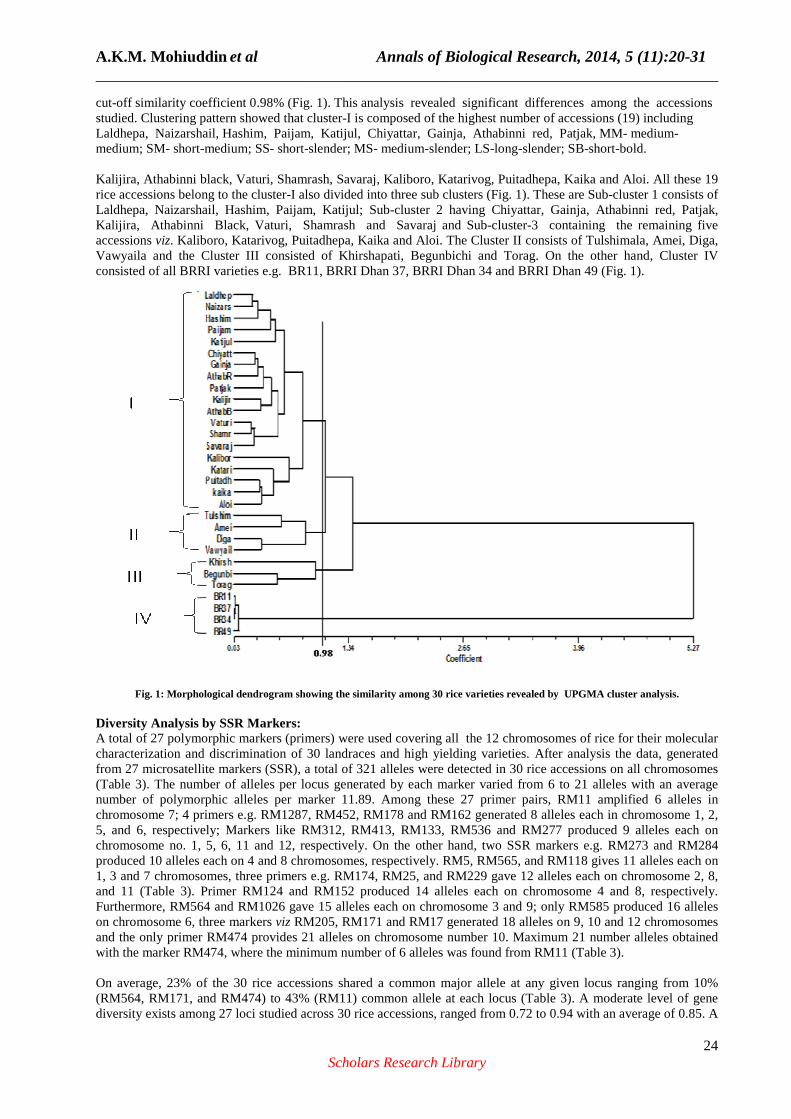
cut-off similarity coefficient 0.98% (Fig. 1). This analysis revealed significant differences among the accessions studied. Clustering pattern showed that cluster-I is composed of the highest number of accessions (19) including Laldhepa, Naizarshail, Hashim, Paijam, Katijul, Chiyattar, Gainja, Athabinni red, Patjak, MM- medium-medium; SM- short-medium; SS- short-slender; MS- medium-slender; LS-long-slender; SB-short-bold. Kalijira, Athabinni black, Vaturi, Shamrash, Savaraj, Kaliboro, Katarivog, Puitadhepa, Kaika and Aloi. All these 19 rice accessions belong to the cluster-I also divided into three sub clusters (Fig. 1). These are Sub-cluster 1 consists of Laldhepa, Naizarshail, Hashim, Paijam, Katijul; Sub-cluster 2 having Chiyattar, Gainja, Athabinni red, Patjak, Kalijira, Athabinni Black, Vaturi, Shamrash and Savaraj and Sub-cluster-3 containing the remaining five accessions viz. Kaliboro, Katarivog, Puitadhepa, Kaika and Aloi. The Cluster II consists of Tulshimala, Amei, Diga, Vawyaila and the Cluster III consisted of Khirshapati, Begunbichi and Torag. On the other hand, Cluster IV consisted of all BRRI varieties e.g. BR11, BRRI Dhan 37, BRRI Dhan 34 and BRRI Dhan 49 (Fig. 1).
Fig. 1: Morphological dendrogram showing the similarity among 30 rice varieties revealed by UPGMA cluster analysis. Diversity Analysis by SSR Markers: A total of 27 polymorphic markers (primers) were used covering all the 12 chromosomes of rice for their molecular characterization and discrimination of 30 landraces and high yielding varieties. After analysis the data, generated from 27 microsatellite markers (SSR), a total of 321 alleles were detected in 30 rice accessions on all chromosomes (Table 3). The number of alleles per locus generated by each marker varied from 6 to 21 alleles with an average number of polymorphic alleles per marker 11.89. Among these 27 primer pairs, RM11 amplified 6 alleles in chromosome 7; 4 primers e.g. RM1287, RM452, RM178 and RM162 generated 8 alleles each in chromosome 1, 2, 5, and 6, respectively; Markers like RM312, RM413, RM133, RM536 and RM277 produced 9 alleles each on chromosome no. 1, 5, 6, 11 and 12, respectively. On the other hand, two SSR markers e.g. RM273 and RM284 produced 10 alleles each on 4 and 8 chromosomes, respectively. RM5, RM565, and RM118 gives 11 alleles each on 1, 3 and 7 chromosomes, three primers e.g. RM174, RM25, and RM229 gave 12 alleles each on chromosome 2, 8, and 11 (Table 3). Primer RM124 and RM152 produced 14 alleles each on chromosome 4 and 8, respectively. Furthermore, RM564 and RM1026 gave 15 alleles each on chromosome 3 and 9; only RM585 produced 16 alleles on chromosome 6, three markers viz RM205, RM171 and RM17 generated 18 alleles on 9, 10 and 12 chromosomes and the only primer RM474 provides 21 alleles on chromosome number 10. Maximum 21 number alleles obtained with the marker RM474, where the minimum number of 6 alleles was found from RM11 (Table 3). On average, 23% of the 30 rice accessions shared a common major allele at any given locus ranging from 10% (RM564, RM171, and RM474) to 43% (RM11) common allele at each locus (Table 3). A moderate level of gene diversity exists among 27 loci studied across 30 rice accessions, ranged from 0.72 to 0.94 with an average of 0.85. A
A.K.M. Mohiuddin et al Annals of Biological Research, 2014, 5 (11):20-31 ______________________________________________________________________________
25 Scholars Research Library
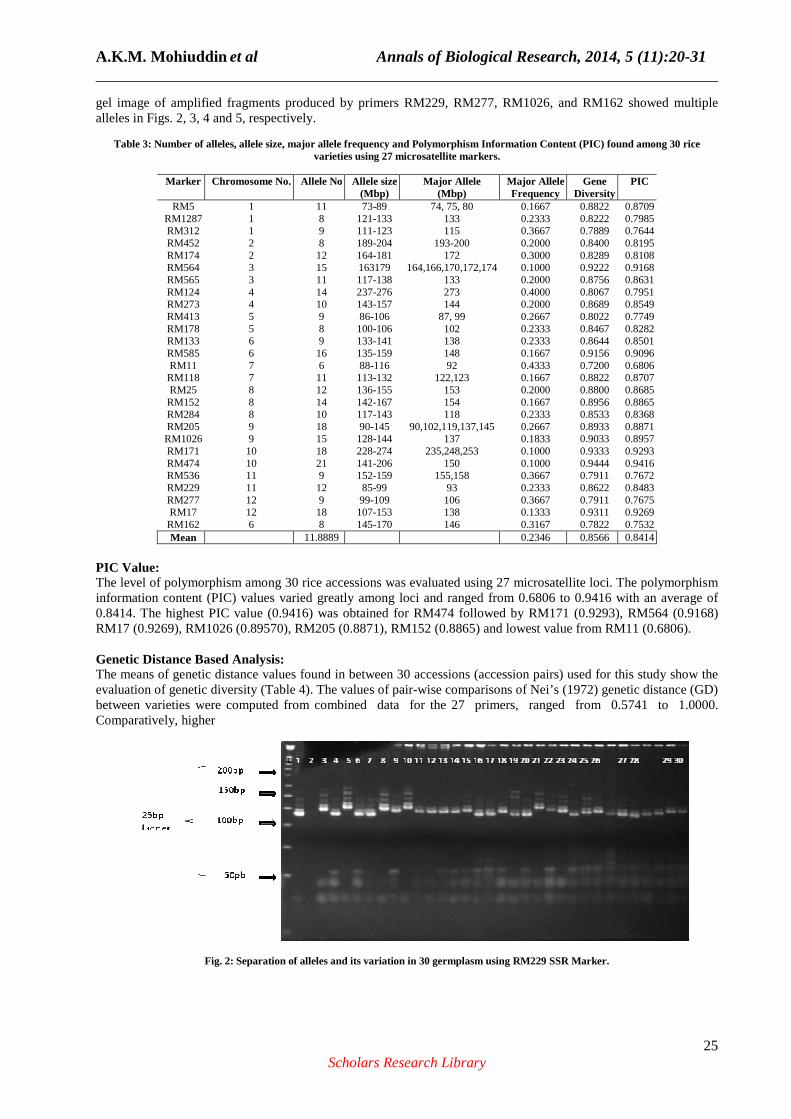
gel image of amplified fragments produced by primers RM229, RM277, RM1026, and RM162 showed multiple alleles in Figs. 2, 3, 4 and 5, respectively.
Table 3: Number of alleles, allele size, major allele frequency and Polymorphism Information Content (PIC) found among 30 rice
varieties using 27 microsatellite markers.
Marker Chromosome No. Allele No Allele size (Mbp)
Major Allele (Mbp)
Major Allele Frequency
Gene Diversity
PIC
RM5 1 11 73-89 74, 75, 80 0.1667 0.8822 0.8709 RM1287 1 8 121-133 133 0.2333 0.8222 0.7985 RM312 1 9 111-123 115 0.3667 0.7889 0.7644 RM452 2 8 189-204 193-200 0.2000 0.8400 0.8195 RM174 2 12 164-181 172 0.3000 0.8289 0.8108 RM564 3 15 163179 164,166,170,172,174 0.1000 0.9222 0.9168 RM565 3 11 117-138 133 0.2000 0.8756 0.8631 RM124 4 14 237-276 273 0.4000 0.8067 0.7951 RM273 4 10 143-157 144 0.2000 0.8689 0.8549 RM413 5 9 86-106 87, 99 0.2667 0.8022 0.7749 RM178 5 8 100-106 102 0.2333 0.8467 0.8282 RM133 6 9 133-141 138 0.2333 0.8644 0.8501 RM585 6 16 135-159 148 0.1667 0.9156 0.9096 RM11 7 6 88-116 92 0.4333 0.7200 0.6806 RM118 7 11 113-132 122,123 0.1667 0.8822 0.8707 RM25 8 12 136-155 153 0.2000 0.8800 0.8685 RM152 8 14 142-167 154 0.1667 0.8956 0.8865 RM284 8 10 117-143 118 0.2333 0.8533 0.8368 RM205 9 18 90-145 90,102,119,137,145 0.2667 0.8933 0.8871 RM1026 9 15 128-144 137 0.1833 0.9033 0.8957 RM171 10 18 228-274 235,248,253 0.1000 0.9333 0.9293 RM474 10 21 141-206 150 0.1000 0.9444 0.9416 RM536 11 9 152-159 155,158 0.3667 0.7911 0.7672 RM229 11 12 85-99 93 0.2333 0.8622 0.8483 RM277 12 9 99-109 106 0.3667 0.7911 0.7675 RM17 12 18 107-153 138 0.1333 0.9311 0.9269 RM162 6 8 145-170 146 0.3167 0.7822 0.7532 Mean 11.8889 0.2346 0.8566 0.8414
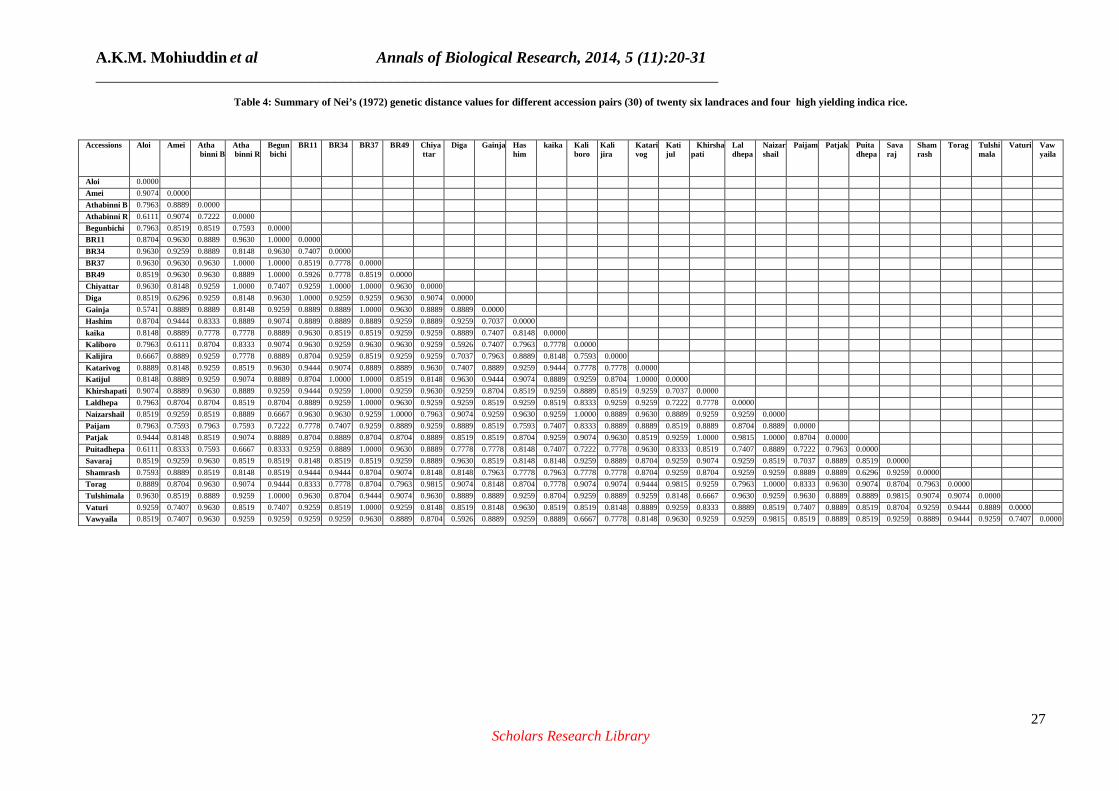
PIC Value: The level of polymorphism among 30 rice accessions was evaluated using 27 microsatellite loci. The polymorphism information content (PIC) values varied greatly among loci and ranged from 0.6806 to 0.9416 with an average of 0.8414. The highest PIC value (0.9416) was obtained for RM474 followed by RM171 (0.9293), RM564 (0.9168) RM17 (0.9269), RM1026 (0.89570), RM205 (0.8871), RM152 (0.8865) and lowest value from RM11 (0.6806). Genetic Distance Based Analysis: The means of genetic distance values found in between 30 accessions (accession pairs) used for this study show the evaluation of genetic diversity (Table 4). The values of pair-wise comparisons of Nei’s (1972) genetic distance (GD) between varieties were computed from combined data for the 27 primers, ranged from 0.5741 to 1.0000. Comparatively, higher
Fig. 2: Separation of alleles and its variation in 30 germplasm using RM229 SSR Marker.
A.K.M. Mohiuddin et al Annals of Biological Research, 2014, 5 (11):20-31 ______________________________________________________________________________
26 Scholars Research Library
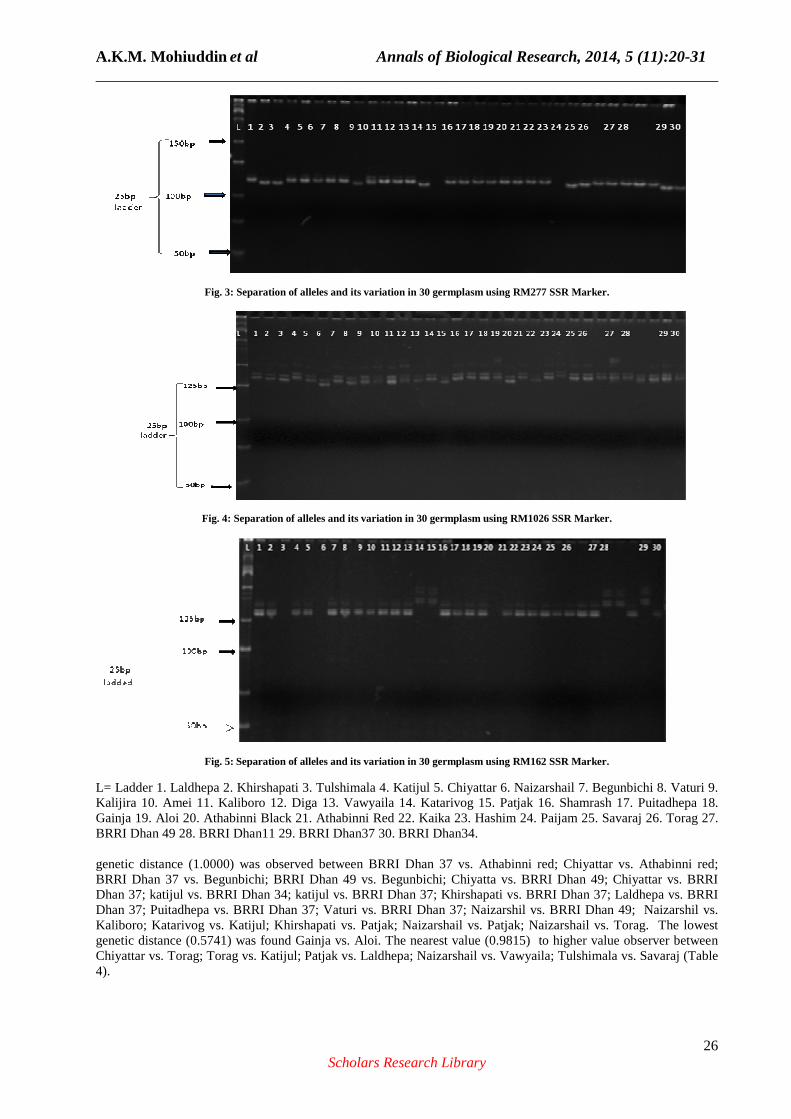
Fig. 3: Separation of alleles and its variation in 30 germplasm using RM277 SSR Marker.
Fig. 4: Separation of alleles and its variation in 30 germplasm using RM1026 SSR Marker.
Fig. 5: Separation of alleles and its variation in 30 germplasm using RM162 SSR Marker.
L= Ladder 1. Laldhepa 2. Khirshapati 3. Tulshimala 4. Katijul 5. Chiyattar 6. Naizarshail 7. Begunbichi 8. Vaturi 9. Kalijira 10. Amei 11. Kaliboro 12. Diga 13. Vawyaila 14. Katarivog 15. Patjak 16. Shamrash 17. Puitadhepa 18. Gainja 19. Aloi 20. Athabinni Black 21. Athabinni Red 22. Kaika 23. Hashim 24. Paijam 25. Savaraj 26. Torag 27. BRRI Dhan 49 28. BRRI Dhan11 29. BRRI Dhan37 30. BRRI Dhan34. genetic distance (1.0000) was observed between BRRI Dhan 37 vs. Athabinni red; Chiyattar vs. Athabinni red; BRRI Dhan 37 vs. Begunbichi; BRRI Dhan 49 vs. Begunbichi; Chiyatta vs. BRRI Dhan 49; Chiyattar vs. BRRI Dhan 37; katijul vs. BRRI Dhan 34; katijul vs. BRRI Dhan 37; Khirshapati vs. BRRI Dhan 37; Laldhepa vs. BRRI Dhan 37; Puitadhepa vs. BRRI Dhan 37; Vaturi vs. BRRI Dhan 37; Naizarshil vs. BRRI Dhan 49; Naizarshil vs. Kaliboro; Katarivog vs. Katijul; Khirshapati vs. Patjak; Naizarshail vs. Patjak; Naizarshail vs. Torag. The lowest genetic distance (0.5741) was found Gainja vs. Aloi. The nearest value (0.9815) to higher value observer between Chiyattar vs. Torag; Torag vs. Katijul; Patjak vs. Laldhepa; Naizarshail vs. Vawyaila; Tulshimala vs. Savaraj (Table 4).
A.K.M. Mohiuddin et al Annals of Biological Research, 2014, 5 (11):20-31 ______________________________________________________________________________
27 Scholars Research Library
Table 4: Summary of Nei’s (1972) genetic distance values for different accession pairs (30) of twenty six landraces and four high yielding indica rice.
Accessions Aloi Amei Atha binni B
Atha binni R
Begun bichi
BR11 BR34 BR37 BR49 Chiya ttar
Diga Gainja Has him
kaika Kali boro
Kali jira
Katari vog
Kati jul
Khirsha pati
Lal dhepa
Naizar shail
Paijam Patjak Puita dhepa
Sava raj
Sham rash
Torag Tulshi mala
Vaturi Vaw yaila
Aloi 0.0000
Amei 0.9074 0.0000
Athabinni B 0.7963 0.8889 0.0000
Athabinni R 0.6111 0.9074 0.7222 0.0000
Begunbichi 0.7963 0.8519 0.8519 0.7593 0.0000
BR11 0.8704 0.9630 0.8889 0.9630 1.0000 0.0000
BR34 0.9630 0.9259 0.8889 0.8148 0.9630 0.7407 0.0000
BR37 0.9630 0.9630 0.9630 1.0000 1.0000 0.8519 0.7778 0.0000
BR49 0.8519 0.9630 0.9630 0.8889 1.0000 0.5926 0.7778 0.8519 0.0000
Chiyattar 0.9630 0.8148 0.9259 1.0000 0.7407 0.9259 1.0000 1.0000 0.9630 0.0000
Diga 0.8519 0.6296 0.9259 0.8148 0.9630 1.0000 0.9259 0.9259 0.9630 0.9074 0.0000
Gainja 0.5741 0.8889 0.8889 0.8148 0.9259 0.8889 0.8889 1.0000 0.9630 0.8889 0.8889 0.0000
Hashim 0.8704 0.9444 0.8333 0.8889 0.9074 0.8889 0.8889 0.8889 0.9259 0.8889 0.9259 0.7037 0.0000
kaika 0.8148 0.8889 0.7778 0.7778 0.8889 0.9630 0.8519 0.8519 0.9259 0.9259 0.8889 0.7407 0.8148 0.0000
Kaliboro 0.7963 0.6111 0.8704 0.8333 0.9074 0.9630 0.9259 0.9630 0.9630 0.9259 0.5926 0.7407 0.7963 0.7778 0.0000
Kalijira 0.6667 0.8889 0.9259 0.7778 0.8889 0.8704 0.9259 0.8519 0.9259 0.9259 0.7037 0.7963 0.8889 0.8148 0.7593 0.0000
Katarivog 0.8889 0.8148 0.9259 0.8519 0.9630 0.9444 0.9074 0.8889 0.8889 0.9630 0.7407 0.8889 0.9259 0.9444 0.7778 0.7778 0.0000
Katijul 0.8148 0.8889 0.9259 0.9074 0.8889 0.8704 1.0000 1.0000 0.8519 0.8148 0.9630 0.9444 0.9074 0.8889 0.9259 0.8704 1.0000 0.0000
Khirshapati 0.9074 0.8889 0.9630 0.8889 0.9259 0.9444 0.9259 1.0000 0.9259 0.9630 0.9259 0.8704 0.8519 0.9259 0.8889 0.8519 0.9259 0.7037 0.0000
Laldhepa 0.7963 0.8704 0.8704 0.8519 0.8704 0.8889 0.9259 1.0000 0.9630 0.9259 0.9259 0.8519 0.9259 0.8519 0.8333 0.9259 0.9259 0.7222 0.7778 0.0000
Naizarshail 0.8519 0.9259 0.8519 0.8889 0.6667 0.9630 0.9630 0.9259 1.0000 0.7963 0.9074 0.9259 0.9630 0.9259 1.0000 0.8889 0.9630 0.8889 0.9259 0.9259 0.0000
Paijam 0.7963 0.7593 0.7963 0.7593 0.7222 0.7778 0.7407 0.9259 0.8889 0.9259 0.8889 0.8519 0.7593 0.7407 0.8333 0.8889 0.8889 0.8519 0.8889 0.8704 0.8889 0.0000
Patjak 0.9444 0.8148 0.8519 0.9074 0.8889 0.8704 0.8889 0.8704 0.8704 0.8889 0.8519 0.8519 0.8704 0.9259 0.9074 0.9630 0.8519 0.9259 1.0000 0.9815 1.0000 0.8704 0.0000
Puitadhepa 0.6111 0.8333 0.7593 0.6667 0.8333 0.9259 0.8889 1.0000 0.9630 0.8889 0.7778 0.7778 0.8148 0.7407 0.7222 0.7778 0.9630 0.8333 0.8519 0.7407 0.8889 0.7222 0.7963 0.0000
Savaraj 0.8519 0.9259 0.9630 0.8519 0.8519 0.8148 0.8519 0.8519 0.9259 0.8889 0.9630 0.8519 0.8148 0.8148 0.9259 0.8889 0.8704 0.9259 0.9074 0.9259 0.8519 0.7037 0.8889 0.8519 0.0000
Shamrash 0.7593 0.8889 0.8519 0.8148 0.8519 0.9444 0.9444 0.8704 0.9074 0.8148 0.8148 0.7963 0.7778 0.7963 0.7778 0.7778 0.8704 0.9259 0.8704 0.9259 0.9259 0.8889 0.8889 0.6296 0.9259 0.0000
Torag 0.8889 0.8704 0.9630 0.9074 0.9444 0.8333 0.7778 0.8704 0.7963 0.9815 0.9074 0.8148 0.8704 0.7778 0.9074 0.9074 0.9444 0.9815 0.9259 0.7963 1.0000 0.8333 0.9630 0.9074 0.8704 0.7963 0.0000
Tulshimala 0.9630 0.8519 0.8889 0.9259 1.0000 0.9630 0.8704 0.9444 0.9074 0.9630 0.8889 0.8889 0.9259 0.8704 0.9259 0.8889 0.9259 0.8148 0.6667 0.9630 0.9259 0.9630 0.8889 0.8889 0.9815 0.9074 0.9074 0.0000
Vaturi 0.9259 0.7407 0.9630 0.8519 0.7407 0.9259 0.8519 1.0000 0.9259 0.8148 0.8519 0.8148 0.9630 0.8519 0.8519 0.8148 0.8889 0.9259 0.8333 0.8889 0.8519 0.7407 0.8889 0.8519 0.8704 0.9259 0.9444 0.8889 0.0000
Vawyaila 0.8519 0.7407 0.9630 0.9259 0.9259 0.9259 0.9259 0.9630 0.8889 0.8704 0.5926 0.8889 0.9259 0.8889 0.6667 0.7778 0.8148 0.9630 0.9259 0.9259 0.9815 0.8519 0.8889 0.8519 0.9259 0.8889 0.9444 0.9259 0.7407 0.0000
A.K.M. Mohiuddin et al Annals of Biological Research, 2014, 5 (11):20-31 ______________________________________________________________________________
28 Scholars Research Library
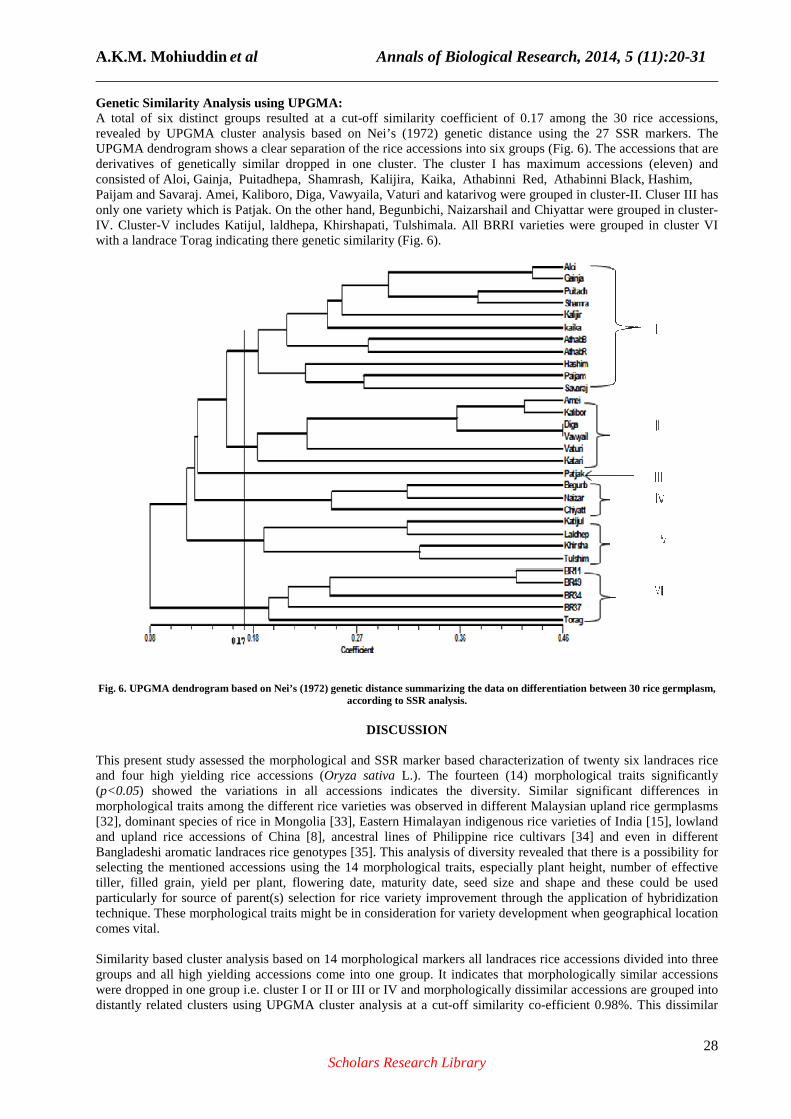
Genetic Similarity Analysis using UPGMA: A total of six distinct groups resulted at a cut-off similarity coefficient of 0.17 among the 30 rice accessions, revealed by UPGMA cluster analysis based on Nei’s (1972) genetic distance using the 27 SSR markers. The UPGMA dendrogram shows a clear separation of the rice accessions into six groups (Fig. 6). The accessions that are derivatives of genetically similar dropped in one cluster. The cluster I has maximum accessions (eleven) and consisted of Aloi, Gainja, Puitadhepa, Shamrash, Kalijira, Kaika, Athabinni Red, Athabinni Black, Hashim, Paijam and Savaraj. Amei, Kaliboro, Diga, Vawyaila, Vaturi and katarivog were grouped in cluster-II. Cluser III has only one variety which is Patjak. On the other hand, Begunbichi, Naizarshail and Chiyattar were grouped in cluster-IV. Cluster-V includes Katijul, laldhepa, Khirshapati, Tulshimala. All BRRI varieties were grouped in cluster VI with a landrace Torag indicating there genetic similarity (Fig. 6).
Fig. 6. UPGMA dendrogram based on Nei’s (1972) genetic distance summarizing the data on differentiation between 30 rice germplasm, according to SSR analysis.
DISCUSSION
This present study assessed the morphological and SSR marker based characterization of twenty six landraces rice and four high yielding rice accessions (Oryza sativa L.). The fourteen (14) morphological traits significantly (p<0.05) showed the variations in all accessions indicates the diversity. Similar significant differences in morphological traits among the different rice varieties was observed in different Malaysian upland rice germplasms [32], dominant species of rice in Mongolia [33], Eastern Himalayan indigenous rice varieties of India [15], lowland and upland rice accessions of China [8], ancestral lines of Philippine rice cultivars [34] and even in different Bangladeshi aromatic landraces rice genotypes [35]. This analysis of diversity revealed that there is a possibility for selecting the mentioned accessions using the 14 morphological traits, especially plant height, number of effective tiller, filled grain, yield per plant, flowering date, maturity date, seed size and shape and these could be used particularly for source of parent(s) selection for rice variety improvement through the application of hybridization technique. These morphological traits might be in consideration for variety development when geographical location comes vital. Similarity based cluster analysis based on 14 morphological markers all landraces rice accessions divided into three groups and all high yielding accessions come into one group. It indicates that morphologically similar accessions were dropped in one group i.e. cluster I or II or III or IV and morphologically dissimilar accessions are grouped into distantly related clusters using UPGMA cluster analysis at a cut-off similarity co-efficient 0.98%. This dissimilar

A.K.M. Mohiuddin et al Annals of Biological Research, 2014, 5 (11):20-31 ______________________________________________________________________________
29 Scholars Research Library
grouping or distant clusters is so important because it helps the breeders to select the accession(s) with important dissimilar morphological traits from the studied accessions for hybridization to get the higher heterotic responses. Similar result was reported in different Malaysian upland rice germplasms by Sohrabi el al. (2012) [32], in different Bangladeshi aromatic rice genotypes by Sajib et al. (2012) [35], in different soybean accessions by Ojo et al. (2012) [10], in oil palm parental genotypes by Abdullah et al. (2011) [36] and in different chilli germplasms by Hossain et al. (2014) [19]. A total of 321 alleles were detected from 30 landraces and high yielding varieties on all 12 chromosomes using 27 SSR markers (primers). The number of alleles per locus generated by each marker varied from 6 to 21 alleles with an average number of polymorphic alleles per marker 11.89. Among these 27 primer pairs, some amplified 6 to 10 alleles in different chromosomes e.g. RM11, RM1287, RM452, RM178, RM162, RM312, RM413, RM133, RM536, RM277, RM273 and RM284, however, other primer pairs (RM5, RM565, RM118, RM174, RM25, RM229, RM124, RM152, RM564, RM1026, RM585, RM205, RM171, RM17 and RM474) generated 11 to 21 alleles. These variations in multiple allele level indicate that SSR marker is crucial for identification of rice accessions at molecular level. Similar results were observed in previous fingerprinting and diversity studies having 1-8 alleles with an average of 4.58 alleles for various classes of microsatellite [37] and also 3 to 9 alleles, with an average of 4.53 alleles per locus for 30 microsatellite markers [38]. Our study confirms that the mentioned microsatellite markers are able to generate higher number of allele per locus. The markers those produced higher number of alleles could have better application to find out the polymorphisms in heritability of rice accessions. Separation and selection of accessions based on heritability traits is one of the most important factors for breeders for variety improvement [32]. Gel image of present study showed production of multiple alleles in 30 rice accessions. This production of multiple alleles suggested that these markers could be potentially used for molecular characterization of different rice accessions. Despite of the production of multiple alleles they were robust enough to distinguish specifically diverse genotypes or different accessions of the same genotypes. Nine different markers (RM) also showed multiple alleles in 12 aromatic rice genotypes studied by Sajib et al. (2012) [35]. On average, 23% of the 30 rice accessions shared a common major allele at any given locus ranging from 10% to 43% common allele at each locus. A higher percent (56%) common major allele was observed in aromatic rice genotypes reported by Sajib et al. (2012) [35]. On the other hand, a moderate level of diversity exists among 27 loci studied across 30 rice accessions, ranged from 0.72 to 0.94 with an average of 0.86. Similar result was observed in 12 aromatic rice genotypes with an average of 0.54 [35]. The polymorphism information content (PIC) value is a measure of polymorphism among the accessions for a marker locus used in linkage analysis [35]. The PIC values found in this study varied greatly among the tested loci and observed ranged from 0.6806 to 0.9416 with an average of 0.8414, indicating the presence of high genetic diversity among the rice accessions studied. The highest PIC value (0.9416) was obtained from RM474 followed by RM171 (0.9293), RM564 (0.9168), RM17 (0.9269), RM1026 (0.89570), RM205 (0.8871), RM152 (0.8865) proved that these are the best markers for identification and diversity estimation of rice accessions. The range of PIC values observed to several previous estimates of microsatellite analysis in rice such as, 0.34-0.88 [39], 0.157-0.838 with an average of 0.488 [14] and 0.20-0.90 with an average of 0.56 [40]. There is a co-relation also found in our study between higher number of alleles and PIC values. It indicates that the SSR markers those generate higher number of alleles and having higher PIC values could be used for future rice diversity analysis.
From the summary of Nei’s (1972) [31] genetic distance values it was found that the differences between the highest (1.0000) and the lowest (0.5741) genetic distance value revealed the wide variability among the 30 rice accessions. High genetic variability within accessions and significant difference between accessions indicate rich genetic material of a species. This investigation addresses that accessions those showed the highest genetic distance can be used as parental source for breeding line to improve rice varieties. Similar result was obtained in Bangladeshi chilli varieties reported by Hossain et al. (2014) [19]. The cluster analysis based on UPGMA dendrogram using 27 SSR markers summarized the data on differentiation between 30 rice accessions. It exposed that the accessions that are derivatives of genetically similar type formed cluster together. This analysis also provides the grouping pattern of the diverse accessions, suggested no parallelism between the different clusters (I to VI). Our findings are similar to the results obtained from forty soybean accessions [10], twenty two chilli germplasms [19], twelve aromatic rice genotypes [35] and twenty one rice varieties [14].

A.K.M. Mohiuddin et al Annals of Biological Research, 2014, 5 (11):20-31 ______________________________________________________________________________
30 Scholars Research Library
Molecular marker based analysis divided all accessions into 6 cluster, and the accessions were not distributed in same pattern when morphological marker based analysis was considered. It specifies that morphological and molecular level diversity are little bit different except some varieties. In morphological analysis all BRRI varieties clustered in an individual group and in molecular analysis they all clustered together along with one landraces ‘Torag’. It states that this polymorphic nature of clustering obtained using SSR markers is more informative, specific and precise than the one obtained from the morphological markers.
CONCLUSION
It is well reported that identification and evaluation of high heritability in accession alone is not enough for variety development, both high heritability and significant morphological traits are crucial in this regard. Therefore, our study was implicated in both morphological and molecular levels of 30 rice accessions and found extensive diversity based on morphological markers, UPGMA cluster analysis, molecular markers, allele number, allele frequency, gene diversity, PIC values, Nei’s genetic distance values and genetic similarity analysis using UPGMA. This extensive diversity at both molecular and morphological levels of accessions will help the rice breeders to find out suitable parent(s) containing economically important field crop traits for future hybridization.
REFERENCES
[1] T.T. Chang, Euphytica,. Asian and African rice, 1976, 25(1): 425-41. [2] C. Vanniarajan, K.K. Vinod, A. Pereira, Genetics, 2012, 91(1): 12-17. [3] "ProdSTAT".FAOSTAT. http://faostat.fao.org/site/567/DesktopDefault.aspx, 2006. [4] BBS: Handbook of Agricultural Statistics: Bangladesh Bureau of Statistics, 2006. [5] M.M. Messmer, A.E. Melchinger, R.G. Herrmann, J. Boppenmaier, Crop Sci., 1993, 33: 944-950. [6] M.A. Latif, M.M. Rahma, M.E. Ali, S. Ashkani, M.Y. Rafii, Comptes Rendus Biologies, 2013, 336(3): 125-133. [7] N.G. Hanamaratti, S.K. Prashanthi, P.M. Salimati, R.R. Hanchinal, H.D. Mohankumar, K.G. Parameshwarappa, S.D. Raikar, Current Science, 2007, 94(2):110-117. [8] L-n. Zhang, G-l. Cao, L-z. Han, Rice Science, 2013, 20(4): 259-266. [9] A.K. Kaul, M.R.I. Khan, K.M. Munir, Rice Quality, 1982, 1-17. [10] D.K. Ojo, A.O. Ajayi, O.A. Oduwaye, Pertanika J. Trop. Agric. Sci., 2012, 35(2): 237-248. [11] S.M. Hosan, N. Sultana, K.M. Iftekharuddaula, N.M. Uddin, M. Shamim, The Agriculturists, 2010, 8(2): 28-34. [12] A.R. Yeo, M.E. Yeo, S.A. Flowers, T.J. Flowers, Theor. Appl. Genet., 1990, 79: 377-384. [13] S.P. Singh, Annual Rep. Bean improvement Coop, 1989, 31: 180-182. [14] M.M. Rahman, M.G. Rasaul, M.A. Hossain, K.M. Iftekharuddaula, H. Hasegawa, J. Crop Improv., 2012, 26(2): 244-257. [15] B.I. Choudhury, M.L. Khan, S. Dayanandan, Rice Science, 2014, 21(2): 90-98. [16] L. Wang, S. Jiao, Y. Jiang, H. Yan, D. Su, G. Sun, X. Yan, L. Sun, Field Crops Research, 2013, 149(1): 11-19. [17] Y. Shao, L. Xu, F. Chen, Mycoscience, 2011, 52(4): 224-233. [18] D. Cheng, F. Zhang, L. Liu, L. Xu, Y. Chen, X. Wang, C. Limera, R. Yu, Y. Gong, Scientia Horticulturae, 2013, 161: 153-159. [19] S.M. Hossain, U. Habiba, S.I. Bhuyan, M.S. Haque, S.N. Begum and D.M. Hossain, Biotechnology, 2014, 10: 1-7. [20] R. Singh, D. Narzary, J. Bhardwaj, A.K. Singh, S. Kumar, A. Kumar, Industrial Crops and Products, 2014, 53: 187-198. [21] Z-z. He, F-m. Xie, L-y. Chen, M.A. Delapaz, Rice Science, 2012, 19(3): 193-201. [22] M.A.I. Khan, P.P. Sen, R. Bhuiyan, E. Kabir, A.K. Chowdhury, Y. Fukuta, A. Ali, M.A. Latif, Comptes Rendus Biologies, 2014, 337(5): 318-324. [23] T.K. Mondal, A.G. Showkat Gene, 2014, 535(2): 204-209. [24] J. Zhang, N.R. Burgos, M.A. Kun, Y-j. Zhou, R-m. Geng, L-q. Yu, Rice Science, 2008, 15(4): 295-302. [25] Q. Xu, H. Chen, C-h. Wang, H-y. Yu, X-p. Yuan, Y-p. Wang, Y. Feng, S-x. Tang, X-h. Wei, Integrative Agriculture, 2012, 11(10): 1567-1573. [26] O. Panaud, X. Chen, S.R. McCouch, Genome, 1995, 36: 170-176. [27] S.R. McCouch, X. Chen, O. Panaud, S. Temnykh, Y. Xu, Y.G. Chao, N. Huang, T. Ishii, M. Blair, Plant Mol. Boil., 1997, 35: 89-99. [28] J. Ferdous, M.M. Hanafi, M.Y. Rafii, K. Muhammad, African J. Biotechnology, 2012, 11(27): 6956-6964. [29] F. Rohlf, NTSYS‐PC: Numerical taxonomy and multivariate analysis system 2.1 (Ed.), State University, New York, 2002. [30] K. Liu, S.V. Muse, Bioinformatics, 2005, 21: 2128–2129. [31] M. Nei, Am. Nature, 1972, 106: 283-292. [32] M. Sohrabi, M.Y. Rafii, M.M. Hanafi, A.S.N. Akmar, M.A. Latif, The Scientific World J., 2012, 12: 1-9.
A.K.M. Mohiuddin et al Annals of Biological Research, 2014, 5 (11):20-31 ______________________________________________________________________________
31 Scholars Research Library
[33] J.L. Wang, Y.B. Gao, N.X. Zhao, Botanical Studies, 2006, 47(1): 23-35. [34] R. Caldo, L. Sebastian, J. Hernandez, Philippine J. Crop Sci., 1996, 21(3): 86-92. [35] A.M. Sajib, M.M. Hossain, A.T.M.J. Mosnaz, H. Hosneara, M.M. Islam, M.S. Ali, S.H. Prodhan, J BioSci. Biotech., 2012, 1(2): 107-116. [36] N. Abdullah, M.R. Yusop, M. Ithnin, G, Saleh, M.A. Latif, Comptes Rendus Biologies, 2011, 334(4): 290-299. [37] P. Siwach, S. Jain, N. Saini, V.K. Chowdhury, R.K. Jain, J. Pl. Biochem. Biotech., 2004, 13: 25‐32. [38] M.Z. Hossain, M.G. Rasul, M.S. Ali, K.M. Iftekharuddaula, M.A.K. Mian, Bangladesh Genet. Plant Breed., 2007, 20(2): 01‐10. [39] M.J. Thomson, E.M. Septiningsih, F. Suwardjo, T.J. Santoso, T.S. Silitonga, S.R. McCouch, Theor. Appl. Genet., 2007, 114: 559-568. [40] S. Jain, S.E. Mitchell, R.K. Jain, S. Kresovich, S.R. McCouch, In: G.S. Khush, D.S. Brar, B. Hardy (Ed.), In Advance in Rice Genetics (IRRI, Philippine, Oxford press, United Kingdom, 2003), 162‐165.