Embed Size (px)
Citation preview
Diversity and the Power of the Elites in Democratic
Societies: A Model and a Test∗
Oriana Bandiera† Gilat Levy‡
April 2010
Abstract
This paper analyzes whether political outcomes in local democracies are determined
by the preferences of the median -typically poor- agents or whether they reflect the
wishes of the wealthy elites. A model shows that when politicians belonging to different
groups can form coalitions, the wealthy elites’ influence on policy choices is endoge-
nously higher when there is diversity in preferences among the poor. In line with the
theoretical predictions, the pattern of public good provision by local governments in
Indonesia reveals that when individuals have different preferences —here due to different
ethnicities— democratic policy outcomes are closer to the preferences of the elites, rather
than the preferences of the poor majority.
∗We thank the editor Kai Konrad and two anonymous referees for helpful comments. We also thank Tim
Besley, Francois Bourguignon, Joan Esteban, Eliana La Ferrara, Valentino Larcinese, Imran Rasul, Debraj
Ray, Pedro Vicente and audiences at the CESifo Institutions Conference, CSAE Oxford, CEDI Brunel
University, Pompeu Fabra, PSE, Toulouse, and Universitat Autonoma Barcelona. Ameet Morjaria provided
excellent research assistance. This paper is part of the Polarization and Conflict Project CIT-2-CT-2004-
506084 funded by the European Commission-DG Research Sixth Framework Programme.†Department of Economics, London School of Economics and Political Science. [email protected]‡Department of Economics, London School of Economics and Political Science. [email protected]
1
1 Introduction
Democracy is generally deemed to be good for the poor; since the elites are few while
the poor are many, common wisdom suggests that democracy will lead to the choice of
policies that reflect the preferences of the poor. The comparison, however, becomes less
straightforward when citizens’ preferences for public policies differ along dimensions other
than those deriving from differences in wealth. Examples include differences due to religious
beliefs, ethnic interests, geography or culture.
This paper analyzes how democracy aggregates preferences when such diversity arises.
We construct a model that makes precise how preference diversity among the poor en-
dogenously gives weight to the preferences of the elites in the choice of public goods, and
we illustrate the theoretical predictions with evidence on the allocation of public goods in
Indonesian villages, using differences in ethnicity as a measure of preference diversity.
The model analyzes decision making in a society made of two main groups: the wealthy
elites (a minority) and the poor (a majority), who have different preferences over public
goods. The defining features of the political process are that politicians from the different
groups in society form parties, parties offer platforms, and voters vote for the platform they
like most. We distinguish between a simple environment in which all the poor have the
same preferences and an environment in which a segment of the poor, which we refer to as
the ethnic group, have different preferences. The model illustrates that the ideal policy of
the poor majority is unambiguously chosen in equilibrium only if politicians belonging to
different groups cannot form parties. Once they do, the rich elites and the ethnic group can
form a stable coalition that wins by offering a combination of public goods that both the
elites and the ethnic group prefer to the ideal policy of the poor.
The model shows how even in a fully functioning democracy, where the elites have no
additional powers and all votes have equal weight, policy choices may reflect the preference
of the elites rather than those of the poor.1 When politicians can form parties, "median"
preferences are less likely to prevail.
1Our analysis is complementary to Acemoglu and Robinson (2006) who propose a model in which citizens
and elites can invest resources in order to acquire de facto political power which allows them to change
economic or political institutions in their favor. While their analysis leaves the mechanism through which
the elites gain power unspecified, we propose a specific political process that allows the rich to be influential,
namely a process that results in a coalition between the elites and a segment of the poor.
2
We illustrate the theoretical predictions with evidence on the allocation of public goods
by local governments in Indonesia. The empirical test requires information on the viability
of the coalition between the elites and a poor minority and on preference diversity across
wealth classes, which we assemble by exploiting two distinctive features of the Indonesian
context.
First, Indonesia is one of the world’s most ethnically diverse countries and ethnic com-
position varies even within small geographical areas, so that some local constituencies are
ethnically homogeneous while in others the dominant ethnic group barely constitutes a ma-
jority. Given that ethnicity is often mentioned as a leading source of preference heterogeneity
and ethnic diversity is a salient issue in the Indonesian context, we use the population share
of the ethnic minority to proxy for the probability that there is a minority group with whom
the elites can form a ruling coalition.
Second, customary "adat" laws create natural differences in governance structure at the
smallest political unit—the village. At one end of the spectrum, there are villages in which
decision making is entirely controlled by the elites; at the other end, decisions are taken
democratically in community meetings. While the tastes of the elites are not observable,
a revealed preference argument indicates that outcomes reached when the elites control
decision making must be preferred by the elites.
To test whether diversity among the poor is correlated with outcomes that are closer
to the preferences of the elites, we then test whether the difference in the provision of a
range of public goods between villages in which decision making is entirely controlled by the
elites and democracies is affected by the level of ethnic diversity, which determines whether
a coalition is viable. The analysis yields two key findings.
First, the difference between the preferred level of public goods by the elites and the
majority poor, is negative for some goods (education and health), positive for others (public
security and voluntary labor programs) and zero for a third group (utilities and infrastruc-
ture services).
Second, and most importantly, we find that for all the goods over which the difference
is non-zero, increasing the share of the ethnic group brings the allocation closer to the
preferred outcome of the elites. The effect is large in magnitude. For instance, compared
to villages where the elites control decision making, the number of health clinics per 1000
inhabitants is 12% higher in ethnically homogeneous democracies, while the difference falls
3
to 6% at the mean minority share. In line with our interpretation that increasing the share
of the ethnic group allows the elites to have more influence on public choices, we find that for
all the goods over which the elites and the majority preferences are aligned, ethnic diversity
is not correlated with public good outcomes.
Our empirical analysis may point towards some more general insights on two fronts.
First, we highlight a political mechanism through which diversity can affect public policy
(namely, by enabling the elites to form winning coalitions) and our empirical analysis pro-
vides some clues that allow us to distinguish this mechanism from alternative channels.2
For example, we find no support for models that predict an unambiguously negative effect
of diversity on the level of public good provision, for instance because individuals dislike
contributing resources to goods that benefit members of other ethnic groups. Indeed, we
find that the sign of the effect of diversity differs across a range of public goods. In partic-
ular, the level of public goods preferred by the elites is higher in more diverse communities.
Moreover, the finding that the effect of diversity does not depend on whether people of
different groups need to consume it together —as in the case of education— or not—as in the
case of health facilities— does not lend support to the assumption that diversity reduces pub-
lic good provision because individuals dislike interacting with others belonging to different
groups.
Second, we bring some new evidence on the debate of the effect of democracy on public
policies. The cross-country evidence indicates that democracies and non-democracies look
remarkably similar on a large set of public policies (Mulligan et al 2004). Our analysis
highlights one channel suggesting that the effect of democracy might be heterogeneous, as
a function of preference diversity among the poor. If, due to diversity, the elites can rule
in a democratic society, its outcomes will not differ from oligarichic or autocratic regimes
where power is concentrated in the hands of the elites.3
The theoretical literature on the political determination of public goods provision is
2For a comprehensive review of other channels and the empirical literature, see Alesina and La Ferrara
(2005).3To the best of our knowledge, only Collier (2000) analyzes the interaction between diversity and gover-
nance, but he focuses on its effects on growth rather than public policies. See also Przeworski and Limongi
(1993) and Barro (1997) for an analysis of the effect of democracy on growth, Rodrik (1999) on wages, Pers-
son and Tabellini (2006) on political regimes and growth, and Besley and Kudamatsu (2006) and Kudamatsu
(2007) on health outcomes.
4
vast. Scholars have analyzed the effect of majority rule on public good provision (Bergstrom
1979), the effects of lobbying on such provision (Austen-Smith 1987), how (de)centralization
or more generally federalism determines the level of local public goods (see for example
Besley and Coate 2003 or Alesina and Spalore 1997) and how bargaining in legislatures
affects public good provision (Batagllini and Coate 2008). More recently, a large literature
focuses on a comparative study of how different electoral systems induce different sizes and
compositions of government (see Lizzeri and Persico 2001, Persson and Tabellini 2003, 2004).
Our approach relates to this latter literature, where we focus on the mechanism of party
or coalition formation in democracies and its effect on public goods. Other papers which
consider endogenous party formation have mostly focused on pure redistributive models or
on a unidimensional policy space (see for example Morelli 2004, Jackson and Moselle 2001,
and Osborne and Tourky 2008).4
A more specific strand of the literature on public good provision to which we belong is
the one that explores, within a political model, the effect of diversity of preferences on such
provision. Alesina, Baqir, and Easterly (1999) analyze the effect of a general increase in
preference diversity on public good provision in a median voter model in which individuals
differ in their valuation over public goods but can fund only one of them. As preference
diversity increases, voters value less the good proposed by the median voter and hence rather
decrease its provision alltogether. As we allow for several goods to be provided, we can show
that preference diversity changes the composition of the goods provided. Roemer (1998) is
one of the first to analyze a model in which preferences and income diversity interact.5 He
shows that the existence of another salient non-economic issue (e.g. religion) can benefit
the rich. Llavador and Oxoby (2005) consider how some rich groups benefit from extending
the franchise and alligning with poorer individuals to pursue their specific interests (that is,
on issues other than general redistribution).6 Closely related is Fernandez and Levy (2008)
which address a complementary question as they study the effect of changing the number
4One notable exception is Roemer (1998).5Austen-Smith and Wallerstein (2006) and Lee and Roemer (2006) provide related models. See also
Besley and Coate (2000).6Taking a different angle, Esteban and Ray (1999) show that coalitions are likely to form across income
classes but within ethnic groups, whereas we find that coalitions are formed across both class and ethnic
(or any other minority) groups. They show that, in the production of conflicts, ethnic coalitions can take
advantage of synergies arising from economic inequality. While they focus on modeling a conflict, we consider
a peaceful political process in which no such synergies arise.
5
of groups with different preferences in society, on public provision of general and specific
public goods. Our approach is tailored to the empirical context where we observe variations
in the size, rather than in the number, of the minority groups.7
Finally, our political parties model relies on Levy (2004) which applies the stability
concept used in Ray and Vohra (1997) to determine which endogenous parties arise. A key
element in this model is that the utility of a coalition member depends not only on the
coalition he belongs to, but also on the array and composition of other parties/coalitions,
as they too take part in the political process. This is also the case in some economic
applications investigated in Ray and Vohra’s (1997) and Bloch’s (1996) cartel models.
We present the model and provide predictions in Section 2. The empirical analysis is
in Section 3, while Section 4 concludes.
2 Diversity and the Power of the Elites: A Model
2.1 The Economic Environment
We consider the simplest economic environment that captures the key features of the em-
pirical setting. Specifically, we assume that agents belong to one of two main groups: the
rich (or more generally the elite), and the poor. We assume, as is the case usually, that
the poor are a majority in the population. Thus, if there is no preferences diversity among
the poor, they will be able to impose their preferences. We do consider however the case
of preference diversity among the poor and distinguish among two poor groups: a general
poor group, with no specific special interest, and a special poor group, with some specific
interest, such as ethnic, religious, or geographical. To fix ideas, we denote this poor group
as the Ethnic group (although it could have other labels to consider other dimensions of
diversity). To make matters interesting, we assume that neither the general poor nor the
special poor group constitute a majority in the population. Finally, to capture the fact that
transfers from the center account for most of the revenues of local governments, we assume
that society only chooses how to allocate a fixed budget T among several feasible public
goods.
We assume that these three groups have different preferences on how to allocate T .
Specifically, we assume that the Poor (P ) gain utility from the provision of some general
7See also Levy (2005).
6
public good g (which could be thought of as health, education, infrastructure, or a combina-
tion of all) and thus maximize some uP (g). The Rich elites (R) gain utility both from g and
from another good s and hence wish to maximize some uR(g, s). To fix ideas we will refer
to s as security services, for which the elites’ demand is typically higher. Finally, the poor
Ethnic group E gains utility from g as well as from its special good e and wish to maximize
some uE(g, e). The good e can be thought of as public provision of ethnic education (such
as the minority langugage), or of religious needs etc. The budget constraint in the economy
is therefore T = g + e + s. We assume that the functions ui for i ∈ {P,R,E) are concave
in each good and attain a unique interior maximum, i.e., E0s ideal policy satisfies g > 0
and e > 0, R0s ideal policy sastifies g > 0, and s > 0 and trivially, P 0s ideal policy satifies
g = T.
It is therefore easy to see that among ideal policies, that of P represents the "median"
preferences in the population, as the R group prefers it to the ideal policy of E, and the
E group prefers the ideal policy of P to that of R. We therefore assume that relative to
some "generic" group in society (the general Poor), other groups may value goods which are
specific to them. The rich elites may value the provision of security services and policing,
which poorer agents may have no use for. Special ethnic or religious groups may value the
provision of some targeted services such as language programs at school that the rest of
the public may not be interested in. Note that our results will be maintained if the general
poor will also care for some specific good, but less than the others do, so that it will provide
the highest level of the general good and will thus be maintained as the "median" group.
The highly simplified and specialized economic environment is designed to be so to keep
the theoretical exposition transparent and to fit with the empirical context. In particular,
in our model, society does not collect any taxes, and hence differences in income will not
play a role. In that sense, the elites could be thought of as another interest group, albeit
an important one to look at; in every society they are prevalent in the political process,
more likely to be represented in politics and to be able to exert power. They may be more
powerful than their sheer numbers imply, and may use other means than voting to capture
decision making power de facto.
In practice, of course, local governments also raise some revenues both through local
taxes and through informal contributions in cash or in kind (Olken and Singhal 2009).
As this information is not available in the data we use, we do not model the choice of
7
taxation either. Moreover, incorporating this into the model will yield the same qualitative
results; suppose for example that the rich elites differ from the poor in terms of income
and that society also needs to decide about the level of tax (and possibly about some
income redistribution). In that case, the rich would have a conflict with the poor groups
on how much tax to impose. Note however that also in this case P will have the "median"
preferences, namely that group R will prefer the ideal policy of P to that of E (as given
the same amount of tax collected, they would rather spend money on g and not on goods
which they do not enjoy) and group E would still prefer the ideal policy of P to that of R
(as given that their own good is not catered for, they would rather have redistribution from
the rich and high provision of the general good). This feature will allow us to derive similar
results to the ones in our model. We therefore choose to focus on the simplest model that
is tailored to the empirical application.8
2.2 The Political Process
The political process must yield a decision on how to allocate the budget. We adopt here
a simplified version of the parties model of Levy (2004).9
We assume that each type in the population (the poor, the rich, and the ethnic poor) is
represented in the political process by one representative, a politician, whereas the remaining
individuals of each type participate in the election as voters. The politicians have the same
preferences as the group they represent. The representative politicians can either run on
their own or form coalitions with other politicians. This implies a partition on the set of
politicians. For example, R|P |E is the partition in which each politician can only run as
an individual candidate, and the partition PE|R is such that P and E join together.
We proceed as follows. For each fixed partition of politicians into parties, we define
a simple electoral game and derive the set of partition-equilibria: a set of policies, one (at
most) for each party, that satisfies some best response condition (while taking the partition
as given). We then add a stability condition: the partition-equilibria is also a stable political
outcome if no politician or group of politicians can split from their party, thus create a new
8We can also construct a model in which these goods can be bought in the private market, or in which
some of these goods are private in nature (i.e., their level of provision depends on the size of the group
consuming them). Finally, we can also assume that there exists a rich ethnic group; as long as P remains
the "median" group in terms of its preferences, the model will yield analogous conclusions.9See also Fernandez and Levy (2008).
8
partition, in which a different partition-equilibrium provides them with a (weakly) higher
utility.
The electoral game: platforms and voting. Consider a partition of politicians into
parties. The main assumption about parties in this model is that each party can only offer
credible policies, that is, policies in the Pareto set of its members. Thus, when a politician
runs as an individual candidate he can only offer his ideal policy, as in the ‘citizen candidate’
model.10 On the other hand, when heterogeneous politicians join together in a party, their
Pareto set is larger than the set of their ideal policies. For example, the party of R and P
can offer all policies with e = 0 and some provision of g and s. The party of P and E can
offer g and e but no s, and so on. The assumption about parties captures the idea that
parties allow different factions to reach (efficient) internal compromises.11
We assume that parties simultaneously choose whether to offer a platform and what
platform to offer. Given the set of policies offered by parties, individuals vote sincerely to
the policy they like most, independently of the party membership of their representative.
If individuals are indifferent among several offered platforms, they mix among them with
equal probability. The winning platform is chosen by plurality rule (and if platforms tie,
each is chosen with equal probability). Finally, if no platform is offered, some default
policy is implemented, which is worse for all then their ideal policy. For simplicity, there
are no costs of running for election or benefits from holding office. Thus the payoff of a
representative politician from a set of policies offered by all parties is his expected utility
from the political outcome, i.e., given the vote shares that will be allocated to each policy
in this set as described above.
A Partition equilibrium. Consider a given partition of the three representatives into
parties (including one-member parties). A partition-equilibrium is a set of policies offered
by the parties in the electoral game such that: (i) each policy is on the Pareto set of the
party offering it; (ii) for each party, there does not exist an alternative policy that is on its
Pareto frontier (including not offering a platform) such that, taking the other platforms as
10See Besley and Coate (1997) and Osborne and Slivinski (1996).11The assumption about heterogeneous parties relies on the idea that it is relatively easy for a small
group of politicians to monitor one another. The public can then trust promises which represent internal
compromises in the party. See also Ray and Vohra (1997) who analyze a general model in which agreements
within coalitions are binding, as here.
9
given, it improves the payoffs of all of its members, for at least one of them strictly; (iii) for
each party if the payoff of its members is the same when it offers its platform and when it
doesn’t (taking the other platforms as given), it chooses not to offer a platform.
Condition (ii) is a “party best response” condition which asserts that for a given parti-
tion, and taking other platforms as given, each party member has a veto power concerning
deviations. Condition (iii) is a tie breaking rule which allows to refine the set of equilibria
in a natural way (if for example there exists some small cost of running). It is easy to show
that for each partition, there exists a partition-equilibrium.
Finally, we impose a stability requirement. We say that a subcoalition within a party
"induces a new partition" when it splits from its original coalition (and the other parties
remain as in the original partition). We can then define:
A stable political outcome. A partition-equilibrium is a stable political outcome if there
does not exist a subcoalition within a party that can induce a new partition, in which an
alterantive partition-equilibrium makes all the members of the subcoalition (weakly) better
off.
Parties are endogenous in the model in the sense that partitions and their respective
partition-equilibria are stable only if there is no subcoalition within a party that can prof-
itably split from its party. While this condition allows a subcoalition to split from its party,
it does not allow it to form a new party with other coalitions or representatives. The reason
for this restriction is that, in a multidimensional policy space, a stability concept which
allows for all types of deviations will typically result in no stable outcome. Note also that
once a subcoalition splits, the remaining parties can modify their platforms, so that the
deviating subcoalition takes into consideration that in the new partition it induces, it will
face a partition-equlibrium. The prediction of the model is then the set of stable political
outcomes with such endogenous parties.
2.3 Stable Political Outcomes
We now characterize the set of stable political outcomes in our simple economic environment.
We say that there is no ethnic diversity de facto, either if all poor have the same preferences-
namely, when there are no special interests in the economy and both the P and the E
group have the same preferences over public goods as P has- or, if there exists a special
10
interst group but it is not represented in the political process, for instance because there
are barriers for small or marginalized groups. The political outcome will depend on the
existence of diversity, as illustrated by the following result.
Proposition 1 (i) When there is no ethnic diversity de facto, P running alone and
winning is the unique stable political outcome and the allocation of public goods satisfies
g∗ = T, e∗ = 0, and s∗ = 0; (ii) When there is ethnic diversity, there exists a unique stable
political outcome with endogenous parties in which R and E form a winning coalition. Its
winning policies are characterized by positive level of provision of all goods, g∗,e∗, and s∗,
where uR(g∗, s∗) > uR(T, 0) and uE(g∗, e∗) > uE(T, 0).
The benchmark result in (i) follows the common wisdom that in democracy policies are
chosen according to the preferences of the median. It is obvious that when E has the same
preferences as P , P represents the majority in the population and thus wins. Similarly,
even if E exists but it is not represented by a politician, then P will not form any stable
coalition with R as by breaking this coalition he is guranteed to win (as the E voters will
back P ). P will therefore be the unique winner.
To understand what political coalitions can be stable when ethnic diversity exists de
facto, consider first the equilibrium when politicians can only run by themselves and not
form any parties. In this case, the (only) stable outcome is that P runs alone and wins
the election. To see why this is the only possible outcome, note that when no coalitions
form, each politician, E, R and P, can only offer his ideal policy. However, both R and
E prefer the ideal policy of P to that of the other group; P will therefore win against any
other politician in a two-way race. Moreover, if all three politicians will choose to run, then
the largest group will win. But if E for example is the largest group, then R is better off
dropping from the race and allowing his voters to switch their vote to P, which is better for
the rich. Similarly, E should drop from the race if R is the largest group.
However, consider now coalition formation among these politicians. To see first why
P cannot be a member of any coalition, note that if P were to be a member of a coalition,
he would have an incentive to split the party, which will result in the equilibrium in which,
as described above, he wins by himself and gets to implement his ideal policy.12 It is the
12The grand coalition RPE is also not stable as either P or RE have incentives to split, as we show in
the appendix.
11
inability of P to commit to stay in the coalition (no matter what policy the coalition offers
to implement) which renders these coalitions unstable.
Thus, the only coalition that can be stable is that of the rich and the ethnic minority
who could join forces to win against P. To see why it is indeed stable, note that for this
coalition to win, they must offer policies on their Pareto set. Their Pareto set does not,
however, include the ideal policy of P, i.e., there are policies that both the rich and the
minority poor indeed prefer to the ideal policy of P (by concavity). Such a policy prescribes
for example a small public provision of both s and e. Both groups will be better off; this
implies that RE can win the election against P , and that neither R nor E has an interest
in splitting the party, as the resulting outcome (the ideal policy of P ), will be worse. The
coalition wins therefore with a policy of lower provision of the general good in return to
some provision of the ethnic good and security services. Thus, although the poor groups
together are a majority, the rich manage to take advantage of the diversity of preferences
among the poor in their favor. They compromise by providing the ethnic group their specific
good, and in return get a provision of their own favourite good.
Our result implies that in diverse democracies the level of provision of general public
goods is lower, whereas the provision of targeted and specific goods is higher. Specifically,
it may be tilted towards the preferences of the elite. In the next section we test whether
indeed the share of the ethnic minorities affects the ability of the elites to sway the political
outcomes in their favour.
3 Diversity and the Power of the Elites: Public Goods in
Indonesian Villages
This section illustrates the theoretical predictions with evidence on Indonesian local govern-
ments’ outcomes at the smallest political level: the village. The first subsection describes
the context and our identification strategy. The second presents the empirical findings. The
third discusses alternative interpretations.
3.1 Context and Identification
Our data sources is the 1997 Indonesian Family Life Surveys (IFLS 2). The distinctive
feature of IFLS2 is that it contains detailed information on governance, on a large range of
12
public goods and community activities and on ethnic composition at the village level. The
sample covers 259 villages in 35 districts out of the 243 districts of Indonesia.
In the sample period, the village government was responsible for several public goods
and infrastructure projects. These included the maintenance and construction of sewage
systems, water pipes, health posts and classrooms. Village expenditures were financed by
a central government grant, combined with villagers’ donations and in-kind labor contribu-
tions (gotong royong).
The governance of Indonesian villages was traditionally regulated by customary "adat"
laws. The Dutch colonial rule recognized village governments as lawful entities and encour-
aged self-rule according to these laws, which were kept in place after independence until
Soeharto took power in 1978. After that, uniform local government structures made up
of a headman and a village assembly (LMD) were imposed in all villages throughout the
country.13 While adat laws were formally banned during Sohearto’s regime, the formal ban
did not in practice result in the abandonment of these laws and the extensive decentral-
ization process that followed the demise of Soeharto reinstated them. Law 22/99, enacted
by January 2001, allowed village governance structures to be reorganized according to adat
laws and villages to change their names back to adat names.14
IFLS 2 contains a module dedicated to adat laws, which was administered to the person
identified by the village leader as a local expert in the traditional laws of the community.
The module provides detailed information on adat laws regarding several spheres of life,
and, most relevant for our purposeses, on village governance, namely on the process used to
take village level decisions, both according to adat law and in current practice (Frankenberg
and Thomas 1997).15 The exact wording of the question is "In deciding issues of commu-
13The headman was elected every eight years but was only accountable to the district government, and
he appointed the members of the village assembly. Development projects and assistance were managed by
community resilience boards (LKMD). The main purpose of these was to allocate development grants across
households and projects within the village and to act as a forum to collect villagers’ opinions. Members of
the LKMD were also appointed by the headman.14Law 22/99 also replaced the appointed village assembly with an elected village council (BPD). Elections
for both the headmen and the council take place every five years and the headman is directly accountable
to the council. In addition, it gave villages more autonomy in raising local revenues. This is not relevant for
our analysis as the sample period ends before the law was fully enacted.15The module also contains information about laws relating to marriage, childbirth, divorce, gender roles,
living arrangements for the elderly, death and inheritance.
13
nity importance (like constructions, celebrations) what policy is used to make decisions?"
Village adat experts are asked to provide answers both "according to traditional law" and
"common practice now". In line with the qualitative evidence from legal and anthropolog-
ical studies, traditional laws have a strong influence on current practices. In our sample
the correlation between village governance according to adat laws and in current practice is
73%. This provides further evidence that while adat laws were formally banned, they were
still being used to regulate village governance in 1997. Since current practice is more likely
to be correlated with contemporaneous unobservables, here we follow the most conservative
strategy and exploit the variation due to adat laws only.
The most common adat system, present in 68% of villages, is “consensus building”
(musyawarah), by which citizens in assembly engage in a process of group deliberation
leading to consensus. Decision making is controlled by the headman in 13.5% of villages
and by the elites in a further 13.5%. In the remaining 5%, decisions are taken by majority
voting.16
The variation in governance structures plays two key roles in our analysis. First, it
allows us to separate villages where decisions are mostly controlled by the elites from villages
where decisions are more likely to be taken democratically. By definition, our model applies
only to the latter, as the elites do not need the support of another group when they control
decision making. Second, we exploit the variation in governance systems across villages to
proxy for the preferences of the elites. Intuitively, if governance systems vary in the level
of control attributed to the elites, a revealed preference argument implies that outcomes
observed in villages where the elites have more control must be preferred by the elites. We
discuss this issue in more detail in Section 3.1.2.
To proceed, we need to establish under which of the four governance systems, if any,
decisions are mostly controlled by the elites as opposed to being taken democratically.
Since the headman typically belongs to the elites and is only accountable to the district
government rather than to the villagers, at face value the elites should have more power
under the "elite control" and "headmen control" regimes whereas "consensus building"
and "voting" should be more likely to give voice to the majority. For brevity, we label
the former two systems "oligarchies" and the latter two "democracies". In practice, the
16The percentage of villages for which adat and current governance systems are the same is 90% for
"consensus building", 83% for "headman decides", 60% for "village elites decide" and 92% for "voting".
14
difference between the two systems might be less clear-cut if, for instance, the elites are
able to dominate village meetings. As discussed below, however, the identification only
relies on the assumption about the ranking, namely that the elites have more control when
the governance system is "oligarchic" vs "democratic".
Throughout, we exploit observed cross-village variation in public finance outcomes,
governance and ethnic composition. Compared to cross-country, or even cross-state analy-
ses, we are thus able to control for unobservable heterogeneity at the smallest possible
political and administrative unit: the district. This increases our confidence that the es-
timates do not capture a wide range of correlated unobservables that vary across district,
although since the cross-village variation has not been randomly generated we acknowledge
that the estimates might be polluted by unobservables that vary across villages within a
district.
The key prediction of the model is that the effectiveness of democracy in fostering
the interests of the poor depends on how heterogeneous their preferences are. When the
preferences of the poor are diverse, the elites and the poor ethnic group might be able to
form a ruling coalition, and when this happens, policy outcomes are closer to the preferences
of the elites. It is key to note that the elites and the poor ethnic group need not establish
a formal political party for diversity to affect outcomes as predicted by the model. Rather,
"parties" can be interpreted as informal coalitions or voting blocs, as long as they act as
coordinating devices between the two groups. We thus test the effect of diversity in reduced
form, i.e. directly on public finance outcomes. As argued below, reduced form evidence will
still allow us to distinguish the predictions of our model from alternative theories.
The empirical test requires variation in the extent of preference diversity within society,
which determine the viability of the coalition, and information on the differences between
the preferences of the poor and the preferences of the elites. We now discuss how this key
variable can be measured in the Indonesian context.
3.1.1 The Viability of the Coalition
Indonesia is one of the world’s most ethnically diverse countries, counting seven hundred
living languages and over one thousand different ethnic groups (Population Census 2000).
Importantly for our analysis, ethnicity is often seen as a key source of difference for pref-
erences over public goods. This idea was first formalized and tested in the context of U.S.
15
jurisdictions by Alesina et al 1999, and has since been a cornerstone of models of ethnic
diversity (e.g. Esteban and Ray 1999, Fernandez and Levy, 2008). Alesina and La Ferrara
(2005) present a comprehensive review of the literature on this topic, both from developed
and developing countries. In the context of Indonesia, the existing evidence is in line with
the assumption that different ethnic groups have different preferences regarding public good
provisions. In particular, the evidence indicates that in ethnically diverse villages house-
holds, especially those who belong to the ethnic minority, contribute less money and time
to public projects (Okten and Okonkwo-Osili 2004).
The fact that ethnic composition varies across villages even within the same district
provides the required variation in the viability of the coalition since this depends on the
relative size of the elite group and of the different ethnic groups. In the simplest case of
three groups, the general poor group P, the poor ethnic group E and the rich elites R we
have two possibilities:
⎧⎨⎩ NR +NE > 0.5 the coalition of R and E can win a majority vote
NR +NE < 0.5 only P can win a majority vote
Where Ni indicates the number of people belonging to group i. Since we do not observe
NR, our empirical strategy is informed by the fact that for a given NR the probability that
the elites and the ethnic minority can win a majority vote depends on the size of the ethnic
group (NE). Namely, Pr(NR +NE > 0.5) = F (NE|NR), with F 0 > 0.
The village module of IFLS2 contains information on the population shares of the three
main ethnic groups in each village. In practice, however, most of the population in most
villages belongs to either one or two groups, as the third ethnic group accounts for less than
5% in 80% of the sample villages. For the purpose of the analysis we therefore measure NE
as the population share of the two minority groups. Results are robust to only measuring
the largest of the two minority groups, or restricting the analysis to villages with one or
two ethnicities only.
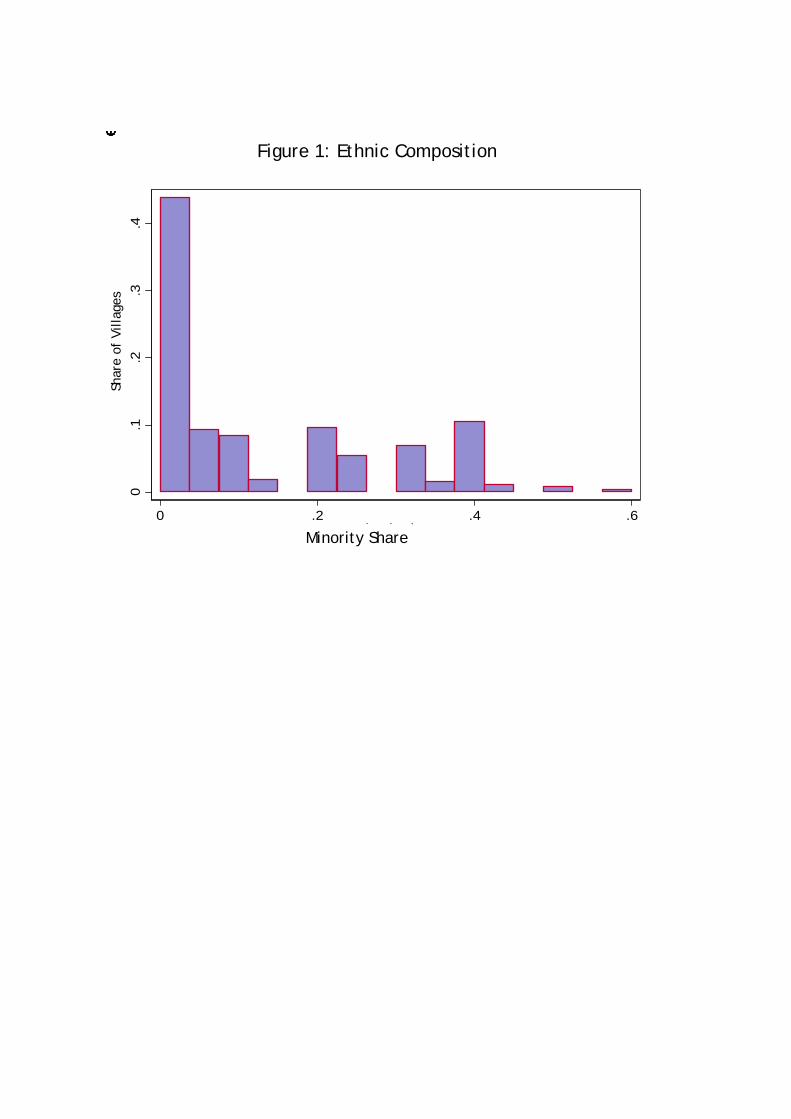
Figure 1 shows that just about half of the villages are ethnically homogeneous, with
the minority accounting for less than 5% of the population. The remaining villages ex-
hibit considerable heterogeneity, with extreme cases in which the dominant group barely
constitutes a majority. There is considerable variation both between and within districts.
The between standard deviation of the minority share is .09, the within standard deviation
16
is .12. In what follows we will use the minority share as a proxy for the viability of the
coalition.
3.1.2 The Preferences of the Elites
To test whether diversity among the poor is correlated with outcomes that are closer to the
preferences of the elites, we test whether the difference in the provision of a range of public
goods between oligarchies and democracy is smaller when the coalition between the elites
and the poor ethnic group is more likely to be viable. The test is based on the intuition
that outcomes observed in villages where the elites have more control should be preferred
by the elites.
This test relies on two assumptions. First we need differences in governance systems to
reflect the balance of power in practice. To the extent that the elites are able to dominate
village meetings or that the majority’s rebellion threat acts as a disciplining device on the
headman, we are less likely to find that outcomes differ by governance structure, namely
we can only provide lower bound estimates. The second assumption is that the preferences
of the elites are uncorrelated with the governance system, so that the choices made by
the elites in oligarchic villages are an appropriate counterfactual for the choices the elites in
democratic villages would want to make if they had more control over decision making. One
piece of evidence in support of this assumption is that democratic and oligarchic villages are
remarkably similar on a host of observable characteristics. Table 1 shows that democratic
and elite-dominated villages have similar minority shares, are of similar size and have similar
communication, transport and financial facilities. As a proxy for development, we report
the share of villages in each category that received Inpres Deas Tertinggal (IDT) funds in
1997. IDT was the main antipoverty program at the time and was targeted to the poorest
villages. Democratic and elite-dominated villages are equally likely to receive IDT funds.
To test whether diversity among the poor is correlated with outcomes that are closer
to the preferences of the elites we estimate:
(1) yvd = α+ βDv + γDv ∗Mv + δMv + ξd + εvd
where yvd is outcome of interest in village v in district d, for instance the logarithm of
elementary schools per capita. α is a constant that captures the average level of yvd in eth-
nically homogeneous oligarchies. Dv equals 1 if adat laws prescribe democratic governance
17
in village v, whereas Dv equals 0 if adat laws attribute decision making power to the elites.
Mv is the population share of ethnic minorities, which proxies for the probability that the
coalition of the elites and the ethnic minorities can win a majority vote. Finally, ξd are
districts fixed effects that absorb unobservable district heterogeneity. To take into account
that villages in the same districts might be subject to similar shocks we cluster εvd at the
district level.
Throughout, the coefficient of interest is γ, that is the measure of the effect of di-
versity on the difference between public finance outcomes when decision-making is demo-
cratic as opposed to being dominated by the elites. The theory predicts that the differ-
ence between governance systems should be smaller when the coalition is viable, that is
sign(γ) = −sign(β).
The difference between ethnically homogeneous democracies and ethnically homoge-
neous oligarchies is captured by β. Naturally, β cannot be interpreted as the causal effect
of democracy on outcomes because —even if the difference in governance structure dates
centuries back— democratic governance might proxy for correlated unobservables that have
a persistent effect on the outcomes of interest. The coefficients δ and δ+ γ capture the
correlation between diversity and outcomes in oligarchies and democracies, respectively.
Similarly, the causal effect of diversity cannot be identified with the data at hand because
diversity might be correlated with unobservables that affect the outcome of interest.
The problem of correlated unobservables is however partially ameliorated by the fact
that the coefficients are identified from the variation within district, so that all district
specific omitted characteristics that might create a spurious correlation between the outcome
of interest and the right hand side variables are absorbed by the district fixed effect ξd. The
causal effect of democracy and diversity on public finance outcomes can only be identified
by creating or exploiting existing variation in governance structure and ethnic composition
that is known to be uncorrelated with the outcomes of interest. This is, to the best of our
knowledge, unavailable in our or similar contexts. A recent exception is Olken (2010)’s field
experiment that assigns randomly the political mechanism used to choose public projects
in a sample of Indonesian villages. The findings indicate that, compared to representative
village meetings, plebiscites dramatically increase satisfaction and legitimacy, but have little
effect on the choice of project. The focus of Olken (2010), namely the distinction between
different political processes within democracy, is thus complementary to our analysis of the
18
differences between democracy and elite rule.
In our setting, measurement error is a further cause for concern. The concern arises
because the variation in governance, Dv, derives entirely from differences in adat laws and
these measure governance only to the extent that the headman respects them. Clearly, if
no headmen were to respect adat laws we would find no difference in public good provision
between democracies and oligarchies. Since we do find a difference, we are left with two
cases. In the case of classical measurement error, the estimates of the difference in public
policy outcomes by governance system β would be biased downwards. A thornier issue
arises if the headman’s decision to respect adat laws were influenced by the level of ethnic
diversity in the village. Given that the headmen inevitably belong to the elites, our model
suggests that these have less power in ethnically homogeneous democracies. This implies
that headmen of homogeneous villages should have a stronger incentive to abandon demo-
cratic institutions. If this is the case, our estimates of the difference between ethnically
homogeneous democracies and oligarchies β and of the effect of ethnic diversity γ are both
biased downwards.
3.2 Findings
Table 2 reports the means and standard deviations of a range of local public goods, divided
in four sectors: health, education, utilities and security and voluntary labor programs. The
security programs consist of funding a group made of local residents —usually men— who
provide security to the neighborhood at night by walking around or guarding the entrance
to the community. Voluntary labor programs employ local residents in community-level
development activities, such as paving a road, repairing a bridge, removing mud after the
rainy season, and clearing ravines. Table 2 highlights that there is considerable variation in
public outcomes both within and between districts.
The responsibilities of the village government and the local community vary across
sectors and across activities within the same sector. In the health sector, village institutions
are directly responsible for managing midwives, delivery posts and community health posts.
In the education sector, the local institutions are responsible for the maintenance of school
buildings and the constructions of new classrooms. The community security and voluntary
labor programs are entirely organized at the local level. Finally, in the utilities sector,
the village government and the local community are directly responsible for providing and
19
managing sewage, water and waste collection services (Frankenberg and Thomas 1999).
The village government and the local community are however also likely to affect the
choices of public goods that are formally decided at the central level because they determine
the amount of resources available for these goods. Indeed, Suharto’s New Order placed
great emphasis on the principle of gotong royong -"mutual assistance"- which, applied to
the construction and management of local public goods, implied a collaboration between
the central government, that would provide funds, and the community that was expected
to provide volunteer labor and building materials (Bowen 1996, Rao 2004). For instance,
the local community is responsible for managing volunteers to staff health posts, while the
central government is in charge of the provision of inputs (Frankenberg and Thomas 1999).
As locally and centrally provided inputs are complementary, the level of the former is
likely to affect the latter, especially as existing estimates indicate that the value of the mon-
etary and labor contributions provided by the local community is sizeable relative to the
cost of public goods and to the village budget. In particular, community contributions ac-
counted for 37% of the total cost of the sample of local public goods analyzed by Rao (2005),
while Olken and Singhal (2009) estimate the value of monetary and labor contributions to
be 1.6 times larger than all other sources of revenue for village government.
Given the importance of community contributions to all public goods, we analyze public
choices both on dimensions that are directly decided and managed at the local level and
dimensions that are decided at the central level. We note that to the extent that community
choices have little bearing on the provision of public goods that are chosen at the central
level, our estimates of the effect of local decision-making on the provision of those goods
are biased towards zero.
We report the estimates of (1) in Table 3. Three patterns are noteworthy. First, the
findings indicate that preferences over public goods vary by wealth class. Indeed, the dif-
ference between ethnically homogeneous democracies and oligarchies (β), varies by sector.
Villages with democratic governance have more health and education facilities. The differ-
ence is significantly different from zero at conventional levels for most outcomes, from health
posts per capita to elementary schools per capita. In the education sector, differences in
numbers of facilities are accompanied by differences in prices and quality: in democracies
school fees are lower, the teacher/pupil ratio is higher and so is the share of schools offering
a free lunch.
20
In contrast, villages with democratic governance are less likely to have neighborhood
security and voluntary labor programs and a smaller share of the population is involved
in these. This is consistent with the anecdotal evidence that these programs are used
by the elites to extract contributions in terms of free labor from the lower classes in the
village. Beard (2007) presents evidence that in these villages rich households are less likely
to contribute free labor to community programs.
Finally, there seems to be no difference in the levels of utilities. Households in ethnically
homogeneous democratic and oligarchic villages have the same access to electricity, piped
water, sewage and waste collection services.
The second main finding is that outcomes are more likely to reflect the preferences of
the elites in diverse democracies. Indeed, whenever there is a difference between democracies
and oligarchies, namely whenever we can reject the hypothesis that β = 0, the difference
is decreasing in the level of ethnic diversity. This is true both when the level is higher in
democracy, namely when β > 0 as in education and health, and when the level is lower
in democracy, namely when β < 0 as in the provision of community security services and
voluntary labor. Diversity does not affect outcomes, that is δ = γ = 0 when democracies
and oligarchies do not differ, that is when β = 0, as is the case for utilities.
It is important to note that this pattern cannot be ascribed to differences in local
control, namely the sign and magnitude of β and γ do not vary systematically between
public goods provided at the village level and those determined by the center. For instance,
in the education sector, provision is higher in democracy (β > 0) and decreasing in diversity
(γ < 0) both for class size —decided at the village level— and for number of schools, which
is chosen centrally. Likewise, in the utility sector β = γ = 0 both for waste collection
—organized at the village level— and for electricity, which is provided centrally. In other
words, the sign and magnitude of β and γ vary systematically with the type of public good
rather than with local control.
Third, we note that the effect of diversity on the difference between governance systems
is sizeable. For convenience, Table 3 reports the computed effect of democracy evaluated at
the mean level of the minority share (.12) and its standard error. Throughout, the effect of
democracy in homogeneous societies is at least double the effect of democracies in diverse
societies. For instance, the number of community health posts per 1000 inhabitants is 12%
higher in homogeneous democracies. The difference falls to 6% when the minority share is
21
.12, and this difference is not significantly different from zero at conventional levels.
3.3 Alternative Interpretations
The fact that when there is diversity in preferences among the poor, outcomes are more likely
to reflect the preferences of the elites, allows us to rule out that in this context, diversity
affects outcomes through some of the other mechanisms highlighted in the literature. First,
the fact that the sign of the effect of diversity differs across a range of public goods allows
us to rule out alternative theoretical models that predict an unambiguously negative effect
of diversity on the level of public good provision. In particular, we find that diversity
reduces the level of public good provision only when the level in democracy is higher than
in oligarchy. When the level is higher in oligarchy, as in the case of security and voluntary
labor programs, diversity actually increases the level of provision. When democracies and
oligarchies do not differ, diversity has no effect on the level of provision.
Second, the findings also shed light on the mechanism through which diversity affects
outcome. Alternatively to the assumption that individuals belonging to different groups
have different tastes for public policies, existing theoretical contributions have highlighted
two channels: (i) that individuals do not internalize, or put a negative weight, on the
consumption of other groups and (ii) that individuals of different groups do not like to
consume public goods together. Our findings do not lend support to either channel. More
specifically, the finding that the effect of diversity can be positive or zero contradicts the
assumption that individuals dislike contributing resources to goods that benefit members of
other ethnic groups. In addition, since the effect of diversity does not depend on whether
people of different groups need to consume it together —as in the case of education— or not—
as in the case of health facilities— does not lend support to the assumption that diversity
reduces public good provision because individuals dislike interacting with others belonging
to different groups.
4 Conclusion
Does democracy foster the interests of the poor? Our analysis shows that the answer
depends on the cohesiveness of the lower classes. We show that when the poor are divided
into groups with different preferences over public goods and politicians from different groups
22
can form coalitions, the level of diversity endogenously determines the power of the wealthy
elites in influencing policy outcomes. The elites and the ethnic group can indeed rule in
a coalition that fosters the interests of both groups over the general interests of the poor.
Evidence from local government outcomes in Indonesian villages suggests that policies are
closer to the preferred outcomes of the elites when the polity is divided along ethnic lines.
The central implication of our analysis is that political institutions interact with the
composition of the polity to determine economic policy. To compare democracy with alter-
native governance structures, such as oligarchy, it is key to identify the dimensions along
which preferences might differ, as this determines which coalitions can win a majority vote.
The empirical application focuses on differences in preferences due to ethnicity as ethnic
divisions are salient in the Indonesian context. The theoretical insight, however, applies to
differences in preferences deriving from any other source. While we are not aware of any
other study that analyzes these issues directly, evidence from election surveys in Western
countries is consistent with the idea that the elites and a subset of the poor support the
same party. The surveys indeed reveal that, compared to their secular counterparts, the
religious poor are more likely to vote for parties that oppose income redistribution and,
as such, have the support of the wealthiest segments of the population (Huber and Stanig
(2007)).
Finally, note that our analysis indicates that it might be in the interest of rich elites to
"divide and rule", that is, to amplify differences in preferences among poor groups, even if
some of the gains have to be shared with some segments of the poor. While it is not clear
whether the salience of such differences in preferences is a strategic choice of politicians or
rich interest groups, the question of whether it is subject to their influence is essentially an
empirical one. Our paper indicates that the possibility of dividing opinions on such issues
may be desirable for the elites.
23
Appendix
Proof of Proposition 1: The text considers the partition R|P |E and explains
why the unique equilibrium has P running alone and winning. If the partition is RP |E or
PE|R, then the equilibrium outcome is such that e = 0 in the former and s = 0 in the
latter. However, for any equilibrium outcome, P would rather split, and reach the partition
R|P |E where he gets his best outcome. Consider the partition RE|P. It must be that RE
win. If not, and P wins, the coalition is not best responding, as there are policies in its
Pareto set (for example, with small e and s) that by concavity, both would prefer to the
ideal policy of P. Thus RE must win, so in equilibrium they offer a policy that both the R
and E voters prefer to that of P. This implies that neither coalition member would break
the coalition. Moreover, the coalition policy must satisfy both e > 0 and s > 0. Finally,
consider the grand coalition REP. Any policy in the Pareto set of society can win then -
but then any two members can split and find an equilibrium winning policy in the resulting
partition that will make both better off (for example, if s > 0, then E and P can deviate).¥
24
References
[1] Acemoglu, D. and James A. Robinson (2005), " Economic Origins of Dictatorship and
Democracy", Cambridge University Press, Cambridge.
[2] Acemoglu, D. and James A. Robinson (2006), "Persistence of Power, Elites and Insti-
tutions", CEPR Discussion Paper No. 5603.
[3] Alesina, A., R. Baqir and W. Easterly (1999), "Public Goods and Ethnic Divisions",
Quarterly Journal of Economics, 114(4), 1243-1284.
[4] Alesina, A. and E. La Ferrara (2005), "Ethnic Diversity and Economic Performance",
Journal of Economic Literature, 63, 762-800.
[5] Alesina and Spolaore (1997), "On the Number and Size of Nations", Quarterly Journal
of Economics vol. 112, No. 4, Pages 1027-1056.
[6] Austen-Smith, D. (1987), "Interest Groups, Campaign Contributions, and Probabilistic
Voting", Public Choice 54, pp. 123—139.
[7] Austen-Smith, D. and M. Wallerstein (2006), "Redistribution in a Divided Society",
Journal of Public Economics, 90, 1789-1823.
[8] Battaglini, M, and S. Coate (2008), "A Dynamic Theory of Public Spending, Taxation
and Debt", American Economic Review 98(1), pp. 201-236.
[9] Barro, R. (1997), "Determinants of Economic Growth: A Cross-country Empirical
Study", MIT University Press, Cambridge MA.
[10] Beard, V.A. (2007), "Household Contributions to Community Development in Indone-
sia", World Development, 35(4), 607-625.
[11] Bergstrom, T. (1979), "When Does Majority Rule Supply Public Goods Efficiently?,"
Scandinavian Journal of Economics vol. 81(2), pages 216-26.
[12] Besley, T., R. Pande and V. Rao (2005), "Participatory Democracy in Action: Survey
Evidence from India", Journal of the European Economics Association Papers and
Proceedings, Vol. 3 (2-3), 648-657.
25
[13] Besley, T. and M. Kudamatsu (2006), "Health and Democracy", American Economic
Review, 96, 313-318.
[14] Besley T. and S. Coate (2003), "Centralized versus Decentralized Provision of Local
Public Good", Journal of Public Economics, pp. 2611—2637.
[15] Besley, T. and S. Coate (1997), "An Economic Model of Representative Democracy",
Quarterly Journal of Economics, 108, 85-114.
[16] Bloch, F. (1996), "Sequential Formation of Coalitions in Games with Externalities and
Fixed Payoff Division," Games and Economic Behavior vol. 14(1), pp. 90-123,
[17] Bowen J (1986) On the Political Construction of Tradition: Gotong Royong in Indone-
sia.Journal of Asian Studies 45(3), pp. 545—561
[18] Collier, P. (2000), "Ethnicity, Politics and Economic Performance", Economics and
Politics, 12(3), 225-246.
[19] Esteban, J. and D. Ray (1999), "Conflict and Distribution", Journal of Economic
Theory, 87, 379-415.
[20] Fernandez, R. and G. Levy (2008), "Diversity and Redistribution", Journal of Public
Economics, vol. 92 (5-6). pp. 925-943.
[21] Frankenberg, E. and D. Thomas. (1997) “The Indonesia Family Life Survey (IFLS):
Study Design andResults from Waves 1 and 2. DRU-2238/1-NIA/NICHD.
[22] Huber, J. and P. Stanig (2007), "Voting Polarization on Redistribution across Democ-
racies", Working Paper, Columbia University.
[23] Jackson, M. and B. Moselle (2001), "Coalition and Party Formation in a Legislative
Voting Game", J. Econ Theory 103 (2001), pp. 1-39.
[24] Kudamatsu, M. (2007), "Has Democratization Reduced Infant Mortality in sub-
Saharan Africa? Evidence from Micro Data", mimeo LSE
[25] La Ferrara, E. (2002), "Inequality and Group Participation: Theory and Evidence from
Rural Tanzania", Journal of Public Economics, 85, 235-73.
26
[26] Lee, W. and J. Roemer (2006), "Race and Redistribution: A Solution to the Problem
of American Exceptionalism", Journal of Public Economics, 90, 1027-1052.
[27] Levy, G. (2005), "The Politics of Public Provision of Education", Quarterly Journal of
Economics, 120(4), 1507-1534.
[28] Levy, G. (2004), "A Model of Political Parties", Journal of Economic Theory, 115(2),
250-272.
[29] Lindsey, T. (1999), "An Overview of Indonesian Law" in Lindsey, T ed. "Indonesia :
law and society", Leichhardt, N.S.W. : Federation Press.
[30] Lizzeri, A. and N. Persico (2001), "The Provision of Public Goods under Alternative
Electoral Incentives," American Economic Review, American Economic Association,
vol. 91(1), pp. 225-239.
[31] Llavador, H. and R.J. Oxoby (2005), "Partisan Competition, Growth, and the Fran-
chise", The Quarterly Journal of Economics, vol. 120(3), 1155-1192.
[32] Morelli, M. (2004), "Party Formation and Policy Outcomes under Different Electoral
Systems", The Review of Economic Studies, vol. 71(3), pp. 829-853.
[33] Mulligan, Casey B. & R. Gil & X. Sala-i-Martin (2004), "Do Democracies Have Differ-
ent Public Policies than Nondemocracies?", Journal of Economic Perspectives, Amer-
ican Economic Association, vol. 18(1), 51-74.
[34] Olken, B. and M. Singhal (2009), "Informal Taxation", NBER Working Paper No.
15221
[35] Olken, B. (2006) "Corruption and the Costs of Redistribution" Journal of Public Eco-
nomics 90 (4-5), pp. 853-870.
[36] Olken, B. (2010) "Direct Democracy and Local Public Goods: Evidence from a Field
Experiment in Indonesia" American Political Science Review, forthcoming.
[37] Okten C. and U. Okonkwo-Osili (2004) "Contributions in heterogeneous communities:
Evidence from Indonesia" Journal of Population Economics, 17(4): 1432-1475.
27
[38] Osborne, M.J. and R. Tourky (2008), "Party Formation in Single-Issue Politics," Jour-
nal of the European Economic Association vol. 6(5), pp. 974-1005.
[39] Osborne, M. and A. Slivinski (1996), "A Model of Political Competition with Citizen-
Candidates", Quarterly Journal of Economics, 111, 65-96.
[40] Persson, T. and G. Tabellini (2006), "Democratic Capital: The Nexus of Political and
Economic Change", NBER Working Paper No. 12175.
[41] Persson, T. and G. Tabellini (2004), "Constitutions and Economic Policy," Journal of
Economic Perspectives vol. 18(1), pp. 75-98.
[42] Persson, T. and G. Tabellini (2003), The Economic Effects of Constitutions, MIT Press.
[43] Przeworski, A. and F. Limongi (1993), "Political Regimes and Economic Growth", The
Journal of Economic Perspectives, Vol.7, No.3, 51-69.
[44] Rao, V. (2005), Symbolic Public Goods and the Coordination of Collective Action: A
Comparison of Local Development in India and Indonesia World Bank Policy Research
Working Paper No. 3685.
[45] Ray, D. and R. Vohra (1997), "Equilibrium Binding Agreements", Journal of Economic
Theory, 73, 30-78.
[46] Rodrik, D. (1999), "Democracies Pay High Wages", Quarterly Journal of Economics,
114, 707-738.
[47] Roemer, J. (1998), "Why Don’t The Poor Expropriate the Rich", Journal of Public
Economics, 70, 399-424.
28
.4Figure 1: Ethnic Composition
de
.3.4
actio
n
Figure 1: Ethnic Composition
deof
Vill
ages
0.1
.2.3
.4Fr
actio
n
Figure 1: Ethnic Composition
deSh
are
of V
illag
es0
.1.2
.3.4
Frac
tion
0 .2 .4 .6minorityshare
Figure 1: Ethnic Composition
de
Minority Share
Shar
e of
Vill
ages
0.1
.2.3
.4Fr
actio
n
0 .2 .4 .6minorityshare
Figure 1: Ethnic Composition
de
Minority Share
Shar
e of
Vill
ages
0.1
.2.3
.4Fr
actio
n
0 .2 .4 .6minorityshare
Figure 1: Ethnic Composition
de
Minority Share
Shar
e of
Vill
ages
0.1
.2.3
.4Fr
actio
n
0 .2 .4 .6minorityshare
Figure 1: Ethnic Composition
de
Minority Share
Shar
e of
Vill
ages
0.1
.2.3
.4Fr
actio
n
0 .2 .4 .6minorityshare
Figure 1: Ethnic Composition
de
Minority Share
Shar
e of
Vill
ages
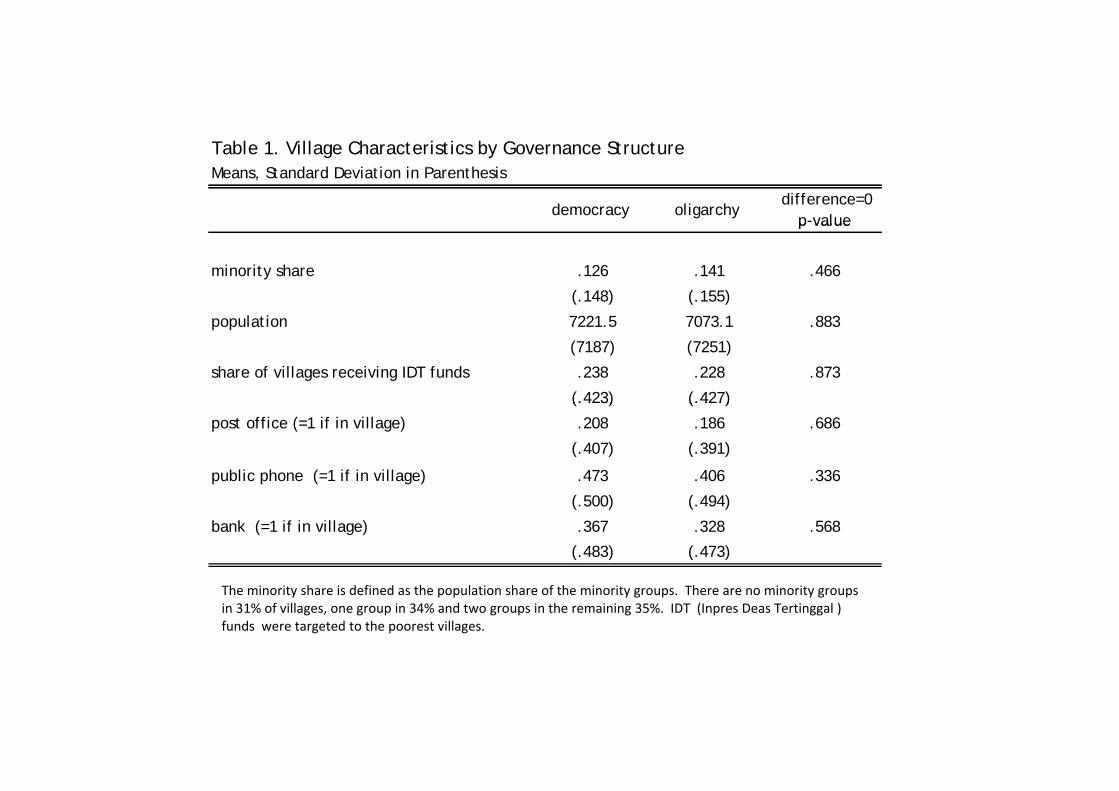
Table 1. Village Characteristics by Governance StructureMeans, Standard Deviation in Parenthesis
democracy oligarchy difference=0
p-value p value
minority share .126 .141 .466
(.148) (.155)
lpopulation 7221.5 7073.1 .883
(7187) (7251)
share of villages receiving IDT funds .238 .228 .873
(.423) (.427)(.423) (.427)
post office (=1 if in village) .208 .186 .686
(.407) (.391)
public phone (=1 if in village) .473 .406 .336
(.500) (.494)
bank (=1 if in village) .367 .328 .568
(.483) (.473)
The minority share is defined as the population share of the minority groups There are no minority groupsThe minority share is defined as the population share of the minority groups. There are no minority groups in 31% of villages, one group in 34% and two groups in the remaining 35%. IDT (Inpres Deas Tertinggal ) funds were targeted to the poorest villages.
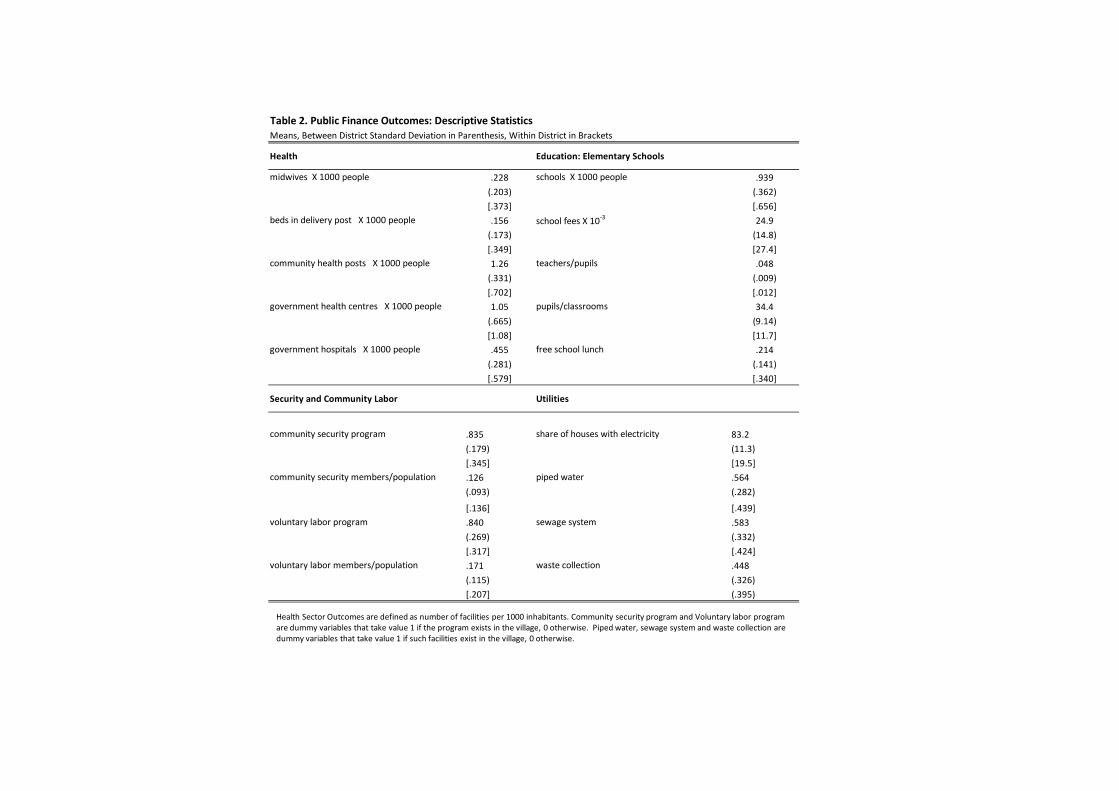
Table 2. Public Finance Outcomes: Descriptive StatisticsMeans, Between District Standard Deviation in Parenthesis, Within District in Brackets
Health Education: Elementary Schools
midwives X 1000 people .228 schools X 1000 people .939
(.203) (.362)
[.373] [.656]beds in delivery post X 1000 people .156 school fees X 10‐3 24.9
(.173) (14.8)
[.349] [27.4]community health posts X 1000 people 1.26 teachers/pupils .048
(.331) (.009)
[.702] [.012]government health centres X 1000 people 1.05 pupils/classrooms 34.4
(.665) (9.14)
[1.08] [11.7]government hospitals X 1000 people .455 free school lunch .214
(.281) (.141)
[.579] [.340]
Security and Community Labor Utilities
community security program .835 share of houses with electricity 83.2
(.179) (11.3)
[.345] [19.5]community security members/population .126 piped water .564
(.093) (.282)
[.136] [.439]voluntary labor program .840 sewage system .583
(.269) (.332)
[.317] [.424]voluntary labor members/population .171 waste collection .448
(.115) (.326)
[.207] (.395)
Health Sector Outcomes are defined as number of facilities per 1000 inhabitants. Community security program and Voluntary labor program are dummy variables that take value 1 if the program exists in the village, 0 otherwise. Piped water, sewage system and waste collection are dummy variables that take value 1 if such facilities exist in the village, 0 otherwise.
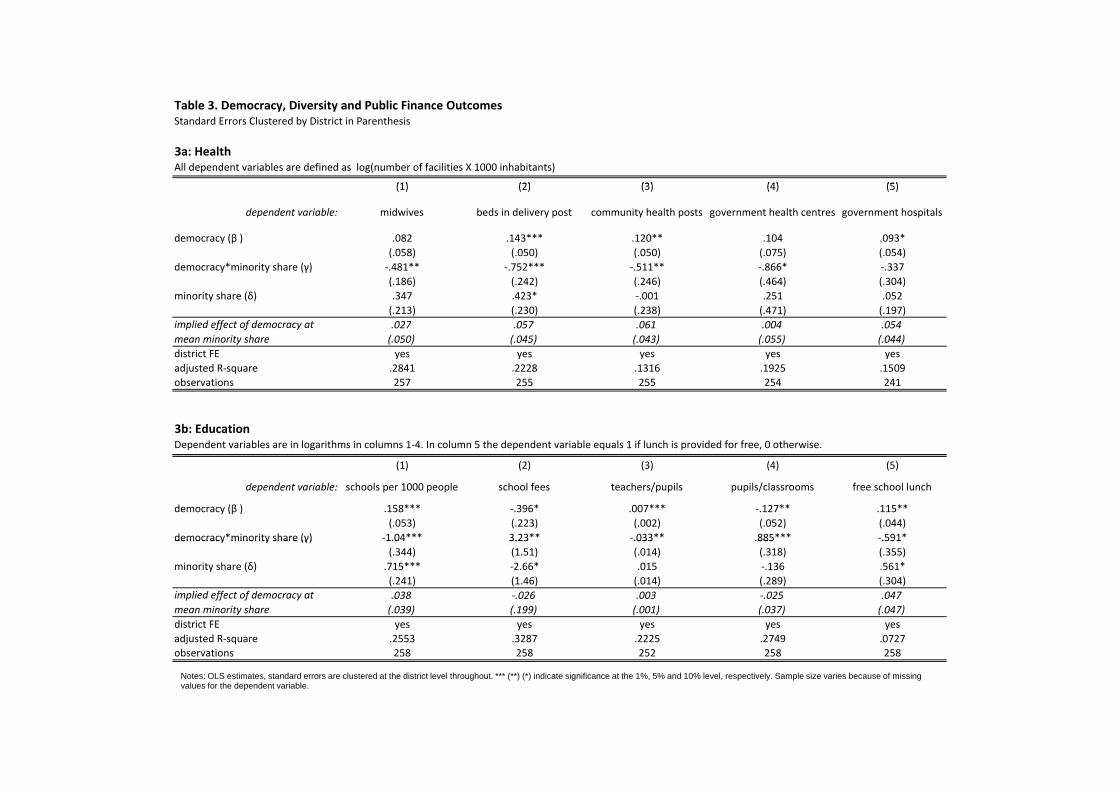
Table 3. Democracy, Diversity and Public Finance Outcomes Standard Errors Clustered by District in Parenthesis
3a: HealthAll dependent variables are defined as log(number of facilities X 1000 inhabitants)
(1) (2) (3) (4) (5)(1) (2) (3) (4) (5)
dependent variable: midwives beds in delivery post community health posts government health centres government hospitals
democracy (β ) .082 .143*** .120** .104 .093*(.058) (.050) (.050) (.075) (.054)
democracy*minority share (γ) ‐.481** ‐.752*** ‐.511** ‐.866* ‐.337y y (γ)(.186) (.242) (.246) (.464) (.304)
minority share (δ) .347 .423* ‐.001 .251 .052(.213) (.230) (.238) (.471) (.197).027 .057 .061 .004 .054(.050) (.045) (.043) (.055) (.044)
district FE yes yes yes yes yes
implied effect of democracy at mean minority share
adjusted R‐square .2841 .2228 .1316 .1925 .1509observations 257 255 255 254 241
3b: Education Dependent variables are in logarithms in columns 1‐4. In column 5 the dependent variable equals 1 if lunch is provided for free, 0 otherwise.
(1) (2) (3) (4) (5)
dependent variable: schools per 1000 people school fees teachers/pupils pupils/classrooms free school lunch
democracy (β ) .158*** ‐.396* .007*** ‐.127** .115**(.053) (.223) (.002) (.052) (.044)
democracy*minority share (γ) ‐1.04*** 3.23** ‐.033** .885*** ‐.591*democracy minority share (γ) 1.04 3.23 .033 .885 .591(.344) (1.51) (.014) (.318) (.355)
minority share (δ) .715*** ‐2.66* .015 ‐.136 .561*(.241) (1.46) (.014) (.289) (.304).038 ‐.026 .003 ‐.025 .047(.039) (.199) (.001) (.037) (.047)
district FE yes yes yes yes yes
implied effect of democracy at mean minority share
y y y y yadjusted R‐square .2553 .3287 .2225 .2749 .0727observations 258 258 252 258 258
Notes: OLS estimates, standard errors are clustered at the district level throughout. *** (**) (*) indicate significance at the 1%, 5% and 10% level, respectively. Sample size varies because of missing values for the dependent variable.
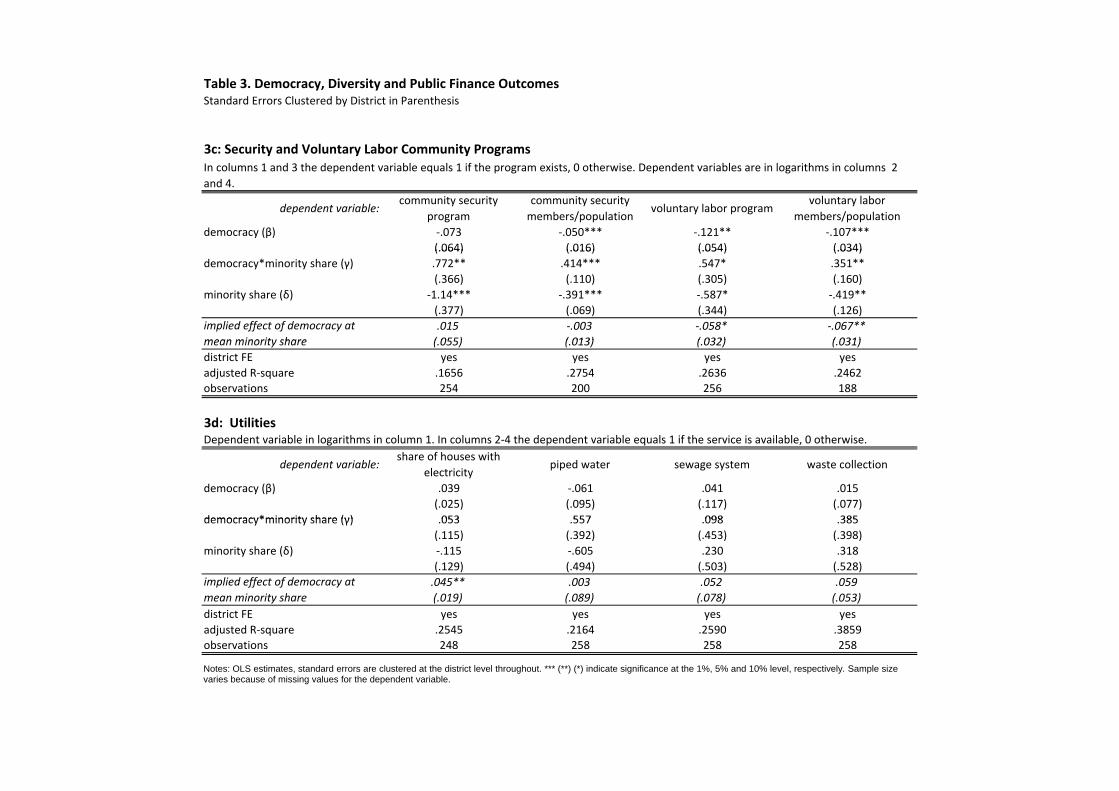
Table 3. Democracy, Diversity and Public Finance Outcomes Standard Errors Clustered by District in Parenthesis
3c: Security and Voluntary Labor Community Programs
dependent variable:community security
programcommunity security members/population
voluntary labor programvoluntary labor
members/populationdemocracy (β) ‐.073 ‐.050*** ‐.121** ‐.107***
(.064) (.016) (.054) (.034)
In columns 1 and 3 the dependent variable equals 1 if the program exists, 0 otherwise. Dependent variables are in logarithms in columns 2 and 4.
(.064) (.016) (.054) (.034)democracy*minority share (γ) .772** .414*** .547* .351**
(.366) (.110) (.305) (.160)minority share (δ) ‐1.14*** ‐.391*** ‐.587* ‐.419**
(.377) (.069) (.344) (.126).015 ‐.003 ‐.058* ‐.067**( 055) ( 013) ( 032) ( 031)
implied effect of democracy at mean minority share (.055) (.013) (.032) (.031)district FE yes yes yes yesadjusted R‐square .1656 .2754 .2636 .2462observations 254 200 256 188
3d: Utilities
mean minority share
Dependent variable in logarithms in column 1. In columns 2‐4 the dependent variable equals 1 if the service is available, 0 otherwise.
dependent variable:share of houses with
electricitypiped water sewage system waste collection
democracy (β) .039 ‐.061 .041 .015(.025) (.095) (.117) (.077)
democracy*minority share (γ) 053 557 098 385democracy*minority share (γ) .053 .557 .098 .385(.115) (.392) (.453) (.398)
minority share (δ) ‐.115 ‐.605 .230 .318(.129) (.494) (.503) (.528).045** .003 .052 .059(.019) (.089) (.078) (.053)
implied effect of democracy at mean minority sharedistrict FE yes yes yes yesadjusted R‐square .2545 .2164 .2590 .3859observations 248 258 258 258
Notes: OLS estimates, standard errors are clustered at the district level throughout. *** (**) (*) indicate significance at the 1%, 5% and 10% level, respectively. Sample size varies because of missing values for the dependent variable.Notes: OLS estimates, standard errors are clustered at the district level throughout. *** (**) (*) indicate significance at the 1%, 5% and 10% level, respectively. Sample size varies because of missing values for the dependent variable.