Embed Size (px)
Citation preview
Diversity of benthic macroinvertebrates in Littoral zone of Shahpura Lake, Bhopal,
Madhya Pradesh
Sweta Priyam, Dr. Abha Swarup* and Dr. Pradeep Srivastava**,
Department of Environmental Science and Limnology,
Barkatullah University, Bhopal, Madhya Pradesh.
*Director, MPCST, Bhopal, M.P.
**HOD, Department of Environmental Science and Limnology,
Barkatullah University, Bhopal, M.P.
Abstract
Water is one of the most critical requirement for survival along with air and land for all the
organisms inhabiting on earth. Bhopal, also famous as city of lakes, has been taken as study it
has number of lakes serving daily needs of the city. Shahpura lake, along with Upper and Lower
lake is the most important lakes of the city serving multipurpose need of the city of drinking,
agriculture etc. Healthy interaction between biotic and abiotic factor in aquatic and terrestrial
area determines its abundance of the area. Disturbances in any one of the factors leads to
disruption of the whole cycle of system and can lead to risk the rate of survival. Therefore, it is
important to keep a check on the water physical and chemical health for sustainable
development. Likewise, aquatic organisms serves important role in deciding the health of the
lakes, as certain organisms act as indictor of pollution or pollution free environment. Today,
there are many indices used to assess the health of freshwater systems – and benthic organisms
are the foundation for many of them.
Key words: littoral zone, macro benthic invertebrates, diversity index.
Introduction
Aquatic and terrestrial ecosystem are major source of medicine, food, energy, shelter, and raw
materials that we use and need in daily lives. Aquatic wildlife is important sources of food,
energy, atmospheric oxygen, buffers against new diseases, pests, and predators, and protection
GSJ: Volume 7, Issue 6, June 2019 ISSN 2320-9186
487
GSJ© 2019 www.globalscientificjournal.com

against food shortages and global climate change. Conserving a rich diversity of plants and
animals will:
• provide food for the growing human populations;
• add oxygen and reduce ozone and carbon dioxide in our atmosphere; and
• add jobs and promote tourism through the enjoyment of nature.
-Provides medicine for curing diseases.
Benthic communities are the living ‘water purifiers’. The diverse group of benthic organisms
plays vital roles of cleaning water, processing detritus, and controlling harmful algae blooms.
One group of such organisms, the filter-feeders, is composed of a variety of species that
specialize in removing particles from the water column.
Freshwater mussels are one of the most imperiled groups of aquatic organisms in streams
and rivers because much of their habitat has been altered by dredging, channeling, impoundment,
and sedimentation. Mussels also are sensitive to water pollution, the spread of exotic species, and
barriers to migration.
Aquatic plants, such as algae, diatoms, and rooted macrophytes, also improve water
quality by removing nutrients from the water and making them available for other life forms. In
some cases, rooted plants can remove and degrade toxins like mercury or atrazine (a widely used
herbicide). Plants also derive energy from the sun, which is then available to fuel the benthic
food web in the form of organic matter. Benthic communities break down the organic matter
derived from plants and act as digestion systems, such as aquatic macrophytes and the leaves and
branches of trees that fall into streams, lakes, and ponds.
The structure and composition of a benthic community is an excellent bio-indicator of
pollution and habitat quality (Rosenberg DM, Resh VH (eds). 1993), (Stevenson RJ, Rollins SL.
2006), (Carter JL, Resh VH, Hannaford MJ, Meyers MJ. 2006). Dr. Ruth Patrick championed
the cause for biological diversity through the “Patrick Principle.” Her theory was that a diversity
of species holds the key to understanding environmental problems that affect our world. It
provides a foundation for the bio-indicator approach to examine the quality of water and health
of ecosystem. Many scientists used benthic organisms to classify and assess stream and river
conditions. Today, there are many indices used to assess the health of freshwater systems – and
benthic organisms are the foundation for many of them.
GSJ: Volume 7, Issue 6, June 2019 ISSN 2320-9186
488
GSJ© 2019 www.globalscientificjournal.com
Study Area
The Shahpura Lake which was formed in 1974-1975 is chosen for study. Shahpura Lake
is also known for fish culture. From 1975 onwards the lake water is being used by fisheries
department for fisheries activities. Factors responsible for pollution of Shahpura Lake are:
untreated sewage inflow, siltation, excessive growth of aquatic weeds, encroachment, washing
and bathing activities, deforestation, soil erosion and removal of oxygenated surface water
through waste water (Giri,A. and Saxena, S., 2017).
Four sampling stations were selected in shahpura lake:
➢ Chunnabhatti (Station I)
➢ Fishing spot (Station II)
➢ Mid site (Station III)
➢ Near park (Station IV)
Material and Method
The samples of water (Surface) were collected from different sites three times a year pre-
monsoon (feb to april), monsoon (june to aug) and post-monsoon (oct to dec) season during 2013
to 2015. Before collection of the samples the clean, dried and well labeled samples bottles and
high quality of plastic canes with 1 litre capacity were kept ready.
The samples of sediments were collected from the surface of lakes from all the stations
between 9am -5pm by using Peterson grabe mud sampler. The collected samples were sieved
through 0.5 mm sieve (Ankar and Elmgreen, 1976) and the materials which retained on sieve
were collected. Benthic organisms from the retained mud were sorted out with the help of forcep
and brush and were preserved in narrow mouthed plastic bottle which contained 70% alcohol as
preservative (Adoni, 1985). Some fauna which were attached from rocks, stones and
macrophytes were also collected. All macro faunal organisms were identified to species level
with the help of available key and manuals Needham and Needham, 1962 and Pennak (1989)
under the Metzer light microscope. The population of organisms were counted species wise i.e.,
no of individuals of a species per sample and were expressed as number / m2. In twenty four
months study period, thrice sampling were done.
Observation
GSJ: Volume 7, Issue 6, June 2019 ISSN 2320-9186
489
GSJ© 2019 www.globalscientificjournal.com
A diversity index is a mathematical measure of species diversity present in a community.
Diversity indices provide more information not only about community composition than simply
species richness, i.e., the number of species present but they also take the relative abundances of
different species into consideration. Another index that is commonly used to characterize species
diversity in a community is A) A mathematical measure of species diversity in a given
community is termed as diversity index.
B) Based on the species richness (the number of species present) and species abundance (the
number of individuals per species).
C) The more species, the more diverse the area.
D) However, there are two types of indices, dominance indices and information statistic indices.
E) The equations for the two indices are:
Shannon Index (H) = - ∑ pi ln pi
Simpson Index (D) = 1/ ∑pi^2
The Shannon index is an information statistic index, which means it assumes all species that are
represented in a sample and they are randomly sampled. In the Shannon index, p is the
proportion (n/N) of individuals of one particular species found (n) divided by the total number of
individuals found (N), ln is the natural log, Σ is the sum of the calculations, and s is the number
of species. The value of Shannon diversity index for real community typically falls between 0 to
1. The lower value indicates more diversity, while index value 1 means all groups have same
frequency.
The Simpson index is a dominance index because it gives more weight to common or dominant
species. In this case, a few rare species with only a few representatives will not affect the
diversity. In the Simpson index, p is the proportion (n/N) of individuals of one particular species
found (n) divided by the total number of individuals found (N), Σ is still the sum of the
calculations, and s is the number of species. With higher value indicates high dominance in the
area.
Shannon diversity index (H). Like Simpson’s index, Shannon's index accounts for both
abundance and evenness of the species present
GSJ: Volume 7, Issue 6, June 2019 ISSN 2320-9186
490
GSJ© 2019 www.globalscientificjournal.com
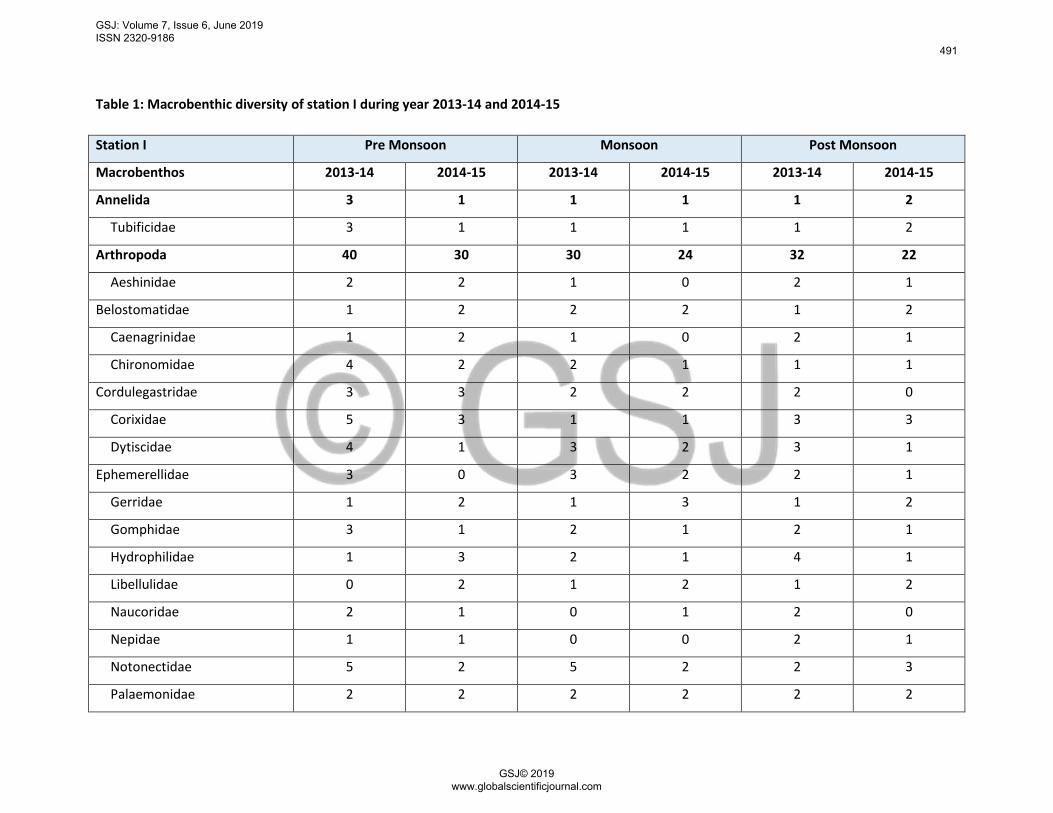
Table 1: Macrobenthic diversity of station I during year 2013-14 and 2014-15
Station I Pre Monsoon Monsoon Post Monsoon
Macrobenthos 2013-14 2014-15 2013-14 2014-15 2013-14 2014-15
Annelida 3 1 1 1 1 2
Tubificidae 3 1 1 1 1 2
Arthropoda 40 30 30 24 32 22
Aeshinidae 2 2 1 0 2 1
Belostomatidae 1 2 2 2 1 2
Caenagrinidae 1 2 1 0 2 1
Chironomidae 4 2 2 1 1 1
Cordulegastridae 3 3 2 2 2 0
Corixidae 5 3 1 1 3 3
Dytiscidae 4 1 3 2 3 1
Ephemerellidae 3 0 3 2 2 1
Gerridae 1 2 1 3 1 2
Gomphidae 3 1 2 1 2 1
Hydrophilidae 1 3 2 1 4 1
Libellulidae 0 2 1 2 1 2
Naucoridae 2 1 0 1 2 0
Nepidae 1 1 0 0 2 1
Notonectidae 5 2 5 2 2 3
Palaemonidae 2 2 2 2 2 2
GSJ: Volume 7, Issue 6, June 2019 ISSN 2320-9186
491
GSJ© 2019 www.globalscientificjournal.com
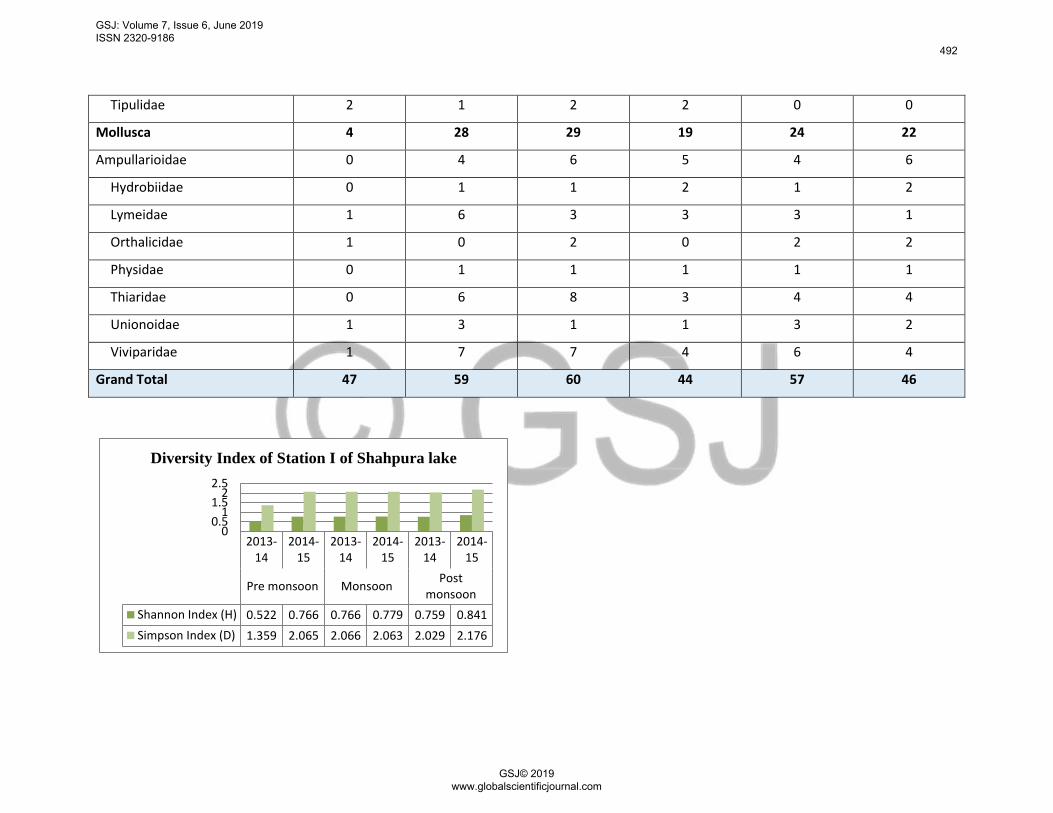
Tipulidae 2 1 2 2 0 0
Mollusca 4 28 29 19 24 22
Ampullarioidae 0 4 6 5 4 6
Hydrobiidae 0 1 1 2 1 2
Lymeidae 1 6 3 3 3 1
Orthalicidae 1 0 2 0 2 2
Physidae 0 1 1 1 1 1
Thiaridae 0 6 8 3 4 4
Unionoidae 1 3 1 1 3 2
Viviparidae 1 7 7 4 6 4
Grand Total 47 59 60 44 57 46
2013-14
2014-15
2013-14
2014-15
2013-14
2014-15
Pre monsoon MonsoonPost
monsoon
Shannon Index (H) 0.522 0.766 0.766 0.779 0.759 0.841
Simpson Index (D) 1.359 2.065 2.066 2.063 2.029 2.176
00.5
11.5
22.5
Diversity Index of Station I of Shahpura lake
GSJ: Volume 7, Issue 6, June 2019 ISSN 2320-9186
492
GSJ© 2019 www.globalscientificjournal.com
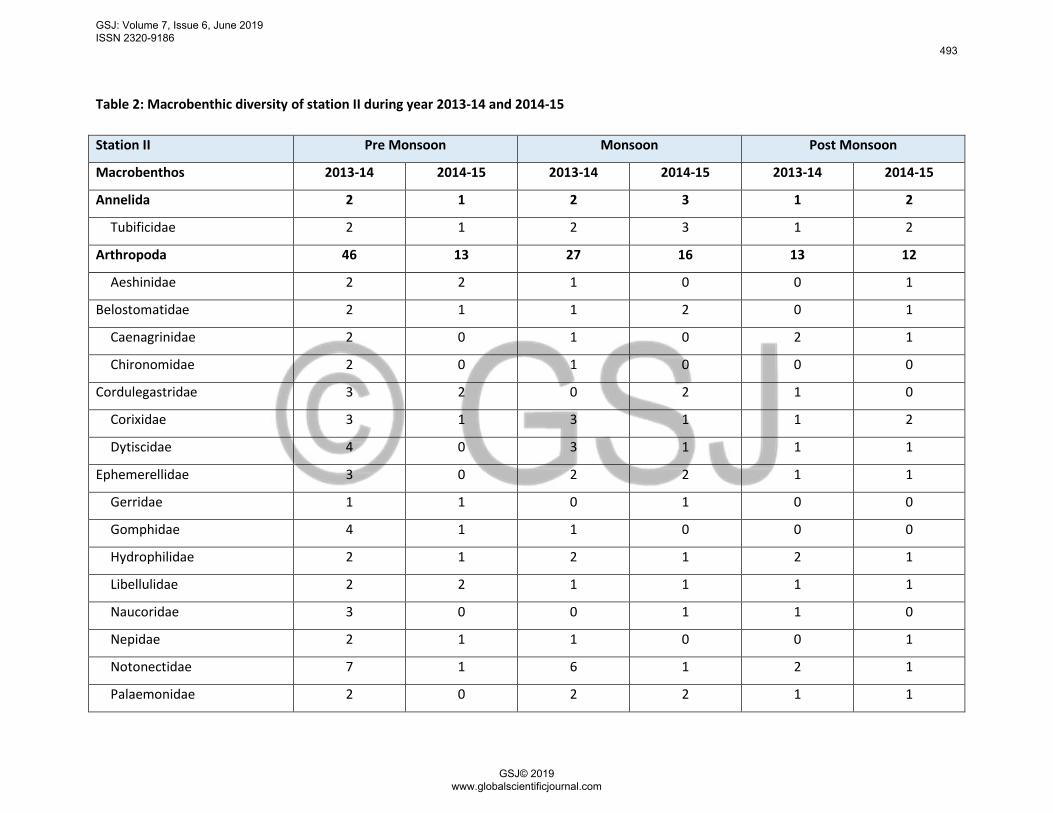
Table 2: Macrobenthic diversity of station II during year 2013-14 and 2014-15
Station II Pre Monsoon Monsoon Post Monsoon
Macrobenthos 2013-14 2014-15 2013-14 2014-15 2013-14 2014-15
Annelida 2 1 2 3 1 2
Tubificidae 2 1 2 3 1 2
Arthropoda 46 13 27 16 13 12
Aeshinidae 2 2 1 0 0 1
Belostomatidae 2 1 1 2 0 1
Caenagrinidae 2 0 1 0 2 1
Chironomidae 2 0 1 0 0 0
Cordulegastridae 3 2 0 2 1 0
Corixidae 3 1 3 1 1 2
Dytiscidae 4 0 3 1 1 1
Ephemerellidae 3 0 2 2 1 1
Gerridae 1 1 0 1 0 0
Gomphidae 4 1 1 0 0 0
Hydrophilidae 2 1 2 1 2 1
Libellulidae 2 2 1 1 1 1
Naucoridae 3 0 0 1 1 0
Nepidae 2 1 1 0 0 1
Notonectidae 7 1 6 1 2 1
Palaemonidae 2 0 2 2 1 1
GSJ: Volume 7, Issue 6, June 2019 ISSN 2320-9186
493
GSJ© 2019 www.globalscientificjournal.com
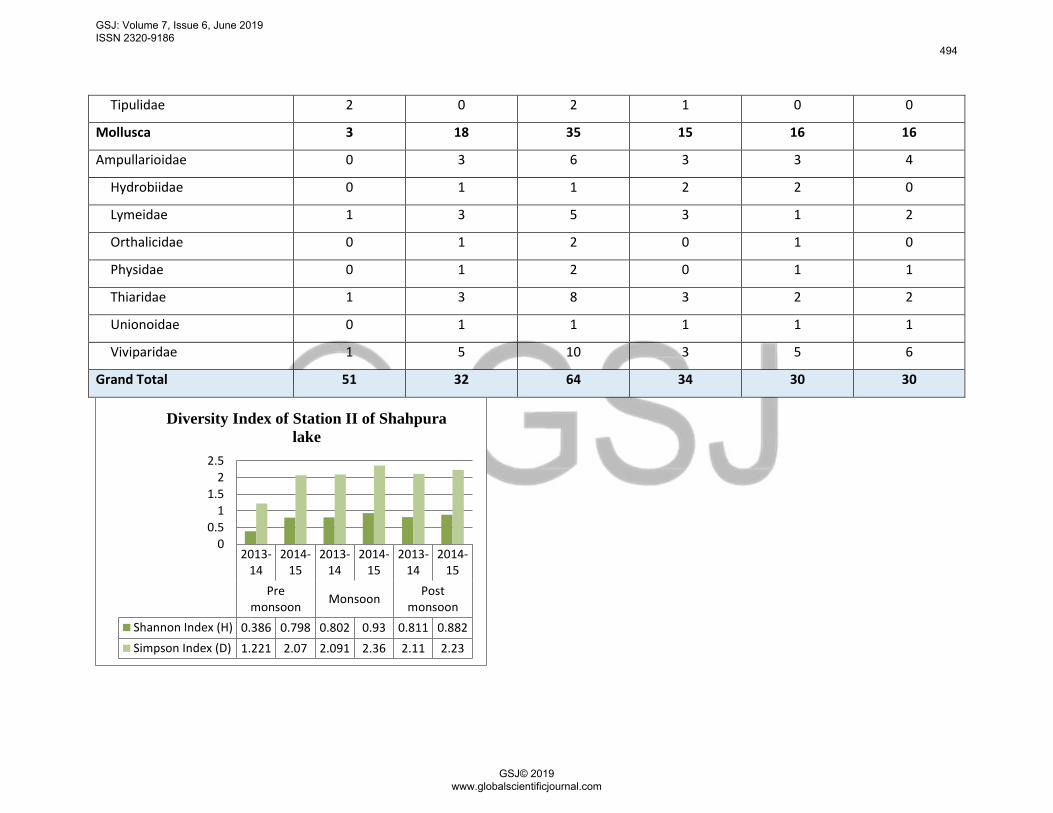
Tipulidae 2 0 2 1 0 0
Mollusca 3 18 35 15 16 16
Ampullarioidae 0 3 6 3 3 4
Hydrobiidae 0 1 1 2 2 0
Lymeidae 1 3 5 3 1 2
Orthalicidae 0 1 2 0 1 0
Physidae 0 1 2 0 1 1
Thiaridae 1 3 8 3 2 2
Unionoidae 0 1 1 1 1 1
Viviparidae 1 5 10 3 5 6
Grand Total 51 32 64 34 30 30
2013-14
2014-15
2013-14
2014-15
2013-14
2014-15
Premonsoon
MonsoonPost
monsoon
Shannon Index (H) 0.386 0.798 0.802 0.93 0.811 0.882
Simpson Index (D) 1.221 2.07 2.091 2.36 2.11 2.23
0
0.5
1
1.5
2
2.5
Diversity Index of Station II of Shahpura
lake
GSJ: Volume 7, Issue 6, June 2019 ISSN 2320-9186
494
GSJ© 2019 www.globalscientificjournal.com
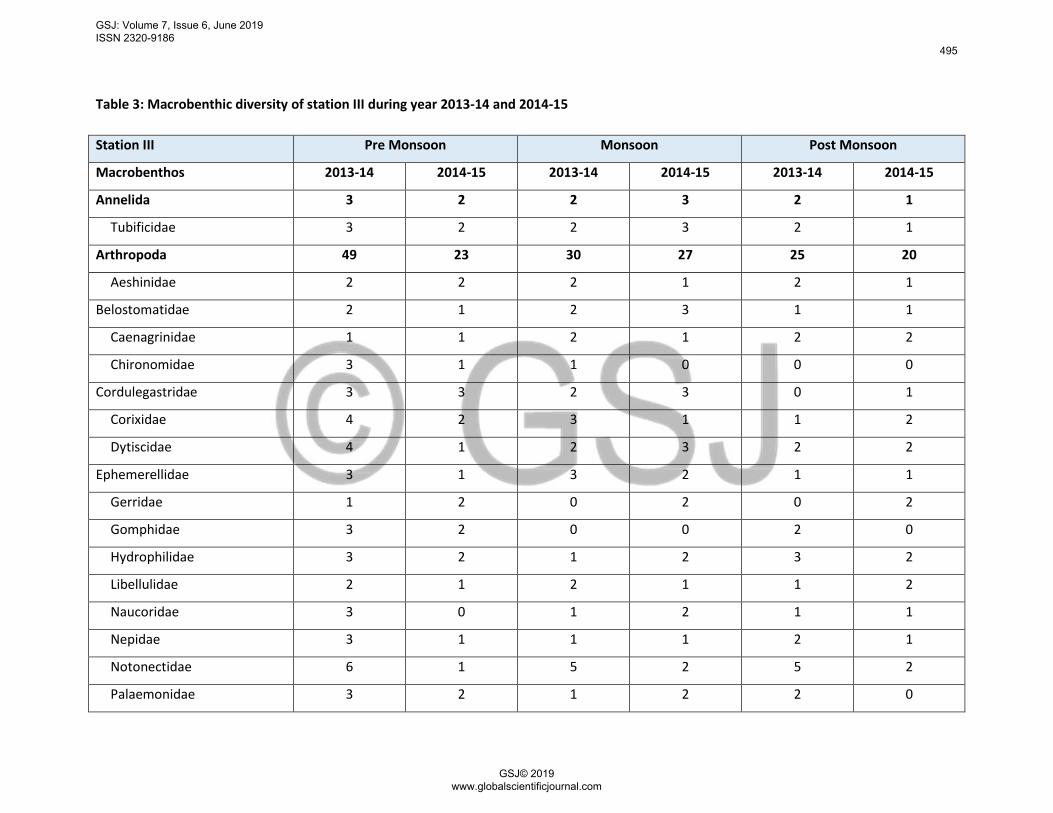
Table 3: Macrobenthic diversity of station III during year 2013-14 and 2014-15
Station III Pre Monsoon Monsoon Post Monsoon
Macrobenthos 2013-14 2014-15 2013-14 2014-15 2013-14 2014-15
Annelida 3 2 2 3 2 1
Tubificidae 3 2 2 3 2 1
Arthropoda 49 23 30 27 25 20
Aeshinidae 2 2 2 1 2 1
Belostomatidae 2 1 2 3 1 1
Caenagrinidae 1 1 2 1 2 2
Chironomidae 3 1 1 0 0 0
Cordulegastridae 3 3 2 3 0 1
Corixidae 4 2 3 1 1 2
Dytiscidae 4 1 2 3 2 2
Ephemerellidae 3 1 3 2 1 1
Gerridae 1 2 0 2 0 2
Gomphidae 3 2 0 0 2 0
Hydrophilidae 3 2 1 2 3 2
Libellulidae 2 1 2 1 1 2
Naucoridae 3 0 1 2 1 1
Nepidae 3 1 1 1 2 1
Notonectidae 6 1 5 2 5 2
Palaemonidae 3 2 1 2 2 0
GSJ: Volume 7, Issue 6, June 2019 ISSN 2320-9186
495
GSJ© 2019 www.globalscientificjournal.com
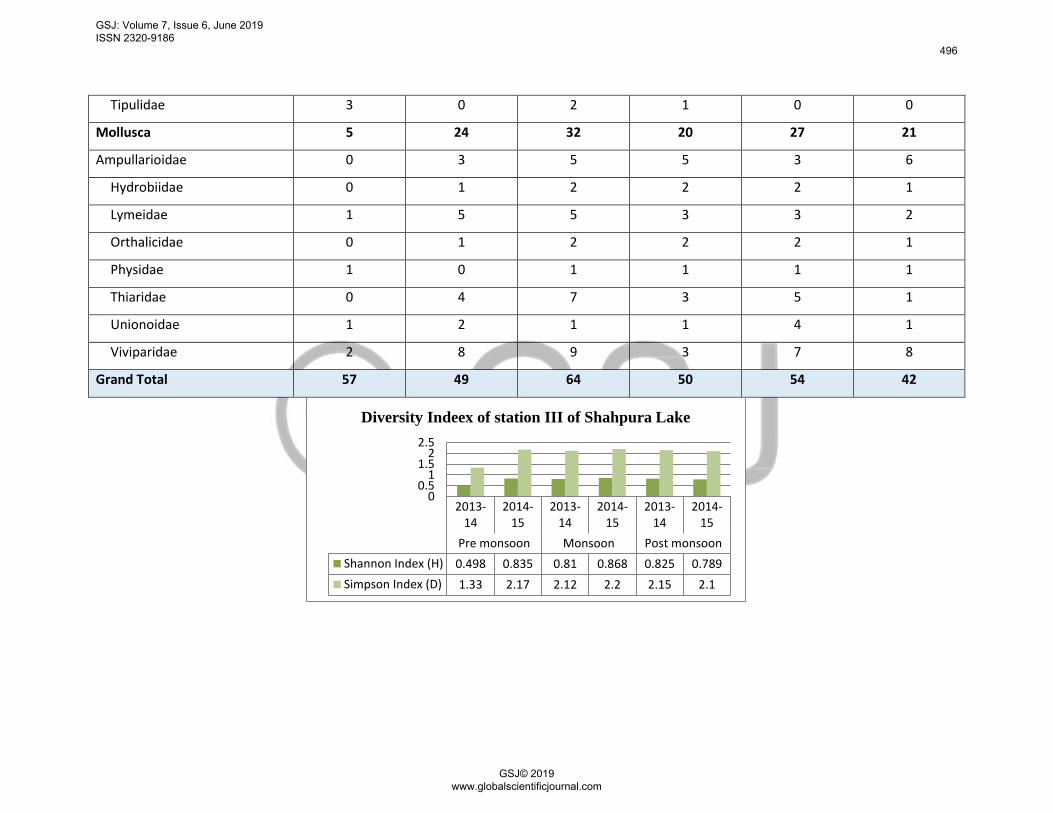
Tipulidae 3 0 2 1 0 0
Mollusca 5 24 32 20 27 21
Ampullarioidae 0 3 5 5 3 6
Hydrobiidae 0 1 2 2 2 1
Lymeidae 1 5 5 3 3 2
Orthalicidae 0 1 2 2 2 1
Physidae 1 0 1 1 1 1
Thiaridae 0 4 7 3 5 1
Unionoidae 1 2 1 1 4 1
Viviparidae 2 8 9 3 7 8
Grand Total 57 49 64 50 54 42
2013-14
2014-15
2013-14
2014-15
2013-14
2014-15
Pre monsoon Monsoon Post monsoon
Shannon Index (H) 0.498 0.835 0.81 0.868 0.825 0.789
Simpson Index (D) 1.33 2.17 2.12 2.2 2.15 2.1
00.5
11.5
22.5
Diversity Indeex of station III of Shahpura Lake
GSJ: Volume 7, Issue 6, June 2019 ISSN 2320-9186
496
GSJ© 2019 www.globalscientificjournal.com

Table 4: Macrobenthic diversity of station IV during year 2013-14 and 2014-15
Station IV Pre Monsoon Monsoon Post Monsoon
Macrobenthos 2013-14 2014-15 2013-14 2014-15 2013-14 2014-15
Annelida 2 1 1 2 1 1
Tubificidae 2 1 1 2 1 1
Arthropoda 47 21 34 23 27 24
Aeshinidae 3 1 0 1 1 0
Belostomatidae 2 1 2 3 1 2
Caenagrinidae 1 2 3 0 1 2
Chironomidae 2 1 2 1 0 1
Cordulegastridae 4 3 2 1 0 0
Corixidae 5 2 3 3 4 3
Dytiscidae 3 2 2 3 2 1
Ephemerellidae 4 0 4 1 2 0
Gerridae 0 2 1 2 0 3
Gomphidae 3 2 2 1 2 1
Hydrophilidae 2 1 2 2 3 2
Libellulidae 3 1 2 0 1 2
Naucoridae 4 0 1 1 2 1
Nepidae 4 1 0 0 2 2
Notonectidae 4 1 5 1 4 2
Palaemonidae 2 1 2 1 1 1
GSJ: Volume 7, Issue 6, June 2019 ISSN 2320-9186
497
GSJ© 2019 www.globalscientificjournal.com
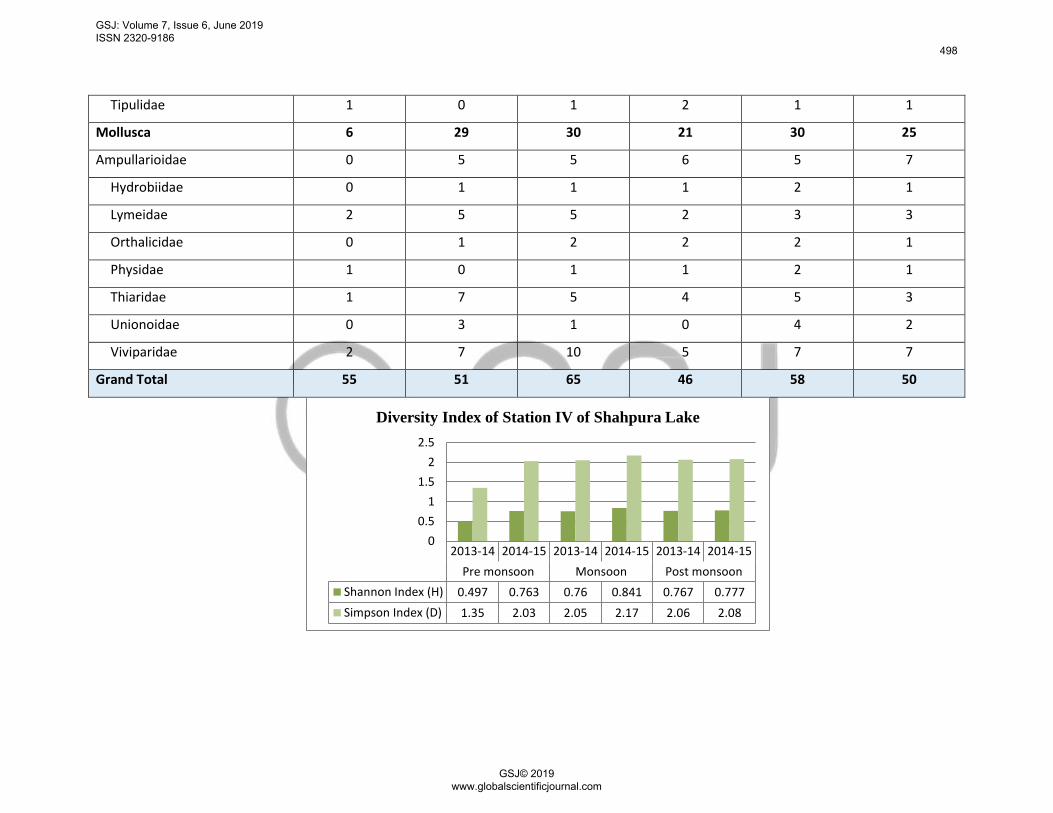
Tipulidae 1 0 1 2 1 1
Mollusca 6 29 30 21 30 25
Ampullarioidae 0 5 5 6 5 7
Hydrobiidae 0 1 1 1 2 1
Lymeidae 2 5 5 2 3 3
Orthalicidae 0 1 2 2 2 1
Physidae 1 0 1 1 2 1
Thiaridae 1 7 5 4 5 3
Unionoidae 0 3 1 0 4 2
Viviparidae 2 7 10 5 7 7
Grand Total 55 51 65 46 58 50
2013-14 2014-15 2013-14 2014-15 2013-14 2014-15
Pre monsoon Monsoon Post monsoon
Shannon Index (H) 0.497 0.763 0.76 0.841 0.767 0.777
Simpson Index (D) 1.35 2.03 2.05 2.17 2.06 2.08
0
0.5
1
1.5
2
2.5
Diversity Index of Station IV of Shahpura Lake
GSJ: Volume 7, Issue 6, June 2019 ISSN 2320-9186
498
GSJ© 2019 www.globalscientificjournal.com
Conclusion
According to the observation, at all stations, biodiversity was higher during the year 2013-14 and
get lowered next year. While biodiversity gradually decreased from pre-monsoon to post
monsoon in consecutive years. Station II showed maximum biodiversity among rest stations
during pre-monsoon season, station IV showed higher diversity during monsoon season and
during post monsoon season station I showed greater diversity in the year 2013-14. While in the
year 2014-15, station IV showed greater diversity during pre and post monsoon while station I
showed higher diversity. The lake is surrounded by residential area and by a park from another
side. The lake is gets input from residential area, which changes the quality of water thus
changing its diversity. It’s also used fishing and boating. The input of sewage and fishing need to
be checked regularly to maintain its diversity and sustainability of lake.
GSJ: Volume 7, Issue 6, June 2019 ISSN 2320-9186
499
GSJ© 2019 www.globalscientificjournal.com
Reference
1. S. Ankar and R. Elmgren, The benthic macro-and meiofauna of the Askö-Landsort area
(northern Baltic proper). A stratified random sampling survey. Askoelaboratoriet, 1976.
2. Giri. A. And Saxena, S. (2017), Study Of Fish Diversity Of Shahpura Lake, Bhopal, India,
World Journal Of Pharmacy And Pharmaceutical Sciences , Impact Factor 6.647 , Volume 6,
Issue 7, 1064-1072 Research Article Issn 2278 – 4357.
3. Adoni, A.D. (1985), Work book of Limnology, Pratibha Publishers, Sagar.
4. APHA, (1998), Standard methods for the examination of water and waste water 20th
Ed., New York.
5. Needham, J. G. and Needham, P. R. 1962. A guide to study the freshwater biology Halden-
Daylnc SanFrancisco. p.1 – 232.
6. J. L. Carter, V. H. Resh, and M. J. Hannaford, “Macroinvertebrates as biotic indicators of
environmental quality,” in Methods in stream ecology, Elsevier, 2017, pp. 293–318.
7. R. J. Stevenson and S. L. Rollins, “Ecological assessment with benthic algae,” in Methods in
stream ecology, Elsevier, 2017, pp. 277–292.
GSJ: Volume 7, Issue 6, June 2019 ISSN 2320-9186
500
GSJ© 2019 www.globalscientificjournal.com