Embed Size (px)
Citation preview
Dividend policy, dividend initiations, and governance
Micah S. Officer*
Marshall School of Business Department of Finance and Business Economics
University of Southern California Los Angeles, CA 90089
Phone: 213-740-6519
Email: [email protected]
This draft: October 5, 2006
Abstract: Dividend policy can either be an outcome of strong governance or a substitute for
weak governance. This paper provides evidence that dividend policy is a substitute for weak
internal and external governance by focusing on a sample of firms that should pay dividends.
Specifically, predicted dividend payers with weak governance are significantly more likely to pay
dividends than are predicted dividend payers with strong governance. Firms with weak
governance also have significantly higher dividend initiation announcement abnormal returns
than other firms, consistent with the notion that dividend policy is a substitute for other
governance attributes and that the market prices the decrease in agency costs resulting from the
initiation of dividends.
* I thank Harry DeAngelo, Linda DeAngelo, Ehud Kamar, Harold Mulherin, Mike Stegemoller, Ralph Walkling, and Mark Weinstein for comments, and Jim Linck for providing some of the data.
1
Introduction
While finance academics have long wondered why firms pay dividends when cash distributions
in the form of dividends are tax disadvantaged relative to retention or stock repurchases (e.g.
Black (1976)), recent theoretical and empirical work significantly expands our understanding of
whether, when, and why firms pay dividends (Fama and French (2001), DeAngelo, DeAngelo,
and Skinner (2004), DeAngelo and DeAngelo (2006), and DeAngelo, DeAngelo, and Stulz
(2006)).
The interaction of dividend policy and governance is central to the debate about the
agency costs of free-cash-flow (Easterbrook (1984) and Jensen (1986)). In particular, Easterbrook
(1984) argues that a policy of paying dividends reduces agency costs by improving the
monitoring and risk-taking incentives of managers. While the initiation of a policy of paying
dividends should reduce the agency costs of free-cash-flow ex post, the relation between ex ante
agency problems and the decision to pay dividends is not as clear.
La Porta et al (2000) discuss two models of the relation between ex ante agency problems
and dividend policy: the “outcome model” and the “substitute model.”1 In the outcome model, the
payment of dividends is the result of effective governance – well-governed firms pay dividends
because strong governance makes expropriation from shareholders (the worst manifestation of the
agency problems of free-cash-flow) more difficult and shareholders successfully pressure
managers to distribute excess cash.2 In the substitute model, the payment of dividends replaces
other governance characteristics in the portfolio of policies that firms employ to convince
shareholders that they will not be expropriated.3 The substitute model predicts that poorly-
1 La Porta et al (2000) discuss dividend policy in the context of shareholder protection in various legal regimes around the world. In this paper I take that discussion and apply it to differences in governance characteristics between firms in the same legal regime (United States). 2 Tse (2004) questions the logic of the relation between agency costs and dividend policy in the outcome model – if well-governed firms are more likely to pay dividends, then shareholders shouldn’t need to rely on the payment of dividends to reduce the agency costs of free-cash-flow because such costs should already be low for well-governed firms. 3 Also see Rozeff (1982).
2
governed firms make dividend payments because such firms need an alternate means of
establishing a reputation for acting in the interests of shareholders if they intend to raise capital
from public markets in the future, and therefore a policy of paying dividends is the most valuable
at the margin to firms with agency problems.
I identify a sample of firms with fundamentals that suggest that the firms should be
dividend payers, and test whether governance characteristics affect the decision to pay dividends
in that sample. This sample-selection strategy offers several advantages over the empirical
methods employed elsewhere in the literature. First, the outcome model predicts that well-
governed firms are more likely to pay dividends only when firm fundamentals (size, growth,
earned capital, etc.) support the adoption of a policy of paying dividends. In other words, the
outcome model doesn’t stand a chance against the alternative (the substitute model) unless one
conditions first on the appropriateness of adopting a policy of paying dividends. Second, a sample
of firms that are predicted dividend payers is likely to contain firms that, all else equal, have
higher-than-average agency costs of free cash flow. Therefore, this sample should provide a
strong empirical test of whether characteristics associated with strong governance are positively
(the outcome model) or negatively (the substitute model) correlated with a policy of paying
dividends, because the higher-than-average agency costs of free cash flow give shareholders
ample motivation to insist on payouts if the governance structure allows (the outcome model) and
managers ample motivation to voluntarily offer payouts to compensate for otherwise weak
governance structures (the substitute model).
I identify firms that should pay dividends (predicted dividend payers) using the models in
Fama and French (2001) and DeAngelo, DeAngelo, and Stulz (2006), and find that predicted
dividend payers with characteristics associated with weak governance and managerial
entrenchment are significantly more likely to pay dividends than are predicted dividend payers
with strong governance. For example, firms with large boards, CEO/Chairman duality, and low
ownership by insiders and institutional investors are significantly more likely to pay regular cash
3
dividends to shareholders. These results are consistent with the substitute model in La Porta et al
(2000), which predicts that firms use dividend policy as a substitute for otherwise weak
governance. I offer further support for the substitute model by demonstrating that firms with
weak governance have significantly more positive dividend initiation announcement returns than
do firms with characteristics consistent with strong governance. This suggests that the market
prices the reduction in agency costs associated with the initiation of dividends by firms with weak
governance, consistent with the hypothesis that dividend policy is one component of the firm’s
governance and bonding policies and therefore substitutable with other governance policies.
Endogeneity is certainly a concern in interpreting my results. However, the substitute
model in La Porta et al (2000) suggests that dividend policy and other governance characteristics
are endogenous choices that firms make as part of an equilibrium monitoring/bonding package to
reduce agency costs. While my empirical models are structured as tests of whether governance
proxies (implicitly exogenous in the regressions) affect dividend policy choices, the substitute
model does not suggest that any of these policy choices are truly exogenous. Therefore, the most
that can be concluded from my results (and the other results in this literature), is that dividend
policy choice and other policy choices that affect governance quality are negatively correlated.
Firms that choose governance policies that are associated with entrenchment (such as having
many anti-takeover provision insulating managers from hostile takeovers) are empirically more
likely to pay dividends, but it is impossible to conclude that one of these policy choices causes
the other. As discussed in Rozeff (1982), the data is most consistent with the interpretation that
dividend policy decisions are made as part of an endogenous package of governance choices that
optimally reduce the agency costs generated by the separation of ownership and control.
Recent empirical papers in this literature have offered consistent support for the substitute
model in La Porta et al (2000) (although few papers use that language). For example, Fenn and
Liang (2001) report that firms with low managerial stock-option holdings (and therefore lower-
powered incentives) have significantly higher dividend and total (including repurchases) payout
4
ratios, although this result could be due to the lack of “dividend protection” afforded by most
executive stock option contracts (Lambert, Lanen, and Larker (1989)). Hu and Kumar (2004) find
that the likelihood and level of dividend payouts is increasing when factors such as managerial
and outside blockholder ownership, CEO compensation policy, and board independence indicate
a high likelihood of managerial entrenchment and high agency costs.
John and Knyazeva (2006) report that dividend and total payouts (the sum of dividends
and repurchases) are significantly more likely when internal and external governance measures
indicate weak governance. Pan (2006) shows a similar association between the propensity to pay
dividends and measures of managerial entrenchment based on indices of anti-takeover charter
provisions. Several earlier studies report complementary evidence. Rozeff (1982) reports that
dividend payout ratios are significantly negatively associated with insider ownership and
positively associated with the dispersion of outside ownership. Essentially identical results are
found in a simultaneous-equations framework by Jensen, Solberg, and Zorn (1992). Gugler
(2003) examines Austrian firms and finds that state-controlled firms, for which agency problems
are likely to be severe, have higher target dividend payout ratios than other types of firms, and are
also the most reluctant to cut dividends when such cuts are warranted. On the other hand,
Renneboog and Szilagyi (2006) report that firms with strong shareholders appear to force higher
payouts in Dutch firms, and Michaely and Roberts (2006) conclude that strong governance
encourages higher and more consistent payouts using data on private firms in the UK.
One weakness with the empirical tests in the recent literature (e.g. Hu and Kumar (2004),
John and Knyazeva (2006), and Pan (2006)), however, is that none of these authors focus on
samples of firms that should pay dividends. As described above, this weakness biases tests in
favor of the substitute model. While these studies include firm fundamentals as control variables
in regressions of dividend policy choice on governance characteristics, holding fundamentals
constant in a regression using all available firm-years is very different from focusing on a sample
of firms that should pay dividends. Including firm fundamentals as control variables essentially
5
involves asking the following question: if two firms have the same fundamentals, does
governance affect the decision to pay dividends? But as a large fraction of the full sample of firm-
years used in most studies is comprised of firms that, according to fundamentals (size, growth,
retained earnings, and so on) should not be dividend payers,4 controlling for fundamentals can
result in a test of whether governance matters for dividend policy for two firms that are equally-
unlikely to be dividend payers.
A further omission from this literature is that none of the aforementioned studies examine
the relation between governance characteristics and the wealth effects of initiating a policy of
paying dividends. The substitute model predicts that dividends are used as a substitute for other
governance devices in order to reduce agency costs, and therefore that the announcement that a
firm with weak governance will begin paying dividends for the first time should be associated
with positive returns as the market prices the reduction in agency costs into the firm’s stock price.
In other words, initiating dividends offers the greatest reduction in agency costs, and
consequently the largest initiation announcement stock price reaction, for firms with weak
governance in the substitute model.
The contribution of this paper is to address these two weaknesses and omissions. First, by
examining firms that should be paying dividends (based on fundamentals) and exploring the
relation between whether those firms do pay or not and proxies for internal (board size and
composition) and external (takeover defenses, ownership by blockholders and activist investors)
governance characteristics, my research design provides a more robust test of the substitute model
by, if anything, biasing the test in favor of the outcome hypothesis. Second, I provide
complementary evidence by examining the relation between governance characteristics and
dividend initiation announcement returns – if a policy of paying dividends is chosen as a
substitute for other governance characteristics, then the reduction in agency costs should be
4 For example, less than one-third of the firms in the sample in DeAngelo, DeAngelo, and Stulz (2006) are dividend payers, and the empirical models in that paper have considerable success in predicting the propensity to pay.
6
priced by the market at the margin. My results strongly support the substitute model and are
consistent with the hypothesis that a policy of paying dividends is used as a substitute for other
governance devices by firms with weak governance and high agency costs, and that the market
prices an anticipated reduction in agency costs around dividend initiation announcement dates.
The results in this paper are related to other findings in the literature. Harford, Mansi, and
Maxwell (2005) report that firms with weak governance hold substantially lower cash reserves
than do firms with strong governance. This is consistent with the notion that firms with weak
governance are more likely to pay dividends (thereby reducing cash balances).5 Gillan, Hartzell,
and Starks (2006) find evidence that governance structures are substitutes for one another – for
example, firms with more independent boards also tend to have more restrictive anti-takeover
provisions. Such substitutability between governance structures is consistent with the argument
that dividend policy and other governance attributes also serve as substitutes.
The remainder of this paper is organized as follows. In Section I, I develop the
hypotheses and empirical predictions. Section II describes the relation between the propensity to
pay dividends for firms that should be dividend payers and governance characteristics. Section III
examines the relation between governance measures and abnormal returns around dividend
initiation announcements, and Section IV discusses the implications of the findings and offers
concluding remarks.
I. Hypothesis development
A. Two models for the relation between agency costs and dividend policy
As outlined in La Porta et al (2000), there are two potential models for the relation
between agency costs and dividend policy. Although each is discussed in detail in La Porta et al,
the discussion in that paper centers on a cross-country (and legal system) framework. Therefore, I
5 Harford, Mansi, and Maxwell (2005) conclude, however, that firms with weak governance dissipate cash through acquisition activity rather than by returning it to shareholders.
7
adapt each of the La Porta et al models to a setting where firms are in a common legal system
(United States) but have attributes that offer shareholders a strong voice in the governance of the
corporation (“strong governance”) or a weak voice (“weak governance”):
A.1.The outcome model
Firms with strong governance are those with, for example, small boards that are more
difficult for insiders to manipulate (Jensen (1993) and Yermack (1996)), boards that are
dominated by non-executives or outsiders (Weisbach (1988) and Brickley, Coles, and Terry
(1994)), blocks of stock controlled by activist outsiders (Barclay and Holderness (1991) and Del
Guercio and Hawkins (1999)), and few anti-takeover provisions (Gompers, Iishi, and Metrick
(2003) and Bebchuk, Cohen, and Ferrell (2005)). Managers of companies with strong governance
systems will find it more costly to expropriate wealth from outside shareholders, raising the
relative attractiveness of paying out cash to stockholders. In such firms, shareholder insistence on
the distribution of excess cash is less likely to fall on deaf ears than in firms with attributes
associated with managerial entrenchment or weak governance. The “correct” dividend policy is
the outcome of the governance regime in this view because managers of firms with good
governance are more likely to act in the interests of shareholders and pursue value-maximizing
policies, such as the payment of dividends when the firm’s fundamentals warrant such a policy,
than are managers of firms with weak governance. In this model, strong governance and a policy
of paying dividends are complements.
A.2.The substitute model 6
This view of the relation between agency costs and dividend policy relies on the
assumption that firms and managers need to establish a reputation with public capital markets for
6 This model is derived from the discussion in La Porta et al (2000), but is also consistent with the predictions of the agency model in Allen, Bernado, and Welch (2000) (specifically, prediction #1 on p.2519 of that paper), the discussion in Myers (2000), and the agency model in Nielsen (2005).
8
not expropriating wealth from shareholders (whether actual cash transfers or over-consumption of
perquisites) because the firm will need to tap such markets to raise new external capital in the
future (Easterbrook (1984)) or because the managers’ reputation is important for their careers.
Dividend policy is one part of the optimal portfolio of choices that firms make as bonding
commitments to shareholders to reduce agency costs (Rozeff (1982)). A policy of paying
dividends reduces the agency costs of free-cash-flow, and such a policy choice is therefore most
valuable at the margin to firms with the highest agency costs. Managers of firms with weak
governance, such as those with large boards, few outside blockholders, low levels of ownership
by managers (Jensen and Meckling (1976)), and charter provisions making control-changes
costly, are most likely to prefer a policy of paying dividends, even if firm fundamentals do not
warrant such a policy, because dividend policy is a substitute for other forms of governance in the
maintenance of a good reputation with external capital markets.
B. Hypotheses
The outcome and substitute models have opposite predictions about the relation between
governance and dividend policy. Assuming for the moment that “governance” can be measured
empirically,7 the testable hypotheses are:
H1a (outcome): Firms with strong (weak) governance are more (less) likely to
pay dividends when firm fundamentals suggest that such a policy is warranted.
H1b (substitute): Firms with weak (strong) governance are more (less) likely to
pay dividends when firm fundamentals suggest that such a policy is warranted.
7 I will return to this issue in Section II, and use a variety of governance proxies that are commonly employed in the empirical governance literature.
9
The outcome and substitute models also offer differing predictions about the relation
between dividend initiation announcement returns and governance characteristics. In the outcome
model, firms with strong governance are predicted to be the most likely to initiate a policy of
paying dividends, and yet the value of that policy (reducing the agency costs of free cash flow,
for example) for such firms is lower than for firms with weak governance.8 On the other hand, the
substitute model predicts that dividends are used as a substitute for other governance devices in
order to reduce agency costs, and therefore that the market will price the anticipated reduction in
agency costs into the firm’s stock price upon the announcement that a firm with weak governance
will begin paying dividends for the first time (initiations). In other words, initiating dividends
offers the greatest reduction in agency costs for firms with weak governance in the substitute
model, and if the reduction in agency costs is reflected in returns around dividend initiation dates
then firms with weak governance will have significantly more positive initiation announcement
returns than will firms with strong governance. This suggests the following testable hypotheses:
H2a (outcome): There will be no significant difference in abnormal
announcement returns around dividend initiation announcements conditional on
governance characteristics.
H2b (substitute): Firms with weak governance will have significantly more
positive dividend initiation announcement returns than will firms with strong
governance.
8 See also Tse (2004).
10
II. Dividend payers and governance characteristics
A. Identifying firms that should be dividend payers
The first set of hypotheses (H1a and H1b) predicts differences in the proportion of
dividend payers amongst those firms that should pay cash out to stockholders. I identify those
firms that should be dividend payers using firm fundamentals that are associated with the
propensity to pay. Specifically, I rely on the empirical models employed in Fama and French
(2001) and DeAngelo, DeAngelo, and Stulz (2006) to identify firm-years in which the firm
should be a dividend payer, and then examine the propensity for those firms to pay dividends
conditional on various governance characteristics.
Table 1 replicates regressions D2 and D4 from Table 3 in DeAngelo, DeAngelo, and
Stulz (2006), which are extensions of the payer-prediction regressions in Table 5 of Fama and
French (2001). The logit regressions use the Fama and MacBeth (1973) method to explain the
probability that a firm pays dividends with fundamental characteristics such as size, growth,
profitability, and the ratio of retained earnings to total equity (the earned/contributed capital mix).
The latter explanatory variable is used solely in DeAngelo, DeAngelo, and Stulz (2006) (as a
proxy for the firm’s stage in its capital infusion/self-financing lifecycle), while the other variables
are common to both papers cited above.
The sample used for the logit regressions in Table 1 is the same as that described in
DeAngelo, DeAngelo, and Stulz (2006). Specifically, the sample contains all firm-year
observations for all US-incorporated industrial (non-financial and non-utility) firms that are both
in the Compustat database and in the Center for Research in Security Prices (CRSP) database
with publicly-traded equity (NYSE, Nasdaq, or Amex) with share code 10 or 11. The sample is
from 1973 – 2004, with the beginning of the sample period dictated by the fact that CRSP
expands its coverage to include Nasdaq firms in 1972. Each firm-year observation is required to
have non-missing values for dividends and income before extraordinary items and positive total
common equity.
11
The explanatory variables in Table 1 are identical to those described in DeAngelo,
DeAngelo, and Stulz (2006) with one exception: the size percentile measures are based on the full
sample rather than NYSE break-points. Other than that, I employ identical measures of
earned/contributed capital (RE/TE), common equity/total capital (TE/TA), profitability (ROA),
and sales or asset growth (Growth) as described in DeAngelo, DeAngelo, and Stulz (2006). The
regressions are estimated separately for each sample year, and the coefficients in Table 1 are the
average of the 32 annual coefficients. The standard errors used to assess statistical significance
are the standard deviations of the annual coefficients scaled by the square root of 32.
While my sample period is slightly longer than theirs, the logit regression results reported
in Table 1 are practically identical to those in DeAngelo, DeAngelo, and Stulz (2006). The
propensity to pay dividends is significantly positively related to the earned/contributed capital
mix, profitability, and size (whether measured using equity market capitalization (D2) or total
assets (D4)), and negatively related to growth (whether measured as the growth rate of assets
(D4) or sales (D2)). The R2s reported in Table 1 are the average R2 for each model, and are 36%
for model D2 and 37% for D4. While the regressions are so similar that any choice between them
is arbitrary, as I use the regression for predictive purposes I rely on model D4 as it has a slightly
higher R2.
Figure 1 shows the dividend-payer lifecycle predictions derived from model D4 in Table
1. The figure plots the average predicted probability of paying dividends (solid line) and the
fraction of firms paying dividends (dashed line) for each year in the sample life of firms that have
at least five years of data in the sample.9 The “years in sample” in the figure is essentially an
event year, with year 1 being the first year that each firm appears in the sample. The average
predicted probability of paying dividends increases monotonically over the average firm’s
lifecycle, rising from a 36% probability of being a dividend payer in the first year that a firm
9 While “sample life” is not the same as “firm age,” the number of years in the sample (which is taken directly from the Compustat database) should be very close to the number of years as a public company for most firms that live at least five years and do not have a substantial number of missing observations.
12
appears in the sample to a 50% probability in the 22nd year. The actual fraction of payers in the
sample rises at a faster rate, but again reflects the lifecycle behavior described in Fama and
French (2001), Grullon, Michaely, and Swaminathan (2002), and DeAngelo and DeAngelo
(2006) – only 31% of firms are dividend payers in their first sample year, and that fraction passes
50% in the 13th year of sample life. As Figure 1 demonstrates, the propensity to pay dividends is
reasonably well captured by models, such as those in Table 1, that take account of the fact that as
a firm gets older its size, earned capital, and profitability increase (and sales or asset growth rate
decreases) to the point where the payment of dividends appears to be an optimal policy.
I use the predicted probabilities from model D4 in Table 1 to identify a sample of firm-
years in which firms should be paying dividends. Specifically, dividends should be paid in every
firm-year in which the predicted probability of being a dividend payer has exceeded 50% for two
consecutive years. Several examples will help highlight the sample derived from this selection
procedure. Microsoft Corp enters the sample in 1987 (the year after Microsoft’s IPO, allowing
one year for the calculation of Microsoft’s asset growth rate), at which time model D4 predicts
that its probability of being a dividend payer is 79%. The predicted probability of Microsoft being
a payer stays above the 50% threshold for all years until 2000, at which point it drops to 49% and
stays below 50% for three consecutive years until 2003 (and stays above that threshold until the
end of the sample). Therefore, Microsoft is considered to be a firm that should be paying
dividends from 1988 to 1999 and again in 2004. Microsoft initiates dividend payments in 2003.
Harley Davidson Inc. enters the sample in 1987 (again, the year after its IPO), at which time its
predicted probability of being a dividend payer is 46%. Harley Davidson’s predicted probability
of making dividend payments rises to 56% in the next year (1988), and stay above 50% for the
following 17 years (never dropping below 65%). Therefore, Harley Davidson should pay
dividends under the above definition from 1989 through 2004. Harley Davidson initiates dividend
payments in 1993 and does not omit a dividend for the remainder of the sample years. While the
lifecycle for every firm in the sample obviously does not follow this clean pattern, the results
13
depicted in Figure 1 illustrate that model D4 does a reasonable job of capturing the average
lifecycle pattern of dividend policy.
B. Governance characteristics
“Governance” is an extremely difficult concept to capture empirically. However, the
literature on governance has blossomed recently, potentially because governance appears to be
much more important to investors following the meltdowns of Enron, WorldCom, Adelphia, and
so on, but also potentially because several data sources (such as the IRRC data used by Gompers,
Iishi, and Metrick (2003)) have recently become available to researchers. In this paper I take as
broad and conservative approach as I can, sampling from much of the recent governance
literature and choosing variables that capture different aspects of “governance.” Whilst none of
these measures is individually perfect, if the majority of evidence points in one direction or the
other then reasonable conclusions can be drawn about the relation between dividend policy and
governance.
I divide the governance characteristics into “internal” and “external” measures. Both
internal and external measures of governance capture characteristics that could be expected to
entrench managers and isolate them from shareholder discipline (“weak” governance) or make
managers more responsive to their shareholders (“strong” governance). In other words, these
measures are empirical proxies for the degree of the agency problem at publicly traded
corporations.
The measures of internal governance are essentially measures of board structure and
ownership by insiders (CEO and executive directors), and are largely taken from the sample in
Linck, Netter, and Yang (2006).10 Linck, Netter, and Yang use a screened sample of all firms in
the Compact Disclosure database from 1990 to 2004, and the details of the data selection screens
used to generate the sample can be found in that paper. The final sample from Linck, Netter, and 10 I thank Jim Linck for allowing me to use these data.
14
Yang (2006) includes over 53,000 firm-year observations representing almost 7,000 firms. One
measure of internal governance is not taken from Linck, Netter, and Yang (2006), and that is a
measure of board “strength.” As in Harford and Li (2006), I follow Hermalin and Weisbach
(1998) and use CEO tenure as a proxy for the strength or independence of the board. Hermalin
and Weisbach (1998) argue that the board becomes less independent vis-à-vis the CEO as the
CEO’s tenure increases. The measures of board structure and insider ownership used in this paper
are:
Board size: The number of board members (minimum of 3);
Strong board: An indicator variable equal to one if the CEO’s tenure (in days) is below the
median tenure for CEOs of all firms in the Execucomp database in the given year, and zero
otherwise;
CEO is Chairman: An indicator variable equal to one if the CEO is also the Chairman of the
Board, and zero otherwise;
Board is insider dominated: an indicator variable equal to one if the percent of executive
directors on board is greater than 50%, and zero otherwise;
% ownership by of executive directors (officers): The fraction of the firm’s shares owned by
executive directors (officers);
% ownership by CEO: The fraction of the firm’s shares owned by the CEO.
The continuous variables (Board size, % ownership by of executive directors (officers), and %
ownership by CEO) are expressed in terms of deviations from the median for the given year for
all firms in the Linck, Netter, and Yang (2006) sample. Firms are considered to have “weak”
internal governance (and therefore high agency costs) in any given year if board size is greater

15
than the median (Jensen (1993) and Yermack (1996)), the board is not strong (Hermalin and
Weisbach (1998)), the CEO is also Chairman of the Board (Jensen (1993) and Brickley, Coles,
and Jarrell (1997)), the board is insider dominated (Weisbach (1988) and Brickley, Coles, and
Terry (1994)), or executive directors or the CEO have low ownership stakes in the firm (Jensen
and Meckling (1976)).11
The measures of external governance are based on external ownership and corporate-
charter-provisions data. I consider two measures of external ownership: ownership by
institutional investors and by public pension funds. Large institutional investors (including public
pension funds) potentially act as external monitors forcing firms in their portfolios to improve
decision-making and control, and the incentive to monitor is increasing in the stake held in the
firm by these investors.12 To some extent these two categories overlap, as public pension funds
are institutional investors (but not vice versa). However, public pension funds are considered to
be some of the most activist institutional monitors (see, for example, Brickley, Lease, and Smith
(1988), Smith (1996), Wahal (1996), and Del Guercio and Hawkins (1999)), and so considering
these two categories separately may provide insight into whether the type of institutional investor
influences monitoring and, in turn, dividend policy. The percent ownership by institutional
investors is taken from the sample in Linck, Netter, and Yang (2006), from which data is
available at the annual frequency. The percent ownership by public pension funds is derived from
CDA/Spectrum (13F) data, and is the percent of the firm’s shares owned by the public pension
11 Fama and Jensen (1983) and Morck, Shleifer, and Vishny (1988) recognize that the agency costs of external equity may not be monotonically decreasing in the fraction of the firm that is owned by managers. For example, while low levels of ownership insulate executives from the economic consequences of their decisions (the classic agency problem), high levels of managerial ownership may insulate managers from discipline by the market for corporate control. I take the simple approach of assuming that managers’ interests are aligned with the interests of their shareholders to a greater extent (i.e. lower agency costs) as ownership by the CEO and executive directors increases, but the results of spline regressions accounting for the effects of different levels of managerial ownership on the propensity to pay dividends are discussed in footnote 15. 12 Brickley, Lease, and Smith (1988) show that institutional investors, especially public pension funds, are more likely to vote against management-sponsored charter-amendment proposals than other types of investors are. Chen, Harford, and Li (2005) argue that institutional blockholders have better monitoring incentives than other investors and present evidence that institutional blockholders respond to those incentives by forcing managers to abandon value-destroying acquisitions.
16
funds collectively identified in three recent studies of the impact of public pension fund holdings
on stock returns (Cremers and Nair (2005), Dittmar and Mahrt-Smith (2006), and Larker,
Richardson, and Tuna (2005)) at the quarterly reporting date closest to the end of the fiscal year.
I use data from the Investor Responsibility Research Center (IRRC) database of corporate
charter provisions to measure the strength of a firm’s anti-takeover provisions. Anti-takeover
provisions help shield managers from discipline from the market for corporate control,
entrenching managers and potentially weakening governance by reducing managers’ incentives to
act in the best interests of shareholders. Bebchuk, Cohen, and Ferrell (2005) consider an index
which equals the sum of six indicator variables that capture whether a firm has a staggered board,
limits to amend the bylaws or charter, supermajority-voting provisions, golden parachutes, or a
poison pill. Bebchuk, Cohen, and Ferrell define the sum of these six indicator variables as the
entrenchment index, which takes values from 0 to 6 and is increasing in the number of anti-
takeover charter provisions that a firm has. The IRRC data is available for a cross-section of firms
in the years 1990, 1993, 1995, 1998, 2000, 2002 and 2004, and the IRRC data contains date
ranges for which each observation is valid for each firm. Firm-years are matched to IRRC data by
selecting the observation for which the end of the fiscal year falls within the relevant date range.
This procedure does generate serial correlation in governance measures for individual firms (as a
1990 observation from the IRRC data, for example, could be matched to the 1990, 1991, and
1992 fiscal years), but as the empirical tests use the Fama and Macbeth (1973) approach this
serial correlation should have little effect on my results. Firms are defined as having managerial
entrenchment if the Bebchuk, Cohen, and Ferrell (2005) (BCF) entrenchment index is greater
than the (pooled time-series and cross-sectional) median of two. The measures of external
governance are therefore:
% ownership by institutions: The fraction of the firm’s shares owned by institutional investors;
17
% ownership by public pension funds: The fraction of the firm’s shares owned by public
pension funds;
Managerial entrenchment (BCF definition): An indicator variable equal to one if the BCF
entrenchment index is greater than two (the pooled time-series and cross-sectional median),
and zero otherwise.
The continuous variables (% ownership by institutions and % ownership by public pension funds)
are expressed in terms of deviations from the cross-sectional median. The median of % ownership
by institutions is computed each year using the firms in the Linck, Netter, and Yang (2006)
sample. The median of % ownership by public pension funds is computed for each quarterly
reporting date for all firms in the CDA/Spectrum (13F) database. Firms are considered to have
“weak” external governance in any given year if institutions or public pension funds hold low
stakes in the firm or if managers are entrenched using the BCF definition.
C. Sample and empirical results
The sample of predicted dividend payers and matches to the various governance data
sources described above is depicted in Table 2. The first column contains the number of predicted
dividend payers each year from 1974 to 2004.13 The sample is well distributed over time, with
only minor clustering in the late 1970’s and early 1980’s. The second column contains the
percentage of the predicted payers that actually do pay dividends in each year. This percentage
averages 81.5% over the whole sample, but is markedly higher in the early years of the sample
than in the later years. It is possible that this reflects a declining propensity to pay dividends
(Fama and French (2001)), but could also be driven by the predictive content of the model
13 The sample in Table 2 starts in 1974 because the regression in Table 1 uses observations from 1973 onwards and it takes two consecutive years of greater than 50% predicted probability of being a dividend payer to enter the sample in Table 2. This implies that the first year that I should observe a predicted dividend payer will be 1974.
18
declining over time. On average in the full sample, however, 4 out of 5 firms that are predicted
payers do actually pay dividends – the main research question in this paper is whether governance
characteristics affect the propensity for firms to adopt the predicted financial policy.
The remaining four columns in Table 2 show how many firms in each year are matched
to the various governance data sources described above. Again, the distribution over time of each
series is relatively stable after the point that the first match occurs. Most of the governance
measures are available for a substantial fraction of predicted payers from 1990 onwards, although
the data from CDA/Spectrum on public pension fund ownership starts considerably earlier (1979)
than measures from the other data sources.
Table 3 contains the principal empirical results in this section, and demonstrates the
empirical relation between the propensity to pay dividends for predicted dividend payers and
governance characteristics. The regressions are similar to those in Table 1, with Fama and
Macbeth (1973) methods used to analyze annual logit regressions with an indicator variable equal
to one if dividends are paid (and zero otherwise) as the dependent variable. The difference
between the regressions in Table 1 and those in Table 3 is that in Table 3 the sample is
constrained to predicted dividend payers only and the governance variables described above are
included as explanatory variables. I include the same explanatory variables as used in Table 1
(RE/TE, TE/TA, ROA, and so on) as control variables because even though all firm-years in the
sample for Table 3 have high (>50%) predicted probability of paying dividends, cross-sectional
dispersion in firms’ fundamentals may still affect the decision to adopt the predicted dividend
policy.
The first three columns introduce the governance variables into the regression in groups:
board characteristics in column 1, the anti-takeover-provision-based entrenchment index in
column 2, and the ownership variables in column 3. The regressions use all available observations
with non-missing data over the longest time span possible. For example, the regressions in
column 1 use a total of 5,141 observations for 13 annual logit regressions (1992 – 2004), with an
19
average of 395 firm-specific observations per year. The number of observations used and the time
span over which the logits are estimated are similar for the other columns in Table 3, but the loss
in sample size (to 3,113 total observations with an annual average of 259) is the most serve in the
final column where all governance attributes are included at the same time
The regression in column 1 shows that board size and CEO/Chairman duality
significantly14 influence dividend policy in the direction predicted by the substitute model (H1b):
firms with larger boards and firms with one individual sharing the title of CEO and Chairman are
significantly more likely to pay dividends to shareholders. Jensen (1993) and Yermack (1996)
suggest that large boards are easier for the CEO to manipulate, and even more so if the CEO is
also Chairman, consistent with the notion that these characteristics are associated with weaker
monitoring of insiders and higher agency costs. Consistent with the substitute model, predicted
dividend payers with weaker governance or greater agency problems are more likely to actually
pay dividends than are predicted payers with strong governance. The same is true in column 2, in
which the entrenchment index from Bebchuk, Cohen, and Ferrell (2005) is the only governance
variable. The coefficient on the entrenchment index is strongly statistically different from zero
and positive (as in Pan (2006)), suggesting that predicted payers with entrenched managers are
more likely to pay dividends.
The coefficients on the ownership variables in column 3 also support the substitute model
(H1b) and offer little support for the outcome model (H1a). Firms in this sample with low
ownership (relative to the median) by officers of the firm, the CEO, and institutional investors are
significantly more likely to adopt a policy of paying dividends. Executive ownership levels
greatly affect the extent to which executives share with stockholders the economic costs and
benefits of their actions, thereby influencing the extent of the agency problem (Jensen and
Meckling (1976)), and institutional investors potentially provide important external monitoring of
14 The 5% (1%) two-sided cutoff value from the t-distribution with 12 degrees of freedom (there are 13 coefficients averaged to produce each coefficient in Table 3) is approximately 2.18 (3.06).
20
executives and the board. Therefore, the ownership evidence is again consistent with the notion
that firms with weak governance are more likely to pay dividends as a commitment device.15
The regression in column 4 includes all the governance proxies at the same time. The
sign and significance of the coefficients on board size and ownership by executive directors and
institutions do not change. However, the statistical significance of the coefficients on the
CEO/Chairman duality, managerial entrenchment, and CEO ownership variables is reduced to the
point where those coefficients are not reliably different from zero at conventional levels.
However, the coefficient on the indicator variable for an insider dominated board is positive
(consistent with H1b) and statistically significant at the 10% level in this specification, and the
effect of public pension fund ownership levels on the propensity to pay dividends is statistically
significantly different from zero at the 1% level. The latter result suggests that predicted payers
with low ownership levels by the most activist institutional investors are more likely to make
dividend payments to stockholders.16
Taken together, these results are the most consistent with the substitute model described
above (H1b). There is no evidence that strong governance makes dividends more likely to be paid
when firm fundamentals support such a policy, as predicted by the outcome model in La Porta et
al (2000). Instead, firms with weak governance appear more likely to pay dividends when they
should: predicted payers are more likely to make dividend payments if board size is large, the
15 The negative coefficients on CEO and executive director ownership variables are driven by CEO and executive director ownership below a 25% threshold. Specifically, the results of unreported spline regressions suggest that the propensity for firms in this sample to pay dividends is decreasing as CEO ownership increases between zero and five percent and as executive director ownership increases between five and 25 percent. These results are consistent with the assumption that increased ownership by insiders improves governance only when such ownership begins at a relatively low (less than 25%) base. Interestingly, the coefficient on CEO ownership in unreported spline regressions is positive (but statistically insignificant, t = 1.01) for CEO ownership levels in excess of 25%, consistent with the notion that increases in CEO ownership starting from a high base (over 25%) makes governance weaker because managers are already entrenched at high ownership levels. 16 The control variables in Table 3 are relatively stable in terms of sign and significance across all specifications. The earned/contributed capital mix (RE/TE), return on assets, growth, and size have similar effects on dividend paying behavior as seen in Table 1 and described in DeAngelo, DeAngelo, and Stulz (2006).
21
CEO is also Chairman of the Board, anti-takeover provisions protect managers from external
discipline, and when ownership levels by executives and important external monitors are low.
D. Robustness tests
There are several alternative specifications that can be used to test the robustness of the
conclusions derived from Table 3. One concern about the results presented in Table 3 is that the
effect of governance characteristics on payout policy may be different than the effect on dividend
policy. In other words, firms with strong governance may be less likely to pay dividends when
fundamentals suggests they should, but that may be because managers at such firms act in the
interests of their shareholders and distribute cash in the form of repurchases (which are tax-
advantaged) instead of tax-disadvantaged dividends.
To that end, the first column of Table 4 replicates the regression in the final column of
Table 3 except that the dependent variable is an indicator variable equal to one if the firm makes a
payout in the form of dividends or repurchases (and zero otherwise). Stock repurchases are
identified as described in Fama and French (2001). Considering total payouts instead of just
dividends does weaken the relation between governance characteristics and payout policy, as
three of the coefficients that are statistically significantly related to dividend payments in Table 3
(Board is insider dominated, ownership by executive directors, and ownership by public pension
funds) are not significantly related to total payouts in the first column of Table 4. However, the
coefficients on board size and ownership by institutional investors have signs and significance
levels consistent with Table 3 and the predictions of the substitute model. The fact that including
repurchases in total payout policy weakens the relation between payout policy and governance
measures is consistent with the findings in Knyazeva and John (2006).
A further concern with the results in Table 3 is that the definition of “predicted payer”
may not accurately identify those firms that should be paying dividends. The second column of
Table 4 replicates the last column in Table 3 for a sample of firm-years for which a firm is only
22
considered to be a predicted payer after five consecutive years with the probability of being a
payer (from Table 1) above 50%. While this reduces the sample size (the set of firms with five
consecutive years of probability above 50% is a subset of the set of firms with two consecutive
years of probability above 50%), the results in the second column of Table 4 are qualitatively
similar to those in the last column of Table 3. The only significance level affected by the more
stringent definition of predicted payers is for the coefficient on the insider-dominated board
indicator variable, which is marginally significant in Table 3 but insignificant in the second
column of Table 4.
It is also true that dividend policy is not a binary decision – firms can choose to pay out
more or less of (free) cash flow or holdings once the decision to pay dividends has been made.
The last column in Table 4 analyzes the effect of governance characteristics on a continuous
measure of dividend policy – the dividend payout ratio. The dividend payout ratio is defined here
as the total amount of dividends paid in the fiscal year divided by the firm’s pre-dividend cash
balance (sum of the firm’s cash balance at the end of the fiscal year plus the total amount of
dividends paid in the fiscal year). This continuous variable ranges from zero to 1.27, and
measures both whether dividends are paid and how much of the firm’s pre-dividend cash balance
is paid out to stockholders in the form of dividends. As can be seen in the final column of Table
4, the relation between governance measures and a continuous measure of dividend policy are
practically identical to those in the fourth column of Table 3, with the only substantial difference
being the loss of significance of the coefficient on public pension fund ownership and the
dramatic increase in the statistical significance of the coefficient on the managerial entrenchment
index.
Overall, the results in Tables 3 and 4 are strongly supportive of the substitute model for
the relation between governance and dividend policy (H1b). It appears that firms with
characteristics associated with weak governance (large boards, more anti-takeover charter
amendments, and low ownership by both insiders (CEO and executive directors) and institutional
23
investors) are both more likely to pay dividends and pay out more of their pre-dividend cash
balances when they do pay dividends. This evidence suggests that dividend payments substitute
for other forms of governance by removing free cash flow from managers’ control, and offers
little support for the outcome model in La Porta et al (2000).
III. Dividend initiation announcement returns and governance characteristics
A long-established stylized-fact in the corporate finance literature is that dividend
initiations are associated with positive stock returns on average (for example, Asquith and
Mullins (1983), although similar findings persist in studies using larger and different sample
periods). These positive announcement returns are typically interpreted as implying that dividend
initiation announcements communicate valuable and positive information to investors, although
the evidence that such information relates to future increases in profitability is relatively weak
(Watts, 1973; DeAngelo, DeAngelo, and Skinner, 1996).
A possibility raised by the evidence in Section II, and until now relatively unexplored in
the literature despite hints at its importance (for example, Easterbrook (1984) and Lang and
Litzenberger (1989)), is that positive stock-price reactions to dividend initiation announcements
can be explained by variation in the governance policies of initiating firms. In other words, if
firms use dividend payments as a substitute for alternative governance characteristics to diminish
the agency problem between managers and shareholders, then the announcement that a firm is
initiating dividends should be associated with a positive stock price reaction as the market adjusts
its estimate of firm value to account for the lower agency costs. Furthermore, as the reduction in
agency costs is the greatest for firms with the weakest pre-initiation governance, returns around
initiations should be significantly more positive for firms with weak governance than for firms
with strong governance (H2b).

24
A. Dividend initiations and initiation announcement returns
I form a sample of dividend initiations from the CRSP database. Specifically, dividend
initiation announcements are defined as the first announcement by a firm listed in CRSP of an
ordinary, taxable, cash dividend payable at the quarterly, semi-annual, or annual frequency to
holders of ordinary common stock (share codes 10 and 11) listed on the NYSE, Nasdaq, or
Amex. Each firm is in the sample only once (subsequent dividend initiations following an
omission are ignored), and financial (SIC codes 6000 to 6999) and utility (SIC codes 4900 to
4949) firms are discarded. All firms in the sample of dividend initiators must have a stock price
on CRSP 365 calendar days prior to the initiation announcement and be covered by the
Compustat database (with no dividends recorded by Compustat in the prior five fiscal years).
Table 5 shows the distribution of initiation announcements by year of announcement.
There are 1,263 dividend initiation announcements between 1963 and 2004 that meet the criteria
described above. The second column in Table 5 contains the percentage of those announcements
for which there is a quarterly earnings announcement date within a 21-day window centered on
the dividend initiation announcement date.17 33% of the initiation announcements have a
quarterly earnings announcement in the preceding or following ten days, although that fraction is
considerably higher nearer the end of the sample period.18 As documented later in this paper (and
in Asquith and Mullins (1983)), the incidence of an earnings announcement in the window
surrounding a dividend initiation announcement has almost no perceptible effect on the average
dividend initiation announcement return. For most of the analysis, therefore, I ignore the fact that
a substantial fraction of dividend initiation announcements are timed with quarterly earnings
releases.
The final four columns in Table 5 document how many of the firms initiating dividends
are covered in the various databases used to obtain governance data. Most of the matches between
17 Compustat begins recording quarterly earnings announcement dates in 1971. 18 Asquith and Mullins (1983) report that 66 of their 160 dividend initiations announcements (41%) from 1963 – 1980 have an earnings announcement within ± 10 days.
25
dividend initiators and governance data span the 1991 – 2004 period, and therefore this is the
effective sample period for my analysis of the relation between governance characteristics and
dividend initiation announcement returns.
Table 6 contains descriptive statistics for dividend initiation announcement abnormal
returns. Cumulative abnormal announcement returns are the firm-specific sum of abnormal
returns during the three-trading-day window centered on the dividend initiation announcement
date, and daily abnormal returns are the difference between firm return and the value-weighted
market return from CRSP. The two columns in Table 6 show equal- and value-weighted averages
of cumulative abnormal announcement returns for various subsamples of the data, where the
value weights are market capitalizations from CRSP three trading-days prior to the dividend
initiation announcement date.
The first entry in the first column is the usual result for dividend initiation announcement
returns (see, for example, Asquith and Mullins (1983)). For the full sample from 1963 – 2004,
three-day equally-weighted average initiation announcement abnormal returns are 3.6%, which is
statistically significantly different from zero at the 1% level (median of 2%, also statistically
significantly different from zero). The corresponding value-weighted average (second column),
however, is significantly negative. As can be seen in the second row, this is almost entirely due to
the over-weighting of Microsoft (cumulative abnormal return of -7% for the three-trading-day
period surrounding Microsoft’s dividend initiation announcement on January 16th, 2003) in the
value-weighted average. Excluding Microsoft from the sample leaves the equal-weighted average
initiation return virtually unchanged, but causes the value-weighted return to revert to being
significantly positive. While the full-sample average-return characteristics are consistent with
much of the prior literature, it is notable that one observation (Microsoft) has such a dramatic
effect on value-weighted dividend initiation return averages.
26
Excluding initiations within ±10 days of an earnings announcement (third row in Table 6)
has little effect on the average initiation announcement returns,19 which are significantly positive
regardless of the weighting scheme. Clearly, some of the proximate earnings announcements are
“good news” and some “bad news,” suggesting that the proximity of earnings announcements
does not dramatically change the overall distribution of initiation returns. The fourth row in Table
6 shows average dividend initiation returns for the sample period during which most governance
data is available (1991 – 2004), and the returns during that subsample are very similar to those in
the full sample.
The last four rows of Table 6 contain descriptive statistics for the subsamples of initiation
announcements for which the initiating firm can be matched to the various databases containing
governance data. All these subsamples contain the Microsoft initiation, explaining the
significantly negative value-weighted average returns. However, apart from the limited
subsample with Execucomp data (used to form the Strong board variable), the other subsamples
have significantly positive equal-weighted mean and median initiation announcement abnormal
returns, with little difference between the data-availability subsamples and the main sample
averages in the upper half of the table. All average initiation announcement abnormal returns
reported in the remainder of this paper are equal-weighted and for the largest subsamples
available (including the Microsoft initiation).
Table 7 contains comparisons of average abnormal dividend initiation announcement
returns for subsamples of initiators with “weak” and “strong” governance. As hypothesized in
H2b, I expect to observe significantly more positive initiation announcement returns for firms
with weak governance than for firms with strong governance. The set of governance measures
used to proxy for “weak” and “strong” governance are the same as those outlined in Section II.
Dividend initiators are defined as having “weak” governance if board size is above the median,
19 Microsoft’s 2003 dividend initiation announcement (1/16/2003) occurred on exactly the same day as the second-quarter earnings announcement.
27
strong board equals zero, the CEO is also chairman, the board is insider dominated (percent of
executive directors (officers) on board > 50%), the BCF index indicates managerial
entrenchment, or the percent ownership by executive directors, the CEO, institutional investors,
or public pension funds is below the median. All medians are for all firms from the same data
source in the same year or reporting period. Dividend initiators that are not defined as having
“weak” governance (in each row) are defined as having “strong” governance.
Average abnormal announcement returns for dividend initiators with weak governance
are insignificantly different from average announcement returns for initiators with strong
governance when the strength of governance is measured using most of the internal governance
characteristics shown in Table 7. The sole exception is when the sample is split based on the
Board is insider dominated indicator variable: in that case, firms with weak internal governance
(insider dominated boards) have average dividend initiation announcement returns of 4.3%,
which is significantly greater (at the 10% level) than the average initiation announcement returns
of 2.3% for firms with strong governance by the same metric. This is the only result in the
internal governance panel that supports the substitute hypothesis (H2b).
However, a much more consistent pattern emerges when the external governance metrics
are employed in the bottom panel of Table 7. Dividend initiators with entrenched managers under
the BCF definition and low institutional and public pension fund ownership have significantly
more positive abnormal dividend initiation returns than do firms with strong governance by those
criteria. For example, the 34 firms for which the BCF index indicates managerial entrenchment
have average dividend initiation announcement returns of 2.9% (statistically significantly
different from zero at the 1% level), which is reliably different from the average dividend
initiation return of 0.8% (not statistically significantly different from zero) for firms without
entrenched managers. The same result holds when institutional or public pension fund ownership
is considered as an external governance proxy, with below-median ownership by important
28
outside investors hypothesized to reduce the monitoring of managers and increase the potential
for agency problems.20
The results in Table 7 also hold in a multivariate regression setting, although these results
are omitted for brevity.21 Lie (2000) shows that the two most important control variables in
regressions explaining dividend-change abnormal announcement returns are firm size and
dividend yield. Introducing each of the significant variables in Table 7 (insider dominated boards,
the BCF entrenchment index, and the ownership levels of external monitors) into a multivariate
regression explaining initiation returns while controlling for size and dividend yield results in
qualitatively identical results to those presented in a univariate setting in Table 7.
The results in Table 7 also suggest that variation in governance policies do not
completely explain the positive stock price reactions to initiation announcements. In other words,
while firms with weak governance appear to have significantly higher initiation announcement
abnormal returns, firms with strong governance do experience significantly positive
announcement returns (the last column in Table 7). At the margin, variation in governance
policies does contribute to positive dividend initiation announcement returns, but clearly there are
factors other than the governance variables measured here that contribute to initiation
announcement returns. The literature has failed to provide convincing evidence that a signal about
future earnings is one of these factors, leaving open the possibility that some measure of agency
costs that is orthogonal to the measures presented here will provide an important explanation for
dividend initiation announcement returns.
Dividend initiation announcement returns lend support to the substitute hypothesis (H2b).
Firms with characteristics indicative of weak governance (insider dominated boards, entrenched
20 The negative relation between institutional holdings and dividend initiation abnormal returns is consistent with the results in Amihud and Li (2006), who find that dividend announcement returns are lower for firms with higher institutional shareholdings. Amihud and Li interpret this finding as consistent with the hypothesis that institutional investors are more sophisticated and informed than other investors, and therefore that their information is reflected in prices prior to dividend announcement dates. Amihud and Li do not specifically consider dividend initiations in their analysis. 21 But available from the author by request.
29
managers, and low ownership by institutional investors and activist public pension funds) have
significantly more positive initiation announcement abnormal returns than do dividend initiators
with characteristics suggestive of strong governance. These results are consistent with the notion
that dividend policy is one component of the package of policies that firms use to bond with
stockholders, and that the abnormal returns to initiating a policy of paying dividends reflect an
anticipated reduction in the agency costs of external equity.
IV. Conclusion
This paper provides evidence that corporate governance affects both the willingness of
firms to pay dividends and the market reaction to dividend initiation announcements. Firms with
characteristics that are thought to proxy for weak internal and external governance (large, insider
dominated boards, entrenched managers, and low ownership levels by insiders and important
external monitors) are more likely to pay cash out to stockholders in the form of dividends,
although there is some evidence that these firms are also less likely to pay cash out to
stockholders in the form of stock repurchases. Such firms also experience significantly more
positive stock price reactions to dividend initiation announcements. Taken together, these results
suggest that firms use dividend policy to compensate for other characteristics that have the
potential to create agency problems between managers and outside equity holders. Dividend
policy, therefore, appears to be a substitute for other control mechanisms in the equilibrium
monitoring/bonding package chosen by firms, and the market values the anticipated reduction in
agency costs resulting from the choice to begin paying dividends.
The results in this paper suggest several avenues for future research. While initiation
announcement returns are significantly more positive for firms with weak governance, initiation
returns are significantly different from zero (and positive) even for firms that traditional proxies
suggest have strong internal and external governance mechanisms. Clearly, something other than
an anticipated reduction in agency costs also drives abnormal equity returns around dividend
30
initiation announcements. Given that most empirical evidence in the literature does not support a
signaling explanation (Watts, 1973; DeAngelo, DeAngelo, and Skinner, 1996), a more thorough
analysis of dividend initiation announcement returns appears warranted. One possibility,
suggested by Grullon, Michaely, and Swaminathan (2002), is that abnormal stock price
appreciations around dividend initiation announcements are driven by lower risk premiums:
initiating dividend payments may signal financial maturity and therefore lower risk. However,
dividend initiations also frequently signal operating maturity, in terms of lower future growth,
earnings (Grullon, Michaely, and Swaminathan (2002)), and cash flows. An analysis of how
maturity (both financial and operational) interacts with the governance implications of dividend
initiations, and the fact that the governance implications will be different for growing firms than
for “harvesting” firms, has the potential to significantly expand our understanding of dividend
policy and the market reaction to dividend policy changes.
31
References
Allen, F., Bernado, A., Welch, I., 2000. A theory of dividends based on tax clienteles. Journal of
Finance 55, 2499-2536.
Amihud, Y., Li, K., 2006. The declining information content of dividend announcements and the
effect of institutional holdings. Journal of Financial and Quantitative Analysis 41, 637-
660.
Asquith, P., Mullins. D., 1983. The impact of initiating dividend payments on shareholders’
wealth. Journal of Business 56, 77-96.
Barclay, M., Holderness, C., 1991.Negotiated block trades and corporate control. Journal of
Finance 46, 861-878.
Bebchuk, L., Cohen, A., Ferrell, A., 2005. What matters in corporate governance? Harvard Law
School John M. Olin Center Discussion Paper No. 491.
Black, F., 1976. The dividend puzzle. Journal of Portfolio Management 2, 5-8.
Brickley, J., Coles, J., Jarrell, G., 1997. Leadership structure: Separating the CEO and Chairman
of the Board. Journal of Corporate Finance 3, 189-220.
Brickley, J., Coles, J., Terry, R., 1994. Outside directors and the adoption of poison pills. Journal
of Financial Economics 35, 371-390.
Brickley, J., Lease, R., Smith, C., 1988. Ownership structure and voting on antitakeover
amendments. Journal of Financial Economics 20, 267-291.
Chen, X., Harford, J., Li, K., 2005. Monitoring: Which institutions matter? Working paper,
University of British Columbia.
Cremers, M., Nair, V., 2005. Governance mechanisms and equity prices. Journal of Finance 60,
2859-2894.
DeAngelo, H., DeAngelo, L., 2006. The irrelevance of the MM dividend irrelevance theorem.
Journal of Financial Economics 79, 293-315.
32
DeAngelo, H., DeAngelo, L., Skinner, D., 1996. Reversal of fortune: Dividend signaling and the
disappearance of sustained earnings growth. Journal of Financial Economics 40, 341-
371.
DeAngelo, H., DeAngelo, L., Skinner, D., 2004. Are dividends disappearing? Dividend
concentration and the consolidation of earnings. Journal of Financial Economics 72, 425-
456.
DeAngelo, H., DeAngelo, L., Stulz, R., 2006. Dividend policy and the earned/contributed capital
mix: a test of the life-cycle theory. Journal of Financial Economics, forthcoming.
Del Guercio, D., Hawkins, J., 1999. The motivation and impact of pension fund activism. Journal
of Financial Economics 52, 293-340.
Dittmar, A. Mahrt-Smith, J., 2005. Corporate governance and the value of cash holdings. Journal
of Financial Economics, forthcoming.
Easterbrook, F., 1984. Two agency-cost explanations of dividends. American Economic Review
74, 650-659.
Fama, E., French, K., 1997. Industry costs of equity. Journal of Financial Economics 43, 153-
193.
Fama, E., French, K., 2001. Disappearing dividends: changing firm characteristics or lower
propensity to pay? Journal of Financial Economics 60, 3-43.
Fama, E., Jensen, M., 1983. Separation of ownership and control. Journal of Law and Economics
26, 301-325.
Fama, E., MacBeth, J., 1973. Risk, return, and equilibrium: empirical tests. Journal of Political
Economy 81, 607–636.
Fenn, G., Liang, N., 2001. Corporate payout policy and managerial stock incentives. Journal of
Financial Economics 60, 45-72.
33
Gillan, S., Hartzell, J., Starks, L., 2006. Tradeoffs in corporate governance: Evidence from board
structures and charter provisions. Working paper, University of Texas at Austin.
Gompers, P., Iishi, J., Metrick, A., 2003. Corporate governance and equity prices. Quarterly
Journal of Economics 118, 107-155. Grullon, G., Michaely, R., Swaminathan, B., 2002. Are dividend changes a sign of firm maturity?
Journal of Business 75, 387-424.
Gugler, K., 2003. Corporate governance, dividend payout policy, and the interrelation between
dividends, R&D, and capital investment. Journal of Banking and Finance 27, 1297-1321.
Harford, J., Li, K., 2006. Decoupling CEO wealth and firm performance: The case of acquiring
CEOs. Journal of Finance, forthcoming.
Harford, J., Mansi, S., Maxwell, W., 2005. Corporate governance and a firm’s cash holdings.
Working paper, University of Washington.
Hermalin, B., Weisbach, M., 1998. Endogenously chosen boards of directors and their monitoring
of the CEO. American Economic Review 88, 96-118.
Hu, A., Kumar, P., 2004. Managerial entrenchment and payout policy. Journal of Financial and
Quantitative Analysis 39, 759-790.
Jensen, M., 1986. Agency costs of free cash flow, corporate finance, and takeovers. American
Economic Review 76, 323-329.
Jensen, M., 1993. The modern industrial revolution, exit, and the failure of internal control
systems. Journal of Finance 48, 831-880.
Jensen, M., Meckling, W., 1976. Theory of the firm: Managerial behavior, agency costs, and
ownership structure. Journal of Financial Economics 3, 305-360.
Jensen, G., Solberg, D., Zorn, T., 1992. Simultaneous determination of insider ownership, debt,
and dividend policies. Journal of Financial and Quantitative Analysis 27, 247-263.
John. K., Knyazeva, A., 2006. Payout policy agency conflicts, and corporate governance.
Working paper, New York University.
34
La Porta, R., Lopez-de-Silanes, F., Shleifer, A., Vishny, R, 2000. Agency problems and dividend
policies around the world. Journal of Finance 55, 1-33.
Lambert, R., Lanen, W., Larcker, D., 1989. Executive stock option plans and dividend policy.
Journal of Financial and Quantitative Analysis 24, 409-425.
Lang, L., Litzenberger, R., 1989. Dividend announcements: Cash flow signaling vs. free cash
flow hypothesis. Journal of Financial Economics 24, 181-191.
Larcker, D., Richardson, S., Tuna, A., 2005. How important is corporate governance? Working
paper, University of Pennsylvania.
Lie, E., 2000. Excess funds and agency problems: An empirical study of incremental cash
disbursements. Review of Financial Studies 13, 219-248.
Linck, J., Netter, J., Yang, T., 2006. The determinants of board structure. Working paper,
University of Georgia.
Michaely, R., Roberts, M., 2006. Dividend smoothing, agency costs, and information asymmetry:
Lessons from the dividend policies of private firms. Working paper, Cornell University.
Morck, R., Shleifer, A., Vishny, R., 1988. Management ownership and market valuation: An
empirical analysis. Journal of Financial Economics 20, 293-315.
Myers, S., 2000. Outside equity. Journal of Finance 55, 1005-1037.
Nielsen, A., 2005. Corporate governance, leverage, and dividend policy. Working paper,
Princeton University.
Pan, C., 2006. Why are firms with entrenched managers more likely to pay dividends? Working
paper, Ohio State University.
Renneboog, L., Szilagyi, P., 2006. How relevant is dividend policy under low shareholder
protection? Working paper, Tilburg University.
35
Rozeff, M., 1982. Growth, beta, and agency costs as determinants of dividend payout ratios.
Journal of Financial Research 5, 249-259.
Smith, M., 1996. Shareholder activism by institutional investors: Evidence for CalPERS. Journal
of Finance 51, 227-252.
Tse, C., 2004. A critique of the logic of the agency costs theory for dividends in the finance
literature. Journal of Interdisciplinary Economics 15, 25-40.
Wahal, S., 1996. Pension fund activism and firm performance. Journal of Financial and
Quantitative Analysis 31, 1-23.
Watts, R., 1973. The information content of dividends. Journal of Business 2, 191-211.
Weisbach, M., 1988. Outside directors and CEO turnover. Journal of Financial Economics 20,
431-460.
Yermack, D., 1996. Higher market valuation of companies with a small board of directors.
Journal of Financial Economics 40, 185-211
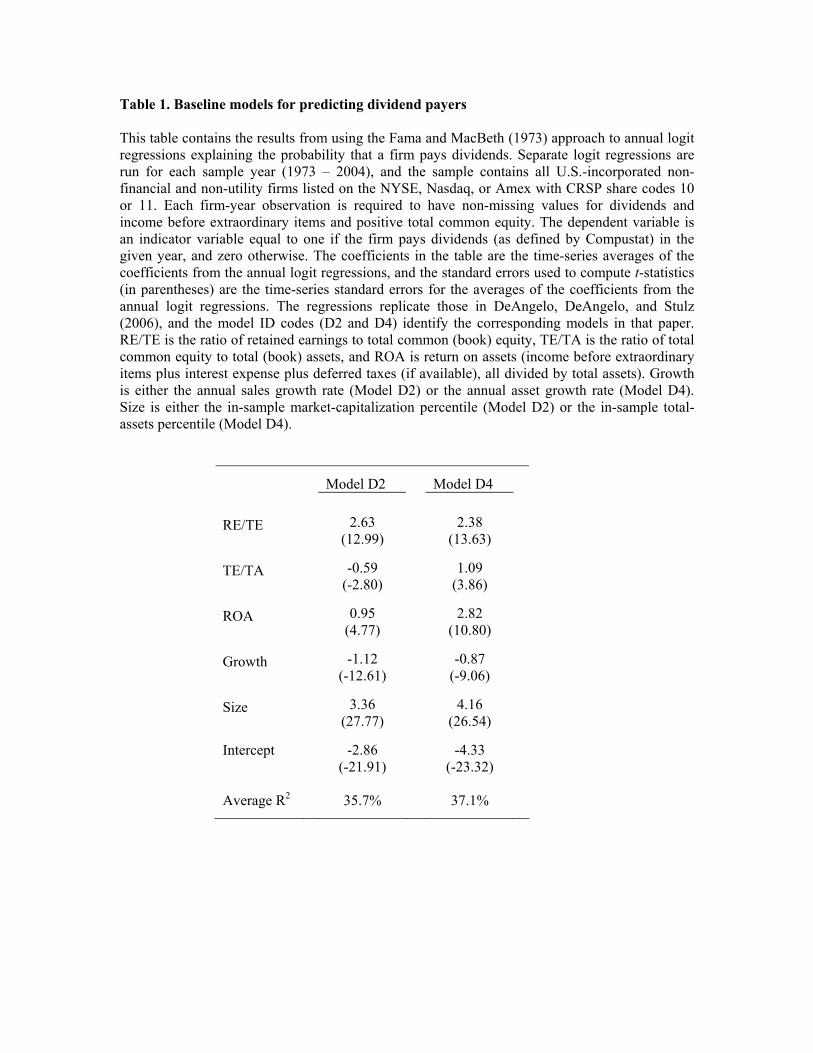
Table 1. Baseline models for predicting dividend payers This table contains the results from using the Fama and MacBeth (1973) approach to annual logit regressions explaining the probability that a firm pays dividends. Separate logit regressions are run for each sample year (1973 – 2004), and the sample contains all U.S.-incorporated non-financial and non-utility firms listed on the NYSE, Nasdaq, or Amex with CRSP share codes 10 or 11. Each firm-year observation is required to have non-missing values for dividends and income before extraordinary items and positive total common equity. The dependent variable is an indicator variable equal to one if the firm pays dividends (as defined by Compustat) in the given year, and zero otherwise. The coefficients in the table are the time-series averages of the coefficients from the annual logit regressions, and the standard errors used to compute t-statistics (in parentheses) are the time-series standard errors for the averages of the coefficients from the annual logit regressions. The regressions replicate those in DeAngelo, DeAngelo, and Stulz (2006), and the model ID codes (D2 and D4) identify the corresponding models in that paper. RE/TE is the ratio of retained earnings to total common (book) equity, TE/TA is the ratio of total common equity to total (book) assets, and ROA is return on assets (income before extraordinary items plus interest expense plus deferred taxes (if available), all divided by total assets). Growth is either the annual sales growth rate (Model D2) or the annual asset growth rate (Model D4). Size is either the in-sample market-capitalization percentile (Model D2) or the in-sample total-assets percentile (Model D4).
Model D2 Model D4
RE/TE
2.63
2.38
(12.99) (13.63)
TE/TA
-0.59
1.09
(-2.80) (3.86)
ROA
0.95
2.82
(4.77) (10.80)
Growth
-1.12
-0.87
(-12.61) (-9.06)
Size
3.36
4.16
(27.77) (26.54)
Intercept
-2.86
-4.33
(-21.91) (-23.32) Average R2 35.7% 37.1%
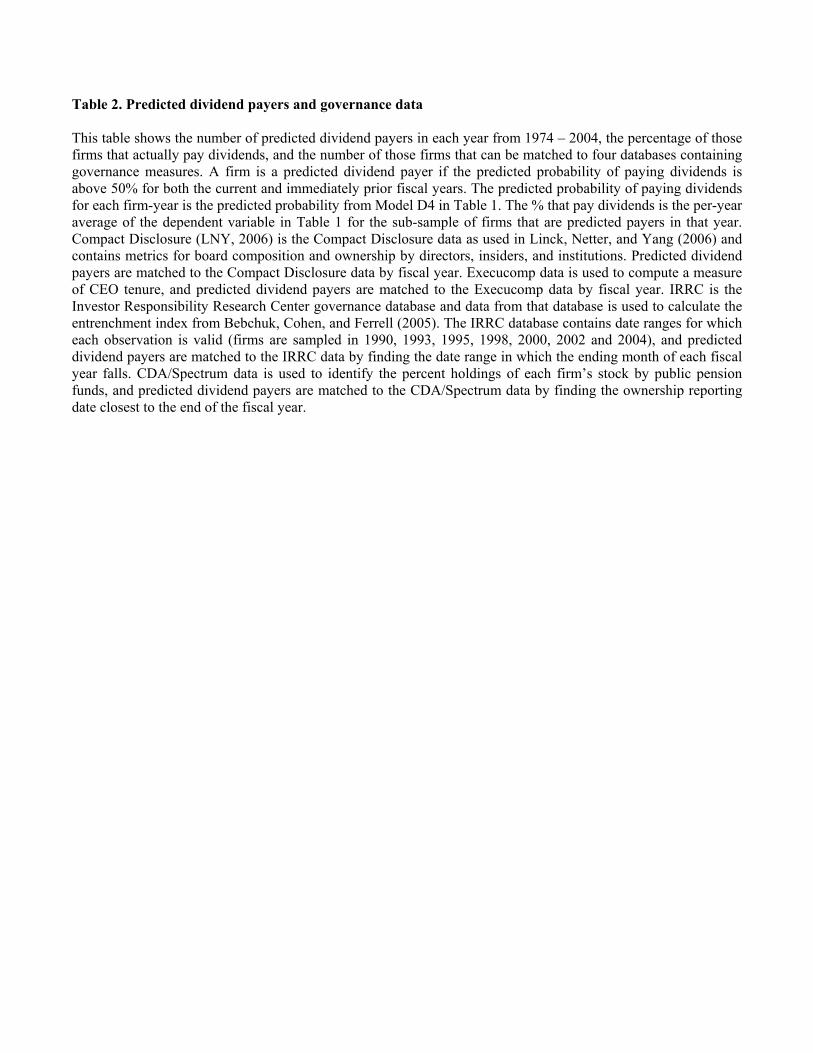
Table 2. Predicted dividend payers and governance data This table shows the number of predicted dividend payers in each year from 1974 – 2004, the percentage of those firms that actually pay dividends, and the number of those firms that can be matched to four databases containing governance measures. A firm is a predicted dividend payer if the predicted probability of paying dividends is above 50% for both the current and immediately prior fiscal years. The predicted probability of paying dividends for each firm-year is the predicted probability from Model D4 in Table 1. The % that pay dividends is the per-year average of the dependent variable in Table 1 for the sub-sample of firms that are predicted payers in that year. Compact Disclosure (LNY, 2006) is the Compact Disclosure data as used in Linck, Netter, and Yang (2006) and contains metrics for board composition and ownership by directors, insiders, and institutions. Predicted dividend payers are matched to the Compact Disclosure data by fiscal year. Execucomp data is used to compute a measure of CEO tenure, and predicted dividend payers are matched to the Execucomp data by fiscal year. IRRC is the Investor Responsibility Research Center governance database and data from that database is used to calculate the entrenchment index from Bebchuk, Cohen, and Ferrell (2005). The IRRC database contains date ranges for which each observation is valid (firms are sampled in 1990, 1993, 1995, 1998, 2000, 2002 and 2004), and predicted dividend payers are matched to the IRRC data by finding the date range in which the ending month of each fiscal year falls. CDA/Spectrum data is used to identify the percent holdings of each firm’s stock by public pension funds, and predicted dividend payers are matched to the CDA/Spectrum data by finding the ownership reporting date closest to the end of the fiscal year.
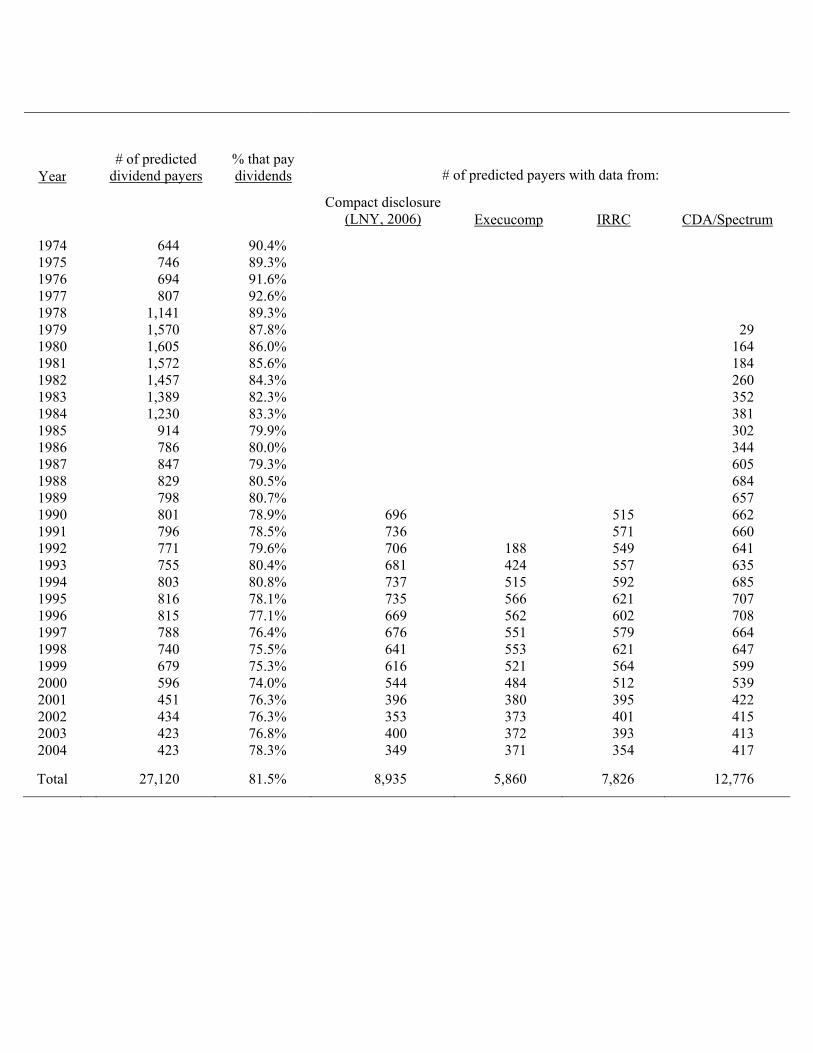
Year
# of predicted dividend payers
% that pay dividends # of predicted payers with data from:
Compact disclosure (LNY, 2006) Execucomp IRRC CDA/Spectrum
1974 644 90.4% 1975 746 89.3% 1976 694 91.6% 1977 807 92.6% 1978 1,141 89.3% 1979 1,570 87.8% 29 1980 1,605 86.0% 164 1981 1,572 85.6% 184 1982 1,457 84.3% 260 1983 1,389 82.3% 352 1984 1,230 83.3% 381 1985 914 79.9% 302 1986 786 80.0% 344 1987 847 79.3% 605 1988 829 80.5% 684 1989 798 80.7% 657 1990 801 78.9% 696 515 662 1991 796 78.5% 736 571 660 1992 771 79.6% 706 188 549 641 1993 755 80.4% 681 424 557 635 1994 803 80.8% 737 515 592 685 1995 816 78.1% 735 566 621 707 1996 815 77.1% 669 562 602 708 1997 788 76.4% 676 551 579 664 1998 740 75.5% 641 553 621 647 1999 679 75.3% 616 521 564 599 2000 596 74.0% 544 484 512 539 2001 451 76.3% 396 380 395 422 2002 434 76.3% 353 373 401 415 2003 423 76.8% 400 372 393 413 2004 423 78.3% 349 371 354 417
Total 27,120 81.5% 8,935 5,860 7,826 12,776
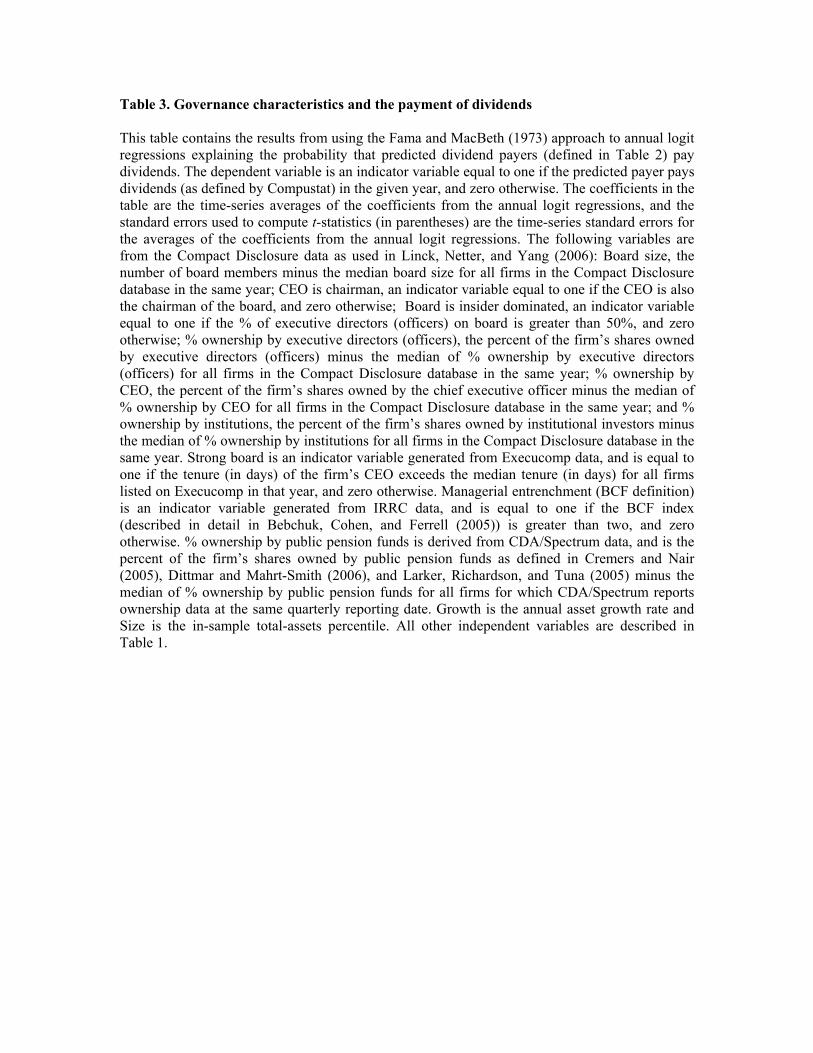
Table 3. Governance characteristics and the payment of dividends This table contains the results from using the Fama and MacBeth (1973) approach to annual logit regressions explaining the probability that predicted dividend payers (defined in Table 2) pay dividends. The dependent variable is an indicator variable equal to one if the predicted payer pays dividends (as defined by Compustat) in the given year, and zero otherwise. The coefficients in the table are the time-series averages of the coefficients from the annual logit regressions, and the standard errors used to compute t-statistics (in parentheses) are the time-series standard errors for the averages of the coefficients from the annual logit regressions. The following variables are from the Compact Disclosure data as used in Linck, Netter, and Yang (2006): Board size, the number of board members minus the median board size for all firms in the Compact Disclosure database in the same year; CEO is chairman, an indicator variable equal to one if the CEO is also the chairman of the board, and zero otherwise; Board is insider dominated, an indicator variable equal to one if the % of executive directors (officers) on board is greater than 50%, and zero otherwise; % ownership by executive directors (officers), the percent of the firm’s shares owned by executive directors (officers) minus the median of % ownership by executive directors (officers) for all firms in the Compact Disclosure database in the same year; % ownership by CEO, the percent of the firm’s shares owned by the chief executive officer minus the median of % ownership by CEO for all firms in the Compact Disclosure database in the same year; and % ownership by institutions, the percent of the firm’s shares owned by institutional investors minus the median of % ownership by institutions for all firms in the Compact Disclosure database in the same year. Strong board is an indicator variable generated from Execucomp data, and is equal to one if the tenure (in days) of the firm’s CEO exceeds the median tenure (in days) for all firms listed on Execucomp in that year, and zero otherwise. Managerial entrenchment (BCF definition) is an indicator variable generated from IRRC data, and is equal to one if the BCF index (described in detail in Bebchuk, Cohen, and Ferrell (2005)) is greater than two, and zero otherwise. % ownership by public pension funds is derived from CDA/Spectrum data, and is the percent of the firm’s shares owned by public pension funds as defined in Cremers and Nair (2005), Dittmar and Mahrt-Smith (2006), and Larker, Richardson, and Tuna (2005) minus the median of % ownership by public pension funds for all firms for which CDA/Spectrum reports ownership data at the same quarterly reporting date. Growth is the annual asset growth rate and Size is the in-sample total-assets percentile. All other independent variables are described in Table 1.
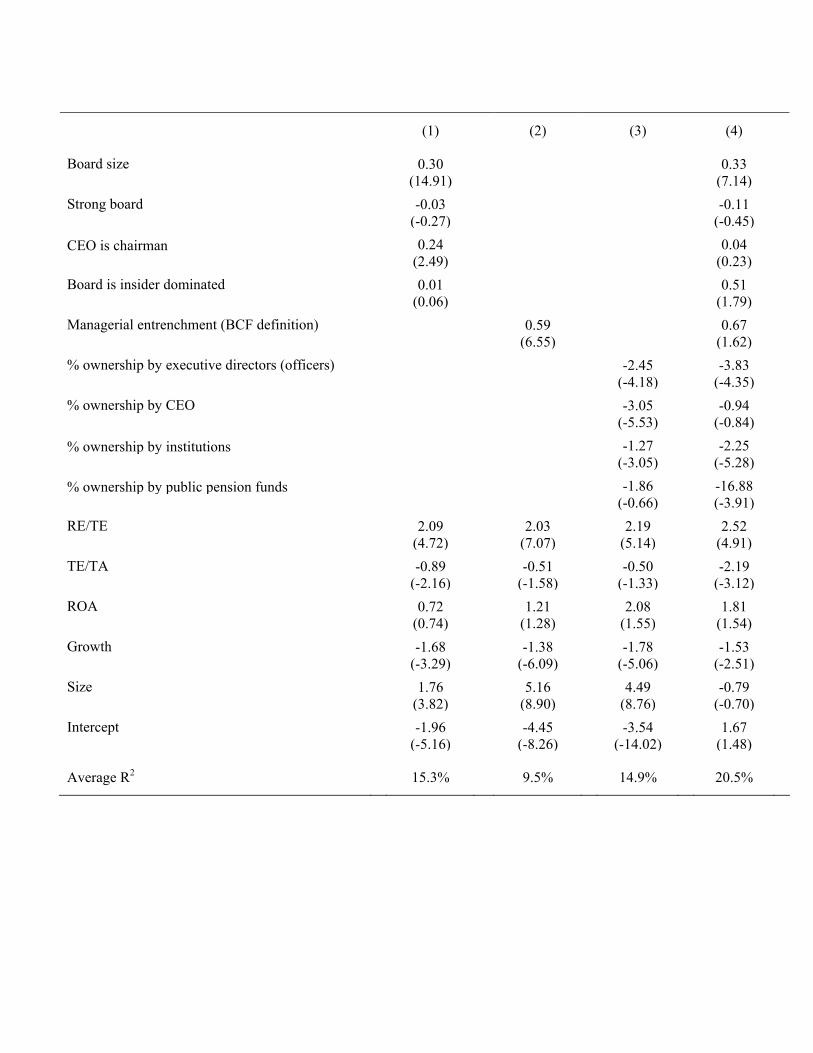
(1) (2) (3) (4)
Board size 0.30 0.33 (14.91) (7.14)
Strong board -0.03 -0.11 (-0.27) (-0.45)
CEO is chairman 0.24 0.04 (2.49) (0.23)
Board is insider dominated 0.01 0.51 (0.06) (1.79)
Managerial entrenchment (BCF definition) 0.59 0.67 (6.55) (1.62)
% ownership by executive directors (officers) -2.45 -3.83 (-4.18) (-4.35)
% ownership by CEO -3.05 -0.94 (-5.53) (-0.84)
% ownership by institutions -1.27 -2.25 (-3.05) (-5.28)
% ownership by public pension funds -1.86 -16.88 (-0.66) (-3.91)
RE/TE 2.09 2.03 2.19 2.52 (4.72) (7.07) (5.14) (4.91)TE/TA -0.89 -0.51 -0.50 -2.19 (-2.16) (-1.58) (-1.33) (-3.12)ROA 0.72 1.21 2.08 1.81 (0.74) (1.28) (1.55) (1.54)Growth -1.68 -1.38 -1.78 -1.53 (-3.29) (-6.09) (-5.06) (-2.51)Size 1.76 5.16 4.49 -0.79 (3.82) (8.90) (8.76) (-0.70)Intercept -1.96 -4.45 -3.54 1.67 (-5.16) (-8.26) (-14.02) (1.48) Average R2 15.3% 9.5% 14.9% 20.5%
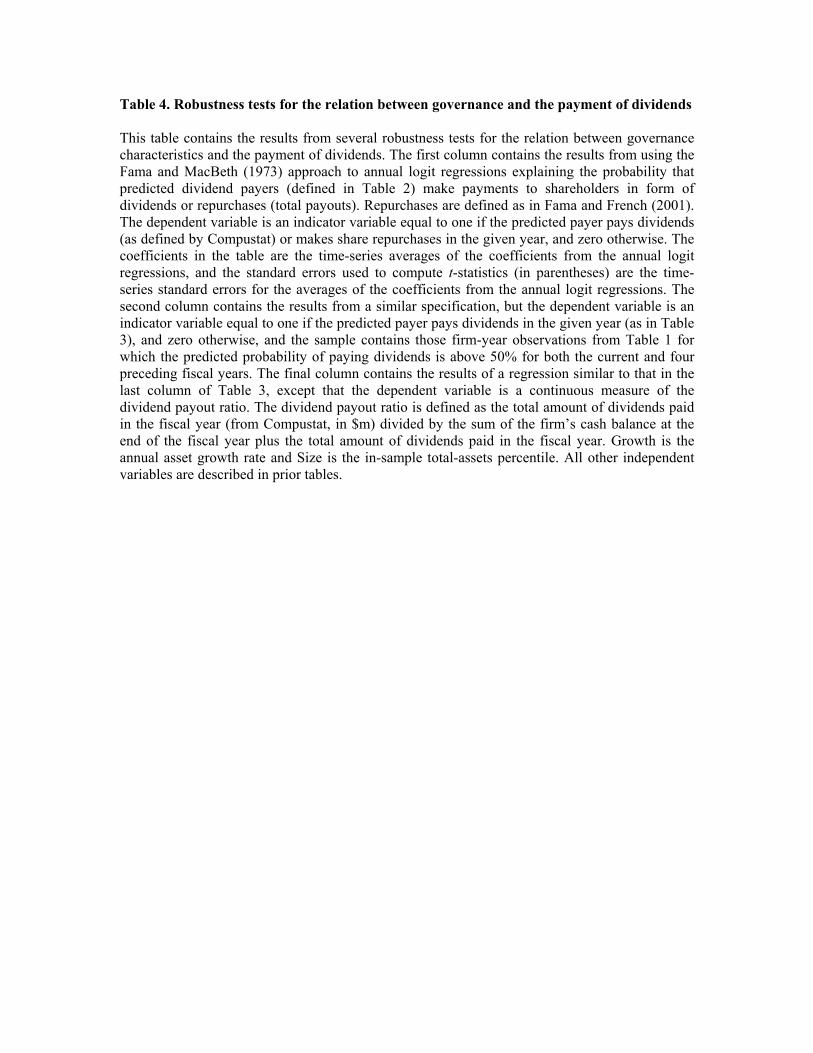
Table 4. Robustness tests for the relation between governance and the payment of dividends This table contains the results from several robustness tests for the relation between governance characteristics and the payment of dividends. The first column contains the results from using the Fama and MacBeth (1973) approach to annual logit regressions explaining the probability that predicted dividend payers (defined in Table 2) make payments to shareholders in form of dividends or repurchases (total payouts). Repurchases are defined as in Fama and French (2001). The dependent variable is an indicator variable equal to one if the predicted payer pays dividends (as defined by Compustat) or makes share repurchases in the given year, and zero otherwise. The coefficients in the table are the time-series averages of the coefficients from the annual logit regressions, and the standard errors used to compute t-statistics (in parentheses) are the time-series standard errors for the averages of the coefficients from the annual logit regressions. The second column contains the results from a similar specification, but the dependent variable is an indicator variable equal to one if the predicted payer pays dividends in the given year (as in Table 3), and zero otherwise, and the sample contains those firm-year observations from Table 1 for which the predicted probability of paying dividends is above 50% for both the current and four preceding fiscal years. The final column contains the results of a regression similar to that in the last column of Table 3, except that the dependent variable is a continuous measure of the dividend payout ratio. The dividend payout ratio is defined as the total amount of dividends paid in the fiscal year (from Compustat, in $m) divided by the sum of the firm’s cash balance at the end of the fiscal year plus the total amount of dividends paid in the fiscal year. Growth is the annual asset growth rate and Size is the in-sample total-assets percentile. All other independent variables are described in prior tables.
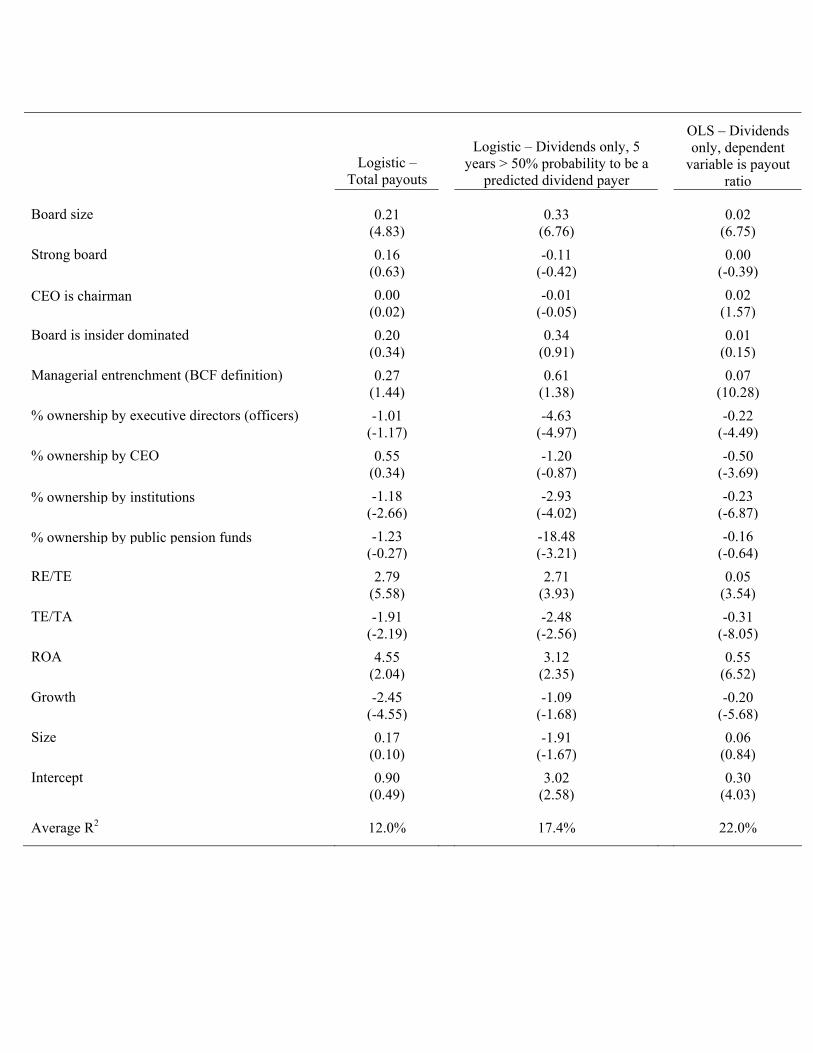
Logistic – Total payouts
Logistic – Dividends only, 5
years > 50% probability to be a predicted dividend payer
OLS – Dividends only, dependent
variable is payout ratio
Board size 0.21 0.33 0.02 (4.83) (6.76) (6.75)
Strong board 0.16 -0.11 0.00 (0.63) (-0.42) (-0.39)
CEO is chairman 0.00 -0.01 0.02 (0.02) (-0.05) (1.57)
Board is insider dominated 0.20 0.34 0.01 (0.34) (0.91) (0.15)
Managerial entrenchment (BCF definition) 0.27 0.61 0.07 (1.44) (1.38) (10.28)
% ownership by executive directors (officers) -1.01 -4.63 -0.22 (-1.17) (-4.97) (-4.49)
% ownership by CEO 0.55 -1.20 -0.50 (0.34) (-0.87) (-3.69)
% ownership by institutions -1.18 -2.93 -0.23 (-2.66) (-4.02) (-6.87)
% ownership by public pension funds -1.23 -18.48 -0.16 (-0.27) (-3.21) (-0.64)
RE/TE 2.79 2.71 0.05 (5.58) (3.93) (3.54)TE/TA -1.91 -2.48 -0.31 (-2.19) (-2.56) (-8.05)ROA 4.55 3.12 0.55 (2.04) (2.35) (6.52)Growth -2.45 -1.09 -0.20 (-4.55) (-1.68) (-5.68)Size 0.17 -1.91 0.06 (0.10) (-1.67) (0.84)Intercept 0.90 3.02 0.30 (0.49) (2.58) (4.03) Average R2 12.0% 17.4% 22.0%
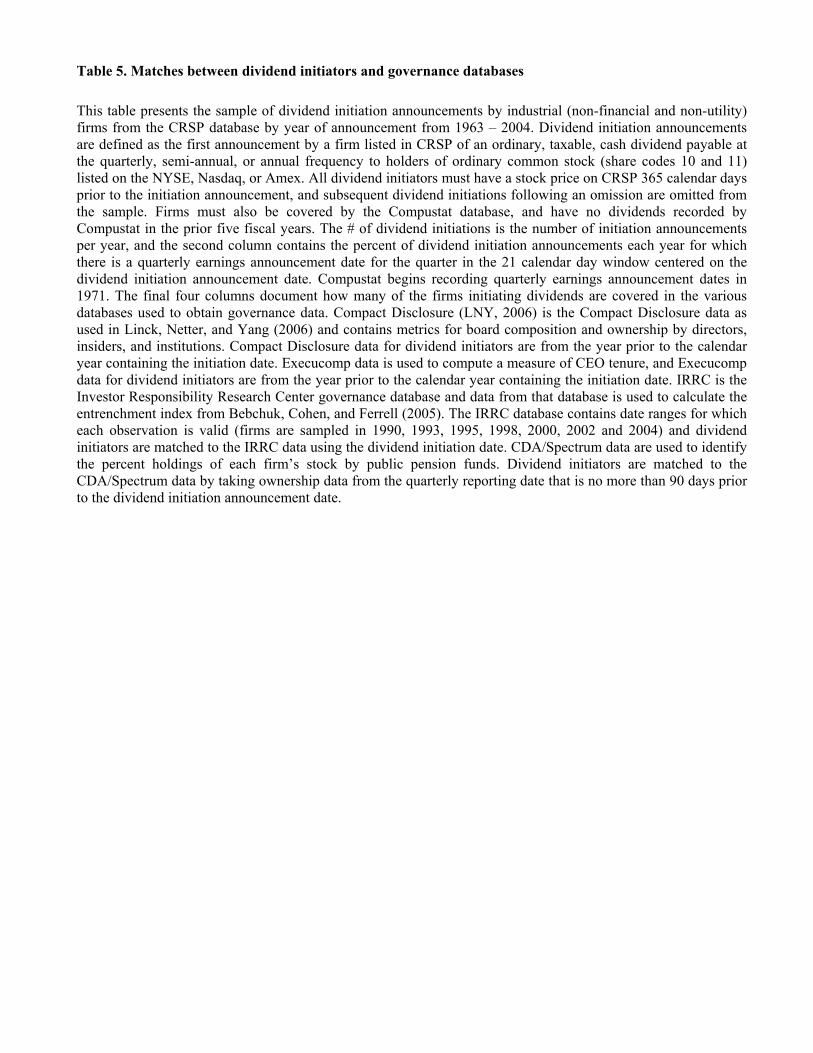
Table 5. Matches between dividend initiators and governance databases
This table presents the sample of dividend initiation announcements by industrial (non-financial and non-utility) firms from the CRSP database by year of announcement from 1963 – 2004. Dividend initiation announcements are defined as the first announcement by a firm listed in CRSP of an ordinary, taxable, cash dividend payable at the quarterly, semi-annual, or annual frequency to holders of ordinary common stock (share codes 10 and 11) listed on the NYSE, Nasdaq, or Amex. All dividend initiators must have a stock price on CRSP 365 calendar days prior to the initiation announcement, and subsequent dividend initiations following an omission are omitted from the sample. Firms must also be covered by the Compustat database, and have no dividends recorded by Compustat in the prior five fiscal years. The # of dividend initiations is the number of initiation announcements per year, and the second column contains the percent of dividend initiation announcements each year for which there is a quarterly earnings announcement date for the quarter in the 21 calendar day window centered on the dividend initiation announcement date. Compustat begins recording quarterly earnings announcement dates in 1971. The final four columns document how many of the firms initiating dividends are covered in the various databases used to obtain governance data. Compact Disclosure (LNY, 2006) is the Compact Disclosure data as used in Linck, Netter, and Yang (2006) and contains metrics for board composition and ownership by directors, insiders, and institutions. Compact Disclosure data for dividend initiators are from the year prior to the calendar year containing the initiation date. Execucomp data is used to compute a measure of CEO tenure, and Execucomp data for dividend initiators are from the year prior to the calendar year containing the initiation date. IRRC is the Investor Responsibility Research Center governance database and data from that database is used to calculate the entrenchment index from Bebchuk, Cohen, and Ferrell (2005). The IRRC database contains date ranges for which each observation is valid (firms are sampled in 1990, 1993, 1995, 1998, 2000, 2002 and 2004) and dividend initiators are matched to the IRRC data using the dividend initiation date. CDA/Spectrum data are used to identify the percent holdings of each firm’s stock by public pension funds. Dividend initiators are matched to the CDA/Spectrum data by taking ownership data from the quarterly reporting date that is no more than 90 days prior to the dividend initiation announcement date.
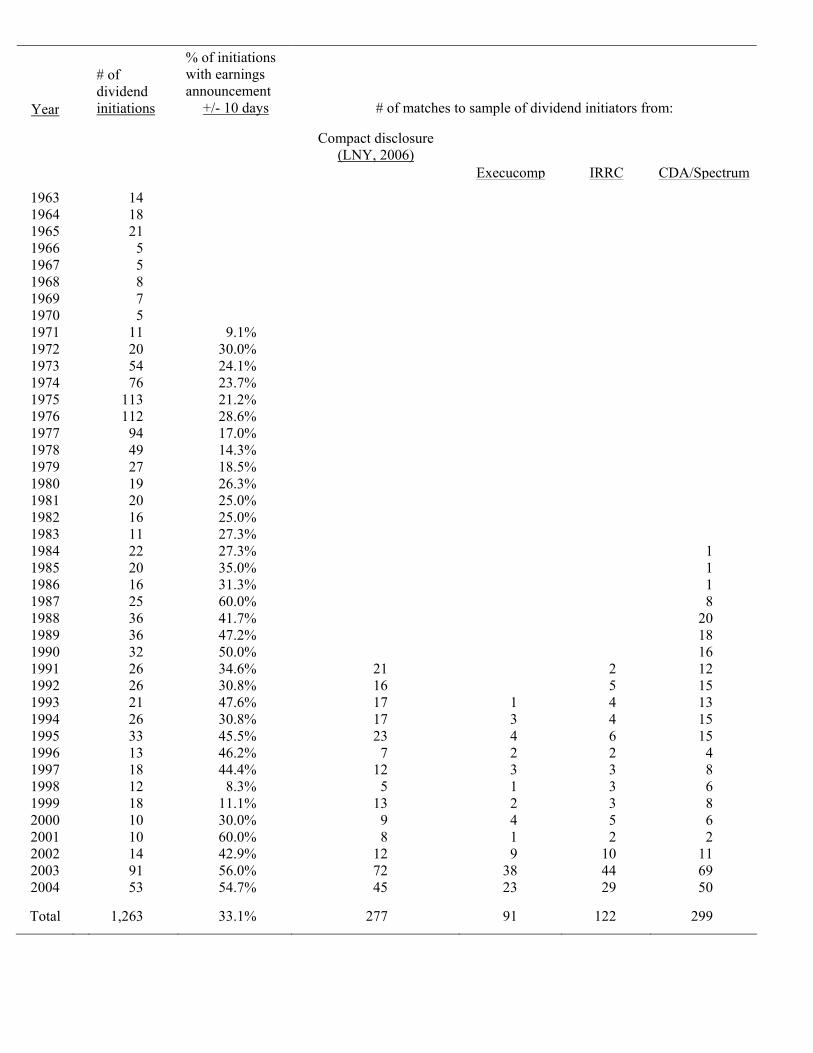
Year
# of dividend initiations
% of initiations with earnings announcement
+/- 10 days # of matches to sample of dividend initiators from:
Compact disclosure (LNY, 2006)
Execucomp IRRC CDA/Spectrum
1963 14 1964 18 1965 21 1966 5 1967 5 1968 8 1969 7 1970 5 1971 11 9.1% 1972 20 30.0% 1973 54 24.1% 1974 76 23.7% 1975 113 21.2% 1976 112 28.6% 1977 94 17.0% 1978 49 14.3% 1979 27 18.5% 1980 19 26.3% 1981 20 25.0% 1982 16 25.0% 1983 11 27.3% 1984 22 27.3% 1 1985 20 35.0% 1 1986 16 31.3% 1 1987 25 60.0% 8 1988 36 41.7% 20 1989 36 47.2% 18 1990 32 50.0% 16 1991 26 34.6% 21 2 12 1992 26 30.8% 16 5 15 1993 21 47.6% 17 1 4 13 1994 26 30.8% 17 3 4 15 1995 33 45.5% 23 4 6 15 1996 13 46.2% 7 2 2 4 1997 18 44.4% 12 3 3 8 1998 12 8.3% 5 1 3 6 1999 18 11.1% 13 2 3 8 2000 10 30.0% 9 4 5 6 2001 10 60.0% 8 1 2 2 2002 14 42.9% 12 9 10 11 2003 91 56.0% 72 38 44 69 2004 53 54.7% 45 23 29 50
Total 1,263 33.1% 277 91 122 299
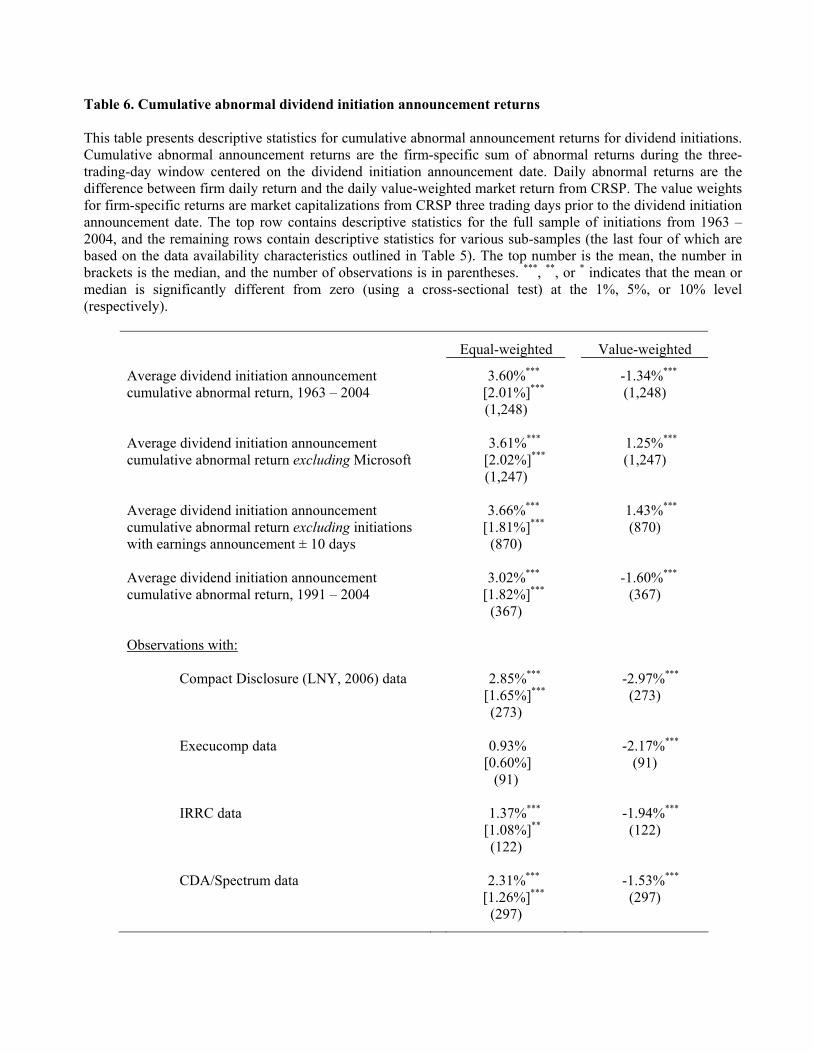
Table 6. Cumulative abnormal dividend initiation announcement returns This table presents descriptive statistics for cumulative abnormal announcement returns for dividend initiations. Cumulative abnormal announcement returns are the firm-specific sum of abnormal returns during the three-trading-day window centered on the dividend initiation announcement date. Daily abnormal returns are the difference between firm daily return and the daily value-weighted market return from CRSP. The value weights for firm-specific returns are market capitalizations from CRSP three trading days prior to the dividend initiation announcement date. The top row contains descriptive statistics for the full sample of initiations from 1963 – 2004, and the remaining rows contain descriptive statistics for various sub-samples (the last four of which are based on the data availability characteristics outlined in Table 5). The top number is the mean, the number in brackets is the median, and the number of observations is in parentheses. ***, **, or * indicates that the mean or median is significantly different from zero (using a cross-sectional test) at the 1%, 5%, or 10% level (respectively).
Equal-weighted Value-weighted
Average dividend initiation announcement cumulative abnormal return, 1963 – 2004
3.60%***
[2.01%]***
(1,248)
-1.34%***
(1,248)
Average dividend initiation announcement cumulative abnormal return excluding Microsoft
3.61%***
[2.02%]***
(1,247)
1.25%***
(1,247)
Average dividend initiation announcement cumulative abnormal return excluding initiations with earnings announcement ± 10 days
3.66%***
[1.81%]***
(870)
1.43%***
(870)
Average dividend initiation announcement cumulative abnormal return, 1991 – 2004
3.02%***
[1.82%]***
(367)
-1.60%***
(367)
Observations with:
Compact Disclosure (LNY, 2006) data 2.85%***
[1.65%]***
(273)
-2.97%***
(273)
Execucomp data 0.93%
[0.60%]
(91)
-2.17%***
(91)
IRRC data 1.37%***
[1.08%]**
(122)
-1.94%***
(122)
CDA/Spectrum data 2.31%***
[1.26%]***
(297)
-1.53%***
(297)
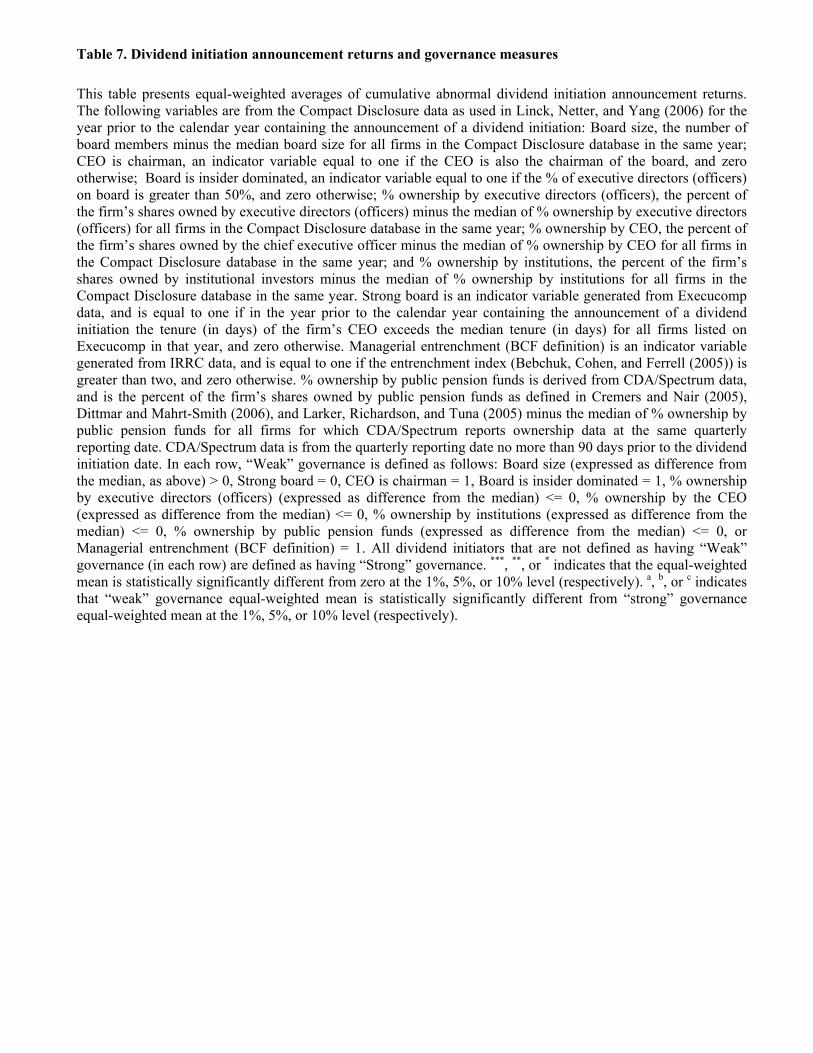
Table 7. Dividend initiation announcement returns and governance measures
This table presents equal-weighted averages of cumulative abnormal dividend initiation announcement returns. The following variables are from the Compact Disclosure data as used in Linck, Netter, and Yang (2006) for the year prior to the calendar year containing the announcement of a dividend initiation: Board size, the number of board members minus the median board size for all firms in the Compact Disclosure database in the same year; CEO is chairman, an indicator variable equal to one if the CEO is also the chairman of the board, and zero otherwise; Board is insider dominated, an indicator variable equal to one if the % of executive directors (officers) on board is greater than 50%, and zero otherwise; % ownership by executive directors (officers), the percent of the firm’s shares owned by executive directors (officers) minus the median of % ownership by executive directors (officers) for all firms in the Compact Disclosure database in the same year; % ownership by CEO, the percent of the firm’s shares owned by the chief executive officer minus the median of % ownership by CEO for all firms in the Compact Disclosure database in the same year; and % ownership by institutions, the percent of the firm’s shares owned by institutional investors minus the median of % ownership by institutions for all firms in the Compact Disclosure database in the same year. Strong board is an indicator variable generated from Execucomp data, and is equal to one if in the year prior to the calendar year containing the announcement of a dividend initiation the tenure (in days) of the firm’s CEO exceeds the median tenure (in days) for all firms listed on Execucomp in that year, and zero otherwise. Managerial entrenchment (BCF definition) is an indicator variable generated from IRRC data, and is equal to one if the entrenchment index (Bebchuk, Cohen, and Ferrell (2005)) is greater than two, and zero otherwise. % ownership by public pension funds is derived from CDA/Spectrum data, and is the percent of the firm’s shares owned by public pension funds as defined in Cremers and Nair (2005), Dittmar and Mahrt-Smith (2006), and Larker, Richardson, and Tuna (2005) minus the median of % ownership by public pension funds for all firms for which CDA/Spectrum reports ownership data at the same quarterly reporting date. CDA/Spectrum data is from the quarterly reporting date no more than 90 days prior to the dividend initiation date. In each row, “Weak” governance is defined as follows: Board size (expressed as difference from the median, as above) > 0, Strong board = 0, CEO is chairman = 1, Board is insider dominated = 1, % ownership by executive directors (officers) (expressed as difference from the median) <= 0, % ownership by the CEO (expressed as difference from the median) <= 0, % ownership by institutions (expressed as difference from the median) <= 0, % ownership by public pension funds (expressed as difference from the median) <= 0, or Managerial entrenchment (BCF definition) = 1. All dividend initiators that are not defined as having “Weak” governance (in each row) are defined as having “Strong” governance. ***, **, or * indicates that the equal-weighted mean is statistically significantly different from zero at the 1%, 5%, or 10% level (respectively). a, b, or c indicates that “weak” governance equal-weighted mean is statistically significantly different from “strong” governance equal-weighted mean at the 1%, 5%, or 10% level (respectively).
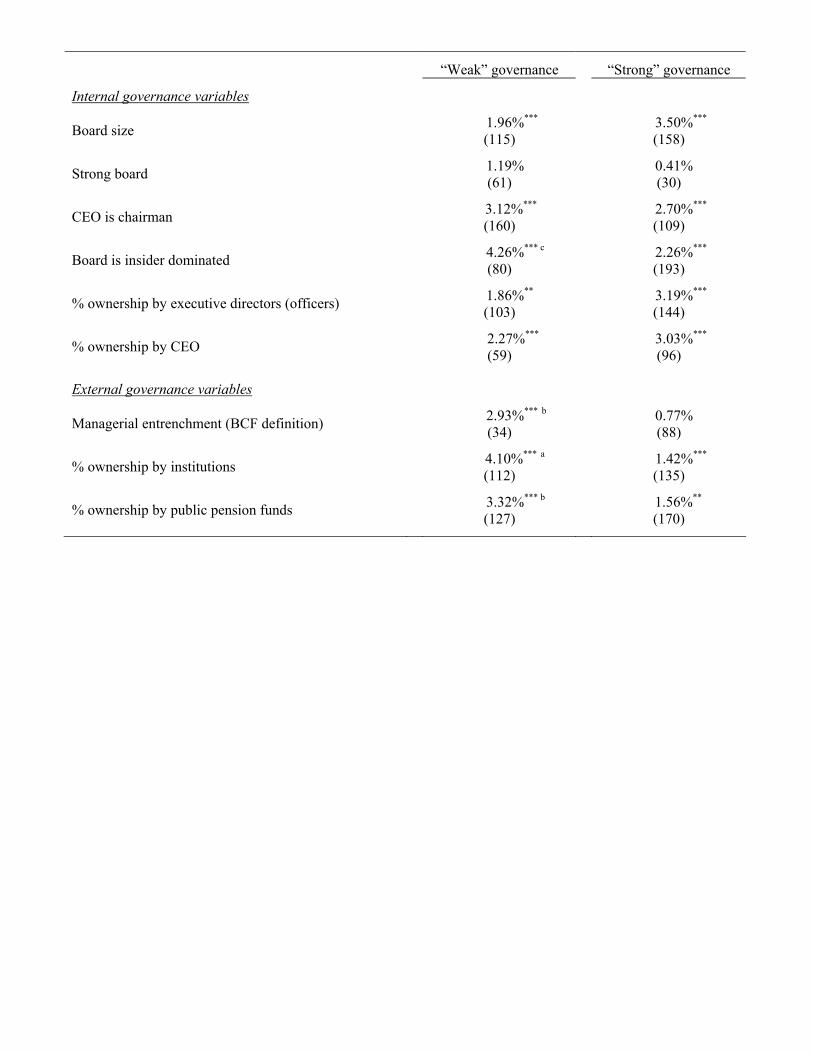
“Weak” governance “Strong” governance
Internal governance variables
Board size 1.96%***
(115) 3.50%***
(158)
Strong board 1.19%
(61) 0.41%
(30)
CEO is chairman 3.12%***
(160) 2.70%***
(109)
Board is insider dominated 4.26%*** c
(80) 2.26%***
(193)
% ownership by executive directors (officers) 1.86%** (103)
3.19%***
(144)
% ownership by CEO 2.27%*** (59)
3.03%*** (96)
External governance variables
Managerial entrenchment (BCF definition) 2.93%*** b
(34) 0.77%
(88)
% ownership by institutions 4.10%*** a
(112) 1.42%***
(135)
% ownership by public pension funds 3.32%*** b (127)
1.56%** (170)
Figure 1. Predicted and actual probabilities of paying dividends This figure shows averages of the predicted probability of being a dividend payer and an indicator variable equal to one if the firm pays dividends (and zero otherwise) for each year that firms are in the sample. The predicted probability of paying dividends for each firm-year is the predicted probability from Model D4 in Table 1, which uses a sample from 1973 – 2004 (32 years). Therefore, firms can be in the sample for a maximum of 32 years, and the averages depicted in the figure are for all firms with a fiscal-year observation in the given year relative to their first year in the Compustat database. Firms with fewer than five annual observations in the Compustat database are removed from the sample before the averages are computed.
0%
10%
20%
30%
40%
50%
60%
70%
80%
90%
100%
1 2 3 4 5 6 7 8 9 10 11 12 13 14 15 16 17 18 19 20 21 22 23 24 25 26 27 28 29 30 31 32
Years in sample
Perc
ent
Average predicted probability of being a dividend payer Average fraction of firms that are payers