Embed Size (px)
Citation preview

Dividends and Corporate Shareholders
Michael J. Barclay
University of Rochester
Clifford G. Holderness
Boston College
Dennis P. Sheehan
Pennsylvania State University
Corporations uniquely have a tax preference for cash dividends. Nevertheless, divi-dends do not increase following trades of large-percentage blocks of stock from indi-viduals to corporations. Moreover, although one-third of firms have corporate block-holders, 68% of these firms pay no dividends, and ownership is not clustered at levelsthat increase the tax benefits of dividends. These findings are not driven by the in-vesting firms’ tax rates or by agency problems. Instead, operating companies expandthe target firms and pursue joint ventures. Dividends are lower with these investors.Financial investors are not attracted to dividend-paying firms and tend to be passive.(JEL G30, G32, G35)
An unusual provision of the tax code taxes corporations, but only corporations,at a lower rate on dividends than on capital gains. Because of this provision,Black (1976) concludes that corporations are the only investors with a tax pref-erence for dividends, a view which is now widely accepted. Ross, Westerfield,and Jaffe (2005, p. 522), for instance, write that corporations “prefer to invest inhigh-dividend stocks, even without a preference for current income.” Brealey,Myers, and Allen (2006, p. 432) similarly write that “only corporations have atax reason to prefer dividends.”
Corporations’ tax preference for dividends could have several effects. Forexample, corporations could tilt their stock holdings toward high-dividend-paying stocks in a classic dividend-clientele scenario. If corporations hold large-percentage blocks of stock, they could also use their voting power to initiateor increase dividend payments. In either case, the tax-preference hypothesispredicts a positive relation between dividend payments and corporate stockownership.
We thank an anonymous referee, Vladimir Atanasov, Alex Edmans, Laura Field, John Graham, Yaniv Grinstein,Simona Mola, Jeffrey Pontiff, Clifford Smith, Michael Weisbach, and seminar participants at Boston College andthe Annual Meeting of the American Finance Association for helpful comments. After this paper went to press,Michael Barclay died in a small plane crash. We lost a close friend of twenty-five-years standing, and the financeprofession lost a leading light. (January 10, 1957–August 16, 2007) Mike truly leaves the world a better placethan he found it. Many will miss him. Send correspondence to Clifford G. Holderness, Finance Department,Fulton Hall, Boston College, Chestnut Hill, MA 02467. E-mail: [email protected].
C© The Author 2008. Published by Oxford University Press on behalf of The Society for Financial Studies.All rights reserved. For Permissions, please email: [email protected]:10.1093/rfs/hhn060 Advance Access publication June 21, 2008

The Review of Financial Studies / v 22 n 6 2009
Given the special tax status of corporate shareholders, it is surprising thatno one has investigated the relation between corporate stock ownership anddividend policy. That is what we do in this paper. Because corporations do nothave to report their stockholdings below 5% of a firm’s common stock, ourinvestigations are limited to corporate shareholdings at or above this threshold.We employ two distinct data sets to analyze the relation between corporatestock ownership and dividend policy. First, we investigate trades of large-percentage blocks of common stock in which the sellers are individuals andthe purchasers are corporations. Because individual sellers are tax averse todividends while the corporate purchasers have the opposite preference, the tax-preference hypothesis predicts that dividends should increase following theseblock trades. Moreover, because we are examining the same firms before andafter a block trade, these investigations should control for other determinants ofdividend policy. Our second set of investigations examines dividend policy at376 randomly selected CRSP- and Compustat-listed corporations. We examinethese firms in 1995 and revisit them in 1998, 2001, and 2004.
Contrary to the tax-preference hypothesis, we do not find a positive relationbetween dividends and corporate stock ownership in either sample. Follow-ing large-block trades in which the purchasers are corporations and the sellersare individuals, the portion of firms paying dividends actually decreases. Therandom sample paints a similar picture. Although we find that one-third of allfirms have corporate blockholders, 68% of the firms with such large sharehold-ers pay no dividends. Moreover, the fractional ownership of these corporateblockholders is not clustered at levels that would increase the tax benefits ofcash dividends.
We investigate several explanations for why corporate blockholders are notassociated with higher dividends. We reject the possibility that corporate block-holders have low marginal tax rates, which would diminish the tax benefits ofdividends for them. To the contrary, corporate blockholders tend to have highmarginal tax rates. The data also reject the possibility that agency problemsat the blockholder firms contribute to suboptimal dividend policies. Using twoaccepted measures of the quality of firms’ corporate governance mechanisms,we find that potential agency problems at the corporate blockholders are nodifferent than they are in public corporations generally.
We obtain insights into why there is no tax effect by dividing the corporateblockholders into operating investors and financial investors. Although subjectto the same tax on dividends, these two types of investors appear to havedifferent motivations for making block investments. Operating blockholdersappear focused on establishing joint ventures or pursuing operating synergies.We find that dividends are lower but capital expenditures are higher at firms withoperating blockholders. Although this result is contrary to the tax-preferencehypothesis, it does not imply that taxes are irrelevant. Holding all other factorsconstant, corporate investors clearly would prefer to receive their returns in themost tax-efficient fashion. Thus, a sufficiently powerful econometric test might
2424

Dividends and Corporate Shareholders
be able to detect a corporate tax preference for dividends at the margin. Whenoperating companies make strategic investments, however, all other things arenot equal. In particular, our results show that operating blockholders find itmore profitable to pursue strategic interactions with their target firms than touse their influence to alter dividend policy or pursue simple dividend capturestrategies.
The literature has paid less attention to financial blockholders even thoughevidence we present shows that they are more common than operating block-holders. One would think that because financial blockholders do not havethe operational and synergistic considerations of operating blockholders, theywould focus more on dividend policy. We find this not to be the case, however.Dividend policy at firms with financial blockholders is indistinguishable fromthe dividend policy at firms with no corporate blockholders of any type. In part,this seems to reflect the passivity of financial blockholders. Compared withoperating blockholders, their blocks are smaller; they hold them for shorterperiods of time; and they are less likely to have board of director representa-tion. If financial blockholders are exercising their rights as shareholders, theyare not doing so with dividend policy. Moreover, whatever criteria financialcorporations use to choose their block investments, dividend policy does notappear to be one of them.
These findings have relevance for several areas. Most obviously, our evidencerejects the hypothesis that corporate investors are attracted to dividend-payingfirms. This complements the emerging literature that finds dividend clientelesfor some type of investors but not for others. Our evidence is thus inconsistentwith several theory papers, including Shleifer and Vishny (1986) and Allenand Michaely (2003), positing that corporate block investors are attracted todividend-paying firms.1 Our findings also help to fill out an emerging picture ofhow large shareholders influence dividend policy. Perez-Gonzalez (2003) findsthat changes in the tax rate on dividends have a significant effect on payoutpolicy when a firm’s largest shareholder is an individual. In contrast, to theextent that corporate blockholders intervene to shape dividend policy, it is op-erating blockholders, and they are associated with lower dividends. Lastly, ourfindings highlight a richness with corporate blockholders as there appear to beimportant differences between operating and financial corporate blockholders.
The paper is organized as follows. Section 1 starts with a brief overviewof the tax treatment of dividends for corporate shareholders. Next, we reviewtheoretical articles that posit a positive relation between corporate block own-ership and dividend policy, and we summarize what little empirical evidenceexists on corporate shareholders and dividends. Section 2 investigates dividendchanges after block trades, focusing on those trades in which a corporation buysa block from an individual. Section 3 starts with a cross-sectional analysis of a
1 These theories have yet to be tested. As Allen and Michaely (2003) write, “whether indeed large shareholdersare attracted to firms that pay dividends . . . is an unresolved empirical issue that is worthy of pursuing.”
2425

The Review of Financial Studies / v 22 n 6 2009
random sample of firms. We then analyze dividend policy in a series of panelregressions. Section 4 investigates why dividends are not higher in the presenceof dominant corporate shareholders even though they would pay lower taxes.Here we explore differences between operating and financial blockholders. Abrief conclusion follows.
1. Background
1.1 Dividends, taxes, and corporate shareholders
The Internal Revenue Code differentiates between dividends received by in-dividuals and dividends received by corporations. During the period of ouranalysis, individuals were fully taxed on any dividends they received.2 Corpo-rate shareholders, in contrast, have always been allowed to deduct from theirtaxable income at least 70% of any dividends they receive.3 If a corporationowns 20% or more of the common stock of the distributing company, the div-idend deduction increases to 80%. When a corporation owns at least 80% ofthe stock of another corporation, the dividend deduction is total.
The effective marginal tax rates for capital gains are reversed for individualand corporate shareholders. Individual taxpayers are taxed at a lower rate onlong-term capital gains than on ordinary income. Corporate shareholders, incontrast, face a lower effective marginal tax rate on dividends than on capitalgains. Because corporations are allowed to exclude most, if not all, of theirdividend income, they are taxed at a rate of approximately 35% on capitalgains but only 10.5% (or less) on dividends. It is this difference between the taxstatus of corporate and individual shareholders that has long intrigued financialeconomists.
1.2 Theoretical papers on corporate shareholders and dividends
Corporations’ unique tax preference for dividends is a key component in sev-eral prominent theoretical papers. Shleifer and Vishny (1986) model a largeshareholder that monitors management. There is a potential free-rider problembecause the large shareholder incurs all of the monitoring costs but reaps onlypart of the benefits. In their model, dividends can act as a side payment for thesemonitoring services if the large shareholder values dividends more highly thansmall shareholders. Shleifer and Vishny note, but do not pursue empirically,that large shareholders are often other corporations and should thus have a taxpreference for dividends.
2 After our sampling period, in 2003, the tax code was changed to lower the tax rate on dividends received byindividuals. Before this change, any dividends received by individuals were taxed at the individual’s normalmarginal tax rate with a maximum rate of 35%. After the change, dividends received by individuals are nowtaxed at a rate of 15%. Chetty and Saez (2005) study these changes. The taxation of dividends received bycorporations is not affected by these changes.
3 Prior to December 22, 1987, corporations could deduct 80% of any dividends received if they owned less than20% of the stock of another corporation.
2426

Dividends and Corporate Shareholders
Corporations’ presumed tax preference for dividends is also central in Allenand Michaely (2003). They develop a model reflecting the fact that individualsface higher taxes on dividends than on capital gains; tax-exempt institutions areindifferent between dividends and capital gains; and corporations prefer divi-dends to capital gains. Under these assumptions, they show that an equilibriumevolves in which individuals hold low-dividend-paying stocks, institutions holdmedium-dividend-paying stocks, and corporations hold high-dividend-payingstocks.
Finally, Allen, Bernardo, and Welch (2000) develop a model in whichmanagers pay dividends to encourage sophisticated investors to hold large-percentage blocks of stock. Firms pay dividends in this model both becausedividends serve as a signal of value (by attracting the attention of sophisticatedinvestors who are not tax averse to dividends) and because the large-block share-holders who are attracted by the dividend payments help mitigate the agencyconflicts between diffuse owners and managers. Although Allen, Bernardo,and Welch focus on a clientele of tax-exempt institutions who are indifferentbetween dividends and capital gains, their model predicts that both firms’ divi-dend policies and large-block shareholders’ investment decisions are materiallyaffected by the blockholders’ dividend tax status.
All of these models reflect the narrow provision of the tax code that treatscorporate shareholders differently than other shareholders for the taxation ofdividends received. The implications of these models, however, are broad andfall into four categories. First, the models make a classic tax-clientele predictionthat corporations will hold high-dividend-paying stocks. Second, the modelshave implications for the determinants of dividend policy because firms mayinstitute or increase dividends to attract corporate shareholders. Third, themodels are relevant also for the determinants of a firm’s ownership structure;they imply that corporate shareholders are more likely to be found in firmsthat pay dividends than in those that do not pay dividends. Fourth, the modelssuggest that one way corporate blockholders use their voting power and receiveprivate benefits is through dividend policy.
1.3 Existing empirical evidence
Early empirical tests of tax-based dividend clienteles focused on their asset-pricing implications. For example, Elton and Gruber (1970) find that ex-dividend day stock returns are decreasing in a stock’s dividend yield, whichthey interpret as evidence supporting tax-based dividend clienteles. Elton andGruber note that investors in the highest yield stocks exhibit a preference fordividends over capital gains, a preference they attribute, at least partially, to cor-porations’ tax preference for dividends. Litzenberger and Ramaswamy (1979)also find evidence of dividend clienteles when they estimate an after-tax ver-sion of the CAPM. Following these early papers, debate over the existenceof dividend clienteles continued unresolved, largely because it was difficult toobtain the stock ownership data needed to test for clienteles directly.
2427
The Review of Financial Studies / v 22 n 6 2009
As more stock ownership data have become available, researchers have beenable to test for tax-based dividend clienteles directly. The emerging evidence ismixed. Most of these papers focus on individual or institutional shareholdersand ask whether such investors gravitate to holding stocks with certain div-idend characteristics. A few papers examine the impact of large-percentage,noncorporate shareholders on dividend policy. There is little evidence on eitherthe stockholdings of corporate shareholders or the impact of such shareholderson dividend policy.
Scholz (1992) and Graham and Kumar (2006) find evidence consistent withtax clienteles among small individual (retail) investors. The preference fordividends among these investors seems to decline with income, which makessense as increasing marginal tax rates for individuals reduce after-tax dividends.Individual investors are in a different tax situation than corporate shareholders,and these small investors obviously do not have the voting power to changedividend policy.
Brav and Heaton (1998) and Binay (2001) find evidence of dividend clien-teles among institutional investors. Michaely, Thaler, and Womack (1995) andGrinstein and Michaely (2005), however, find no evidence that the level of div-idends affects institutional ownership, which they interpret as evidence againsta tax-clientele effect. Institutional investors will be either tax averse or taxneutral toward dividends, depending on the tax status of their beneficiaries.Corporate shareholders, in contrast, have a tax preference for dividends. Inaddition, institutional shareholders individually seldom own large-percentageblocks of stock, but, by design, the corporate shareholders we study alwaysown at least 5% of the common stock and occasionally own majority blocks.
There has been less research on the relation between dividend policy andlarge-percentage shareholders. Perez-Gonzalez (2003) examines a broad sam-ple of public corporations during the mid-1990s. He finds that when tax lawchanges cause dividends to be less tax disadvantageous relative to capital gains,dividends increase in those firms in which the largest shareholder is an indi-vidual as opposed to an institution. Firms in which corporations are the largestshareholder are excluded from his analysis. The author interprets these findingsas evidence of a clientele effect for large-percentage individual shareholders;he also concludes that such blockholders influence dividend policy directly.
Eckbo and Verma (1994) study dividend policies at Canadian corporationsand in so doing look at corporate shareholders. Their model proposes a gamebetween corporate shareholders and managers in which corporate shareholdersalways desire higher dividends than do managers. In the model, corporate orinstitutional shareholders can ask for a vote on dividend policy if managementdoes not agree to their demand for higher dividends. The dividend that isultimately paid depends on the voting power of the corporate shareholder andhow far apart managers and shareholders are on the proposed dividends. Eckboand Verma find that the voting power of the corporate shareholders influencesdividends, with dividends increasing as corporate voting power increases.
2428

Dividends and Corporate Shareholders
For several reasons, Eckbo and Verma’s results are unlikely to apply to theUnited States. The tax laws in Canada on intercorporate dividends differ fromthose in the United States. Moreover, in Canada minority shareholders havethe right to object to dividend policy. In contrast, dividend policy in the UnitedStates is left to the discretion of the board of directors under the businessjudgment rule. Perhaps most significantly, in Canada the nature of corporateblockholders is typically different from the nature of corporate blockholders inthe United States. In Canada many corporate blockholders are holding compa-nies for individual blockholders.4 In the United States these would be ChapterS corporations and thus subject to individual tax treatment.
One paper that does present data on corporate shareholders and dividends inthe United States is Holderness and Sheehan’s (2000) study of organizationaland legal constraints on majority shareholders. As part of their analysis, theylook at dividend policy on the theory that high payouts to shareholders mayincrease the frequency of external financing, which in turn could trigger ex-ternal monitoring of a majority shareholder. They do not find any significantdifferences in payout policy between the corporate majority shareholder firmsand their paired firms. Holderness and Sheehan do not study shareholders whoown large but less-than-majority blocks of stock, nor do they examine changesin dividend policy after trades of majority blocks of stock.
2. Block-Trade Analysis
The tax-preference hypothesis assumes at its core that corporate shareholdersplace a higher value on cash dividends than do other types of shareholders, es-pecially individual shareholders. Corporate shareholders can not have a lowertax preference for dividends than individual shareholders, and corporate share-holders will have a greater preference for dividends to the extent their marginaltax rate is greater than zero. Accordingly, dividends should increase after acorporation buys a large-percentage block of common stock from an individ-ual, either because management wants to curry favor with the new blockholderor because the new blockholder uses its voting power to alter dividend policyto suit its own tax situation. Because we are examining the same firm beforeand after it changes from an individual to a corporate blockholder, we shouldbe holding constant other factors that affect dividend policy. Consequently, ifdividend policy changes after a block trade, it should, in part at least, reflectthe tax preferences of the new corporate blockholder.
4 An example is Thomson Corporation, one of the largest Canadian corporations with a market capitalization of$22.5 billion. Sixty-five percent of its common stock is owned by Woodbridge Company, which is described inThomson’s proxy as a “private company that is the primary investment vehicle for Kenneth R. Thomson andother members of the family of the late first Lord Thomson of Fleet.” Kenneth Thomson is a director but not anofficer of Thomson Corporation.
2429

The Review of Financial Studies / v 22 n 6 2009
2.1 Block-trade sample
We generate a sample of block trades by examining each entry of The Wall StreetJournal Corporate Index for 1978 through 1997 for transactions that satisfyseveral criteria. First, we look for trades of at least 5% of the outstandingcommon stock of a company. It is important to understand that these are tradesof existing blocks of stock. No stock is issued, so no funds flow to the (target)firms. Indeed, the (target) firms themselves are not directly involved in thetrades. Second, we need to know the number of shares in the block from TheWall Street Journal, the Lexis-Nexis computer database, or from documentspurchased from Disclosure, Inc., typically SEC form 13d filed by either theblock purchaser or the block seller. This information is needed to confirmthat the trade meets the 5% threshold. Third, we exclude block trades that areannounced simultaneously with an offer to acquire the remaining shares inthe firm. Using these criteria, we generate a sample of 186 block trades. Thissample size compares favorably with earlier studies. Barclay and Holderness(1989) in the first block-trade paper study sixty-three block trades. Mikkelsonand Regassa (1991) analyze thirty-seven block trades. Allen and Phillips (2000)investigate operating interactions associated with 402 large-percentage equityinvestments by one corporation in another corporation. Only forty-two of thesepositions, however, were acquired in block trades.
The type of blockholder is central to our inquiry. We classify as corpo-rate shareholders operating firms, banks, and insurance companies as all mayclaim the dividend exemption. (Later in the paper we partition the corporateblockholders into operating and financial.) We also classify private companiesas corporate shareholders when press reports indicate that the company is anoperating entity, as opposed to an investment vehicle. In contrast, we do notclassify private investment vehicles, including Chapter S corporations (such ashedge funds), as corporations because under the Internal Revenue Code anydividends they receive must be passed through each year to their individualshareholders who, in turn, pay taxes on the dividends at their full marginal taxrate. By the same reasoning, we also do not classify mutual funds as corpora-tions, but instead put them into a separate, noncorporate category.5
Using this classification, we identify fifty trades in which the block selleris an individual and the block buyer a corporation. If tax considerations areimportant, dividends should increase following these trades as corporationssupposedly favor dividends while individuals disfavor them. We also have a few(15) block trades that go in the other direction, from corporations to individuals.Because our focus is on possible tax effects from corporate blockholders, notfrom individual blockholders, our analysis naturally focuses on the individualto corporate block trades. We do briefly discuss the corporate-to-individualblock trades, however. There are 121 other block trades (from one corporation
5 Both dividends and capital gains received as a result of normal operations are taxed as ordinary income forfinancial corporations that engage in market making or other trading activities. To the best of our knowledge,none of the blockholdings in our samples fall into this category.
2430

Dividends and Corporate Shareholders
to another or from one individual to another). These block trades do not changethe tax status of the blockholder and thus are not expected to affect dividendpolicy, but they are used for control purposes in some analyses.
Throughout the paper we measure dividend policy in four ways, all of whichhave been used by other researchers. One measure is a dummy variable thatequals one if a firm pays cash dividends and zero if it does not. We alsoexamine the level of dividends in three ways because any clientele effect shouldincrease with the level of dividends. Dividend Yield is dividends per sharedivided by the stock price per share (Compustat annual data item 26 dividedby item 199). Dividends/Assets is annual dividends divided by the book valueof assets (Compustat annual data item 21 divided by item 6). Dividend Payoutis dividends per share divided by earnings per share before extraordinary items(Compustat annual data item 21 divided by item 18). We also document changesin dividends per share after each of the fifty blocks trades. Because this measureis unscaled, it is not appropriate for cross-sectional analyses, either with theblock-trade sample or later in the paper with the random sample.
Dividend Yield takes an investor’s perspective by incorporating the stockprice, thereby making it relevant for the various clientele models. The problemwith this measure is that its variance is determined largely by the variance of thestock price, rather than from changes in dividends, which is our primary interest.The advantage of the second measure, Dividends/Assets, is that the book valueof assets is relatively stable over time. Thus, changes in Dividends/Assets aremore likely to result from changes in dividends. The last measure, DividendPayout, indicates how much of a firm’s earnings are returned to shareholdersin the form of dividends. This variable should help control for changes in afirm’s financial condition that might trigger a change in dividend policy, suchas financial distress, as opposed to a change in the tax situation of a firm’sdominant shareholder.
2.2 The situation before the trades
We start by examining dividend policy before the block trades to put anyposttrade changes into perspective. If dividends were abnormally high beforethe trades, they could remain unchanged after the trades even if corporationsprefer dividends to capital gains. That is to say, an assessment of dividend policyassociated with block trades needs to consider both the pre- and posttrade levelof dividends and not just the change in the level of dividends.
Before the block trades the sample firms seem to have typical dividendpolicies as summarized in the “Before” column of Table 1. Their averageDividend Yield is 1.7% (median 1.1%), and they are paying out 15% (median2%) of their earnings in the form of dividends. Slightly more than half (58%)of the firms are paying dividends. These figures are similar to the dividendpolicies of similar firms in the same year. Here we alternatively compare thesample firms both to similar-sized firms and to firms from the same industry(Fama-French 38 industry classification). For example, the average Dividend
2431

The Review of Financial Studies / v 22 n 6 2009
Table 1
Changes in dividend policy associated with fifty trades of large-percentage blocks of common stock
between 1978 and 1997 in which the block seller is an individual and the block purchaser is a corporation
(but not the corporation that issued the stock)
Before After p-value of difference
Portion Paying Dividends 58% 41% 0.04Dividend Yield 0.017 (0.011) 0.009 (0.00) 0.01 (0.01)Dividends/Assets 0.0064 (0.003) 0.0058 (0.00) 0.66 (0.07)Dividend Payout 0.15 (0.02) 0.10 (0.00) 0.21 (0.08)Block Size 0.28 (0.27) NA NA
Portion Paying Dividends is the percentage of firms paying dividends in at least one of the two years eitherbefore or after the trade. Dividend Yield is a firm’s average (median) annual cash dividends per share (Compustatannual data item 26) divided by its end-of-year stock price (Compustat annual data item 199). Dividends/Assetsis a firm’s average (median) annual dividends (Compustat annual data item 21) divided by book value of assets(Compustat annual data item 6). Dividend Payout is a firm’s average (median) total annual cash dividends(Compustat annual data item 21) divided by its accounting income before extraordinary items (Compustatannual data item 18). The average and median for each variable are computed for the two years before the blocktrade (Before) and the two years following the trade (After). Data from the year of the trade do not enter intothese calculations. Block Size is the average (median) portion of the firms’ common stock involved in the trade.All trades involve at least 5% of the firm’s outstanding common stock. The third column is the p-value froma standard t-test for the hypothesis of no difference between averages or the p-value for a Wilcoxon rank-sumtest on the difference between the before and after medians. Data from The Wall Street Journal, CRSP, andCompustat.
Yield is 1% less and the median Dividend Yield is the same as it is for similar-sized firms in the same year. The average payout of the block-trade firms isslightly above what similar-sized firms were doing in the same year, but theirmedian payout is the same (not reported).6 When we compare the sample firmswith firms from their same industry, the findings are similar.
Thus, there is no evidence of a clientele effect in which corporations arebuying blocks in high-dividend-paying firms. There appears to be an opportu-nity for the corporate purchasers to use their considerable voting power, whichaverages 28% of the common stock (median 27%), to institute or increasedividends after their arrival.
2.3 Changes in dividend policy after corporations buy large blocks
Table 1 also documents how dividend policy changes after a corporation buys alarge-percentage block of stock from an individual. Although the tax-preferencehypothesis predicts an increase in dividends following such trades, especiallygiven that dividends were not abnormally high before the trades, we find noevidence of this. If anything, there appears to be a modest decline in dividends.The portion of firms paying dividends drops from 58% before the trades, whenthere is a dominant individual shareholder, to 41% after the trades (p-value of0.04 on the difference), when there is a dominant corporate shareholder.
6 To make these comparisons for each year of our sample we divide all active Compustat firms into five equal-sizedgroups based on total asset value. We then determine the median dividends/assets, the median dividend yield,and the median dividend payout for each quintile. Then we place each of our firms into the appropriate sizequintile for each year studied, which are the two years before and the two years following the trade. Finally, wesubtract the appropriate median (average) figure from the block-trade firm’s dividend/assets, dividend yield, anddividend payout.
2432

Dividends and Corporate Shareholders
Similarly, all three measures of the level of dividends decline followingthe trades. Here we compare the two-year averages before or after the trade,excluding the year of the trade. Thus, we are examining a five-year window.The declines in the mean and median Dividend Yield, the measure of thelevel of dividends that is probably the most relevant for the clientele models,are both statistically significant. The median declines in Dividend Payout andDividends/Assets are likewise statistically significant.
Because we have only fifty trades, we can check each trade for changes individends per share. Following most of the block trades, 72% of the sample(36 of 50 trades), there is no change in dividends per share. There are dividenddecreases after nine trades (18% of the sample), but there are dividend increasesafter only five trades (10% of the sample).7 Thus, five different measures ofdividend policy provide no support for the posttrade increase in dividendspredicted by the tax-preference hypothesis. If anything, the evidence suggestsa posttrade decrease in dividends. And this was from a pretrade level fordividends that was not unusually high.
2.4 Robustness checks
The data in Table 1, although seeming to reject a tax effect, cannot rejectmore involved explanations that would be consistent with the tax-preferencehypothesis. We now address three of these explanations. We also examine blocktrades that go from corporations to individuals.
2.4.1 Do dividends increase with larger fractional blocks? Table 1 doesnot account for the fractional size of the blocks. A reasonable argument wouldbe that dividends increase only if the corporate block purchasers have sufficientvoting power. Moreover, the tax benefits of dividends for corporate shareholdersincrease with fractional ownership, first at 20% and again at 80%. Because allof the trades are included in Table 1, it is possible that dividend changes amongthe larger block trades may be obscured by the smaller block trades.
There is no evidence of this. For instance, the firms halting dividend paymentsafter the trades have corporate-owned blocks that average 31% of the commonstock (median 28%). Three of the firms that halt dividend payments havemajority corporate shareholders. An analysis of the level of dividends paintsa similar picture. When we regress our measures of the change in the level ofdividends on the percent of common stock in the block, the coefficient for thefractional block size is negative (but insignificant), which provides no evidencethat larger corporate block purchasers use their greater influence to increasedividend payments or that dividends increase as the associated tax benefit forcorporate shareholders increases.
7 To check the robustness of these results, we check dividends per share for each of our block-trade firms for threecalendar years after the trade. In this one-year extension from the analyses reported above, one firm increases itsdividend and another firm decreases its dividend. Thus, our finding of no overall posttrade increase in dividendsand arguably a decrease appears robust to the window of analysis.
2433

The Review of Financial Studies / v 22 n 6 2009
2.4.2 Do dividends increase once we account for the decline in the portion
of firms paying dividends? The data in Table 1 encompass twenty years,and for each block trade we examine dividends over a five-year span. Famaand French (2001) document that the proportion of firms paying dividends hasdecreased over the past twenty years. This raises the possibility that althoughdividends may decrease following block trades, the decreases may be smallerthan expected because of the corporate purchasers. A smaller-than-expecteddecrease could be viewed as an effective increase.
To investigate whether our results are affected by the general decline in theproportion of firms paying dividends, we replicate all of our analyses afteradjusting for changes in dividend payments by similar-sized firms in the sameyear. Results from this difference-in-difference approach paint the same pictureof dividend decreases after corporations purchase blocks in other firms, withsome of the decreases being statistically significant. For instance, adjustedDividend Yield (the Dividend Yield for our sample firm minus the averageDividend Yield for similar-sized firms in the same year) goes from −1% beforethe trade to −1.5% after the trade (p-value of 0.07 on the difference). Theadjusted Dividend Payout likewise declines (p-value of 0.20). Median figuresfor both adjusted Dividend Yield and adjusted Dividend Payout also decline.In no instance do we find evidence of a statistically significant increase.
2.4.3 Were other determinants of dividend policy changing at the same
time as the block trades? By examining the same firm before and after theblock trade, we should control for most of the cross-sectional determinantsof dividend policy. It is possible, however, that other factors that influencedividend policy were changing at the same time as the block trades. Indeed,it is possible that such changes triggered the block trade itself. For instance,assume that corporate blockholders systematically buy blocks in firms withdecreasing profits. If dividends subsequently decrease, it might have little to dowith the tax preference of the new blockholder but more to do with the firm’sfinancial difficulties. We address this issue here through panel regressions withfixed effects for firms and in the next section of the paper through an analysisof the dividend policies at a random sample of publicly traded firms.
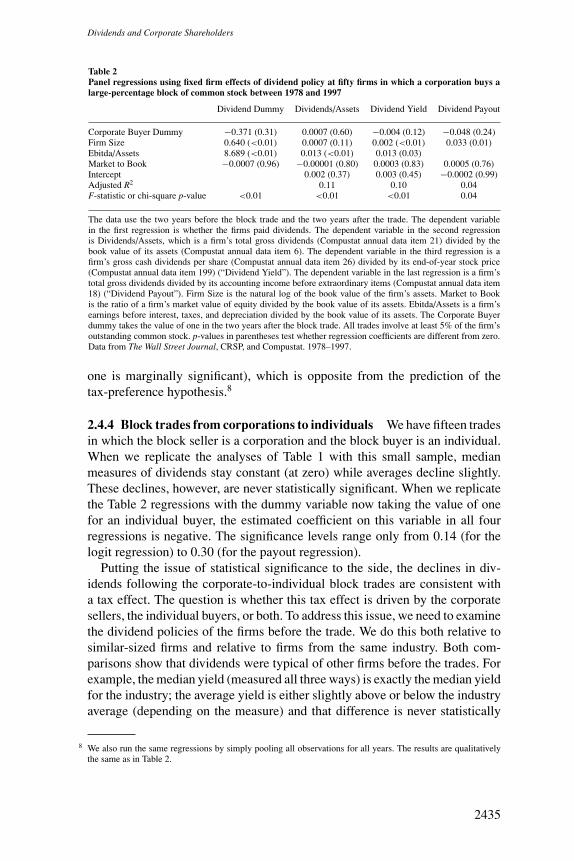
In Table 2 we regress each of our measures of dividend policy on factorsidentified in the literature that affect dividend policy. We control for FirmSize (the natural log of the book value of a firm’s assets), return on assets(earnings before interest, taxes, and depreciation scaled by the book value of afirm’s assets), and the firm’s market-to-book ratio. To test for whether the newblockholder is associated with changes in dividend policy, we specify dummyvariables to identify when the firms have corporate blockholders. Nothingin Table 2 suggests that the changes in dividend policy are being driven bychanges in other variables. Moreover, the Corporate Buyer dummy, which isour primary focus, is negative in three of the four regressions (although only
2434
Dividends and Corporate Shareholders
Table 2
Panel regressions using fixed firm effects of dividend policy at fifty firms in which a corporation buys a
large-percentage block of common stock between 1978 and 1997
Dividend Dummy Dividends/Assets Dividend Yield Dividend Payout
Corporate Buyer Dummy −0.371 (0.31) 0.0007 (0.60) −0.004 (0.12) −0.048 (0.24)Firm Size 0.640 (<0.01) 0.0007 (0.11) 0.002 (<0.01) 0.033 (0.01)Ebitda/Assets 8.689 (<0.01) 0.013 (<0.01) 0.013 (0.03)Market to Book −0.0007 (0.96) −0.00001 (0.80) 0.0003 (0.83) 0.0005 (0.76)Intercept 0.002 (0.37) 0.003 (0.45) −0.0002 (0.99)Adjusted R2 0.11 0.10 0.04F-statistic or chi-square p-value <0.01 <0.01 <0.01 0.04
The data use the two years before the block trade and the two years after the trade. The dependent variablein the first regression is whether the firms paid dividends. The dependent variable in the second regressionis Dividends/Assets, which is a firm’s total gross dividends (Compustat annual data item 21) divided by thebook value of its assets (Compustat annual data item 6). The dependent variable in the third regression is afirm’s gross cash dividends per share (Compustat annual data item 26) divided by its end-of-year stock price(Compustat annual data item 199) (“Dividend Yield”). The dependent variable in the last regression is a firm’stotal gross dividends divided by its accounting income before extraordinary items (Compustat annual data item18) (“Dividend Payout”). Firm Size is the natural log of the book value of the firm’s assets. Market to Bookis the ratio of a firm’s market value of equity divided by the book value of its assets. Ebitda/Assets is a firm’searnings before interest, taxes, and depreciation divided by the book value of its assets. The Corporate Buyerdummy takes the value of one in the two years after the block trade. All trades involve at least 5% of the firm’soutstanding common stock. p-values in parentheses test whether regression coefficients are different from zero.Data from The Wall Street Journal, CRSP, and Compustat. 1978–1997.
one is marginally significant), which is opposite from the prediction of thetax-preference hypothesis.8
2.4.4 Block trades from corporations to individuals We have fifteen tradesin which the block seller is a corporation and the block buyer is an individual.When we replicate the analyses of Table 1 with this small sample, medianmeasures of dividends stay constant (at zero) while averages decline slightly.These declines, however, are never statistically significant. When we replicatethe Table 2 regressions with the dummy variable now taking the value of onefor an individual buyer, the estimated coefficient on this variable in all fourregressions is negative. The significance levels range only from 0.14 (for thelogit regression) to 0.30 (for the payout regression).
Putting the issue of statistical significance to the side, the declines in div-idends following the corporate-to-individual block trades are consistent witha tax effect. The question is whether this tax effect is driven by the corporatesellers, the individual buyers, or both. To address this issue, we need to examinethe dividend policies of the firms before the trade. We do this both relative tosimilar-sized firms and relative to firms from the same industry. Both com-parisons show that dividends were typical of other firms before the trades. Forexample, the median yield (measured all three ways) is exactly the median yieldfor the industry; the average yield is either slightly above or below the industryaverage (depending on the measure) and that difference is never statistically
8 We also run the same regressions by simply pooling all observations for all years. The results are qualitativelythe same as in Table 2.
2435

The Review of Financial Studies / v 22 n 6 2009
significant. The size-adjusted figures paint a similar picture. For example, themedian Dividend Yield of the sample firms is the same as similar-sized firmsand the average yield is only 0.12 percentage points higher. Given that thefirms start from a normal level of dividends, the posttrade decline in dividends(the issue of statistical significance aside) suggests a tax effect for individualblockholders but not for corporate blockholders.
3. Random Sample Analysis
We now turn to our second set of investigations, dividend policy at a random orrepresentative sample of public corporations. Investigations with this sample,which are equal in importance to those with the block trades, offer several ad-vantages. Most important, it is possible that there is something unusual aboutfirms that are the subject of a block trade. The trades may not be exogenous. Anunidentified factor might both trigger a block trade and affect dividend policyafter the trade. Perhaps without such factors dividends would have increasedwith the arrival of a corporate blockholder. There may also be something un-usual about the block buyers. Along these lines, we note that only two of ourblock buyers are financial corporations, whereas casual observation suggeststhat financial blockholders are more common than this. The random samplealso enables us to determine how often firms have corporate blockholders andhow often those blockholders are either operating companies or financial corpo-rations. If only a few firms have corporations as large-percentage shareholders,then the attention over the years on the unusual tax treatment of intercorporatedividend payments has been overblown. A random sample expands the numberand range of observations for analysis. Finally, a random sample enables usto estimate the (unconditional) impact of any tax effect associated with largecorporate shareholders on dividend policy.
3.1 The random sample
To generate a random sample of firms, we start with all firms listed on theMarch 1995 disk of Compact Disclosure, which includes all firms traded onthe NYSE, Amex, and NASDAQ. We select 1995 because we want both recentdata and a starting point for panel data. We randomly select one of the firstten firms listed in Compact Disclosure’s alphabetical listing of firms and thenselect every tenth firm thereafter. This produces a list of 428 firms.
We then use proxy statements to obtain information on large-block owner-ship. We were able to obtain proxies for 376 of the 428 firms from the SEC’sEdgar database, Lexis-Nexis’s EdgarPlus database, or LaserDisclosure. These376 firms constitute the sample for this part of the paper.9 The proxies are asclose to 1995 (typically February or March of that year) as possible. We thenrevisit these firms using 1998, 2001, and 2004 proxies (to the extent that they are
9 There is no overlap between this sample and the block-trade sample.
2436

Dividends and Corporate Shareholders
still publicly traded). We thus have panel data with three-year intervals withoutreplacement of firms that are acquired, go private, or declare bankruptcy.
From the proxies, we hand collect ownership data on all shareholders whoown at least 5% of the common stock. In 1995, 129 of the 376 sample firms(34%) have at least one corporate blockholder that owns at least 5% of the stock.(We use the same blockholder classification as with the block trades.) Thereare 168 different Corporate Blocks in the 1995 sample, with some firms havingmore than one corporate blockholder. The average aggregate stockholdings ofall corporate blockholders within a given firm when the firm has at least onecorporate blockholder is 27% (median 19%). In seventy-one of these firms(19% of the total sample), the largest blockholder in the firm is a corporation.In these cases the average size of that block is 28% (median 22%).
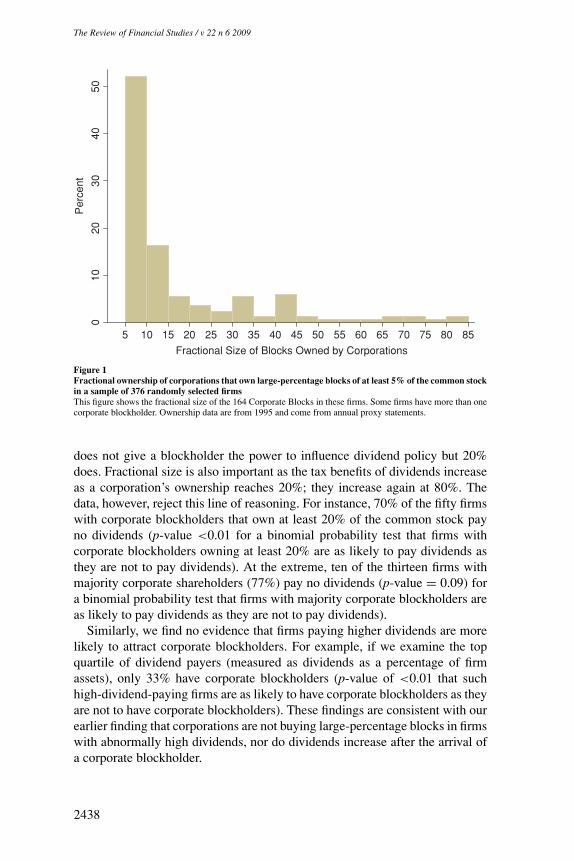
We draw two conclusions from these summary statistics, which to our knowl-edge are the first reported data on the extent of corporate block ownershipamong public firms in general.10 First, corporate block ownership is more thana curious anomaly. Fully one-third of a representative sample of public firmshas corporate blockholders. Second, as shown in Figure 1, there is no clusteringof corporate ownership at 20%, which would increase the dividend exclusionfrom 70% to 80%, or at 80%, which would make the dividend exclusion total.There are only six blocks (4% of the sample) that fall between 20% and 25%,and only three blocks are greater than 80%. One would expect more clusteringof corporate block ownership at (slightly above) 20% and 80% if tax incentiveson dividends were a first-order consideration.
3.2 Basic findings
If tax considerations carry weight, many firms with corporate blockholderswill pay dividends. As reported in Table 3, the opposite, however, is the case.Sixty-eight percent (68%) of the 129 firms with corporate blockholders pay nodividends in 1995 (p-value < 0.01 for a binomial probability test that firmswith corporate blockholders are as likely to pay dividends as they are not topay dividends). This figure is slightly higher but not statistically different fromthe percent of firms without corporate blockholders that do not pay dividends.
The tax-preference hypothesis also has implications for ownership structure.If the hypothesis is correct, firms paying dividends should be more likely tohave corporate blockholders. The data reject this proposition as well. Only 33%of the 133 firms paying dividends have corporate blockholders (p-value < 0.01for binomial probability test that firms paying dividends are as likely to havecorporate blockholders as they are not to have such blockholders). In contrast,35% of the firms that pay no dividends have corporate blockholders.
One limitation of these comparisons is that they do not account for thefractional size of the Corporate Blocks. Perhaps, for instance, 7% ownership
10 Field and Sheehan (2004) report data on corporate large-block ownership for a sample of IPO firms for the firsttwo years in which they are public.
2437
The Review of Financial Studies / v 22 n 6 2009
01
02
03
04
05
0
Perc
ent
5 10 15 20 25 30 35 40 45 50 55 60 65 70 75 80 85
Fractional Size of Blocks Owned by Corporations
Figure 1
Fractional ownership of corporations that own large-percentage blocks of at least 5% of the common stock
in a sample of 376 randomly selected firms
This figure shows the fractional size of the 164 Corporate Blocks in these firms. Some firms have more than onecorporate blockholder. Ownership data are from 1995 and come from annual proxy statements.
does not give a blockholder the power to influence dividend policy but 20%does. Fractional size is also important as the tax benefits of dividends increaseas a corporation’s ownership reaches 20%; they increase again at 80%. Thedata, however, reject this line of reasoning. For instance, 70% of the fifty firmswith corporate blockholders that own at least 20% of the common stock payno dividends (p-value <0.01 for a binomial probability test that firms withcorporate blockholders owning at least 20% are as likely to pay dividends asthey are not to pay dividends). At the extreme, ten of the thirteen firms withmajority corporate shareholders (77%) pay no dividends (p-value = 0.09) fora binomial probability test that firms with majority corporate blockholders areas likely to pay dividends as they are not to pay dividends).
Similarly, we find no evidence that firms paying higher dividends are morelikely to attract corporate blockholders. For example, if we examine the topquartile of dividend payers (measured as dividends as a percentage of firmassets), only 33% have corporate blockholders (p-value of <0.01 that suchhigh-dividend-paying firms are as likely to have corporate blockholders as theyare not to have corporate blockholders). These findings are consistent with ourearlier finding that corporations are not buying large-percentage blocks in firmswith abnormally high dividends, nor do dividends increase after the arrival ofa corporate blockholder.
2438

Dividends and Corporate Shareholders
Table 3
Summary statistics on the payment of cash dividends in a sample of randomly selected firms
Firm has corporate Firm has no corporate p-value of differenceblockholder blockholder between subsamples
Portion not Paying Dividends 0.68 0.64 0.71Dividends/Assets
Average 0.0071 0.0074 0.85Median 0.00 0.00 0.55
Dividend YieldAverage 0.010 0.009 0.72Median 0.00 0.00 0.46
Dividend PayoutAverage 0.07 0.13 0.16Median 0.00 0.00 0.16
Firm pays Firm does not pay p-value of differencedividends dividends between subsamples
Portion Having Corporate Blockholders 0.33 0.35 0.71Blockholder Ownership
Average 7.0% 8.2% 0.50Median 0.00 0.00 0.58
Dividends/Assets is annual dividend payment (Compustat annual data item 21) divided by the book value ofassets (Compustat annual data item 6). Dividend Yield is a firm’s annual cash dividends per share (Compustatannual data item 26) divided by its end-of-year stock price (Compustat annual data item 199). Dividend Payoutis a firm’s total annual cash dividends (Compustat annual data item 21) divided by its accounting income beforeextraordinary items (Compustat annual data item 18). Firms with corporate blockholders are the 129 firms inwhich at least one corporate shareholder owns at least 5% of the common stock. Firms paying dividends arethose 133 sample firms that pay dividends. There are 376 total firms in the sample. Ownership data are from1995 and come from annual proxy statements. Financial data are from 1994 and come from Compustat andCRSP. The p-values are either for a difference in the means test or for the Wilcoxon rank-sum test.
3.3 Multiple regressions
The preceding analyses do not control for factors other than corporate blockownership and fractional block size that might affect dividend policy. Thequestion becomes: once we control for the determinants of dividend policy,does the existence of a corporate blockholder increase either the probability ofa firm paying dividends or the level of dividends?
We address this question through a series of multiple regressions. We identifycontrol variables from the literature. To control for Firm Size, we use log ofbook value of assets. To control for investment opportunities, we use the market-to-book ratio. To control for firm profitability, we use earnings before interest,taxes, and depreciation scaled by the book value of a firm’s assets. Exploratoryanalyses reveal that dividends increase significantly with the age of a firm;accordingly, we control for firm age.11 To control for industry effects, we usethe Fama-French classification of thirty-eight industries. Finally, we controlfor individual block ownership because (in contrast to corporate shareholders)they have a tax preference for capital gains over dividends (Jensen, Solberg,and Zorn 1992; or Agrawal and Jayaraman 1994). In the first two regressions in
11 Year of incorporation comes primarily from the Mergent On-Line Data Base. When that source does not havethe information, we determine year of incorporation from the firm’s Web site or from Lexis-Nexis and Factivatext searches.
2439
The Review of Financial Studies / v 22 n 6 2009
Table 4, we use a dummy variable that equals one if a firm pays dividends andzero otherwise (logit regressions). The other (OLS) regressions utilize the samethree measures of dividend policy used with the block trades (Dividends/Assets,Dividend Yield, and Dividend Payout).
Table 4 offers no support for the proposition that dividends are either morelikely or higher in the presence of corporate blockholders. Instead, as withthe block-trade analysis, there is weak evidence that dividends are actuallylower in the presence of a corporate blockholder, which runs counter to thetax-preference hypothesis. The sign of the coefficient for corporate ownershipis negative in seven of the eight specifications; in the last specification it isnegative and marginally significant (p-value of 0.12).
3.4 Robustness checks
We conduct a wide range of investigations to check the robustness of theTable 4 results. Because two of our measures of dividend policy cannot benegative and are thus bounded below (Dividends/Assets and Dividend Yield),we replicate our results using a Tobit model. Because our OLS regressions donot produce normal, independent, and identically distributed error terms, wealso replicate our results using quantile regressions based on median values.We use three alternative measures of corporate block ownership: the aggregatestock ownership of all corporate blockholders, the stock ownership of the firm’slargest corporate blockholder, and a dummy variable that identifies when afirm’s largest blockholder is a corporation. Because some of the regressionsusing these alternative measures of ownership may be unduly influenced byoutliers, we conduct analyses in which we winsorize the dependent variablesat the 5% and 95% level. Lastly, we use a variety of alternative measures forthe other control variables.12
In the many regressions with these alternate methods and specifications, thefundamental result remains unchanged and is consistent with what we foundwith the block trades—there is no evidence of the predicted positive relationbetween dividend policy and corporate stock ownership.
3.5 Changes in dividend policy
Next we examine changes in dividend policy over time to determine whetherfirms initiate (halt) or increase (decrease) dividends after the arrival (departure)of corporate blockholders. We first note that there is no such relationship in thesummary statistics. Twenty-nine firms from the random sample initiated divi-dends in 1998, 2001, or 2004. The average (median) corporate block ownershipbefore the initiations was 4.2% (median zero), and the average corporate block
12 For firm size, instead of log of book value of assets we use log of market value of equity and log of sales. Forgrowth opportunities, instead of the market-to-book ratio we use the compounded three-year growth rate in salesand the three-year growth rate in assets. For firm profitability, instead of Ebitda scaled by firm assets we useEbitda scaled by firm sales and return on assets (net income divided by assets). For firm age, instead of thenumber of years since incorporation we use the log of the number of years since incorporation.
2440

Dividends and Corporate Shareholders
Tab
le4
Reg
ress
ion
san
aly
sis
of
the
div
iden
dp
oli
cies
at
asa
mp
leof
ran
dom
lych
ose
nfi
rms
(1)
(2)
(3)
(4)
(5)
(6)
(7)
(8)
Div
iden
dD
umm
yD
ivid
end
Dum
my
Div
iden
d/A
sset
sD
ivid
end/
Ass
ets
Div
iden
dY
ield
Div
iden
dY
ield
Div
iden
dPa
yout
Div
iden
dPa
yout
Cor
pora
teB
lock
s−0
.084
50−0
.199
90−0
.000
06−0
.000
200.
0004
3−0
.000
38−0
.051
88−0
.074
16(0
.71)
(0.5
6)(0
.97)
(0.9
1)(0
.85)
(0.8
9)(0
.30)
(0.1
2)In
divi
dual
Blo
cks
0.01
487
−0.0
0209
−0.0
0200
−0.0
4249
(0.9
6)(0
.14)
(0.3
5)(0
.27)
Firm
Size
0.60
811
−0.0
0004
0.00
091
0.03
706
(<0.
01)
(0.9
5)(0
.27)
(<0.
01)
Mar
kett
oB
ook
−0.1
9418
0.00
037
−0.0
0124
0.01
018
(0.3
4)(0
.55)
(0.1
4)(0
.21)
Ebi
tda/
Ass
ets
2.96
516
0.01
088
0.00
218
(0.0
2)(0
.06)
(0.6
6)A
geof
Firm
0.03
837
0.00
024
0.00
017
0.00
273
(<0.
01)
(<0.
01)
(<0.
01)
(<0.
01)
Con
stan
t−0
.573
96−5
.109
590.
0073
70.
0010
10.
0092
90.
0029
30.
1243
6−0
.124
19(0
.000
015)
(<0.
01)
(<0.
01)
(0.7
7)(<
0.01
)(0
.51)
(<0.
01)
(0.0
7)O
bser
vatio
ns37
636
937
636
937
636
937
637
2Ps
eudo
/adj
uste
dR
20.
152
0.43
3<
0.00
10.
140
<0.
001
0.24
30.
005
0.17
2
The
first
two
regr
essi
ons
are
logi
tre
gres
sion
sin
whi
chth
ede
pend
ent
vari
able
take
sa
valu
eof
one
ifth
efir
mpa
iddi
vide
nds
in19
94an
dze
root
herw
ise.
The
othe
rre
gres
sion
sar
eO
LS.
Div
iden
ds/A
sset
sis
annu
aldi
vide
nds
(Com
pust
atan
nual
data
item
21)
divi
ded
bybo
okva
lue
ofas
sets
(Com
pust
atan
nual
data
item
6).
Div
iden
dY
ield
isa
firm
’sdi
vide
nds
per
shar
e(C
ompu
stat
annu
alda
taite
m26
)di
vide
dby
itsen
d-of
-yea
rst
ock
pric
e(C
ompu
stat
annu
alda
taite
m19
9).D
ivid
end
Payo
utis
afir
m’s
annu
aldi
vide
nds
divi
ded
byits
acco
untin
gin
com
ebe
fore
extr
aord
inar
yite
ms
(Com
pust
atan
nual
data
item
18).
Cor
pora
teB
lock
sis
adu
mm
yva
riab
leth
atin
dica
tes
the
firm
has
atle
asto
neco
rpor
ate
shar
ehol
der
that
owns
atle
ast5
%of
the
com
mon
stoc
k.In
divi
dual
Blo
cks
isa
dum
my
vari
able
that
indi
cate
sth
efir
mha
sat
leas
tone
indi
vidu
alsh
areh
olde
rw
hoow
nsat
leas
t5%
ofth
eco
mm
onst
ock.
Firm
Size
isth
ena
tura
llog
ofth
ebo
okva
lue
ofth
efir
m’s
asse
ts.M
arke
tto
Boo
kis
the
ratio
ofa
firm
’sm
arke
tval
ueof
equi
tydi
vide
dby
the
book
valu
eof
itsas
sets
.Ebi
tda/
Ass
ets
isa
firm
’sea
rnin
gsbe
fore
inte
rest
,ta
xes,
and
depr
ecia
tion
divi
ded
byth
ebo
okva
lue
ofits
asse
ts.A
geof
Firm
isth
enu
mbe
rof
year
ssi
nce
inco
rpor
atio
n.A
llre
gres
sion
sin
clud
edun
repo
rted
indu
stry
dum
my
vari
able
sba
sed
onth
eFa
ma-
Fren
ch38
indu
stry
clas
sific
atio
n.(p
-val
ues
ofH
uber
-Whi
tero
bust
t-st
atis
tics
inpa
rent
hese
ste
stw
heth
erco
effic
ient
sar
esi
gnifi
cant
lydi
ffer
entf
rom
zero
.)D
ata
from
CR
SP,
Com
pust
at,M
erge
ntD
ata
Bas
e,an
dan
nual
prox
yst
atem
ents
.
2441
The Review of Financial Studies / v 22 n 6 2009
ownership after the initiations was 3.2% (median zero). Conversely, fourteenfirms halted dividends in 1998, 2001, or 2004. Corporate Blocks averaged 5%(median zero) before these stops and 4% (median zero) after the stops.
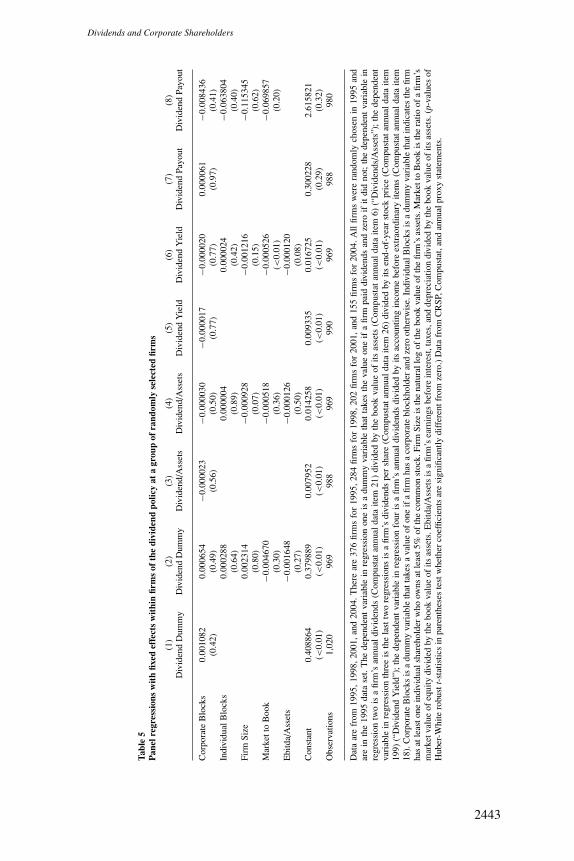
These summary statistics, obviously, do not account for other factors thatmight affect dividend policy. Accordingly, we now conduct panel regressionsusing data from all four years (1995, 1998, 2001, and 2004) with fixed effectswithin firms. This helps to control for omitted firm-specific factors that affectdividend policy and are constant over time. Of the original 376 sample firms,284 were publicly traded in 1998; 202 were public in 2001; and 155 werestill public in the last sample year of 2004. We continue to use the same fourmeasures for dividend policy, but we use only those independent variablesfrom Table 4 that change over time. Consequently, we do not use year ofincorporation (firm age) or industry classification as they stay constant overtime for a given firm and are thus subsumed within the firm fixed effect. Thepanel regressions are presented in Table 5.
The panel regressions fail to support the tax-preference hypothesis. Thecoefficients for changes in corporate ownership in all specifications are small,insignificant, and change sign depending on the specification. In general, thepanel regressions do little to explain changes in dividend policy over time.13
This is consistent with a long line of research going back to Lintner (1956)showing that dividend policy within a firm tends to be sticky over time.
3.6 Do Firms change the mix of payouts for corporate shareholders?
Corporate blockholders’ tax preference for dividends over capital gains couldmanifest itself in several ways. We find no evidence that cash dividends arehigher in firms with corporate blockholders. Corporate blockholders, however,could cause firms to change the mix of payouts between cash dividends andshare repurchases. To the extent that firms distribute cash, corporate blockhold-ers will pay lower taxes on dividends than on the capital gains associated withshare repurchases. Thus, tax-clientele considerations would hold that, all elseequal, firms with corporate blockholders should distribute a higher fraction oftheir total payouts in the form of cash dividends.
To investigate the impact of corporate blockholders on the mix of payouts, wedefine a new variable called “payout mix,” which is cash dividends (Compustatannual data item 21) minus stock repurchases (Compustat annual data item115) divided by the book value of assets (Compustat annual data item 6).14 Ifthe tax-preference hypothesis is correct, the payout mix should be higher infirms with corporate blockholders than in firms without corporate blockholders.
13 We conduct several robustness tests here. For instance, instead of using a dummy variable to identify firms withcorporate blockholders, we use the aggregate stock holdings of all corporate blockholders. The results remainqualitatively the same throughout these various robustness tests.
14 Compustat annual data item 115 includes not only repurchases of common stock but repurchases of preferredstock as well. The inclusion of the latter, however, is usually only a small fraction of a firm’s total repurchasesand thus should not significantly affect the results. See Stephens and Weisbach (1998).
2442
Dividends and Corporate Shareholders
Tab
le5
Pan
elre
gre
ssio
ns
wit
hfi
xed
effe
cts
wit
hin
firm
sof
the
div
iden
dp
oli
cyat
agro
up
of
ran
dom
lyse
lect
edfi
rms
(1)
(2)
(3)
(4)
(5)
(6)
(7)
(8)
Div
iden
dD
umm
yD
ivid
end
Dum
my
Div
iden
d/A
sset
sD
ivid
end/
Ass
ets
Div
iden
dY
ield
Div
iden
dY
ield
Div
iden
dPa
yout
Div
iden
dPa
yout
Cor
pora
teB
lock
s0.
0010
820.
0006
54−0
.000
023
−0.0
0003
0−0
.000
017
−0.0
0002
00.
0000
61−0
.008
436
(0.4
2)(0
.49)
(0.5
6)(0
.50)
(0.7
7)(0
.77)
(0.9
7)(0
.41)
Indi
vidu
alB
lock
s0.
0002
880.
0000
040.
0000
24−0
.063
804
(0.6
4)(0
.89)
(0.4
2)(0
.40)
Firm
Size
0.00
2314
−0.0
0092
8−0
.001
216
−0.1
1534
5(0
.80)
(0.0
7)(0
.15)
(0.6
2)M
arke
tto
Boo
k−0
.004
670
−0.0
0051
8−0
.000
526
−0.0
6985
7(0
.30)
(0.3
6)(<
0.01
)(0
.20)
Ebi
tda/
Ass
ets
−0.0
0164
8−0
.000
126
−0.0
0012
0(0
.27)
(0.5
0)(0
.08)
Con
stan
t0.
4088
640.
3798
890.
0079
520.
0142
580.
0093
350.
0167
250.
3002
282.
6158
21(<
0.01
)(<
0.01
)(<
0.01
)(<
0.01
)(<
0.01
)(<
0.01
)(0
.29)
(0.3
2)O
bser
vatio
ns1,
020
969
988
969
990
969
988
980
Dat
aar
efr
om19
95,1
998,
2001
,and
2004
.The
rear
e37
6fir
ms
for
1995
,284
firm
sfo
r19
98,2
02fir
ms
for
2001
,and
155
firm
sfo
r20
04.A
llfir
ms
wer
era
ndom
lych
osen
in19
95an
dar
ein
the
1995
data
set.
The
depe
nden
tva
riab
lein
regr
essi
onon
eis
adu
mm
yva
riab
leth
atta
kes
the
valu
eon
eif
afir
mpa
iddi
vide
nds
and
zero
ifit
did
not;
the
depe
nden
tva
riab
lein
regr
essi
ontw
ois
afir
m’s
annu
aldi
vide
nds
(Com
pust
atan
nual
data
item
21)
divi
ded
byth
ebo
okva
lue
ofits
asse
ts(C
ompu
stat
annu
alda
taite
m6)
(“D
ivid
ends
/Ass
ets”
);th
ede
pend
ent
vari
able
inre
gres
sion
thre
eis
the
last
two
regr
essi
ons
isa
firm
’sdi
vide
nds
per
shar
e(C
ompu
stat
annu
alda
taite
m26
)di
vide
dby
itsen
d-of
-yea
rst
ock
pric
e(C
ompu
stat
annu
alda
taite
m19
9)(“
Div
iden
dY
ield
”);t
hede
pend
entv
aria
ble
inre
gres
sion
four
isa
firm
’san
nual
divi
dend
sdi
vide
dby
itsac
coun
ting
inco
me
befo
reex
trao
rdin
ary
item
s(C
ompu
stat
annu
alda
taite
m18
).C
orpo
rate
Blo
cks
isa
dum
my
vari
able
that
take
sa
valu
eof
one
ifa
firm
has
aco
rpor
ate
bloc
khol
der
and
zero
othe
rwis
e.In
divi
dual
Blo
cks
isa
dum
my
vari
able
that
indi
cate
sth
efir
mha
sat
leas
tone
indi
vidu
alsh
areh
olde
rw
hoow
nsat
leas
t5%
ofth
eco
mm
onst
ock.
Firm
Size
isth
ena
tura
llog
ofth
ebo
okva
lue
ofth
efir
m’s
asse
ts.M
arke
tto
Boo
kis
the
ratio
ofa
firm
’sm
arke
tval
ueof
equi
tydi
vide
dby
the
book
valu
eof
itsas
sets
.Ebi
tda/
Ass
ets
isa
firm
’sea
rnin
gsbe
fore
inte
rest
,tax
es,a
ndde
prec
iatio
ndi
vide
dby
the
book
valu
eof
itsas
sets
.(p-
valu
esof
Hub
er-W
hite
robu
stt-
stat
istic
sin
pare
nthe
ses
test
whe
ther
coef
ficie
nts
are
sign
ifica
ntly
diff
eren
tfro
mze
ro.)
Dat
afr
omC
RSP
,Com
pust
at,a
ndan
nual
prox
yst
atem
ents
.
2443

The Review of Financial Studies / v 22 n 6 2009
We find no evidence that corporate blockholders affect the mix of payoutsbetween cash dividends and share repurchases. To the contrary, firms with cor-porate blockholders actually spend slightly more repurchasing stock than theydo paying dividends. Furthermore, firms with corporate blockholders have aslightly greater propensity to repurchase shares than to pay cash dividends.We also conduct multiple regression analyses to control for other variablesthat could affect the mix of payouts, including Firm Size, q-ratio, firm prof-itability, and firm age. Our variables of interest are either a dummy variableto denote firms with corporate blockholders or the percentage of stock heldby all corporate blockholders within a firm. Neither variable is statisticallysignificant.15
4. Why Isn’t There a Tax Effect on Dividend Policy?
The evidence both from the block trades and from the random sample pointsto the same conclusion—dividends are not higher in the presence of a large-percentage corporate shareholder even though these shareholders have a uniquetax preference for dividends. We now investigate several possibilities for thisfinding. The first two possibilities implicitly assume that tax considerationsare paramount. We then divide our sample of corporate blockholders intooperating firms and financial firms. Here we test for the possibility that differenttypes of corporate blockholders may have different objectives in making blockinvestments, and for some investors taxes on dividends may be of second-orderimportance.
4.1 Tax rates of the corporate blockholders
The claim that corporations are the only investors with a tax preference fordividends is based on the corporate statutory tax rate of 35%. If a corporation’seffective marginal tax rate is sufficiently low, because of loss carry-forwards orhigh deductions, from a tax perspective it will be indifferent between dividendsand capital gains. There is evidence that some corporations, indeed, have low taxrates. Our failure to find a tax effect on dividend policy would be understandableif low-tax-rate corporations tend to own blocks in other corporations.
To investigate this possibility, we need an estimate of the marginal tax ratesof corporate blockholders. Graham (1996a and 1996b) develops an algorithmfor estimating the effective marginal tax rates of public corporations. We use
15 We conduct a wide range of multiple regression analyses and robustness checks, including alternative regressionmethods, alternative definitions of variables, and the trimming of outliers. These analyses help address theregularity that repurchases are more frequent when firms have more volatile cash flows and when recent stock-return performance has been poor; see Jagannathan, Stephens, and Weisbach (2000). These regression analysesand robustness tests do not change the fundamental finding that corporate blockholder firms do not reduce stockrepurchases to maintain cash dividends. We also find no change in the mix of payouts with the block-trade sampleafter the arrival of a corporate blockholder.
2444

Dividends and Corporate Shareholders
Table 6
Summary statistics on the marginal tax rates of corporations that own large-percentage blocks in a
random sample of other corporations (corporate blockholders) compared with corporations generally
Corporate blockholders All other corporations p-value of difference
Average marginal tax rate 30% 17% <0.01Median marginal tax rate 35% 13% <0.01Proportion of firms with zero 0.03 0.09 0.02
marginal tax rate
The tax rates come from John R. Graham, http://faculty.fuqua.duke.edu/∼jgraham/taxform.html, and are de-scribed in Graham (1996a and 1996b). These tax rates take into account any interest deduction that a corporationmay have (that is, they are “marginal tax rates two” from Graham). The observations are from 1995, 1998,2001, and 2004. There are 122 observations for the corporate blockholders and 26,198 observations for othercorporations. The p-values in the last column are for either a difference in the means test or the Wilcoxonrank-sum test.
his database (the Graham Database) to determine whether the corporate block-holders in our random sample have low marginal tax rates.16
Table 6 reports the marginal tax rates for our corporate blockholders andcompares them with the marginal tax rates for the other companies in theGraham Database. The corporate blockholders have an average marginal taxrate of 30% (median 35%), which is obviously high in an absolute sense and alsorelative to other public corporations. Furthermore, few corporate blockholdershave marginal tax rates of zero, the rate at which they would be indifferentbetween dividends and capital gains.
We conduct several investigations into the robustness of these findings. First,because some of our corporate blockholders are not in the Graham Database,primarily because they are either foreign or private, we want to determine ifthere is a selection bias in data availability. There is no statistically significantdifference in dividend policy between the firms whose corporate blockholdersare in the Graham Database and the firms whose corporate blockholders are notin the Graham Database. When we replicate the regressions of Table 4 with adummy variable to indicate those firms with missing tax-rate data, the dummyvariable is insignificant and changes sign with the regression specification.We also examine each of the four sample years separately; in every year themarginal tax rates of the corporate blockholders are close to 35% and aresignificantly higher than they are for the entire sample.
We also investigate whether dividend policy varies with the marginal tax rateof the corporate blockholders. In particular, we want to determine if dividendsincrease as the marginal tax rate of the corporate blockholder increases, aswould be predicted from the tax-preference hypothesis. We do not find this,nor do we find any systematic relation between the corporate blockholders’marginal tax rate and dividend policy.17 This is not surprising because there
16 http://faculty.fuqua.duke.edu/∼jgraham/taxform.html.
17 The sign of the coefficient for the blockholders’ marginal tax rate is generally insignificant in a wide range ofinvestigations, including replication of the cross-sectional regressions of Table 4 and the panel regressions ofTable 5. In the few instances where the blockholders’ marginal tax rate is significant, the sign of the coefficient
2445

The Review of Financial Studies / v 22 n 6 2009
is little cross-sectional variation in the blockholders’ tax status; 75% of thecorporate blockholders have marginal tax rates clustered around 34%. Thus insummary, we find that the specific tax status of corporate blockholders cannotexplain the absence of a tax effect. If anything, the high tax rates of corporateblockholders should make tax considerations even more important.
4.2 Agency problems at the corporate blockholders
The high tax rates summarized in Table 6 suggest that managers of the corporateblockholders should be attuned to ways to reduce their firms’ tax payments. Butperhaps agency problems at the corporate blockholder firms mean that theirmanagers care more about building an empire through block investing thanreducing their firms’ tax bills. This explanation would be consistent with ourfindings of relatively low dividends (Table 3), high marginal tax rates (Table 6),and large-block investments.
To address this explanation for the lack of a tax effect on dividend policy, weneed a measure of potential agency problems at the corporate blockholder firms.Two indices have been developed recently to do this. The first index is developedby Gompers, Ishii, and Metrick (2003) (the Governance or “G Index”). TheG Index is constructed by adding one for each corporate governance featurethat restricts shareholders’ rights, such as poison pills and staggered votingfor directors, and subtracts one for features that increase shareholder rights,such as cumulative voting. The higher the index, the weaker are the rightsof shareholders to discipline management and the greater, therefore, are thepotential agency problems.
A limitation of the G Index is that it treats as equal in impact all featuresthat either enhance or erode shareholder rights, such as staggered boards andcumulative voting. In fact, some lead to greater managerial entrenchment.Accordingly, Bebchuk, Cohen, and Ferrell (2004) develop an alternative index(the Entrenchment or “E Index”). The E Index uses the same source materialas does the G Index (publications from the Investor Responsibility ResearchCenter) but considers only those six factors that the developers of the indexfind are the most important for managerial entrenchment.18 Like the G Index,a higher score for the E Index signifies greater managerial entrenchment andhence greater agency problems. (The G Index ranges from 0 to 24; the E Indexranges from 0 to 6.)
Table 7 summarizes both indices for the corporate blockholder firms andcompares them with other firms. We see that the corporate blockholders are
is negative, which is opposite from what the tax-preference hypothesis would predict. In those few firms withmultiple corporate blockholders, we define the blockholders’ marginal tax rate in three alternative ways: a simpleaverage, an average weighted by the blockholders’ ownership stakes, and the blockholders’ maximum marginaltax rate. All three measures produce similar results.
18 The six are restrictions on the power of shareholders to amend by laws, supermajority voting for mergers,staggered elections for directors, poison pills to discourage insurgent large-percentage shareholders, and goldenparachutes for top management.
2446
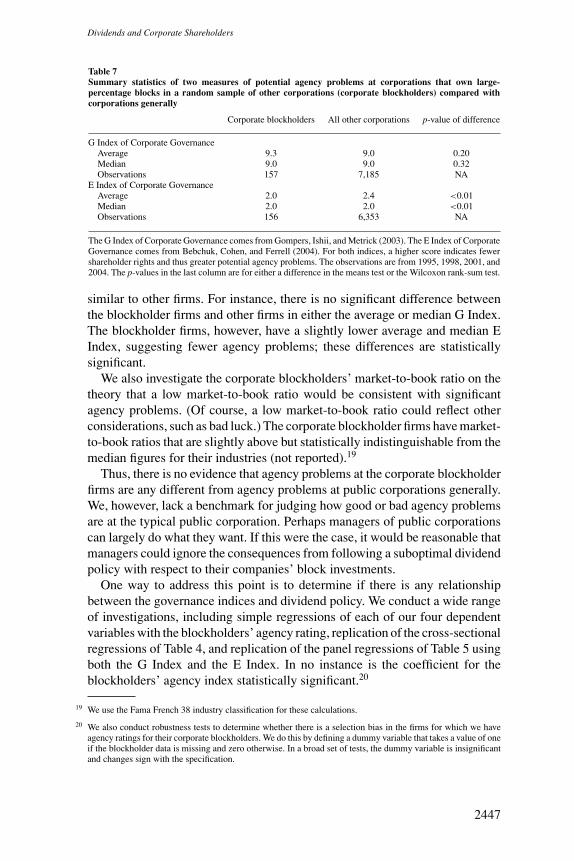
Dividends and Corporate Shareholders
Table 7
Summary statistics of two measures of potential agency problems at corporations that own large-
percentage blocks in a random sample of other corporations (corporate blockholders) compared with
corporations generally
Corporate blockholders All other corporations p-value of difference
G Index of Corporate GovernanceAverage 9.3 9.0 0.20Median 9.0 9.0 0.32Observations 157 7,185 NA
E Index of Corporate GovernanceAverage 2.0 2.4 <0.01Median 2.0 2.0 <0.01Observations 156 6,353 NA
The G Index of Corporate Governance comes from Gompers, Ishii, and Metrick (2003). The E Index of CorporateGovernance comes from Bebchuk, Cohen, and Ferrell (2004). For both indices, a higher score indicates fewershareholder rights and thus greater potential agency problems. The observations are from 1995, 1998, 2001, and2004. The p-values in the last column are for either a difference in the means test or the Wilcoxon rank-sum test.
similar to other firms. For instance, there is no significant difference betweenthe blockholder firms and other firms in either the average or median G Index.The blockholder firms, however, have a slightly lower average and median EIndex, suggesting fewer agency problems; these differences are statisticallysignificant.
We also investigate the corporate blockholders’ market-to-book ratio on thetheory that a low market-to-book ratio would be consistent with significantagency problems. (Of course, a low market-to-book ratio could reflect otherconsiderations, such as bad luck.) The corporate blockholder firms have market-to-book ratios that are slightly above but statistically indistinguishable from themedian figures for their industries (not reported).19
Thus, there is no evidence that agency problems at the corporate blockholderfirms are any different from agency problems at public corporations generally.We, however, lack a benchmark for judging how good or bad agency problemsare at the typical public corporation. Perhaps managers of public corporationscan largely do what they want. If this were the case, it would be reasonable thatmanagers could ignore the consequences from following a suboptimal dividendpolicy with respect to their companies’ block investments.
One way to address this point is to determine if there is any relationshipbetween the governance indices and dividend policy. We conduct a wide rangeof investigations, including simple regressions of each of our four dependentvariables with the blockholders’ agency rating, replication of the cross-sectionalregressions of Table 4, and replication of the panel regressions of Table 5 usingboth the G Index and the E Index. In no instance is the coefficient for theblockholders’ agency index statistically significant.20
19 We use the Fama French 38 industry classification for these calculations.
20 We also conduct robustness tests to determine whether there is a selection bias in the firms for which we haveagency ratings for their corporate blockholders. We do this by defining a dummy variable that takes a value of oneif the blockholder data is missing and zero otherwise. In a broad set of tests, the dummy variable is insignificantand changes sign with the specification.
2447

The Review of Financial Studies / v 22 n 6 2009
Finally, we conduct regression analyses simultaneously using both the block-holders’ governance ratings and their marginal tax rates along with a variety ofother control variables (such as Firm Size). There is no resulting evidence of apositive relation between either or both of these variables and dividend policy.We also explore whether the interaction of a high marginal tax rate and strongshareholder rights is associated with higher dividends (as a way to reduce taxes).To do this we define a new variable that is the product of a firm’s corporateblockholders’ marginal tax rate (for firms with multiple corporate blockhold-ers, we use the blockholders’ average marginal tax rate) times 24 minus theblockholders’ G Index (for firms with multiple corporate blockholders, we usethe blockholders’ average G Index). The coefficient for this new measure isalways insignificant and is often negative in sign, which is opposite to what thetax-preference hypothesis would predict. In short, in a wide range of analysescontrolling for both blockholder characteristics and recognized determinantsof dividend policy, there is no support for the tax-preference hypothesis.
4.3 Operating versus financial corporate blockholders
Although there is a consistent tax treatment for dividends received by corpora-tions, the nature of the corporations that own large-percentage blocks in othercorporations is anything but homogeneous. The literature on intercorporateinvestments has stressed the operating interactions that often arise when onefirm invests in another firm (for example, Allen and Phillips (2000) or Fee,Hadlock, and Thomas (2006)). Indeed, forty-eight out of fifty of our blocktrades fit this mold. One of the strongest regularities among the block tradesis that the purchasing corporations are in the same or a related business as thetarget firms (36 trades or 72% of the sample). In addition, 60% of the block pur-chasers become publicly involved in firm management. Often representativesof the block purchaser join the target’s boards of directors; in some instances,representatives of the block purchaser assume top management positions atthe target. In 38% of the block trades there are public announcements of jointefforts by the block purchaser and the firm to expand operations, often in theform of a joint venture. Only two of our trades fit the mold of the nonoperatingor financial buyer. Interestingly, one of these trades involves the only posttradeinitiation of dividends in the entire block trade sample.21
Although the literature has focused on operating corporate blockholders,some corporate blockholders are financial organizations. Indeed, in our randomsample financial blockholders are more common than operating blockholders.The two types of corporate blockholders could have different motivations in
21 Kleer-Vu Industries never paid a dividend for the thirty-four years during which its founder, Benjamin Osher,served as chief executive officer and owned 27% of the firm’s common stock. Shortly after Mr. Osher soldhis block of stock to Denitex International Corporation, however, Kleer-Vu initiated dividend payments andsubsequently increased them in each of the next two years. It also declared a special dividend two years afterthe trade. At the time of the dividend initiation and subsequent increase, Denitex’s representatives constituted amajority of the directors at Kleer-Vu. Kleer-Vu fabricates and sells plastic products. Denitex describes itself inSEC filings as being engaged “in securities investing.”
2448

Dividends and Corporate Shareholders
making block investments. Financial investors are unlikely to have the exper-tise to affect firm operations, and they are unlikely to enjoy the private benefits(such as synergies in production) that are often a consideration for operat-ing blockholders. Hence, financial blockholders may be more concerned withdividend policy.
To investigate such possibilities, we divide the random sample into firms withfinancial corporate blockholders and firms with operating corporate blockhold-ers. The financial blockholders are either banks (41 in the 1995 random sample)or insurance companies (54 in 1995). (Recall that mutual funds, pension funds,and personal investment vehicles are put in separate categories and are neverclassified as corporate.) All other corporate blockholders are classified as oper-ating blockholders (69 in 1995). The two categories of financial and operatinginvestors are mutually exclusive and exhaustive of the corporate blockholders.22
Table 8 reports that firms with operating blockholders have lower dividendsthan firms with financial blockholders, no matter how dividends are measured.Dividends at firms with operating blockholders are also lower than they are atfirms with no corporate blockholders of any type. Even with the small samplesizes, many of these differences are statistically significant. Thus, with operat-ing corporate blockholders dividends are opposite to the direction predicted bythe tax-preference hypothesis.
This suggests that other considerations may be more important for operatinginvestors. Although there are likely a variety of such considerations, it is rea-sonable to hypothesize that capital expenditures at the target firm might be oneof them. Indeed, we see in Table 8 that capital expenditures are higher in firmswith operating blockholders than firms with financial blockholders or firmswith no corporate blockholders of any type. All of these differences are sta-tistically significant. The differences also seem to be economically significant.Both the mean and the median capital expenditures (as a percentage of firmassets) are approximately twice as high in firms with operating blockholders.23
The block-trade sample fits this pattern as well. Dividends decline aftera corporation buys a large-percentage block from an individual. (Recall thatall but two of the trades involve operating buyers.) At the same time, capitalexpenditures increase, although the increase is not statistically significant. Incontrast, when a block goes from a corporation to an individual, both averageand median capital expenditures decline, and these declines are statisticallysignificant (p-values of 0.01 on both parametric and nonparametric tests).
These findings suggest that operating corporate block investors concludethat funds are better spent pursuing investment opportunities at the target firmthan increasing dividends, the negative tax implications notwithstanding. Al-though this may not be an optimal tax policy for the corporate blockholders,
22 Eleven firms have both operating and financial corporate blockholders. These firms are excluded from theTable 8 comparisons, but they are included in the Table 9 comparisons.
23 We also conduct analyses with a variety of control variables. The results confirm that dividends are lower andcapital expenditures are higher in firms with operating as opposed to financial blockholders.
2449

The Review of Financial Studies / v 22 n 6 2009
Tab
le8
Cap
ital
exp
end
itu
res
an
dd
ivid
end
poli
cyin
asa
mp
leof
ran
dom
lych
ose
np
ub
lic
firm
s
Firm
sw
ithop
erat
ing
corp
orat
ebl
ockh
olde
rsFi
rms
with
finan
cial
corp
orat
ebl
ockh
olde
rsp-
valu
eof
diff
eren
cebe
twee
nop
erat
ing
and
finan
cial
Firm
sw
ithou
tcor
pora
tebl
ockh
olde
rsp-
valu
eof
diff
eren
cebe
twee
nop
erat
ing
and
firm
sw
ithou
tcor
pora
tebl
ockh
olde
rs
p-va
lue
ofdi
ffer
ence
betw
een
finan
cial
and
firm
sw
ithou
tcor
pora
tebl
ockh
olde
rs
Cap
italE
xpen
ditu
res
Ave
rage
0.27
0.14
0.03
0.14
<0.
010.
77M
edia
n0.
190.
09<
0.01
0.10
<0.
010.
31Po
rtio
nPa
ying
Div
iden
ds0.
270.
410.
120.
370.
190.
46D
ivid
ends
/Ass
ets
Ave
rage
0.00
20.
009
0.02
0.00
80.
050.
71M
edia
n0.
000.
000.
060.
000.
080.
49D
ivid
end
Yie
ldA
vera
ge0.
005
0.10
0.13
0.10
0.19
0.97
Med
ian
0.00
0.00
0.08
0.00
0.08
0.61
Div
iden
dPa
yout
Ave
rage
−0.0
60.
170.
030.
13<
0.01
0.26
Med
ian
0.00
0.00
<0.
010.
00<
0.01
0.38
Fina
ncia
lblo
ckho
lder
sar
eba
nks
and
insu
ranc
eco
mpa
nies
.All
othe
rco
rpor
ate
bloc
khol
ders
are
clas
sifie
das
oper
atin
gbl
ockh
olde
rs.C
olum
nstw
oan
dth
ree
com
pare
the
fort
y-fiv
efir
ms
with
oper
atin
gbl
ockh
olde
rsw
ithth
ese
vent
y-on
efir
ms
with
finan
cial
bloc
khol
ders
.C
olum
nfo
urad
dsth
eco
mpa
riso
nw
ithal
lfir
ms
inth
era
ndom
data
base
of37
6fir
ms
that
have
noco
rpor
ate
bloc
khol
ders
ofan
yty
pe.C
apita
lExp
endi
ture
sar
ean
nual
capi
tale
xpen
ditu
res
(Com
pust
atan
nual
data
item
128)
plus
rese
arch
and
deve
lopm
ente
xpen
ditu
res
(Com
pust
atan
nual
data
item
46)
divi
ded
byth
ebo
okva
lue
ofas
sets
(Com
pust
atan
nual
data
item
6).
Div
iden
ds/A
sset
sis
annu
aldi
vide
nds
(Com
pust
atan
nual
data
item
21)
divi
ded
byth
ebo
okva
lue
ofas
sets
(Com
pust
atan
nual
data
item
6).D
ivid
end
Yie
ldis
afir
m’s
annu
alca
shdi
vide
nds
pers
hare
(Com
pust
atan
nual
data
item
26)d
ivid
edby
itsen
d-of
-yea
rsto
ckpr
ice
(Com
pust
atan
nual
data
item
199)
.Div
iden
dPa
yout
isa
firm
’sto
tala
nnua
lca
shdi
vide
nds
(Com
pust
atan
nual
data
item
21)
divi
ded
byits
acco
untin
gin
com
ebe
fore
extr
aord
inar
yite
ms
(Com
pust
atan
nual
data
item
18).
Ow
ners
hip
data
are
from
1995
and
com
esfr
oman
nual
prox
yst
atem
ents
.Fin
anci
alda
taar
efr
om19
94an
dco
mes
from
Com
pust
atan
dC
RSP
.The
p-va
lues
are
for
eith
era
diff
eren
cein
the
mea
nste
stor
the
Wilc
oxon
rank
-sum
test
.
2450

Dividends and Corporate Shareholders
it apparently facilitates the investments. And the managers of the corporateblockholders apparently believe that this will be more beneficial for their firmsthan a policy of high dividends, lower taxes (at least on the dividends receivedby the corporate shareholders), but lower investments.24
Financial blockholders are different. Our priors were that these investorswould be more focused on the tradeoff between dividends and capital gainsbecause the ancillary considerations present with operating blockholders will beless important, if they are relevant at all. The unusual tax treatment of dividendsreceived by corporations should therefore push dividends to be higher. Yet firmswith financial blockholders have indistinguishable dividend policies from firmsthat have no corporate blockholders of any type (last column of Table 8).
We are able to rule out several possible explanations for this surprisingfinding. The explanation does not appear to rest with the tax rates of the financialblockholders, as they are somewhat higher than the operating blockholders’(35% versus 29%). Similarly, financial blockholders have corporate governanceratings than are indistinguishable from operating blockholders. The explanationalso does not seem to rest with investment opportunities. As noted in Table 8,capital expenditures at firms with financial blockholders are similar to what theyare at firms without corporate blockholders. Finally, the explanation does notrest with acquisitions of the firms, which would be one way for the blockholdersto receive cash tax free. Neither of the two financial blockholders in the block-trade sample subsequently acquired their firms. And among the 228 financialblockholders in the four years of the random sample, only four eventuallyacquired their firms.25
There are, however, some notable differences between financial and operat-ing blockholders that might offer insights into why dividends are not higher inthe presence of financial blockholders. We see in Table 9 that financial block-holders tend to hold considerably smaller fractional blocks than do operatingblockholders, and they are less likely to own the largest block in a firm. Further-more, although 69% of the operating blockholders have board representation,only 12% of the financial blockholders have such representation. To be sure,some of this difference can be attributed to the smaller fractional blocks ofthe financial investors. But when we conduct a probit regression that takes avalue of one if a blockholder has board representation and zero otherwise andwe control for the fractional size of the block, the rank ordering of the block,and Firm Size, the dummy variable for financial blockholders is negative andsignificant.26
24 A case in point from the block-trade sample involves A&P. Tengelmann Corporation bought 42% of the stockof A&P from the family of the company’s founder. Eventually, Tengelmann acquired majority control of thecompany and by numerous press accounts totally controlled A&P. Among its other actions, Tengelmann increasedthe number of specialty stores, centralized control, and moved the firm’s headquarters. Tengelmann also stoppedthe payment of dividends at A&P.
25 In contrast, 14 of the 139 operating blockholders eventually acquired their firms.
26 To cite one example of this tendency, in 1995 there are thirty-one instances in which the largest blockholder isa financial corporation. Yet only 26% of these blockholders have board representation. By comparison, 83% of
2451

The Review of Financial Studies / v 22 n 6 2009
Table 9
Comparisons of the block ownership and corporate activities of operating corporate blockholders versus fi-
nancial corporate blockholders (banks and insurance companies) at randomly selected public corporations
Operating Financial p-value ofblockholders blockholders difference
Block ownershipAverage 28% 10% <0.01Median 20% 8% <0.01
Position of block within firmLargest 59% 31%Second largest 24% 32%Other 17% 37%Average 1.7 2.4 <0.01Median 1 2 <0.01
Ownership of other blockholders in firmAverage 18% 24% 0.07Median 16% 22% 0.07
Blockholders with board representation 69% 12% <0.01
There are sixty-nine operating blockholders and ninety-eight financial blockholders. All blockholders own atleast 5% of the common stock. The p-values in the last column are for either a difference in the means test orWilcoxon rank-sum test. Data are from 1995 and come from annual proxy statements.
There is also evidence that financial blockholders hold their blocks for shorterperiods of time compared with operating blockholders. Thirty-seven of the1995 firms with corporate blockholders (of either type) have no corporateblockholders in the next sampling year of 1998. Thirty-three of these firms hadonly financial or only operating blockholders in 1995. Of these 33 firms, 26(79%) had financial blockholders but only 7 (21%) had operating blockholdersin 1995.
Our findings thus paint a consistent picture of financial blockholders whohave less voting power than do operating blockholders, and what voting powerthey do have they exercise less often. In addition, they hold their blocks forshorter times, which would make the tax consequences of dividend policy lessimportant. Finally, there is no evidence of a clientele effect as dividend policydoes not appear to be a factor in the decision of financial corporations to takelarge positions in other companies.
A full investigation of these findings is beyond the scope of this paper, butwe raise two avenues for future investigation. First, financial blockholders mayalso be debt holders. In this case, their involvement in management could causethem to lose priority in bankruptcy. Second, as Roe (1994) explains, much ofthe federal securities legislation of the 1930s was intended to stop financialinstitutions from influencing corporations. Although these restrictions havebeen loosened over the years, it is possible that financial institutions havenot yet developed the expertise or the inclination to influence major decisionsat public corporations. In any event, it will bear watching to see if financialinstitutions become more assertive over time with their rights as shareholders,in dividend policy as well as in other aspects of firm management.
the operating blockholders with a similarly positioned block have board representation; more than half of theseblockholders have multiple representatives.
2452

Dividends and Corporate Shareholders
5. Conclusion
The effect of taxes on firms’ dividend policies has been debated for many years.Corporate shareholders play a special role in this debate because they are theonly investors with a tax preference for dividends over capital gains. In thispaper, we investigate whether the special tax status of corporate shareholdersaffects either their investment decisions or the dividend decisions of the firmsin which they invest. Black (1976) dismissed the possibility that corporateshareholders would affect payout policy because he thought that corporateblock ownership was rare. Data we report in this paper show, to the contrary, thatcorporate block ownership is not rare; approximately one-third of all publiclytraded corporations have corporate blockholders.
The issue, thus, becomes an empirical one: are corporations attracted tohigh-dividend-paying firms, or do they attempt to influence dividend policyonce they purchase a block? We offer two sets of empirical investigations toanswer these questions, to test the tax-preference hypothesis. If the tax treatmentof dividends for dominant shareholders is a first-order consideration, dividendsshould increase after a corporation buys a large-percentage block of stock froman individual. We find this not to be the case. In most instances when such atrade occurs, dividend policy remains unchanged; when dividend policy doeschange, it is more likely to decrease than to increase. We also examine dividendpolicy at a representative sample of publicly traded corporations. This analysisconfirms the block-trade analysis. Corporate blockholders are more than twotimes as likely to be found in firms that pay no dividends as they are to be foundin firms that pay dividends. Similarly, two-thirds of firms that pay dividendshave no corporate blockholders. Equally telling is the fact that the ownershipof corporate blockholders is not clustered at the levels (20% and 80%) at whichthe tax benefits of cash dividends increase.
We also investigate why corporate blockholders do not push for higher div-idends to leverage their special tax status. Operating corporate blockholdersappear to be more interested in improving the target firms’ operating perfor-mance. To the extent these blockholders affect dividend policy, it apparentlyis to lower dividends. Corporate blockholders that are financial companies aredifferent. They are more passive than their operating brethren, and their choiceof where to invest does not appear to be influenced by a firm’s dividend policy.There is also no evidence that financial blockholders use their voting power toincrease dividends.
Although the findings reported in this paper are inconsistent with textbookdiscussions and theoretical models of the corporate tax preference for dividends,our findings are consistent with recent survey evidence on managers’ prioritiesfor setting dividend policy. Brav et al. (2005) report that top financial officersdo not consider the tax situation of large shareholders when setting dividendpolicy. Nor do they set dividend policy to attract large shareholders. Instead,firms focus on their operating decisions; dividend increases are considered only
2453
The Review of Financial Studies / v 22 n 6 2009
after investment and liquidity needs have been met. Although some researchersare skeptical of survey results, the empirical evidence in this paper confirmsthat taxes, at least in the context of corporate shareholders, do not have theinfluence on dividend policy that many over the years have assumed.
References
Agrawal, A., and N. Jayaraman. 1994. The Dividend Policies of All-Equity Firms: A Direct Test of the FreeCash Flow Theory. Managerial Decision Economics 15:139–48.
Allen, F., A. Bernardo, and I. Welch. 2000. A Theory of Dividends Based on Tax Clienteles. Journal of Finance55:2499–536.
Allen, F., and R. Michaely. 2003. Payout Policy, in George Constantinides, Milton Harris, and Rene Stulz (eds.),North-Holland Handbook of Economics. Amsterdam: Elsevier–North-Holland.
Allen, J., and G. Phillips. 2000. Corporate Equity Ownership, Operating Alliances and Product Market Relation-ships. Journal of Finance 55:2791–815.
Barclay, M., and C. Holderness. 1989. Private Benefits from Control of Public Corporations. Journal of FinancialEconomics 25:371–95.
Bebchuk, L., A. Cohen, and A. Ferrell. 2004. What Matters in Corporate Governance? Unpublished WorkingPaper, Harvard Law School, Cambridge, MA.
Binay, M. 2001. Do Dividend Clienteles Exist? Institutional Investor Reaction to Dividend Events. UnpublishedWorking Paper, University of Texas, Austin, TX.
Black, F. 1976. The Dividend Puzzle. Journal of Portfolio Management 3:5–8.
Brav, A., J. Graham, C. Harvey, and R. Michaely. 2005. Payout Policy in the 21st Century. Journal of FinancialEconomics 77:483–527.
Brav, A., and J. Heaton. 1998. Did ERISA’s Prudent Man Rule Change the Pricing of Dividend Omitting Firms?Unpublished Working Paper, Duke University, Durham, NC.
Brealey, R., S. Myers, and F. Allen. 2006. Principles of Corporate Finance, 8th ed., Irwin: McGraw-Hill.
Chetty, R., and E. Saez. 2005. Dividend Taxes and Corporate Behavior: Evidence from the 2003 Dividend TaxCut. Quarterly Journal of Economics 120:791–833.
Eckbo, E., and S. Verma. 1994. Managerial Share Ownership, Voting Power, and Corporate Dividends. Journalof Corporate Finance 1:33–62.
Elton, E., and M. Gruber. 1970. Marginal Stockholder Tax Rates and the Clientele Effect. Review of Economicsand Statistics 52:68–74.
Fama, E., and K. French. 2001. Disappearing Dividends: Changing Firm Characteristics or Lower Propensity toPay? Journal of Financial Economics 40:283–306.
Fee, C., C. Hadlock, and S. Thomas. 2006. Corporate Equity Ownership and the Governance of Product MarketRelationships. Journal of Finance 61:1217–51.
Field, L., and D. Sheehan. 2004. IPO Underpricing and Outside Blockholdings. Journal of Corporate Finance10:263–80.
Gompers, P., J. Ishii, and A. Metrick. 2003. Corporate Governance and Equity Prices. Quarterly Journal ofEconomics 118:107–55.
Graham, J. 1996a. Debt and the Marginal Tax Rate. Journal of Financial Economics 41:41–73.
Graham, J. 1996b. Proxies for the Corporate Marginal Tax Rate. Journal of Financial Economics 42:187–221.
2454

Dividends and Corporate Shareholders
Graham, J., and A. Kumar. 2006. Do Dividend Clienteles Exist? Evidence on Dividend Preferences of RetailInvestors. Journal of Finance 61:1305–36.
Grinstein, Y., and R. Michaely. 2005. Institutional Holdings and Payout Policy. Journal of Finance 60:1389–426.
Holderness, C., and D. Sheehan. 2000. Constraints on Large-Block Shareholders, in Randall A. Morck (ed.), Con-centrated Corporate Ownership (National Bureau of Economic Research). Chicago, IL: University of ChicagoPress.
Jagannathan, M., C. Stephens, and M. Weisbach. 2000. Financial Flexibility and the Choice between Dividendsand Stock Repurchases. Journal of Financial Economics 57:355–84.
Jensen, G., D. Solberg, and T. Zorn. 1992. Simultaneous Determination of Insider Ownership, Debt, and DividendPolicies. Journal of Financial and Quantitative Analysis 27:247–64.
Lintner, J. 1956. Distribution of Incomes of Corporations among Dividends, Retained Earnings, and Taxes.American Economic Review 46:97–113.
Litzenberger, R. and K. Ramaswamy. 1979. The Effect of Personal Taxes and Dividends on Capital Asset Prices:Theory and Empirical Evidence. Journal of Financial Economics 7:163–96.
Michaely, R., R. Thaler, and K. Womack. 1995. Price Reactions to Dividend Initiations and Omissions: Overre-action or Drift? Journal of Finance 50:573–608.
Mikkelson, W., and H. Regassa. 1991. Premiums Paid in Block Transactions. Managerial and Decision Eco-nomics 12:511–7.
Perez-Gonzalez, F. 2003. Large Shareholders and Dividends: Evidence from U.S. Tax Reforms. UnpublishedWorking Paper, Columbia University, New York.
Roe, M. 1994. Strong Managers Weak Owners: The Political Roots of American Corporate Finance. Princeton,NJ: Princeton University Press.
Ross, S., R. Westerfield, and J. Jaffe. 2005. Corporate Finance, 7th ed., Irwin: McGraw-Hill.
Scholz, J. 1992. A Direct Examination of the Dividend Clientele Hypothesis. Journal of Public Economics49:261–85.
Shleifer, A., and R. Vishny. 1986. Large Shareholders and Corporate Control. Journal of Political Economy94:461–88.
Stephens, C., and M. Weisbach. 1998. Actual Share Reacquisitions in Open Market Repurchases Programs.Journal of Finance 53:313–33.
2455