Embed Size (px)
Citation preview
Diving Into the Hudson Without Getting WetUsing Remotely Sensed Data in the Classroom
Steve Stanne, Hudson River Estuary Program/NYS Water Resources InstituteJean Valla McAvoy, Hudson River Research Reserve
Teaching the Hudson Valley Teacher Institute - July 28,2011
New York StateWater Resources InstituteNew York StateWater Resources Institute

1. Up to the minute information on specific parameters
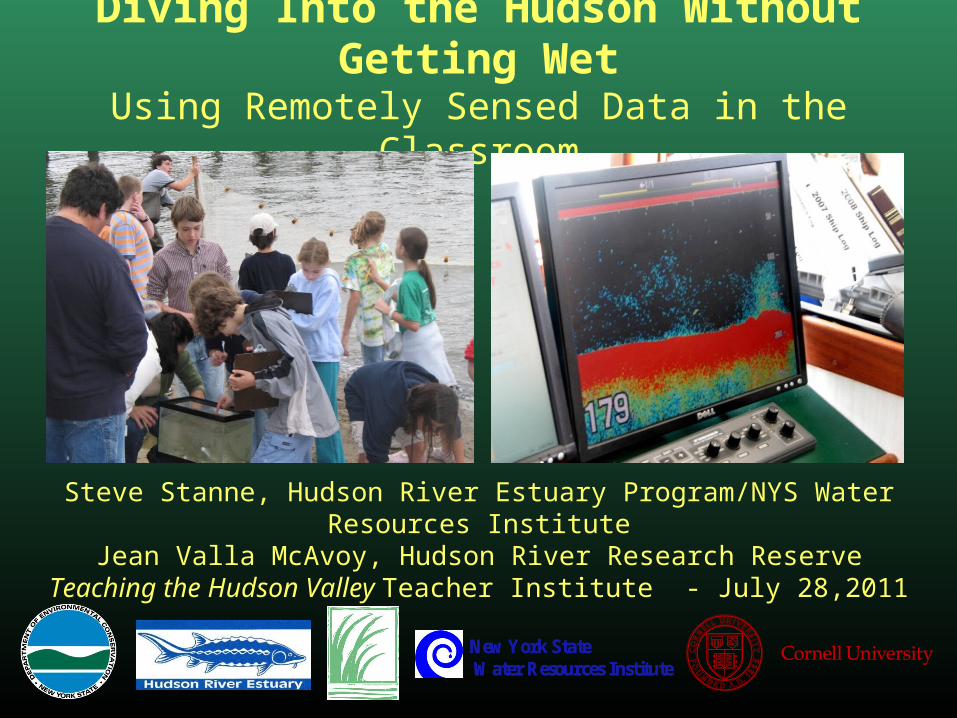
Remote sensingTaking the river’s vital signs from a distance
water temperature at Norrie Point July 24-27, 2011

2. Observe patterns/cycles
High and low tides at the George Washington Bridge; July 28 - 30, 2009
Remote sensingTaking the river’s vital signs from a distance

3. Show relationships between parameters or cycles
Tides vs salinity at George Washington Bridge; July 28 - 30, 2009
Remote sensingTaking the river’s vital signs from a distance
4. Collects data during short-term events or in inclement conditions when scientists may not be able to collect samples
Turbidity (muddiness) of the water at Schodack Island following heavy rains in early July, 2009
Remote sensingTaking the river’s vital signs from a distance

5. Create line graphs with website interfaces or download data to further customize graphs
Remote sensingTaking the river’s vital signs from a distance
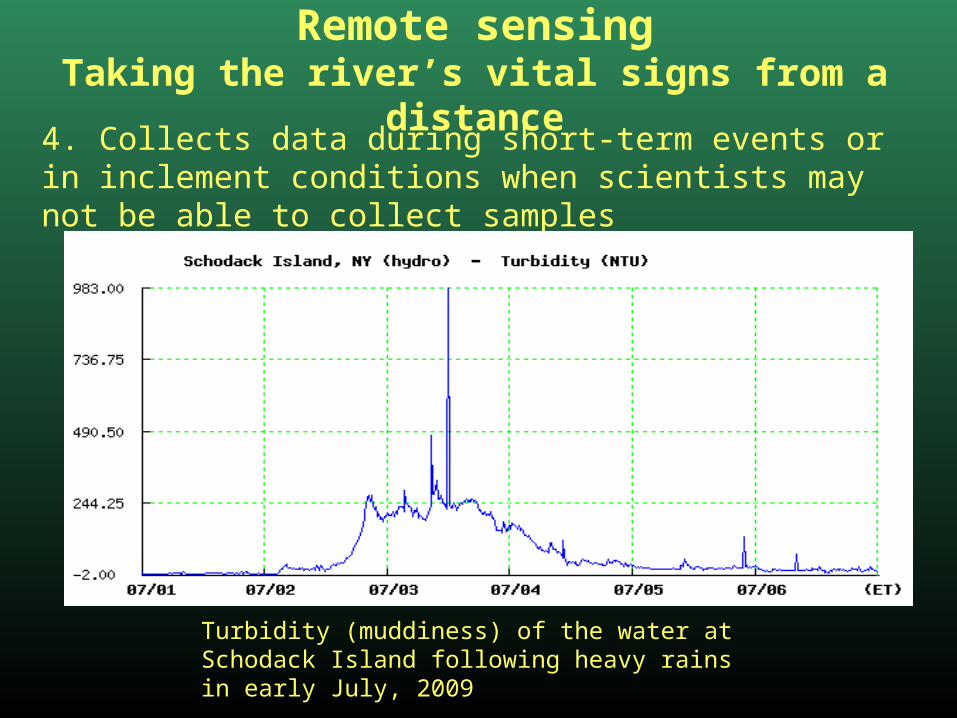
www.youtube.com/watch?v=z5aG5f-Rlaw Click to view video about HRECOS system
HRECOS Hudson River Environmental Conditions Observing System
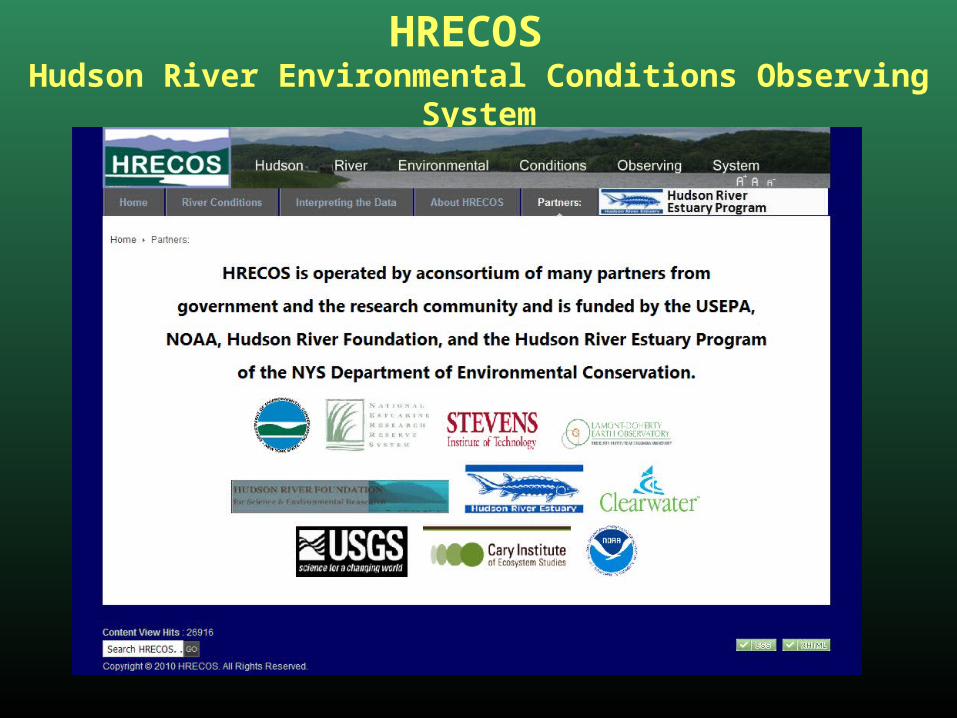
HRECOS Hudson River Environmental Conditions Observing System
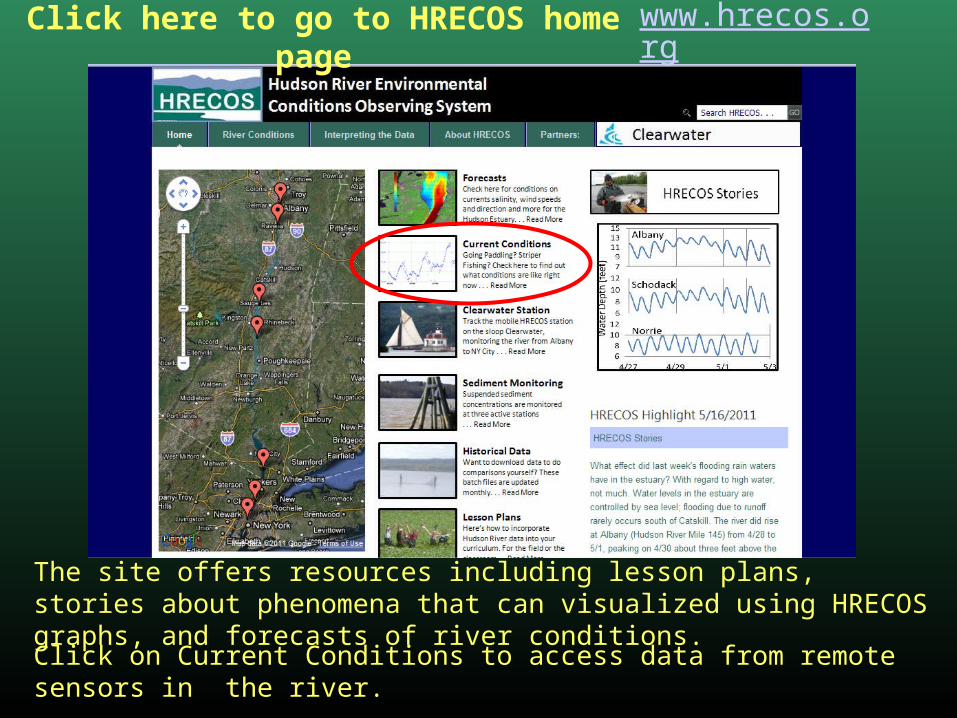
Click here to go to HRECOS home page www.hrecos.org
The site offers resources including lesson plans, stories about phenomena that can visualized using HRECOS graphs, and forecasts of river conditions. Click on Current Conditions to access data from remote sensors in the river.
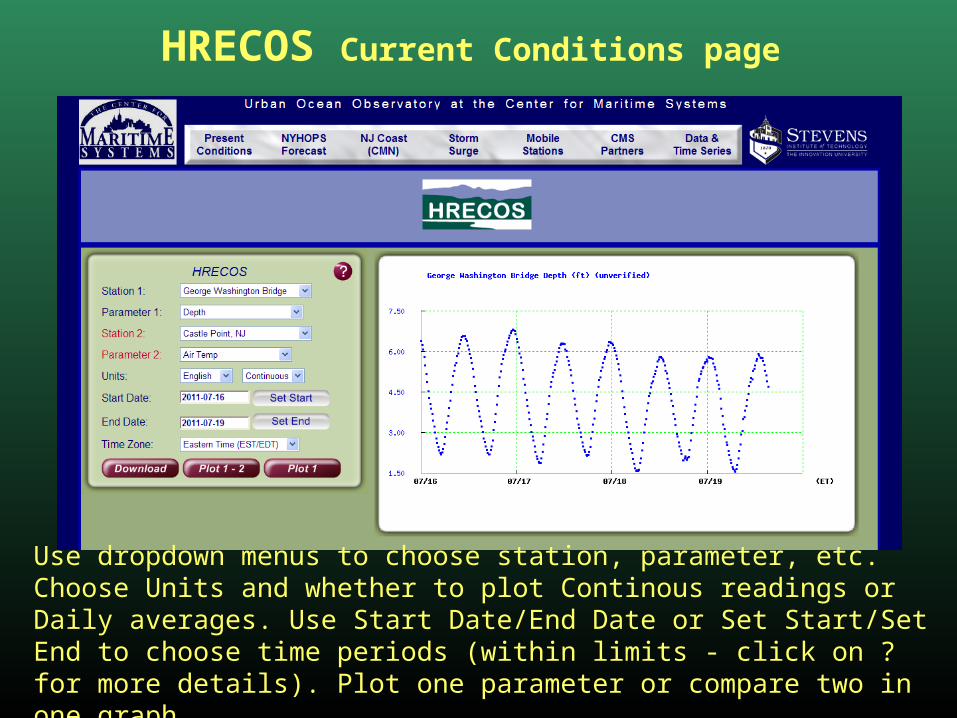
HRECOS Current Conditions page
Use dropdown menus to choose station, parameter, etc. Choose Units and whether to plot Continous readings or Daily averages. Use Start Date/End Date or Set Start/Set End to choose time periods (within limits - click on ? for more details). Plot one parameter or compare two in one graph.

For younger students just starting to learn about graphs, choose parameters that illustrate well-known phenomena:
Water temperature rising and falling over a 24 hour period from the cool of early morning to the heat of mid-afternoon to the cool of evening.
Water temperature rising and falling over several days. Why did temperatures not go as high on 7/18?
Link to sunlight (listed as total radiation in the list of meteorological parameters). It was cloudy on 7/18.

Water temperature rising and falling over the seasons through 2010-2011 school year (note that plot uses daily averages, not continuous readings).
On a sunny day, have students observe water temperature graph early in the school day and predict what it will look like later in the day.
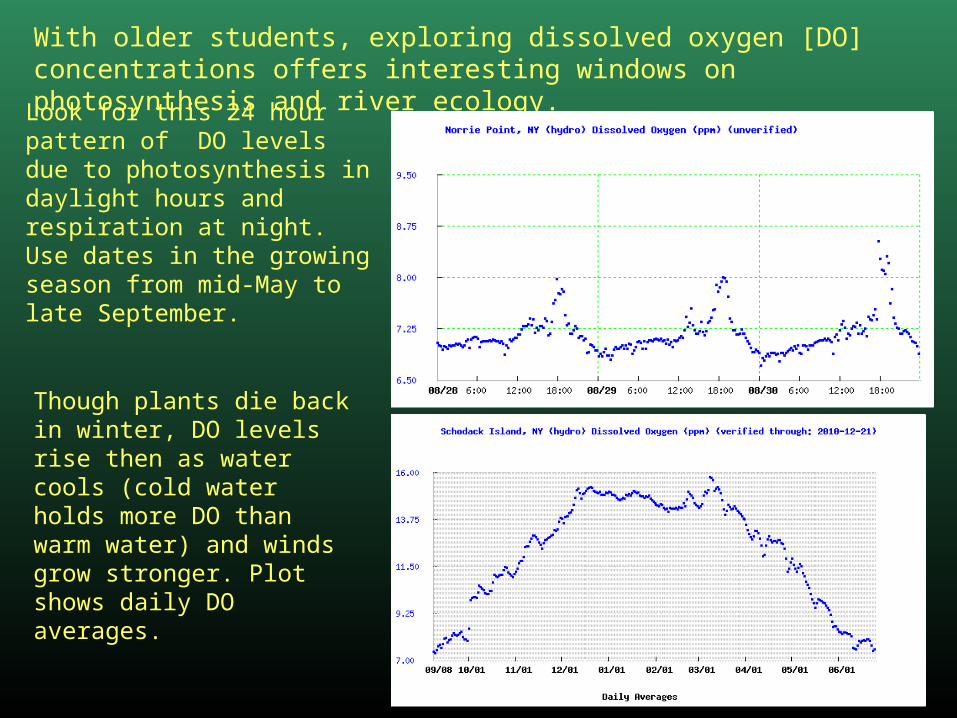
Look for this 24 hour pattern of DO levels due to photosynthesis in daylight hours and respiration at night. Use dates in the growing season from mid-May to late September.
With older students, exploring dissolved oxygen [DO] concentrations offers interesting windows on photosynthesis and river ecology.
Though plants die back in winter, DO levels rise then as water cools (cold water holds more DO than warm water) and winds grow stronger. Plot shows daily DO averages.

In the upper estuary (north of the Highlands) DO levels in the growing season reflect photosynthesis by rooted submerged aquatic vegetation [SAV]. Note impacts of cloudiness on 7/18/11.
In the lower estuary (south of the Highlands) DO levels are more likely to reflect photosynthesis by phytoplankton. There are occasional spikes in DO when phytoplankton blooms occur.

If you want to change the format of the graphs or have students draw graphs by hand, then use the Download button to download data displayed on a graph (single parameter graphs only) into an Excel data table.
Note: If students will plot their own graphs by hand, then choose Daily Average readings, as was done here for a DO peak due to a plankton bloom at the George Washington Bridge. Continuous data is overwhelming; four 15 minute data points every hour X 24 hours in a day equals 96 numbers!

Simplify downloaded data as desired.
Now have students plot their own graphs by hand …
Delete column B decimals, for example.
or select columns A & B, then choose Insert Column ... to display this graph.

Earth science students can study tidal cycles.
A pattern of two high and two low tides each day is typical of the Hudson estuary, as seen here for Norrie Point.
Tides travel all the way to Albany; the surface of the river is at sea level even there. How do tide events at Albany differ from the same tide events at Norrie?
A given tide event happens later in Albany than at Norrie, and is more extreme (highs are higher, lows lower).
Set up math problems with the graphs. How much higher is the first high tide of 7/31 when it reaches Albany than it was at Norrie? How much later is this event in Albany? What was the velocity of the tidal wave between Norrie and Albany?

http://ny.water.usgs.gov/projects/dialer_plots/saltfront.html Click this URL to visit the actual U.S. Geological Survey salt front website
Salinity, temperature, and tide data; also has links to stream level gauges on Hudson River tributaries. However, salt front locating function ceased in March, 2012 due to funding cuts.

NOAA: remotely sensed data from other estuaries
http://estuaries.gov/ScienceData/Home.aspx Click this URL to visit the actual NOAA data website

HRECOS Hudson River Environmental Conditions Observing SystemUse the graphs to tell stories, pose questions, solve mysteries. Create hypotheses and find evidence to support them. Here are some examples.
1. What causes brief spikes in turbidity at Schodack Island? Hint: the river here is a narrow shipping channel.
The propellers of ships and powerful tugs churn up mud, causing sudden peaks in turbidity at Schodack Island.

2a. At Albany at Hudson River Mile 140 (mile 0 is at the Battery in NYC), what caused the peak in water level 4/29/11 – 4/30/11?
• Did it affect the tide cycle?• Data for what other HRECOS parameter(s) might support your hypothesis?
Plotting a graph of rainfall (in mm) shows that runoff could have caused elevated water levels. Flooding occurred in the Adirondacks at this time. The high and low tide cycle is superimposed on the higher base level.
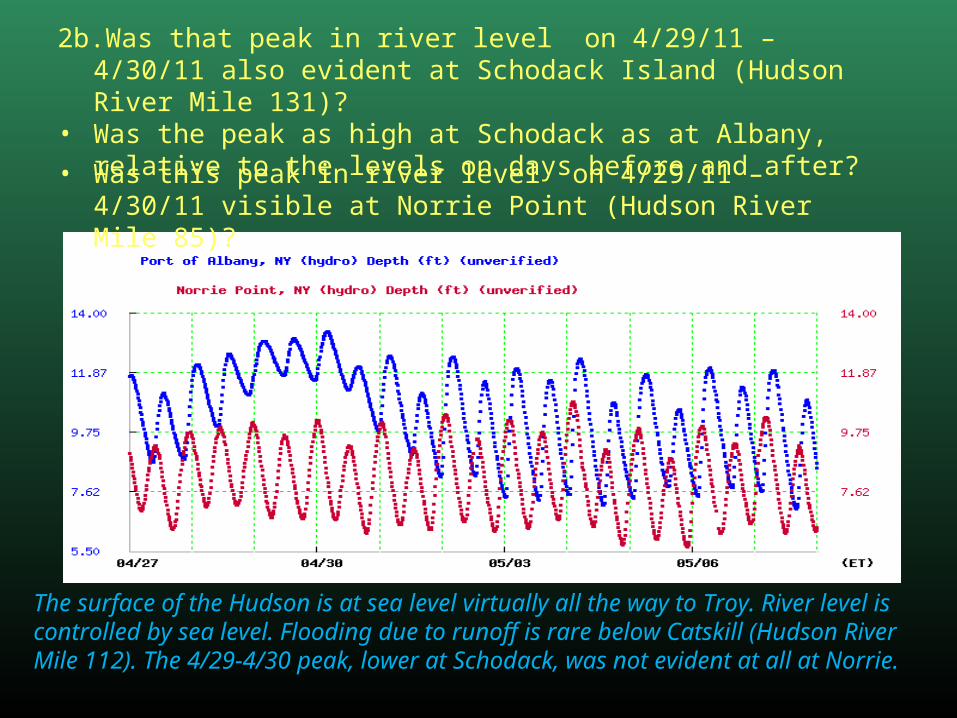
2b.Was that peak in river level on 4/29/11 – 4/30/11 also evident at Schodack Island (Hudson River Mile 131)?
• Was the peak as high at Schodack as at Albany, relative to the levels on days before and after?
• Was this peak in river level on 4/29/11 – 4/30/11 visible at Norrie Point (Hudson River Mile 85)?
The surface of the Hudson is at sea level virtually all the way to Troy. River level is controlled by sea level. Flooding due to runoff is rare below Catskill (Hudson River Mile 112). The 4/29-4/30 peak, lower at Schodack, was not evident at all at Norrie.
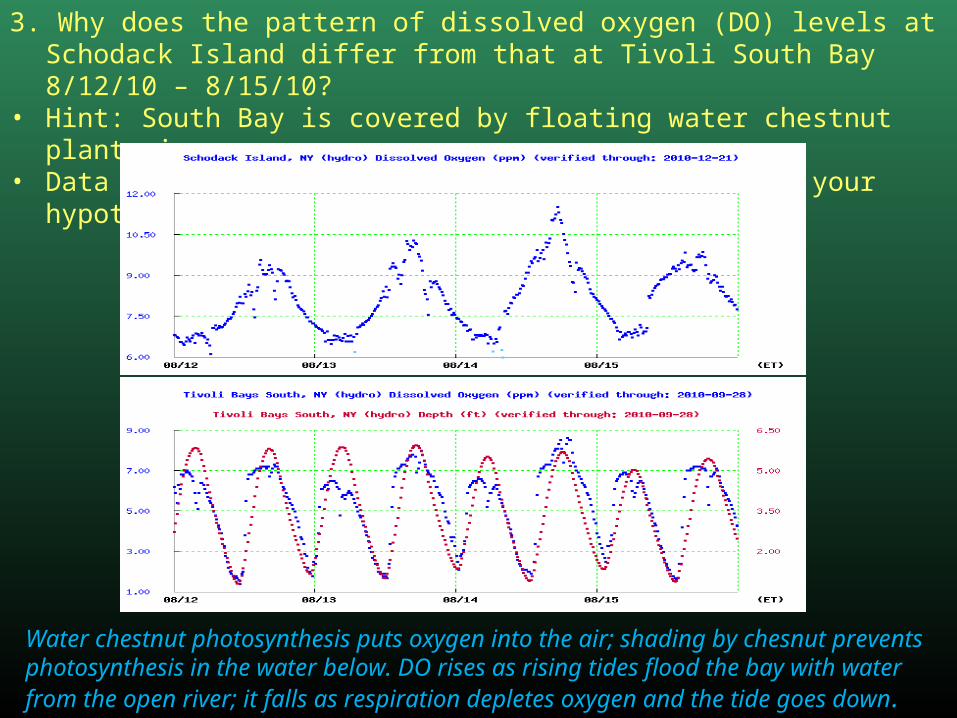
3. Why does the pattern of dissolved oxygen (DO) levels at Schodack Island differ from that at Tivoli South Bay 8/12/10 – 8/15/10?
• Hint: South Bay is covered by floating water chestnut plants in summer. • Data for what other parameter(s) might support your hypothesis?
Water chestnut photosynthesis puts oxygen into the air; shading by chesnut prevents photosynthesis in the water below. DO rises as rising tides flood the bay with water from the open river; it falls as respiration depletes oxygen and the tide goes down.

4. What accounts for the elevated water level at Norrie Point on 12/01/10?• Hint: Remember that water level in the estuary is controlled by sea level.• Data for what other parameter(s) might support your hypothesis?
Since river level at Norrie is controlled by sea level, surges in water level caused by coastal storms impact the Hudson. The wind direction/speed vector plot for Castle Point, NJ (the HRECOS site closest to the ocean) shows strong winds from the southeast due to a coastal storm passing on 12/01/10. (The arrows show wind direction as though the graph area were a compass dial; their vertical position indicates speed.) The peak in water level at Norrie was caused by storm surge.

5. What accounts for the depressed water level at Norrie Point on 12/28/10?• Hint: Remember that water level in the estuary is controlled by sea level.• Data for what other parameter(s) might support your hypothesis?
In this case, the wind direction/speed vector plot for Castle Point shows sustained strong northerly winds 12/26/10 – 12/27/10. These winds literally pushed ocean waters away from the coast, causing “blowout tides” there and along the Hudson.

6. ***A challenge for real Hudson River geeks:***• Salinity goes up as water temperature goes down at Castle Point,
Hoboken, from 7/03/11 – 7/31/11. What accounts for this pattern?
• The pattern is easier to see in a graph of daily averages instead of continuous readings. Note that the plots of salinity and temperature cross roughly every seven days.

Hint : Can you think of a cycle affecting the river in which a seven day interval plays a role?The cycle of spring tides (greatest tidal range-higher highs/lower lows) and neap tides (least tidal range-lower highs/higher lows) is tied to the moon’s phases and relative positions of moon, sun, and earth over a 28 (7 X 4) day period.
The graph is fairly “noisy,” but it shows the approximate times of spring tides (indicated by this arrow ) and neap tides (indicated by this arrow ).

This graph plots salinity against the lunar tidal cycle. At what points in the cycle is salinity highest?
This graph plots temperature against the lunar tidal cycle. When in the cycle is temperature lowest?
Salinity peaks at times of spring tides.
Temperature is lowest at times of spring tides.

Tidal currents are strongest during spring tides. They mix the layers, making water near the surface saltier and cooler. During neap tides, stratification is more pronounced, so water near the surface is fresher and warmer.
Graphic copyright www.chemgapedia.de
The last piece of the puzzle involves currents and their effect on stratification - layering of water masses – in the estuary. The lower Hudson is a partially mixed estuary. Denser, saltier (and colder) water layers underneath fresher (and warmer) water at the surface.
For more information, contact
Steve Stanne, Education Coordinator Hudson River Estuary Program / NYSDEC in cooperation with the NYS Water Resources Institute/Cornell University21 South Putt Corners RoadNew Paltz, NY 12561845 [email protected]
New York StateWater Resources InstituteNew York StateWater Resources Institute