Embed Size (px)
Citation preview

REPUBLIC OF SOUTH AFRICA
DIVISION OF REVENUE SECONDAMENDMENT BILL
(As introduced in the National Assembly (proposed section 76); explanatory summary of Bill and prior noticeof its introduction published in Government Gazette No. 43824 of 21 October 2020)
(The English text is the offıcial text of the Bill)
(MINISTER OF FINANCE)
[B 24—2020] ISBN 978-1-4850-0667-1
No. of copies printed .........................................350
BILLTo amend the Division of Revenue Act, 2020, as amended by the Division ofRevenue Amendment Act, 2020, in accordance with the Money Bills and RelatedMatters Act, 2009; and to provide for matters connected therewith.
PREAMBLE
WHEREAS section 214(1) of the Constitution of the Republic of South Africa, 1996,requires an Act of Parliament to provide for—
(a) the equitable division of revenue raised nationally among the national,provincial and local spheres of government;
(b) the determination of each province’s equitable share of the provincial share ofthat revenue; and
(c) any other allocations to provinces, local government or municipalities fromthe national government’s share of that revenue, and any conditions on whichthose allocations may be made;
WHEREAS the Division of Revenue Act, 2020 (Act No. 4 of 2020), as amended by theDivision of Revenue Amendment Act, 2020 (Act No. 10 of 2020), gives effect to section214(1) of the Constitution in respect of the 2020/21 financial year;
AND WHEREAS section 12(4) of the Money Bills and Related Matters Act, 2009 (ActNo. 9 of 2009), requires the Minister of Finance to table a Division of RevenueAmendment Bill with a revised fiscal framework if the adjustments budget effectschanges to the Division of Revenue Act for the relevant year,
B E IT THEREFORE ENACTED by the Parliament of the Republic of South Africa,as follows:—
Substitution of Column A of Schedules 1 and 2, Parts A and B of Schedule 4, PartsA and B of Schedule 5, Parts A and B of Schedule 6 and Part A of Schedule 7 to Act4 of 2020, as amended by section 2 of Act 10 of 2020
1. (1) Column A of Schedule 1 to this Act is hereby substituted for Column A ofSchedule 1 to the Division of Revenue Act, 2020 (hereinafter referred to as the principalAct), setting out the equitable division of revenue raised nationally among the national,provincial and local spheres of government for the 2020/21 financial year.
(2) Column A of Schedule 2 to this Act is hereby substituted for Column A ofSchedule 2 to the principal Act, setting out the determination of each provincial sphere’sequitable share of the provincial sphere’s share of revenue raised nationally for the2020/21 financial year.
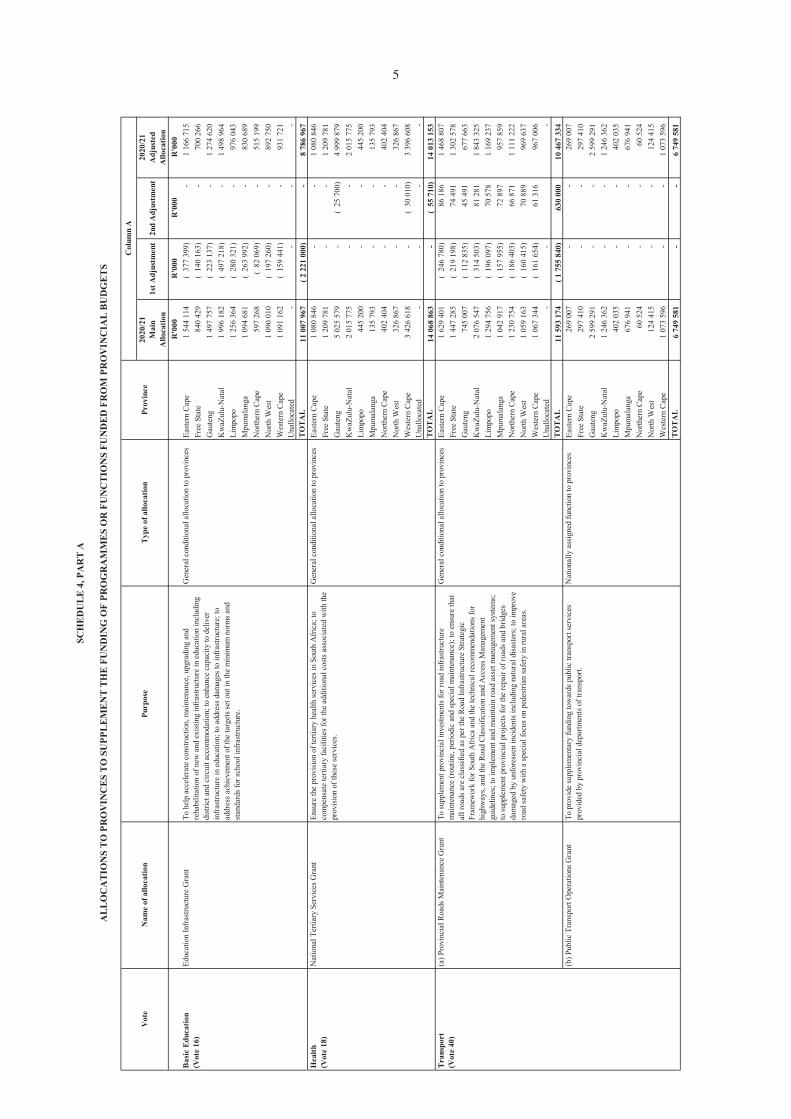
(3) Column A of Part A of Schedule 4 to this Act is hereby substituted for Column Aof Part A of Schedule 4 to the principal Act, specifying allocations to provinces tosupplement the funding of programmes or functions from provincial budgets for the2020/21 financial year.
5
10
15

(4) Column A of Part B of Schedule 4 to this Act is hereby substituted for Column Aof Part B of Schedule 4 to the principal Act, specifying allocations to municipalities tosupplement the funding of programmes or functions from municipal budgets for the2020/21 financial year.
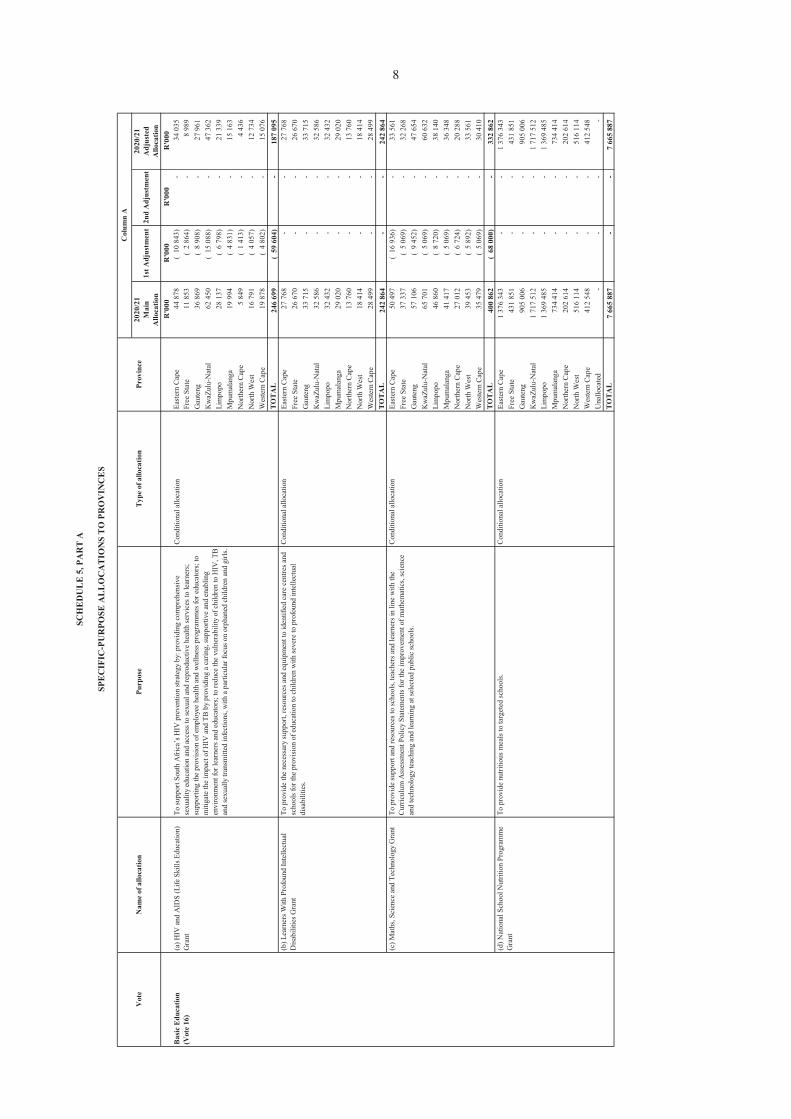
(5) Column A of Part A of Schedule 5 to this Act is hereby substituted for Column Aof Part A of Schedule 5 to the principal Act, specifying the specific-purpose allocationsto provinces for the 2020/21 financial year.
(6) Column A of Part B of Schedule 5 to this Act is hereby substituted for Column Aof Part B of Schedule 5 to the principal Act, specifying the specific-purpose allocationsto municipalities for the 2020/21 financial year.
(7) Column A of Part A of Schedule 6 to this Act is hereby substituted for Column Aof Part A of Schedule 6 to the principal Act, specifying the allocations-in-kind toprovinces for designated special programmes for the 2020/21 financial year.
(8) Column A of Part B of Schedule 6 to this Act is hereby substituted for Column Aof Part B of Schedule 6 to the principal Act, specifying the allocations-in-kind tomunicipalities for designated special programmes for the 2020/21 financial year.
(9) Column A of Part A of Schedule 7 to this Act is hereby substituted for Column Aof Part A of Schedule 7 to the principal Act, specifying the unallocated provisions forprovinces for disaster response for the 2020/21 financial year.
Short title
2. This Act is called the Division of Revenue Second Amendment Act, 2020.
3
5
10
15
20

SCHEDULE 1
R'000 R'000 R'000 R'000National1,2 1 152 839 556 32 180 670 14 337 867 1 199 358 093 Provincial 538 471 528 - ( 17 754 507) 520 717 021 Local 74 683 326 11 000 000 - 85 683 326 TOTAL 1 765 994 410 43 180 670 ( 3 416 640) 1 805 758 440 1. National share includes conditional allocations to provincial and local spheres, general fuel1. levy sharing with metropolitan municipalities, debt-service costs, the contingency reserve1. and provisional allocations2. The direct charges for the provincial equitable share are netted out
SCHEDULE 2
R'000 R'000 R'000 R'000Eastern Cape 71 415 216 - ( 2 219 963) 69 195 253 Free State 30 017 344 - ( 1 083 268) 28 934 076 Gauteng 112 117 907 - ( 3 807 791) 108 310 116 KwaZulu-Natal 111 441 977 - ( 3 834 410) 107 607 567 Limpopo 62 328 931 - ( 2 029 942) 60 298 989 Mpumalanga 44 104 988 - ( 1 467 683) 42 637 305 Northern Cape 14 289 699 - ( 540 495) 13 749 204 North West 37 547 835 - ( 1 240 424) 36 307 411 Western Cape 55 207 631 - ( 1 530 531) 53 677 100 Unallocated - TOTAL 538 471 528 - ( 17 754 507) 520 717 021
EQUITABLE DIVISION OF REVENUE RAISED NATIONALLY AMONG THE THREE SPHERES OF GOVERNMENT
DETERMINATION OF EACH PROVINCE'S EQUITABLE SHARE OF THE PROVINCIAL SPHERE'S SHARE OF REVENUE RAISED NATIONALLY
(as a direct charge against the National Revenue Fund)
Province
Spheres of Government 2020/21Main
Allocation
2020/21Main Allocation
Column A
1st Adjustment2020/21
Adjusted Allocation
Column A
1st Adjustment2020/21
Adjusted Allocation
2nd Adjustment
2nd Adjustment
4
SCH
ED
UL
E 4
, PA
RT
A
AL
LO
CA
TIO
NS
TO
PR
OV
INC
ES
TO
SU
PPL
EM
EN
T T
HE
FU
ND
ING
OF
PRO
GR
AM
MES
OR
FU
NC
TIO
NS
FUN
DE
D F
RO
M P
RO
VIN
CIA
L B
UD
GE
TS
R'0
00R
'000
R'0
00R
'000
East
ern
Cap
e 1
544
114
(
377
399)
-
1
166
715
Fr
ee S
tate
840
429
(
140
163)
-
7
00 2
66
Gau
teng
1 4
97 7
57
( 22
3 13
7)
-
1 2
74 6
20
Kw
aZul
u-N
atal
1 9
96 1
82
( 49
7 21
8)
-
1 4
98 9
64
Lim
popo
1 2
56 3
64
( 28
0 32
1)
-
976
043
M
pum
alan
ga 1
094
681
(
263
992)
-
8
30 6
89
Nor
ther
n C
ape
597
268
(
82 0
69)
-
515
199
N
orth
Wes
t 1
090
010
(
197
260)
-
8
92 7
50
Wes
tern
Cap
e 1
091
162
(
159
441)
-
9
31 7
21
Una
lloca
ted
-
-
-
-
TOTA
L 1
1 00
7 96
7
( 2 2
21 0
00)
-
8 7
86 9
67
Nat
iona
l Ter
tiary
Ser
vice
s Gra
ntEa
ster
n C
ape
1 0
80 8
46
-
-
1 0
80 8
46
Free
Sta
te 1
209
781
-
-
1
209
781
G
aute
ng 5
025
579
-
(
25 7
00)
4 9
99 8
79
Kw
aZul
u-N
atal
2 0
15 7
75
-
-
2 0
15 7
75
Lim
popo
445
200
-
-
4
45 2
00
Mpu
mal
anga
135
793
-
-
1
35 7
93
Nor
ther
n C
ape
402
404
-
-
4
02 4
04
Nor
th W
est
326
867
-
-
3
26 8
67
Wes
tern
Cap
e 3
426
618
-
(
30 0
10)
3 3
96 6
08
Una
lloca
ted
-
-
-
-
TOTA
L 1
4 06
8 86
3
-
( 55
710
) 1
4 01
3 15
3
(a) P
rovi
ncia
l Roa
ds M
aint
enan
ce G
rant
East
ern
Cap
e 1
629
401
(
246
780)
8
6 18
6
1 4
68 8
07
Free
Sta
te 1
447
285
(
219
198)
7
4 49
1
1 3
02 5
78
Gau
teng
745
007
(
112
835)
4
5 49
1
677
663
K
waZ
ulu-
Nat
al 2
076
547
(
314
503)
8
1 28
1
1 8
43 3
25
Lim
popo
1 2
94 7
56
( 19
6 09
7)
70
578
1
169
237
M
pum
alan
ga 1
042
917
(
157
955)
7
2 89
7
957
859
N
orth
ern
Cap
e 1
230
754
(
186
403)
6
6 87
1
1 1
11 2
22
Nor
th W
est
1 0
59 1
63
( 16
0 41
5)
70
889
9
69 6
37
Wes
tern
Cap
e 1
067
344
(
161
654)
6
1 31
6
967
006
U
nallo
cate
d-
-
-
TO
TAL
11
593
174
( 1
755
840
) 6
30 0
00
10
467
334
Ea
ster
n C
ape
269
007
-
-
2
69 0
07
Free
Sta
te 2
97 4
10
-
-
297
410
G
aute
ng 2
599
291
-
-
2
599
291
K
waZ
ulu-
Nat
al 1
246
362
-
-
1
246
362
Li
mpo
po 4
02 0
35
-
-
402
035
M
pum
alan
ga 6
76 9
41
-
-
676
941
N
orth
ern
Cap
e 6
0 52
4
-
-
60
524
N
orth
Wes
t 1
24 4
15
-
-
124
415
W
este
rn C
ape
1 0
73 5
96
-
-
1 0
73 5
96
TOTA
L 6
749
581
-
-
6
749
581
Col
umn
A
1st A
djus
tmen
t20
20/2
1A
djus
ted
Allo
catio
n
Ensu
re th
e pr
ovis
ion
of te
rtiar
y he
alth
serv
ices
in S
outh
Afr
ica;
to
com
pens
ate
terti
ary
faci
litie
s for
the
addi
tiona
l cos
ts a
ssoc
iate
d w
ith th
e pr
ovis
ion
of th
ese
serv
ices
.
Gen
eral
con
ditio
nal a
lloca
tion
to p
rovi
nces
To su
pple
men
t pro
vinc
ial i
nves
tmen
ts fo
r roa
d in
fras
truct
ure
mai
nten
ance
(rou
tine,
per
iodi
c an
d sp
ecia
l mai
nten
ance
); to
ens
ure
that
al
l roa
ds a
re c
lass
ified
as p
er th
e R
oad
Infr
astru
ctur
e St
rate
gic
Fram
ewor
k fo
r Sou
th A
fric
a an
d th
e te
chni
cal r
ecom
men
datio
ns fo
r hi
ghw
ays,
and
the
Roa
d C
lass
ifica
tion
and
Acc
ess M
anag
emen
t gu
idel
ines
; to
impl
emen
t and
mai
ntai
n ro
ad a
sset
man
agem
ent s
yste
ms;
to
supp
lem
ent p
rovi
ncia
l pro
ject
s for
the
repa
ir of
road
s and
brid
ges
dam
aged
by
unfo
rese
en in
cide
nts i
nclu
ding
nat
ural
dis
aste
rs; t
o im
prov
e ro
ad sa
fety
with
a sp
ecia
l foc
us o
n pe
dest
rian
safe
ty in
rura
l are
as.
Gen
eral
con
ditio
nal a
lloca
tion
to p
rovi
nces
(b) P
ublic
Tra
nspo
rt O
pera
tions
Gra
ntTo
pro
vide
supp
lem
enta
ry fu
ndin
g to
war
ds p
ublic
tran
spor
t ser
vice
s pr
ovid
ed b
y pr
ovin
cial
dep
artm
ents
of t
rans
port.
2nd
Adj
ustm
ent
Prov
ince
2020
/21
Mai
nA
lloca
tion
Nat
iona
lly a
ssig
ned
func
tion
to p
rovi
nces
Vot
eN
ame
of a
lloca
tion
Purp
ose
Type
of a
lloca
tion
To h
elp
acce
lera
te c
onst
ruct
ion,
mai
nten
ance
, upg
radi
ng a
nd
reha
bilit
atio
n of
new
and
exi
stin
g in
fras
truct
ure
in e
duca
tion
incl
udin
g di
stric
t and
circ
uit a
ccom
mod
atio
n; to
enh
ance
cap
acity
to d
eliv
er
infr
astru
ctur
e in
edu
catio
n; to
add
ress
dam
ages
to in
fras
truct
ure;
to
addr
ess a
chie
vem
ent o
f the
targ
ets s
et o
ut in
the
min
imum
nor
ms a
nd
stan
dard
s for
scho
ol in
fras
truct
ure.
Gen
eral
con
ditio
nal a
lloca
tion
to p
rovi
nces
Educ
atio
n In
fras
truct
ure
Gra
ntB
asic
Edu
catio
n(V
ote
16)
Hea
lth(V
ote
18)
Tran
spor
t(V
ote
40)
Tran
spor
t(V
ote
40)
5

SCH
ED
UL
E 4
, PA
RT
B
AL
LO
CA
TIO
NS
TO
MU
NIC
IPA
LIT
IES
TO
SU
PPL
EM
EN
T T
HE
FU
ND
ING
OF
FUN
CT
ION
S FU
ND
ED
FR
OM
MU
NIC
IPA
L B
UD
GE
TS
1R
'000
R'0
00R
'000
R'0
00B
uffa
lo C
ity 7
61 3
54
( 74
233
) -
6
87 1
21
City
of C
ape
Tow
n 1
481
604
(
144
459)
-
1
337
145
C
ity o
f Eku
rhul
eni
1 9
67 5
05
( 19
1 83
5)
-
1 7
75 6
70
City
of J
ohan
nesb
urg
1 8
48 2
87
( 18
0 21
1)
-
1 6
68 0
76
City
of T
shw
ane
1 6
02 1
61
( 15
6 21
3)
-
1 4
45 9
48
eThe
kwin
i 1
962
647
(
191
361)
-
1
771
286
M
anga
ung
754
593
(
73 5
74)
-
681
019
N
elso
n M
ande
la B
ay 9
03 7
20
( 88
114
) 3
90 2
74
1 2
05 8
80
TOTA
L 1
1 28
1 87
1
( 1 1
00 0
00)
390
274
1
0 57
2 14
5
Buf
falo
City
8 3
17
-
( 9
9)
8 2
18
City
of C
ape
Tow
n 6
5 94
4
-
( 7
84)
65
160
C
ity o
f Eku
rhul
eni
53
577
-
(
637
) 5
2 94
0
City
of J
ohan
nesb
urg
74
754
-
(
889
) 7
3 86
5
City
of T
shw
ane
51
512
-
(
613
) 5
0 89
9
eThe
kwin
i 4
6 46
4
-
( 5
53)
45
911
M
anga
ung
6 4
50
-
( 7
7)
6 3
73
Nel
son
Man
dela
Bay
10
481
-
(
125
) 1
0 35
6
TOTA
L 3
17 4
99
-
( 3
777)
3
13 7
22
Inte
grat
ed C
ity D
evel
opm
ent G
rant
To p
rovi
de a
fina
ncia
l inc
entiv
e fo
r met
ropo
litan
mun
icip
aliti
es to
ach
ieve
a m
ore
com
pact
urb
an sp
atia
l for
m
thro
ugh
inte
grat
ing
and
focu
ssin
g th
eir u
se o
f ava
ilabl
e in
fras
truct
ure
inve
stm
ent a
nd re
gula
tory
inst
rum
ents
; to
supp
ort m
etro
polit
an m
unic
ipal
ities
to d
evel
op a
pip
elin
e of
inve
stm
ent r
eady
cap
ital p
rogr
amm
es a
nd
proj
ects
thro
ugh
esta
blis
hing
and
inst
itutio
nalis
ing
an e
ffect
ive
and
effic
ient
syst
em o
f pro
gram
me
and
proj
ect
prep
arat
ion.
2020
/21
Mai
nA
lloca
tion
Hum
an S
ettle
men
ts(V
ote
33)
Nat
iona
l Tre
asur
y(V
ote
8)
Urb
an S
ettle
men
ts D
evel
opm
ent G
rant
Purp
ose
To su
pple
men
t the
cap
ital r
even
ues o
f met
ropo
litan
mun
icip
aliti
es in
ord
er to
impl
emen
t inf
rast
ruct
ure
proj
ects
that
pro
mot
e eq
uita
ble,
inte
grat
ed, p
rodu
ctiv
e, in
clus
ive
and
sust
aina
ble
urba
n de
velo
pmen
t; to
pr
ovid
e fu
ndin
g to
faci
litat
e a
prog
ram
mat
ic, i
nclu
sive
and
mun
icip
ality
-wid
e ap
proa
ch to
upg
radi
ng in
form
al
settl
emen
ts.
Vot
eN
ame
of a
lloca
tion
City
Col
umn
A
1st A
djus
tmen
t20
20/2
1A
djus
ted
Allo
catio
n2n
d A
djus
tmen
t
6

SCH
ED
UL
E 5
, PA
RT
A
SPE
CIF
IC-P
UR
POSE
AL
LO
CA
TIO
NS
TO
PR
OV
INC
ES
R'0
00R
'000
R'0
00R
'000
East
ern
Cap
e 2
39 8
38
( 59
696
) (
2 30
6)
177
836
Fr
ee S
tate
176
167
(
32 7
93)
( 1
629)
1
41 7
45
Gau
teng
100
108
(
17 4
62)
( 9
11)
81
735
K
waZ
ulu-
Nat
al 2
06 4
46
( 43
351
) (
2 00
9)
161
086
Li
mpo
po 2
33 5
58
( 59
060
) (
2 24
4)
172
254
M
pum
alan
ga 1
57 3
03
( 24
904
) (
1 41
7)
130
982
N
orth
ern
Cap
e 1
22 9
44
( 22
664
) (
1 14
0)
99
140
N
orth
Wes
t 1
74 2
71
( 36
019
) (
1 63
6)
136
616
W
este
rn C
ape
111
555
(
21 2
12)
( 1
042)
8
9 30
1
TOT
AL
1 5
22 1
90
( 31
7 16
1)
( 14
334
) 1
190
695
Ea
ster
n C
ape
67
955
(
16 9
89)
( 6
06)
50
360
Fr
ee S
tate
68
442
(
17 1
11)
( 6
11)
50
720
G
aute
ng 3
0 92
8
( 5
219)
(
306
) 2
5 40
3
Kw
aZul
u-N
atal
73
233
(
18 3
07)
( 6
53)
54
273
Li
mpo
po 7
0 48
0
( 17
620
) (
629
) 5
2 23
1
Mpu
mal
anga
57
374
(
10 3
27)
( 5
60)
46
487
N
orth
ern
Cap
e 6
2 61
5
( 11
271
) (
611
) 5
0 73
3
Nor
th W
est
67
324
(
14 8
11)
( 6
25)
51
888
W
este
rn C
ape
50
464
(
9 08
4)
( 4
92)
40
888
TO
TA
L 5
48 8
15
( 12
0 73
9)
( 5
093)
4
22 9
83
East
ern
Cap
e 1
2 37
1
-
(
147
) 1
2 22
4
Free
Sta
te 8
378
-
( 1
00)
8 2
78
Gau
teng
4 7
87
-
(
57)
4
730
K
waZ
ulu-
Nat
al 1
2 70
1
-
(
151
) 1
2 55
0
Lim
popo
12
970
-
( 1
54)
12
816
M
pum
alan
ga 1
0 04
4
-
(
119
) 9
925
N
orth
ern
Cap
e 7
615
-
( 9
1)
7 5
24
Nor
th W
est
8 5
08
-
(
101
) 8
407
W
este
rn C
ape
5 0
45
-
(
60)
4
985
TO
TA
L 8
2 41
9
-
(
980
) 8
1 43
9
2nd
Adj
ustm
ent
Col
umn
A
1st A
djus
tmen
t20
20/2
1A
djus
ted
Allo
catio
n
(a) C
ompr
ehen
sive
Agr
icul
tura
l Sup
port
Prog
ram
me
Gra
ntTo
pro
vide
effe
ctiv
e ag
ricul
tura
l sup
port
serv
ices
, pro
mot
e an
d fa
cilit
ate
agric
ultu
ral
deve
lopm
ent b
y ta
rget
ing
bene
ficia
ries o
f lan
d re
form
, res
titut
ion
and
redi
strib
utio
n, a
nd
othe
r bla
ck p
rodu
cers
who
hav
e ac
quire
d la
nd th
roug
h pr
ivat
e m
eans
and
are
eng
aged
in
valu
e-ad
ding
ent
erpr
ises
dom
estic
ally
, or i
nvol
ved
in e
xpor
t; to
revi
talis
e ag
ricul
tura
l co
llege
s int
o ce
ntre
s of e
xcel
lenc
e.
Con
ditio
nal a
lloca
tion
(b) I
lima/
Letse
ma
Proj
ects
Gra
ntTo
ass
ist v
ulne
rabl
e So
uth
Afri
can
farm
ing
com
mun
ities
to a
chie
ve a
n in
crea
se in
ag
ricul
tura
l pro
duct
ion
and
inve
st in
infra
struc
ture
that
unl
ocks
agr
icul
tura
l pro
duct
ion
with
in st
rate
gica
lly id
entif
ied
grai
n, li
vesto
ck, h
ortic
ultu
re a
nd a
quac
ultu
re p
rodu
ctio
n ar
eas.
Con
ditio
nal a
lloca
tion
(c) L
and
Care
Pro
gram
me
Gra
nt: P
over
ty
Relie
f and
Infra
struc
ture
Dev
elop
men
tTo
pro
mot
e su
stai
nabl
e us
e an
d m
anag
emen
t of n
atur
al re
sour
ces b
y en
gagi
ng in
co
mm
unity
bas
ed in
itiat
ives
that
supp
ort t
he p
illar
s of s
usta
inab
ility
(soc
ial,
econ
omic
and
en
viro
nmen
tal),
lead
ing
to g
reat
er p
rodu
ctiv
ity, f
ood
secu
rity,
job
crea
tion
and
bette
r wel
l-be
ing
for a
ll.
Con
ditio
nal a
lloca
tion
Vot
eN
ame
of a
lloca
tion
Purp
ose
Type
of a
lloca
tion
Prov
ince
2020
/21
Mai
nA
lloca
tion
Agr
icul
ture
, Lan
d R
efor
m
and
Rur
al D
evel
opm
ent
(Vot
e 29
)
Agr
icul
ture
, Lan
d R
efor
m
and
Rur
al D
evel
opm
ent
(Vot
e 29
)
Agr
icul
ture
, Lan
d R
efor
m
and
Rur
al D
evel
opm
ent
(Vot
e 29
)
7
SCH
ED
UL
E 5
, PA
RT
A
SPE
CIF
IC-P
UR
POSE
AL
LO
CA
TIO
NS
TO
PR
OV
INC
ES
R'0
00R
'000
R'0
00R
'000
2nd
Adj
ustm
ent
Col
umn
A
1st A
djus
tmen
t20
20/2
1A
djus
ted
Allo
catio
n
Vot
eN
ame
of a
lloca
tion
Purp
ose
Type
of a
lloca
tion
Prov
ince
2020
/21
Mai
nA
lloca
tion
East
ern
Cap
e 4
4 87
8
( 10
843
) -
34
035
Fr
ee S
tate
11
853
(
2 86
4)
-
8
989
G
aute
ng 3
6 86
9
( 8
908)
-
27
961
K
waZ
ulu-
Nat
al 6
2 45
0
( 15
088
) -
47
362
Li
mpo
po 2
8 13
7
( 6
798)
-
21
339
M
pum
alan
ga 1
9 99
4
( 4
831)
-
15
163
N
orth
ern
Cap
e 5
849
(
1 41
3)
-
4
436
N
orth
Wes
t 1
6 79
1
( 4
057)
-
12
734
W
este
rn C
ape
19
878
(
4 80
2)
-
1
5 07
6
TOTA
L 2
46 6
99
( 59
604
) -
187
095
Ea
ster
n C
ape
27
768
-
-
2
7 76
8
Free
Sta
te 2
6 67
0
-
-
26
670
G
aute
ng 3
3 71
5
-
-
33
715
K
waZ
ulu-
Nat
al 3
2 58
6
-
-
32
586
Li
mpo
po 3
2 43
2
-
-
32
432
M
pum
alan
ga 2
9 02
0
-
-
29
020
N
orth
ern
Cap
e 1
3 76
0
-
-
13
760
N
orth
Wes
t 1
8 41
4
-
-
18
414
W
este
rn C
ape
28
499
-
-
2
8 49
9
TOTA
L 2
42 8
64
-
-
242
864
Ea
ster
n C
ape
50
497
(
16 9
36)
-
3
3 56
1
Free
Sta
te 3
7 33
7
( 5
069)
-
32
268
G
aute
ng 5
7 10
6
( 9
452)
-
47
654
K
waZ
ulu-
Nat
al 6
5 70
1
( 5
069)
-
60
632
Li
mpo
po 4
6 86
0
( 8
720)
-
38
140
M
pum
alan
ga 4
1 41
7
( 5
069)
-
36
348
N
orth
ern
Cap
e 2
7 01
2
( 6
724)
-
20
288
N
orth
Wes
t 3
9 45
3
( 5
892)
-
33
561
W
este
rn C
ape
35
479
(
5 06
9)
-
3
0 41
0
TOTA
L 4
00 8
62
( 68
000
) -
332
862
Ea
ster
n C
ape
1 3
76 3
43
-
-
1 3
76 3
43
Free
Sta
te 4
31 8
51
-
-
431
851
G
aute
ng 9
05 0
06
-
-
905
006
K
waZ
ulu-
Nat
al 1
717
512
-
-
1
717
512
Li
mpo
po 1
369
485
-
-
1
369
485
M
pum
alan
ga 7
34 4
14
-
-
734
414
N
orth
ern
Cap
e 2
02 6
14
-
-
202
614
N
orth
Wes
t 5
16 1
14
-
-
516
114
W
este
rn C
ape
412
548
-
-
4
12 5
48
Una
lloca
ted
-
-
-
-
TOTA
L 7
665
887
-
-
7
665
887
(a) H
IV a
nd A
IDS
(Life
Ski
lls E
duca
tion)
G
rant
To su
ppor
t Sou
th A
frica
’s H
IV p
reve
ntio
n str
ateg
y by
: pro
vidi
ng c
ompr
ehen
sive
sexu
ality
edu
catio
n an
d ac
cess
to se
xual
and
repr
oduc
tive
heal
th se
rvic
es to
lear
ners
; su
ppor
ting
the
prov
ision
of e
mpl
oyee
hea
lth a
nd w
elln
ess p
rogr
amm
es fo
r edu
cato
rs; t
o m
itiga
te th
e im
pact
of H
IV a
nd T
B by
pro
vidi
ng a
car
ing,
supp
ortiv
e an
d en
ablin
g en
viro
nmen
t for
lear
ners
and
edu
cato
rs; t
o re
duce
the
vuln
erab
ility
of c
hild
ren
to H
IV, T
B an
d se
xual
ly tr
ansm
itted
infe
ctio
ns, w
ith a
par
ticul
ar fo
cus o
n or
phan
ed c
hild
ren
and
girls
.
Con
ditio
nal a
lloca
tion
(b) L
earn
ers W
ith P
rofo
und
Inte
llect
ual
Disa
bilit
ies G
rant
To p
rovi
de th
e ne
cess
ary
supp
ort,
reso
urce
s and
equ
ipm
ent t
o id
entif
ied
care
cen
tres a
nd
scho
ols f
or th
e pr
ovisi
on o
f edu
catio
n to
chi
ldre
n w
ith se
vere
to p
rofo
und
inte
llect
ual
disa
bilit
ies.
Con
ditio
nal a
lloca
tion
(c) M
aths
, Sci
ence
and
Tec
hnol
ogy
Gra
ntTo
pro
vide
supp
ort a
nd re
sour
ces t
o sc
hool
s, te
ache
rs a
nd le
arne
rs in
line
with
the
Cur
ricul
um A
sses
smen
t Pol
icy
Stat
emen
ts fo
r the
impr
ovem
ent o
f mat
hem
atic
s, sc
ienc
e an
d te
chno
logy
teac
hing
and
lear
ning
at s
elec
ted
publ
ic sc
hool
s.
Con
ditio
nal a
lloca
tion
(d) N
atio
nal S
choo
l Nut
ritio
n Pr
ogra
mm
e G
rant
To p
rovi
de n
utrit
ious
mea
ls to
targ
eted
scho
ols.
Con
ditio
nal a
lloca
tion
Bas
ic E
duca
tion
(Vot
e 16
)
Bas
ic E
duca
tion
(Vot
e 16
)
Bas
ic E
duca
tion
(Vot
e 16
)
Bas
ic E
duca
tion
(Vot
e 16
)
8

SCH
ED
UL
E 5
, PA
RT
A
SPE
CIF
IC-P
UR
POSE
AL
LO
CA
TIO
NS
TO
PR
OV
INC
ES
R'0
00R
'000
R'0
00R
'000
2nd
Adj
ustm
ent
Col
umn
A
1st A
djus
tmen
t20
20/2
1A
djus
ted
Allo
catio
n
Vot
eN
ame
of a
lloca
tion
Purp
ose
Type
of a
lloca
tion
Prov
ince
2020
/21
Mai
nA
lloca
tion
East
ern
Cap
e 2
667
462
4
81 0
76
8 7
61
3 1
57 2
99
Free
Sta
te 1
472
363
1
25 1
59
72
5
1 5
98 2
47
Gau
teng
5 2
56 2
34
607
442
(
47 9
77)
5 8
15 6
99
Kw
aZul
u-N
atal
6 4
53 9
23
446
764
(
1 79
8)
6 8
98 8
89
Lim
popo
2 1
79 0
20
223
429
1
1 33
5
2 4
13 7
84
Mpu
mal
anga
2 2
05 7
14
173
061
3
656
2
382
431
Nor
ther
n C
ape
656
487
6
1 57
5
16
8
718
230
Nor
th W
est
1 6
28 5
27
175
100
5
095
1
808
722
Wes
tern
Cap
e 1
867
472
5
52 2
20
9 4
26
2 4
29 1
18
Una
lloca
ted
-
-
-
-
TOTA
L 2
4 38
7 20
2
2 8
45 8
26
( 10
609
) 2
7 22
2 41
9
East
ern
Cap
e 6
69 5
33
-
-
669
533
Free
Sta
te 5
86 7
45
-
-
586
745
G
aute
ng 9
68 2
10
-
-
968
210
K
waZ
ulu-
Nat
al 1
271
414
-
-
1
271
414
Li
mpo
po 7
42 4
73
-
-
742
473
M
pum
alan
ga 4
23 9
22
-
-
423
922
N
orth
ern
Cap
e 4
09 4
04
-
(
52 3
71)
357
033
N
orth
Wes
t 5
97 1
58
-
-
597
158
W
este
rn C
ape
698
793
-
-
6
98 7
93
Una
lloca
ted
-
-
-
TO
TAL
6 3
67 6
52
-
(
52 3
71)
6 3
15 2
81
East
ern
Cap
e 4
5 26
2
-
(
20 0
00)
25
262
Fr
ee S
tate
21
496
-
( 5
500)
1
5 99
6
Gau
teng
53
674
-
-
5
3 67
4
Kw
aZul
u-N
atal
55
290
-
5 0
00
60
290
Li
mpo
po 3
2 06
6
-
-
32
066
M
pum
alan
ga 2
1 10
4
-
(
5 00
0)
16
104
N
orth
ern
Cap
e 1
9 27
6
-
(
5 87
6)
13
400
N
orth
Wes
t 2
1 19
2
-
(
11 0
00)
10
192
W
este
rn C
ape
19
480
-
-
1
9 48
0
TOTA
L 2
88 8
40
-
(
42 3
76)
246
464
Ea
ster
n C
ape
366
523
-
24
770
3
91 2
93
Free
Sta
te 2
37 0
19
-
9
921
2
46 9
40
Gau
teng
1 3
36 0
08
-
3
3 35
4
1 3
69 3
62
Kw
aZul
u-N
atal
593
830
-
40
548
6
34 3
78
Lim
popo
232
171
-
22
519
2
54 6
90
Mpu
mal
anga
189
495
-
16
457
2
05 9
52
Nor
ther
n C
ape
125
465
-
4 3
48
129
813
N
orth
Wes
t 1
92 7
23
-
1
4 28
3
207
006
W
este
rn C
ape
881
370
-
( 11
514
) 8
69 8
56
Una
lloca
ted
-
-
-
-
TOTA
L 4
154
604
-
154
686
4
309
290
(a) H
IV, T
B, M
alar
ia a
nd C
omm
unity
O
utre
ach
Gra
ntTo
ena
ble
the
heal
th se
ctor
to d
evel
op a
nd im
plem
ent a
n ef
fect
ive
resp
onse
to H
IV a
nd
AID
S; to
ena
ble
the
heal
th se
ctor
to d
evel
op a
nd im
plem
ent a
n ef
fect
ive
resp
onse
to T
B;
to e
nsur
e pr
ovis
ion
of q
ualit
y co
mm
unity
out
reac
h se
rvic
es th
roug
h W
ard
Bas
ed P
rimar
y H
ealth
Car
e O
utre
ach
Team
s; to
impr
ove
effic
ienc
ies o
f the
War
d B
ased
Prim
ary
Hea
lth
Car
e O
utre
ach
Team
s pro
gram
me
by h
arm
onisi
ng a
nd st
anda
rdis
ing
serv
ices
and
st
reng
then
ing
perfo
rman
ce m
onito
ring;
pre
vent
ion
and
prot
ectio
n of
hea
lth w
orke
rs fr
om
expo
sure
to h
azar
ds in
the
wor
k pl
ace;
to e
nabl
e th
e he
alth
sect
or to
dev
elop
and
im
plem
ent a
n ef
fect
ive
resp
onse
to su
ppor
t the
effe
ctiv
e im
plem
enta
tion
of th
e N
atio
nal
Stra
tegi
c Pl
an o
n M
alar
ia E
limin
atio
n 20
19 –
202
3; to
ena
ble
the
heal
th se
ctor
to p
reve
nt
cerv
ical
can
cer b
y m
akin
g av
aila
ble
Hum
an P
apill
omav
irus v
acci
natio
ns fo
r gr
ade
five
scho
ol g
irls i
n al
l pub
lic a
nd sp
ecia
l sch
ools
and
prog
ress
ive
inte
grat
ion
of
Hum
an P
apill
omav
irus i
nto
the
inte
grat
ed sc
hool
hea
lth p
rogr
amm
e.
Con
ditio
nal a
lloca
tion
(b) H
ealth
Fac
ility
Rev
italis
atio
n G
rant
To h
elp
acce
lera
te c
onst
ruct
ion,
mai
nten
ance
, upg
radi
ng a
nd re
habi
litat
ion
of n
ew a
nd
exist
ing
infra
struc
ture
in h
ealth
incl
udin
g, h
ealth
tech
nolo
gy, o
rgan
isatio
nal d
evel
opm
ent
syst
ems a
nd q
ualit
y as
sura
nce;
to e
nhan
ce c
apac
ity to
del
iver
hea
lth in
frast
ruct
ure;
to
acce
lera
te th
e fu
lfilm
ent o
f the
requ
irem
ents
of o
ccup
atio
nal h
ealth
and
safe
ty.
Con
ditio
nal a
lloca
tion
(c) N
atio
nal H
ealth
Insu
ranc
e G
rant
To e
xpan
d th
e he
alth
care
serv
ice
bene
fits t
hrou
gh th
e st
rate
gic
purc
hasi
ng o
f ser
vice
s fro
m h
ealth
care
pro
vide
rs.
Nat
iona
lly a
ssig
ned
func
tion
to p
rovi
nces
(d) S
tatu
tory
Hum
an R
esou
rces
, Tra
inin
g an
d D
evel
opm
ent G
rant
To a
ppoi
nt st
atut
ory
posi
tions
in th
e he
alth
sect
or fo
r sys
tem
atic
real
isat
ion
of th
e hu
man
re
sour
ces f
or h
ealth
stra
tegy
and
the
phas
e-in
of N
atio
nal H
ealth
Insu
ranc
e; su
ppor
t pr
ovin
ces t
o fu
nd se
rvic
e co
sts a
ssoc
iate
d w
ith c
linic
al tr
aini
ng a
nd su
perv
ision
of h
ealth
sc
ienc
e tra
inee
s on
the
publ
ic se
rvic
e pl
atfo
rm.
Con
ditio
nal a
lloca
tion
Hea
lth(V
ote
18)
Hea
lth(V
ote
18)
Hea
lth(V
ote
18)
Hea
lth(V
ote
18)
9

SCH
ED
UL
E 5
, PA
RT
A
SPE
CIF
IC-P
UR
POSE
AL
LO
CA
TIO
NS
TO
PR
OV
INC
ES
R'0
00R
'000
R'0
00R
'000
2nd
Adj
ustm
ent
Col
umn
A
1st A
djus
tmen
t20
20/2
1A
djus
ted
Allo
catio
n
Vot
eN
ame
of a
lloca
tion
Purp
ose
Type
of a
lloca
tion
Prov
ince
2020
/21
Mai
nA
lloca
tion
East
ern
Cap
e 1
803
294
(
191
210)
-
1 6
12 0
84
Free
Sta
te 9
50 7
98
( 10
0 81
7)
-
8
49 9
81
Gau
teng
4 6
25 4
47
( 49
0 45
4)
-
4
134
993
K
waZ
ulu-
Nat
al 3
379
057
(
358
294)
-
3 0
20 7
63
Lim
popo
1 0
60 6
22
( 11
2 46
1)
-
9
48 1
61
Mpu
mal
anga
1 0
81 0
44
( 11
4 62
7)
-
9
66 4
17
Nor
ther
n C
ape
319
888
-
-
3
19 8
88
Nor
th W
est
1 4
93 0
31
( 15
8 31
1)
-
1
334
720
W
este
rn C
ape
1 9
07 5
51
( 20
2 26
5)
-
1
705
286
TO
TAL
16
620
732
( 1
728
439
) -
14
892
293
Ea
ster
n C
ape
-
-
-
-
Free
Sta
te-
-
-
-
G
aute
ng-
-
-
-
K
waZ
ulu-
Nat
al-
-
-
-
Li
mpo
po-
-
-
-
M
pum
alan
ga-
-
-
-
N
orth
ern
Cap
e-
-
-
-
N
orth
Wes
t-
-
-
-
W
este
rn C
ape
-
-
-
-
TOTA
L-
-
-
-
Ea
ster
n C
ape
64
254
(
42 0
14)
-
2
2 24
0
Free
Sta
te 3
3 86
0
( 22
140
) (
596
) 1
1 12
4
Gau
teng
164
795
(
107
755)
-
57
040
K
waZ
ulu-
Nat
al 1
06 1
46
( 69
406
) -
36
740
Li
mpo
po 3
7 79
0
( 24
710
) -
13
080
M
pum
alan
ga 3
8 48
3
( 25
163
) (
3 67
0)
9 6
50
Nor
ther
n C
ape
11
383
(
7 44
3)
-
3
940
N
orth
Wes
t 5
3 16
0
( 34
760
) (
9 85
5)
8 5
45
Wes
tern
Cap
e 6
7 95
2
( 44
432
) (
23 3
20)
20
0
TOTA
L 5
77 8
23
( 37
7 82
3)
( 37
441
) 1
62 5
59
(c) T
itle
Dee
ds R
esto
ratio
n G
rant
To p
rovi
de fu
ndin
g fo
r the
era
dica
tion
of th
e pr
e-20
14 ti
tle d
eeds
regi
stra
tion
back
log.
Con
ditio
nal a
lloca
tion
(a) H
uman
Set
tlem
ents
Dev
elop
men
t Gra
ntTo
pro
vide
fund
ing
for t
he p
rogr
essi
ve re
alisa
tion
of a
cces
s to
adeq
uate
hou
sing
thro
ugh
the
crea
tion
of su
stai
nabl
e an
d in
tegr
ated
hum
an se
ttlem
ents;
to p
rovi
de fu
ndin
g to
fa
cilit
ate
a pr
ogra
mm
atic
and
incl
usiv
e ap
proa
ch to
upg
radi
ng in
form
al se
ttlem
ents.
Con
ditio
nal a
lloca
tion
(b) I
nfor
mal
Set
tlem
ents
Upg
radi
ng
Partn
ersh
ip G
rant
for P
rovi
nces
To p
rovi
de fu
ndin
g to
faci
litat
e a
prog
ram
mat
ic a
nd in
clus
ive
appr
oach
to u
pgra
ding
in
form
al se
ttlem
ents
.C
ondi
tiona
l allo
catio
n
Hum
an S
ettle
men
ts(V
ote
33)
Hum
an S
ettle
men
ts(V
ote
33)
Hum
an S
ettle
men
ts(V
ote
33)
10

SCH
ED
UL
E 5
, PA
RT
A
SPE
CIF
IC-P
UR
POSE
AL
LO
CA
TIO
NS
TO
PR
OV
INC
ES
R'0
00R
'000
R'0
00R
'000
2nd
Adj
ustm
ent
Col
umn
A
1st A
djus
tmen
t20
20/2
1A
djus
ted
Allo
catio
n
Vot
eN
ame
of a
lloca
tion
Purp
ose
Type
of a
lloca
tion
Prov
ince
2020
/21
Mai
nA
lloca
tion
East
ern
Cap
e 1
07 7
89
-
-
107
789
Fr
ee S
tate
24
085
-
-
2
4 08
5
Gau
teng
53
887
-
-
5
3 88
7
Kw
aZul
u-N
atal
104
494
-
-
1
04 4
94
Lim
popo
25
379
-
-
2
5 37
9
Mpu
mal
anga
27
907
-
-
2
7 90
7
Nor
ther
n C
ape
21
634
-
-
2
1 63
4
Nor
th W
est
29
604
-
-
2
9 60
4
Wes
tern
Cap
e 2
5 98
3
-
-
25
983
U
nallo
cate
d-
-
-
-
TO
TA
L 4
20 7
62
-
-
420
762
Ea
ster
n C
ape
55
202
-
-
5
5 20
2
Free
Sta
te 3
9 57
2
-
-
39
572
G
aute
ng 5
1 08
7
-
-
51
087
K
waZ
ulu-
Nat
al 7
8 88
1
-
-
78
881
Li
mpo
po 5
9 07
3
-
-
59
073
M
pum
alan
ga 3
4 93
4
-
-
34
934
N
orth
ern
Cap
e 2
2 63
8
-
-
22
638
N
orth
Wes
t 2
9 24
6
-
-
29
246
W
este
rn C
ape
42
950
-
-
4
2 95
0
Una
lloca
ted
-
-
-
-
TOTA
L 4
13 5
83
-
-
413
583
Ea
ster
n C
ape
134
142
-
59
792
1
93 9
34
Free
Sta
te 5
5 76
8
-
3
8 88
0
94
648
G
aute
ng 1
35 2
29
-
7
7 76
3
212
992
K
waZ
ulu-
Nat
al 1
93 4
37
-
8
9 89
8
283
335
Li
mpo
po 1
27 7
24
-
5
8 24
1
185
965
M
pum
alan
ga 8
0 87
2
-
4
2 37
2
123
244
N
orth
ern
Cap
e 2
4 08
5
-
4
2 37
2
66
457
N
orth
Wes
t 7
6 74
0
-
3
3 86
5
110
605
W
este
rn C
ape
87
152
-
53
067
1
40 2
19
Una
lloca
ted
-
-
-
-
TOTA
L 9
15 1
49
-
4
96 2
50
1 4
11 3
99
Early
Chi
ldho
od D
evel
opm
ent G
rant
To in
crea
se th
e nu
mbe
r of p
oor c
hild
ren
acce
ssin
g su
bsid
ised
ear
ly c
hild
hood
de
velo
pmen
t ser
vice
s thr
ough
par
tial c
are
faci
litie
s; to
supp
ort e
arly
chi
ldho
od
deve
lopm
ent p
rovi
ders
del
iver
ing
an e
arly
chi
ldho
od d
evel
opm
ent p
rogr
amm
e to
mee
t ba
sic h
ealth
and
safe
ty re
quire
men
ts fo
r reg
istra
tion;
to p
ilot t
he c
onstr
uctio
n of
new
low
-co
st e
arly
chi
ldho
od d
evel
opm
ent c
entre
s.
Con
ditio
nal a
lloca
tion
(b) S
ocia
l Sec
tor E
xpan
ded
Publ
ic W
orks
Pr
ogra
mm
e In
cent
ive
Gra
nt fo
r Pro
vinc
esTo
ince
ntiv
ise
prov
inci
al so
cial
sect
or d
epar
tmen
ts, i
dent
ified
in th
e so
cial
sect
or
Expa
nded
Pub
lic W
orks
Pro
gram
me
log-
fram
e, to
incr
ease
job
crea
tion
by fo
cusi
ng o
n th
e st
reng
then
ing
and
expa
nsio
n of
soci
al se
ctor
pro
gram
mes
that
hav
e em
ploy
men
t po
tent
ial.
Con
ditio
nal a
lloca
tion
(a) E
xpan
ded
Publ
ic W
orks
Pro
gram
me
Inte
grat
ed G
rant
for P
rovi
nces
To in
cent
ivise
pro
vinc
ial d
epar
tmen
ts to
exp
and
wor
k cr
eatio
n ef
forts
thro
ugh
the
use
of
labo
ur in
tens
ive
deliv
ery
met
hods
in th
e fo
llow
ing
iden
tifie
d fo
cus a
reas
, in
com
plia
nce
with
the
Expa
nded
Pub
lic W
orks
Pro
gram
me
guid
elin
es: r
oad
mai
nten
ance
and
the
mai
nten
ance
of b
uild
ings
; low
traf
fic v
olum
e ro
ads a
nd ru
ral r
oads
; oth
er e
cono
mic
and
so
cial
infra
struc
ture
; tou
rism
and
cul
tura
l ind
ustri
es; s
usta
inab
le la
nd b
ased
live
lihoo
ds;
was
te m
anag
emen
t.
Con
ditio
nal a
lloca
tion
Publ
ic W
orks
and
In
fras
truc
ture
(Vot
e 13
)
Publ
ic W
orks
and
In
fras
truc
ture
(Vot
e 13
)
Soci
al D
evel
opm
ent
(Vot
e 19
)
11

SCH
ED
UL
E 5
, PA
RT
A
SPE
CIF
IC-P
UR
POSE
AL
LO
CA
TIO
NS
TO
PR
OV
INC
ES
R'0
00R
'000
R'0
00R
'000
2nd
Adj
ustm
ent
Col
umn
A
1st A
djus
tmen
t20
20/2
1A
djus
ted
Allo
catio
n
Vot
eN
ame
of a
lloca
tion
Purp
ose
Type
of a
lloca
tion
Prov
ince
2020
/21
Mai
nA
lloca
tion
East
ern
Cap
e 1
66 5
06
( 34
700
) (
1 54
2)
130
264
Fr
ee S
tate
167
082
(
34 7
00)
( 1
542)
1
30 8
40
Gau
teng
166
781
(
34 7
00)
( 1
542)
1
30 5
39
Kw
aZul
u-N
atal
181
072
(
34 7
00)
( 3
084)
1
43 2
88
Lim
popo
143
221
(
34 7
91)
( 1
542)
1
06 8
88
Mpu
mal
anga
162
410
(
34 7
00)
( 1
542)
1
26 1
68
Nor
ther
n C
ape
167
162
(
34 7
00)
( 1
542)
1
30 9
20
Nor
th W
est
138
733
(
34 8
00)
( 1
542)
1
02 3
91
Wes
tern
Cap
e 1
86 1
26
( 34
700
) -
151
426
TO
TAL
1 4
79 0
93
( 31
2 49
1)
( 13
878
) 1
152
724
Ea
ster
n C
ape
64
626
(
30 4
28)
( 5
94)
33
604
Fr
ee S
tate
94
147
(
11 5
52)
( 2
48)
82
347
G
aute
ng 8
7 87
9
( 48
052
) (
913
) 3
8 91
4
Kw
aZul
u-N
atal
88
023
(
48 8
78)
( 9
26)
38
219
Li
mpo
po 5
8 36
3
( 26
072
) (
514
) 3
1 77
7
Mpu
mal
anga
46
532
(
17 8
44)
( 3
64)
28
324
N
orth
ern
Cap
e 3
1 54
7
( 3
792)
(
115
) 2
7 64
0
Nor
th W
est
42
009
(
14 6
98)
( 3
06)
27
005
W
este
rn C
ape
83
491
(
22 6
84)
( 4
53)
60
354
TO
TAL
596
617
(
224
000)
(
4 43
3)
368
184
(b) M
ass P
artic
ipat
ion
and
Spor
t D
evel
opm
ent G
rant
To fa
cilit
ate
spor
t and
act
ive
recr
eatio
n pa
rtici
patio
n an
d em
pow
erm
ent i
n pa
rtner
ship
w
ith re
leva
nt st
akeh
olde
rs.
Con
ditio
nal a
lloca
tion
(a) C
omm
unity
Lib
rary
Ser
vice
s Gra
ntTo
tran
sfor
m u
rban
and
rura
l com
mun
ity li
brar
y in
frast
ruct
ure,
faci
litie
s and
serv
ices
(p
rimar
ily ta
rget
ing
prev
ious
ly d
isadv
anta
ged
com
mun
ities
) thr
ough
a re
capi
talis
ed
prog
ram
me
at p
rovi
ncia
l lev
el in
supp
ort o
f loc
al g
over
nmen
t and
nat
iona
l ini
tiativ
es.
Con
ditio
nal a
lloca
tion
Spor
ts, A
rts a
nd C
ultu
re(V
ote
37)
Spor
ts, A
rts a
nd C
ultu
re(V
ote
37)
12

SCH
ED
UL
E 5
, PA
RT
B
SPE
CIF
IC-P
UR
POSE
AL
LO
CA
TIO
NS
TO
MU
NIC
IPA
LIT
IES
R'0
00R
'000
R'0
00R
'000
RE
CU
RR
EN
T G
RA
NT
SC
oope
rativ
e G
over
nanc
e(V
ote
3)M
unic
ipal
Sys
tem
s Im
prov
emen
t Gra
nt
-
-
-
-
Nat
iona
l Tre
asur
y(V
ote
8)(a
) Inf
rast
ruct
ure
Skill
s Dev
elop
men
t Gra
nt 1
53 1
92
( 7
600)
(
1 73
2)
143
860
Nat
iona
l Tre
asur
y(V
ote
8)(b
) Loc
al G
over
nmen
t Fin
anci
al
Man
agem
ent G
rant
544
862
-
-
5
44 8
62
Publ
ic W
orks
and
In
fras
truc
ture
(Vot
e 13
)
Expa
nded
Pub
lic W
orks
Pro
gram
me
Inte
grat
ed G
rant
for M
unic
ipal
ities
748
039
-
-
7
48 0
39
TO
TA
L 1
446
093
(
7 60
0)
( 1
732)
1
436
761
2nd
Adj
ustm
ent
Col
umn
A
1st A
djus
tmen
t20
20/2
1A
djus
ted
Allo
catio
n
Purp
ose
To a
ssis
t mun
icip
aliti
es to
per
form
thei
r fun
ctio
ns a
nd st
abili
se in
stitu
tiona
l and
gov
erna
nce
syst
ems a
s req
uire
d in
the
Mun
icipa
l Sy
stem
s Act
and
rela
ted
loca
l gov
ernm
ent l
egis
latio
n.
To re
crui
t une
mpl
oyed
gra
duat
es in
to m
unic
ipal
ities
to b
e tra
ined
and
pro
fess
iona
lly re
gist
ered
, as p
er th
e re
quire
men
ts o
f the
re
leva
nt st
atut
ory
coun
cils
with
in th
e bu
ilt e
nviro
nmen
t.
To p
rom
ote
and
supp
ort r
efor
ms i
n fin
anci
al m
anag
emen
t by
build
ing
capa
city
in m
unic
ipal
ities
to im
plem
ent t
he M
unic
ipal
Fin
ance
M
anag
emen
t Act
.
To in
cent
ivis
e m
unic
ipal
ities
to e
xpan
d w
ork
crea
tion
effo
rts th
roug
h th
e us
e of
labo
ur in
tens
ive
deliv
ery
met
hods
in th
e fo
llow
ing
iden
tifie
d fo
cus a
reas
, in
com
plia
nce
with
the
Expa
nded
Pub
lic W
orks
Pro
gram
me
guid
elin
es: r
oad
mai
nten
ance
and
the
mai
nten
ance
of
bui
ldin
gs; l
ow tr
affic
vol
ume
road
s and
rura
l roa
ds; b
asic
serv
ices
infr
astru
ctur
e, in
clud
ing
wat
er a
nd sa
nita
tion
retic
ulat
ion
(exc
ludi
ng b
ulk
infr
astru
ctur
e); o
ther
eco
nom
ic a
nd so
cial
infr
astru
ctur
e; to
uris
m a
nd c
ultu
ral i
ndus
tries
; was
te m
anag
emen
t; pa
rks
and
beau
tific
atio
n; su
stai
nabl
e la
nd-b
ased
live
lihoo
ds; s
ocia
l ser
vice
s pro
gram
mes
; com
mun
ity sa
fety
pro
gram
mes
.
Vot
eN
ame
of a
lloca
tion
2020
/21
Mai
nA
lloca
tion
13

SCH
ED
UL
E 5
, PA
RT
B
SPE
CIF
IC-P
UR
POSE
AL
LO
CA
TIO
NS
TO
MU
NIC
IPA
LIT
IES
R'0
00R
'000
R'0
00R
'000
2nd
Adj
ustm
ent
Col
umn
A
1st A
djus
tmen
t20
20/2
1A
djus
ted
Allo
catio
n
Purp
ose
Vot
eN
ame
of a
lloca
tion
2020
/21
Mai
nA
lloca
tion
INFR
AST
RU
CT
UR
E G
RA
NT
SC
oope
rativ
e G
over
nanc
e(V
ote
3)(a
) Int
egra
ted
Urb
an D
evel
opm
ent G
rant
948
031
-
( 11
663
) 9
36 3
68
Coo
pera
tive
Gov
erna
nce
(Vot
e 3)
(b) M
unic
ipal
Infr
astru
ctur
e G
rant
14
671
101
-
( 18
0 03
6)
14
491
065
Hum
an S
ettle
men
ts(V
ote
33)
Info
rmal
Set
tlem
ents
Upg
radi
ng P
artn
ersh
ip
Gra
nt fo
r Mun
icip
aliti
es-
-
-
-
Min
eral
Res
ourc
es a
nd
Ene
rgy
(Vot
e 34
)
(a) E
nerg
y Ef
ficie
ncy
and
Dem
and
Side
M
anag
emen
t Gra
nt 2
17 9
94
( 21
799
) -
196
195
Min
eral
Res
ourc
es a
nd
Ene
rgy
(Vot
e 34
)
(b) I
nteg
rate
d N
atio
nal E
lect
rific
atio
n Pr
ogra
mm
e (M
unic
ipal
) Gra
nt 1
858
752
(
500
000)
-
1 3
58 7
52
Nat
iona
l Tre
asur
y(V
ote
8)N
eigh
bour
hood
Dev
elop
men
t Par
tner
ship
G
rant
(Cap
ital)
559
442
(
67 6
93)
( 12
332
) 4
79 4
17
Tra
nspo
rt(V
ote
40)
(a) P
ublic
Tra
nspo
rt N
etw
ork
Gra
nt 6
445
848
( 1
902
275
) (
154
503)
4
389
070
Tra
nspo
rt(V
ote
40)
(b) R
ural
Roa
ds A
sset
Man
agem
ent
Syst
ems G
rant
108
436
-
-
1
08 4
36
Wat
er a
nd S
anita
tion
(Vot
e 41
)(a
) Reg
iona
l Bul
k In
fras
truct
ure
Gra
nt
2 0
05 6
05
-
-
2 0
05 6
05
Wat
er a
nd S
anita
tion
(Vot
e 41
)(b
) Wat
er S
ervi
ces I
nfra
stru
ctur
e G
rant
3 4
45 1
65
-
(
77 6
08)
3 3
67 5
57
TO
TA
L 3
0 26
0 37
4
( 2 4
91 7
67)
( 43
6 14
2)
27
332
465
To im
plem
ent t
he In
tegr
ated
Nat
iona
l Ele
ctrif
icat
ion
Prog
ram
me
by p
rovi
ding
cap
ital s
ubsi
dies
to m
unic
ipal
ities
to a
ddre
ss th
e el
ectri
ficat
ion
back
log
of a
ll ex
istin
g an
d pl
anne
d re
side
ntia
l dw
ellin
gs (i
nclu
ding
info
rmal
settl
emen
ts, f
arm
dw
elle
rs, n
ew a
nd
exis
ting
dwel
lings
) and
the
inst
alla
tion
of re
leva
nt b
ulk
infr
astru
ctur
e.
To p
lan,
cat
alys
e, a
nd in
vest
in ta
rget
ed lo
catio
ns in
ord
er to
attr
act a
nd su
stai
n th
ird p
arty
cap
ital i
nves
tmen
ts a
imed
at s
patia
l tra
nsfo
rmat
ion,
that
will
impr
ove t
he q
ualit
y of
life
, and
acc
ess t
o op
portu
nitie
s for
resid
ents
in S
outh
Afri
ca’s
und
er-s
erve
d ne
ighb
ourh
oods
, gen
eral
ly to
wns
hips
and
rura
l tow
ns.
To p
rovi
de fu
ndin
g fo
r acc
eler
ated
con
stru
ctio
n an
d im
prov
emen
t of p
ublic
and
non
-mot
oris
ed tr
ansp
ort i
nfra
stru
ctur
e th
at fo
rm p
art
of a
mun
icip
al in
tegr
ated
pub
lic tr
ansp
ort n
etw
ork
and
to su
ppor
t the
pla
nnin
g, re
gula
tion,
con
trol,
man
agem
ent a
nd o
pera
tions
of
fisca
lly a
nd fi
nanc
ially
sust
aina
ble
mun
icip
al p
ublic
tran
spor
t net
wor
k se
rvic
es.
To a
ssis
t dis
trict
mun
icip
aliti
es to
set u
p R
oad
Ass
et M
anag
emen
t Sys
tem
s, an
d co
llect
road
, brid
ge a
nd tr
affic
dat
a on
mun
icip
al
road
net
wor
ks in
line
with
the
Roa
d In
fras
truct
ure
Stra
tegi
c Fr
amew
ork
for S
outh
Afr
ica.
To d
evel
op n
ew, r
efur
bish
, upg
rade
and
repl
ace
agei
ng b
ulk
wat
er a
nd sa
nita
tion
infr
astru
ctur
e of
regi
onal
sign
ifica
nce
that
con
nect
s w
ater
reso
urce
s to
infr
astru
ctur
e se
rvin
g ex
tens
ive
area
s acr
oss m
unic
ipal
bou
ndar
ies o
r lar
ge re
gion
al b
ulk
infr
astru
ctur
e se
rvin
g nu
mer
ous c
omm
uniti
es o
ver a
larg
e ar
ea w
ithin
a m
unic
ipal
ity; t
o im
plem
ent b
ulk
infr
astru
ctur
e w
ith a
pot
entia
l of a
ddre
ssin
g wa
ter
cons
erva
tion
and
wat
er d
eman
d m
anag
emen
t pro
ject
s or f
acili
tate
and
con
tribu
te to
the
impl
emen
tatio
n of
loca
l wat
er c
onse
rvat
ion
and
wat
er d
eman
d m
anag
emen
t pro
ject
s tha
t will
dire
ctly
impa
ct o
n bu
lk in
fras
truct
ure
requ
irem
ents
.
Faci
litat
e th
e pl
anni
ng a
nd im
plem
enta
tion
of v
ario
us w
ater
and
sani
tatio
n pr
ojec
ts to
acc
eler
ate
back
log
redu
ctio
n an
d en
hanc
e th
e su
stai
nabi
lity
of se
rvic
es e
spec
ially
in ru
ral m
unic
ipal
ities
; pro
vide
bas
ic a
nd in
term
itten
t wat
er a
nd sa
nita
tion
supp
ly th
at en
sure
s pr
ovis
ion
of se
rvic
es to
iden
tifie
d an
d pr
iorit
ised
com
mun
ities
, inc
ludi
ng sp
ring
prot
ectio
n an
d gr
ound
wat
er d
evel
opm
ent;
supp
ort
mun
icip
aliti
es in
impl
emen
ting
wat
er c
onse
rvat
ion
and
wat
er d
eman
d m
anag
emen
t pro
ject
s; su
ppor
t the
clo
se-o
ut o
f the
exi
stin
g B
ucke
t Era
dica
tion
Prog
ram
me
inte
rven
tion
in fo
rmal
resi
dent
ial a
reas
; sup
port
drou
ght r
elie
f pro
ject
s in
affe
cted
mun
icip
aliti
es.
To p
rovi
de fu
ndin
g fo
r pub
lic in
vest
men
t in
infr
astru
ctur
e fo
r the
poo
r and
to p
rom
ote
incr
ease
d ac
cess
to m
unic
ipal
ow
n so
urce
s of
capi
tal f
inan
ce in
ord
er to
incr
ease
fund
ing
for p
ublic
inve
stm
ent i
n ec
onom
ic in
fras
truct
ure;
to e
nsur
e th
at p
ublic
inve
stm
ents
are
spat
ially
alig
ned
and
to p
rom
ote
the
soun
d m
anag
emen
t of t
he a
sset
s del
iver
ed.
To p
rovi
de sp
ecifi
c ca
pita
l fin
ance
for e
radi
catin
g ba
sic
mun
icip
al in
fras
truct
ure
back
logs
for p
oor h
ouse
hold
s, m
icro
ente
rpris
es a
nd
soci
al in
stitu
tions
serv
icin
g po
or c
omm
uniti
es.
To p
rovi
de fu
ndin
g to
faci
litat
e a
prog
ram
mat
ic, i
nclu
sive
and
mun
icip
ality
-wid
e ap
proa
ch to
upg
radi
ng o
f inf
orm
al se
ttlem
ents
.
To p
rovi
de su
bsid
ies t
o m
unic
ipal
ities
to im
plem
ent e
nerg
y ef
ficie
ncy
and
dem
and
side
man
agem
ent i
nitia
tives
with
in m
unic
ipal
in
fras
truct
ure
in o
rder
to re
duce
ele
ctric
ity c
onsu
mpt
ion
and
impr
ove
ener
gy e
ffic
ienc
y.
14

SCH
ED
UL
E 6
, PA
RT
A
AL
LO
CA
TIO
NS-
IN-K
IND
TO
PR
OV
INC
ES
FOR
DE
SIG
NA
TE
D S
PEC
IAL
PR
OG
RA
MM
ES
R'0
00R
'000
R'0
00R
'000
Agr
icul
ture
, Lan
d R
efor
m
and
Rur
al D
evel
opm
ent
(Vot
e 29
)Ili
ma/
Lets
ema
Indi
rect
Gra
nt
35
857
-
-
3
5 85
7
Bas
ic E
duca
tion
(Vot
e 16
)Sc
hool
Infr
astru
ctur
e B
ackl
ogs G
rant
1 7
36 4
13
540
000
1
38 5
42
2 4
14 9
55
Hea
lth(V
ote
18)
Nat
iona
l Hea
lth In
sura
nce
Indi
rect
Gra
nt
2 2
87 8
64
( 33
8 46
8)
( 23
9 78
3)
1 7
09 6
13
TOTA
L 4
060
134
2
01 5
32
( 10
1 24
1)
4 1
60 4
25
Col
umn
A
1st A
djus
tmen
t20
20/2
1A
djus
ted
Allo
catio
n
2020
/21
Mai
nA
lloca
tion
To a
ssis
t vul
nera
ble
Sout
h A
fric
an fa
rmin
g co
mm
uniti
es to
ach
ieve
an
incr
ease
in a
gric
ultu
ral p
rodu
ctio
n an
d in
vest
in in
fras
truct
ure
that
unl
ocks
agr
icul
tura
l pro
duct
ion
with
in st
rate
gica
lly id
entif
ied
grai
n, li
vest
ock,
hor
ticul
ture
and
aqu
acul
ture
pro
duct
ion
area
s.
Erad
icat
ion
of a
ll in
appr
opria
te sc
hool
infr
astru
ctur
e; p
rovi
sion
of w
ater
, san
itatio
n an
d el
ectri
city
to sc
hool
s.
To c
reat
e an
alte
rnat
ive
track
to im
prov
e sp
endi
ng, p
erfo
rman
ce a
s wel
l as m
onito
ring
and
eval
uatio
n on
infr
astru
ctur
e in
pre
para
tion
for N
atio
nal H
ealth
Insu
ranc
e; to
enh
ance
cap
acity
and
cap
abili
ty to
del
iver
infr
astru
ctur
e fo
r Nat
iona
l Hea
lth In
sura
nce;
to a
ccel
erat
e th
e fu
lfilm
ent o
f the
requ
irem
ents
of o
ccup
atio
nal h
ealth
and
safe
ty; e
xpan
d th
e al
tern
ativ
e m
odel
s for
the
disp
ensi
ng a
nd d
istri
butio
n of
chr
onic
med
icat
ion;
dev
elop
and
roll-
out n
ew h
ealth
info
rmat
ion
syst
ems i
n pr
epar
atio
n fo
r Nat
iona
l Hea
lth In
sura
nce;
ena
ble
the
heal
th se
ctor
to a
ddre
ss th
e de
ficie
ncie
s in
the
prim
ary
heal
thca
re fa
cilit
ies s
yste
mat
ical
ly to
yie
ld fa
st re
sults
thro
ugh
the
impl
emen
tatio
n of
the
Idea
l Clin
ic p
rogr
amm
e; to
exp
and
the
heal
thca
re se
rvic
e be
nefit
s thr
ough
the
stra
tegi
c pu
rcha
sing
of s
ervi
ces
from
hea
lthca
re p
rovi
ders
.
2nd
Adj
ustm
ent
Vot
eN
ame
of a
lloca
tion
Purp
ose
15

SCH
ED
UL
E 6
, PA
RT
B
AL
LO
CA
TIO
NS-
IN-K
IND
TO
MU
NIC
IPA
LIT
IES
FOR
DE
SIG
NA
TE
D S
PEC
IAL
PR
OG
RA
MM
ES
R'0
00R
'000
R'0
00R
'000
Coo
pera
tive
Gov
erna
nce
(Vot
e 3)
Mun
icip
al S
yste
ms I
mpr
ovem
ent G
rant
128
248
(
8 47
4)
-
119
774
Min
eral
Res
ourc
es a
nd
Ener
gy(V
ote
34)
Inte
grat
ed N
atio
nal E
lect
rific
atio
n Pr
ogra
mm
e (E
skom
) Gra
nt 3
001
483
( 1
000
000
) (
18 4
98)
1 9
82 9
85
Nat
iona
l Tre
asur
y(V
ote
8)N
eigh
bour
hood
Dev
elop
men
t Par
tner
ship
G
rant
(Tec
hnic
al A
ssis
tanc
e) 6
2 70
2
-
-
62
702
Wat
er a
nd S
anita
tion
(Vot
e 41
)(a
) Reg
iona
l Bul
k In
fras
truct
ure
Gra
nt
3 8
56 8
33
-
251
652
4
108
485
Wat
er a
nd S
anita
tion
(Vot
e 41
)(b
) Wat
er S
ervi
ces I
nfra
stru
ctur
e G
rant
578
806
-
1
2 25
8
591
064
TOTA
L 7
628
072
( 1
008
474
) 2
45 4
12
6 8
65 0
10
2020
/21
Mai
nA
lloca
tion
Vot
eN
ame
of a
lloca
tion
Purp
ose
To a
ssis
t mun
icip
aliti
es to
per
form
thei
r fun
ctio
ns a
nd st
abili
se in
stitu
tiona
l and
gov
erna
nce
syst
ems a
s req
uire
d in
the
Mun
icip
al
Syst
ems A
ct a
nd re
late
d lo
cal g
over
nmen
t leg
isla
tion.
To im
plem
ent t
he In
tegr
ated
Nat
iona
l Ele
ctrif
icat
ion
Prog
ram
me
by p
rovi
ding
cap
ital s
ubsi
dies
to E
skom
to a
ddre
ss th
e el
ectri
ficat
ion
back
log
of a
ll ex
istin
g an
d pl
anne
d re
side
ntia
l dw
ellin
gs (i
nclu
ding
info
rmal
settl
emen
ts, f
arm
dw
elle
rs, n
ew a
nd e
xist
ing
dwel
lings
) an
d th
e in
stal
latio
n of
rele
vant
bul
k in
fras
truct
ure
in E
skom
lice
nced
are
as.
Col
umn
A
1st A
djus
tmen
t20
20/2
1A
djus
ted
Allo
catio
n2n
d A
djus
tmen
t
To p
lan,
cat
alys
e, a
nd in
vest
in ta
rget
ed lo
catio
ns in
ord
er to
attr
act a
nd su
stai
n th
ird p
arty
cap
ital i
nves
tmen
ts a
imed
at s
patia
l tra
nsfo
rmat
ion,
that
will
impr
ove
the
qual
ity o
f life
, and
acc
ess t
o op
portu
nitie
s for
resid
ents
in S
outh
Afri
ca’s
und
er-s
erve
d ne
ighb
ourh
oods
, gen
eral
ly to
wns
hips
and
rura
l tow
ns.
To d
evel
op n
ew, r
efur
bish
, upg
rade
and
repl
ace
agei
ng b
ulk
wat
er a
nd sa
nita
tion
infr
astru
ctur
e of
regi
onal
sign
ifica
nce
that
con
nect
s w
ater
reso
urce
s to
infr
astru
ctur
e se
rvin
g ex
tens
ive
area
s acr
oss m
unic
ipal
bou
ndar
ies o
r lar
ge re
gion
al b
ulk
infr
astru
ctur
e se
rvin
g nu
mer
ous c
omm
uniti
es o
ver a
larg
e ar
ea w
ithin
a m
unic
ipal
ity; t
o im
plem
ent b
ulk
infr
astru
ctur
e w
ith a
pot
entia
l of a
ddre
ssin
g w
ater
co
nser
vatio
n an
d w
ater
dem
and
man
agem
ent p
roje
cts o
r fac
ilita
te a
nd c
ontri
bute
to th
e im
plem
enta
tion
of lo
cal w
ater
con
serv
atio
n an
d w
ater
dem
and
man
agem
ent p
roje
cts t
hat w
ill d
irect
ly im
pact
on
bulk
infr
astru
ctur
e re
quire
men
ts.
Faci
litat
e th
e pl
anni
ng a
nd im
plem
enta
tion
of v
ario
us w
ater
and
sani
tatio
n pr
ojec
ts to
acc
eler
ate
back
log
redu
ctio
n an
d en
hanc
e th
e su
stai
nabi
lity
of se
rvic
es e
spec
ially
in ru
ral m
unic
ipal
ities
; pro
vide
bas
ic a
nd in
term
itten
t wat
er a
nd sa
nita
tion
supp
ly th
at en
sure
s pr
ovis
ion
of se
rvic
es to
iden
tifie
d an
d pr
iorit
ised
com
mun
ities
, inc
ludi
ng sp
ring
prot
ectio
n an
d gr
ound
wat
er d
evel
opm
ent;
supp
ort
mun
icip
aliti
es in
impl
emen
ting
wat
er c
onse
rvat
ion
and
wat
er d
eman
d m
anag
emen
t pro
ject
s; su
ppor
t the
clo
se-o
ut o
f the
exi
stin
g B
ucke
t Era
dica
tion
Prog
ram
me
inte
rven
tion
in fo
rmal
resi
dent
ial a
reas
; sup
port
drou
ght r
elie
f pro
ject
s in
affe
cted
mun
icip
aliti
es.
16

SCH
ED
UL
E 7
, PA
RT
A
UN
AL
LO
CA
TE
D P
RO
VIS
ION
S FO
R P
RO
VIN
CE
S FO
R D
ISA
STE
R R
ESP
ON
SE
R'0
00R
'000
R'0
00R
'000
Coo
pera
tive
Gov
erna
nce
(Vot
e 3)
Prov
inci
al D
isas
ter R
elie
f Gra
nt 1
38 4
89
-
-
138
489
Hum
an S
ettle
men
ts(V
ote
33)
Prov
inci
al E
mer
genc
y H
ousi
ng G
rant
294
899
3
77 8
23
( 27
3 12
0)
399
602
TOTA
L 4
33 3
88
377
823
(
273
120)
5
38 0
91
Col
umn
A
1st A
djus
tmen
t20
20/2
1A
djus
ted
Allo
catio
n2n
d A
djus
tmen
t20
20/2
1M
ain
Allo
catio
n
Vot
eN
ame
of a
lloca
tion
Purp
ose
To p
rovi
de fo
r the
imm
edia
te re
leas
e of
fund
s for
dis
aste
r res
pons
e.
To p
rovi
de fu
ndin
g to
pro
vinc
es fo
r pro
visi
on o
f tem
pora
ry sh
elte
r ass
ista
nce
to h
ouse
hold
s affe
cted
by
disa
ster
s or a
hou
sing
em
erge
ncy;
to p
rovi
de fu
ndin
g to
pro
vinc
es to
repa
ir th
e da
mag
e to
hou
sing
for l
ow-in
com
e ho
useh
olds
follo
win
g a
disa
ster
or h
ousi
ng
emer
genc
y if
the
cost
s of r
epai
rs a
re le
ss th
an th
e co
st o
f rel
ocat
ion
and
prov
isio
n of
tem
pora
ry sh
elte
r.
17

MEMORANDUM ON THE OBJECTS OF THE DIVISION OFREVENUE SECOND AMENDMENT BILL, 2020
1. BACKGROUND
1.1 Section 214(1) of the Constitution of the Republic of South Africa, 1996 (‘‘theConstitution’’), requires that an Act of Parliament be enacted to provide for—(a) the equitable division of revenue raised nationally among the national,
provincial and local spheres of government;(b) the determination of each province’s equitable share of the provincial
share of that revenue; and(c) any other allocations to provinces, local government or municipalities
from the national government’s share of that revenue, and any conditionson which those allocations may be made.
1.2 Section 12(4) of the Money Bills and Related Matters Act, 2009 (Act No. 9 of2009), requires the Minister of Finance to table a division of revenueamendment Bill with a revised fiscal framework if the adjustments budgeteffects changes to the Division of Revenue Act, 2020 (Act No. 4 of 2020)(‘‘the DoRA’’), as amended by the Division of Revenue Amendment Act,2020 (Act No. 10 of 2020), for the relevant financial year. As the adjustmentsbudget for 2020/21 effects changes to the DoRA, it is necessary for theDivision of Revenue Second Amendment Bill, 2020 (‘‘the Bill’’) to be tabledwith the revised fiscal framework.
1.3 The Bill is thus introduced in compliance with the requirements of theConstitution and the Money Bills and Related Matters Act, 2009.
2. SUMMARY OF BILL
2.1 Clause 1 of the Bill proposes the replacement in the DoRA of—(a) Column A of Schedule 1;(b) Column A of Schedule 2;(c) Column A of Part A of Schedule 4;(d) Column A of Part B of Schedule 4;(e) Column A of Part A of Schedule 5;(f) Column A of Part B of Schedule 5;(g) Column A of Part A of Schedule 6;(h) Column A of Part B of Schedule 6; and(i) Column A of Part A of Schedule 7.
2.2 Column A specifies the allocations for the 2020/21 financial year. Amend-ments to allocations are indicated in Column A by indicating the adjustmentand the adjusted amount. The Schedules to the Bill address the followingmatters:(a) Adjusting the equitable share among the three spheres of government;(b) changes to equitable share to provinces;(c) changes to supplementary allocations to provinces and municipalities;(d) changes to specific-purpose allocations to provinces and municipalities
for the 2020/21 financial year;(e) changes to allocations-in-kind to provinces and municipalities for
designated special programmes for the 2020/21 financial year; and(f) changes to the unallocated provisions for provinces for disaster response.
2.3 Clause 2 of the Bill contains the short title.
3. ORGANISATIONS AND INSTITUTIONS CONSULTED
The following institutions were consulted on the adjustments proposed in the Bill:
• Financial and Fiscal Commission;

• South African Local Government Association; and
• National and provincial departments.
4. FINANCIAL IMPLICATIONS TO THE STATE
This Bill is necessitated by the proposed national adjustment budget for the2020/21 financial year which affects the division of revenue between the threespheres of government. Financial implications to government are limited to thetotal transfers to provinces and local government as indicated in the Schedules tothe Bill.
5. CONSTITUTIONAL IMPLICATIONS
The Bill, in conjunction with the DoRA, seeks to give effect to section 214 of theConstitution.
6. PARLIAMENTARY PROCEDURE
6.1 The Constitution prescribes the classification of Bills. Therefore, a Bill mustbe correctly classified otherwise it will be constitutionally out of order.
6.2 The State Law Advisers and the National Treasury have considered the Billagainst the provisions of the Constitution relating to the tagging of Bills, andagainst the functional areas listed in Schedule 4 (functional areas ofconcurrent national and provincial legislative competence) and Schedule 5(functional areas of exclusive provincial legislative competence) to theConstitution.
6.3 For the purposes of tagging, the constitutional court case of Tongoane andOthers v Minister for Agriculture and Land Affairs and Others CCT 100/09[2010] Z4CC 10, confirmed the ‘‘substantial measure’’ test indicated in ExParte President of the Republic of South Africa: In re Constitutionality of theLiquor Bill. The test entailed that ‘‘any Bill whose provisions in substantialmeasure’’ fall within a specific Schedule must be classified in terms of thatSchedule.
6.4 In terms of section 76(3) of the Constitution, a Bill must be dealt with inaccordance with the procedure established by either subsection (1) orsubsection (2) if it falls within a functional area listed in Schedule 4 to theConstitution. Furthermore, in terms of section 76(4)(b) of the Constitution, aBill must be dealt with in accordance with the procedure established bysection 76(1) of the Constitution, if it provides for legislation envisaged inChapter 13 of the Constitution and includes provisions affecting the financialinterests of the provincial sphere of government.
6.5 The issue that needs to be determined is whether the proposed amendments ascontained in the Bill, in substantial measure, fall within a functional area listedin Schedule 4 to the Constitution, or whether the proposed amendments fallunder section 76(4)(b) of the Constitution.
6.6 The Bill seeks to amend the DoRA in accordance with section 12(4) of theMoney Bills and Related Matters Act, 2009, which provides that the Ministermust table a division of revenue amendment Bill with the revised fiscalframework if the adjustments budget effects changes to the Division ofRevenue Act for the relevant year.
6.7 The provisions of the Bill have been carefully examined, and in our view, theyamount to legislation envisaged in Chapter 13 of the Constitution. Further-more, the Bill includes provisions affecting the financial interests of theprovincial sphere of government as contemplated in section 76(4)(b) of theConstitution. We are therefore of the opinion that the Bill must be dealt within accordance with the procedure envisaged by section 76(1) of theConstitution.
19

6.8 The State Law Advisers and the National Treasury are of the opinion that it isnot necessary to refer the Bill to the National House of Traditional Leaders interms of section 18(1)(a) of the Traditional Leadership and GovernanceFramework Act, 2003 (Act No. 41 of 2003), since it does not containprovisions pertaining to customary law or customs of traditional communities.
20

DIVISION OF REVENUESECOND AMENDMENT BILL
ATTACHMENTSPage
1. Annexure A: Explanatory Memorandum to the Divisionof Revenue Second Amendment Bill .............................................. 22
2. Annexure B: Frameworks for Conditional Grants to Provinces..... 28
3. Annexure C: Frameworks for Conditional Grants toMunicipalities .................................................................................. 41
4. Annexure D: Specific-Purpose Allocations to Municipalities(Schedule 5, Part B): Current Grants .............................................. 44
5. Annexure E: Infrastructure Grant Allocations to Municipalities(Schedule 4, Part B and Schedule 5, Part B) .................................. 51
6. Annexure F: Allocations-In-Kind to Municipalities(Schedule 6, Part B)......................................................................... 58
7. Appendix A to Schedule 5, Part B: Municipal InfrastructureGrant and Integrated Urban Development Grant Ring-Fenced Funding for Sports Infrastructure-Breakdown perMunicipality .................................................................................... 65
8. Appendix B to Schedule 5, Part A: Breakdown of the EarlyChildhood Development Grant: Allocations per GrantComponent per Province ................................................................. 68
9. Appendix C to Schedule 5, Part A: Breakdown of the HIV, TB,Malaria and Community Outreach Grant: Allocations per GrantComponent per Province ................................................................. 70
10. Appendix D to Schedule 5, Part A: Breakdown of StatutoryHuman Resources, Training and Development Grant:Allocations per Grant Component per Province ............................. 72
11. Appendix E to Schedule 6, Part A: Breakdown of the SchoolInfrastructure Backlogs Grant: Allocations per Province ............... 74
12. Appendix F to Schedule 6, Part A: Breakdown of the NationalHealth Insurance Indirect Grant: Allocations per GrantComponent per Province ................................................................. 76
21

A
Explanatory memorandum to the Division of Revenue Second Amendment Bill
Background The allocation of resources to the three spheres of government is a critical step in the budget process, required before national government, the nine provinces and 257 municipalities can determine their own budgets. The allocation process takes into account the powers and functions assigned to the three spheres of government. The process for making this decision is at the heart of cooperative governance as envisaged in the Constitution. To foster transparency and ensure smooth intergovernmental relations, section 214(1) of the Constitution requires that every year a Division of Revenue Act determine the equitable division of nationally-raised revenue between the three spheres of government. The Intergovernmental Fiscal Relations Act, 1997, prescribes the process for determining the equitable sharing and allocation of revenue raised nationally.
This Division of Revenue Second Amendment Bill, 2020, (“the Bill”) fulfils the requirement set out in section 12(4) of the Money Bills and Related Matters Act, 2009 (Act 9 of 2009), that the Minister of Finance must table a division of revenue amendment Bill with the revised fiscal framework if the adjustments budget effects changes to the Division of Revenue Act for the relevant year. Section 10(5) of the Intergovernmental Fiscal Relations Act requires that the Division of Revenue Bill must be accompanied by an explanatory memorandum detailing how the Bill takes account of the matters listed in sections 214(2)(a) to (j) of the Constitution; government’s response to the recommendations of the Financial and Fiscal Commission (FFC); and any assumptions and formulae used in arriving at the respective divisions among provinces and municipalities. As the FFC’s recommendations are specific to the main budget and none of the formulae used in the Division of Revenue Act, 2020, (Act 4 of 2020) have been changed, this explanatory memorandum only contains three parts:
Part 1 describes the factors that inform the division of resources between the three spheres of government.
Part 2 describes the proposed amendments to the Division of Revenue Act, 2020, as amended by the Division of Revenue Amendment Act (Act 10 of 2020) and their impact on the different spheres of government.
Part 3 describes changes to the frameworks and detailed allocations per province and municipality that have been gazetted in terms of section 16(1) of the Division of Revenue Act, 2020, as amended by the Division of Revenue Amendment Act (Act 10 of 2020). The changes are submitted to parliament for consideration as envisaged in sections 16(2) and 16(4) of the Division of Revenue Act, 2020.
The Division of Revenue Second Amendment Bill, 2020, and its underlying allocations are the culmination of extensive consultation processes between national, provincial and local government. The Budget Council and Local Government Budget Forum deliberated on the matters discussed in this memorandum. The approach to local government allocations has been discussed with organised local government
22
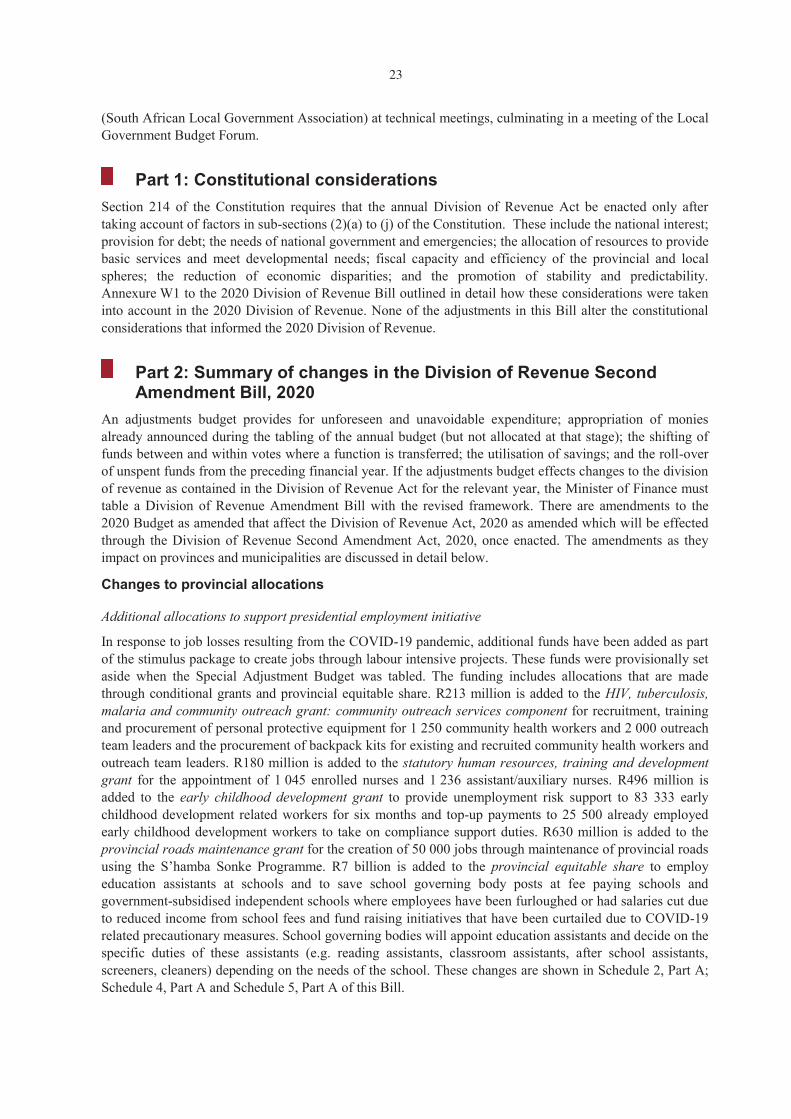
(South African Local Government Association) at technical meetings, culminating in a meeting of the Local Government Budget Forum.
Part 1: Constitutional considerations Section 214 of the Constitution requires that the annual Division of Revenue Act be enacted only after taking account of factors in sub-sections (2)(a) to (j) of the Constitution. These include the national interest; provision for debt; the needs of national government and emergencies; the allocation of resources to provide basic services and meet developmental needs; fiscal capacity and efficiency of the provincial and local spheres; the reduction of economic disparities; and the promotion of stability and predictability. Annexure W1 to the 2020 Division of Revenue Bill outlined in detail how these considerations were taken into account in the 2020 Division of Revenue. None of the adjustments in this Bill alter the constitutional considerations that informed the 2020 Division of Revenue.
Part 2: Summary of changes in the Division of Revenue Second Amendment Bill, 2020
An adjustments budget provides for unforeseen and unavoidable expenditure; appropriation of monies already announced during the tabling of the annual budget (but not allocated at that stage); the shifting of funds between and within votes where a function is transferred; the utilisation of savings; and the roll-over of unspent funds from the preceding financial year. If the adjustments budget effects changes to the division of revenue as contained in the Division of Revenue Act for the relevant year, the Minister of Finance must table a Division of Revenue Amendment Bill with the revised framework. There are amendments to the 2020 Budget as amended that affect the Division of Revenue Act, 2020 as amended which will be effected through the Division of Revenue Second Amendment Act, 2020, once enacted. The amendments as they impact on provinces and municipalities are discussed in detail below.
Changes to provincial allocations
Additional allocations to support presidential employment initiative
In response to job losses resulting from the COVID-19 pandemic, additional funds have been added as part of the stimulus package to create jobs through labour intensive projects. These funds were provisionally set aside when the Special Adjustment Budget was tabled. The funding includes allocations that are made through conditional grants and provincial equitable share. R213 million is added to the HIV, tuberculosis, malaria and community outreach grant: community outreach services component for recruitment, training and procurement of personal protective equipment for 1 250 community health workers and 2 000 outreach team leaders and the procurement of backpack kits for existing and recruited community health workers and outreach team leaders. R180 million is added to the statutory human resources, training and development grant for the appointment of 1 045 enrolled nurses and 1 236 assistant/auxiliary nurses. R496 million is added to the early childhood development grant to provide unemployment risk support to 83 333 early childhood development related workers for six months and top-up payments to 25 500 already employed early childhood development workers to take on compliance support duties. R630 million is added to the provincial roads maintenance grant for the creation of 50 000 jobs through maintenance of provincial roads using the S’hamba Sonke Programme. R7 billion is added to the provincial equitable share to employ education assistants at schools and to save school governing body posts at fee paying schools and government-subsidised independent schools where employees have been furloughed or had salaries cut due to reduced income from school fees and fund raising initiatives that have been curtailed due to COVID-19 related precautionary measures. School governing bodies will appoint education assistants and decide on the specific duties of these assistants (e.g. reading assistants, classroom assistants, after school assistants, screeners, cleaners) depending on the needs of the school. These changes are shown in Schedule 2, Part A; Schedule 4, Part A and Schedule 5, Part A of this Bill.
23

Addition for assistance with food relief
R500 million is added to the provincial equitable share for providing food relief in response to the impact of COVID-19 to mitigate the adverse effects of hunger. This change is shown in Schedule 2, Part A of this Bill.
Roll-over for school infrastructure backlogs grant
R475 million is rolled over for the school infrastructure backlogs grant for the completion of projects that are part of the Sanitation Appropriate for Education (SAFE) initiative, which deals with the replacement and removal of inappropriate and unsuitable sanitation, including pit toilets, at schools. The funds are for schools in Eastern Cape, KwaZulu-Natal and Limpopo. This change is shown in Schedule 6, Part A of this Bill.
Reductions to provincial conditional grants
In terms of the rescue plan for South African Airways, R10.5 billion is required for this purpose. The reductions are made uniformly across programmes falling within national departments, these include provincial conditional grants. There will be no reductions made to the provincial equitable share for this purpose. With respect to the reductions to conditional grants, these are made proportionately across provinces as much as possible. Provincial conditional grants are reduced by R1.3 billion, made up of:
R56 million is reduced from the national tertiary services grant. This change is shown in Schedule 4, Part A of this Bill.
R14 million is reduced from community library services grant. R14 million is reduced from the comprehensive agricultural support programme grant. R52 million is reduced from the health facility revitalisation grant. R224 million is reduced from the HIV, TB, malaria and community outreach grant. R5 million is reduced from the ilima/letsema projects grant. R980 000 is reduced from the land care programme grant. R4 million is reduced from the mass participation and sport development grant. R42 million is reduced from the national health insurance grant. R26 million is reduced from the statutory human resources, training and development grant. R37 million is reduced from the title deeds restoration grant. These changes are shown in Schedule 5, Part A of this Bill.
R336 million is reduced from the school infrastructure backlogs grant. R240 million is reduced from the national health insurance: indirect grant. These changes are shown in Schedule 6, Part A of this Bill.
R273 million is reduced from the provincial emergency housing grant. This change is shown in Schedule 7, Part A of this Bill.
Reduction to the provincial equitable share
R25.3 billion is reduced from the provincial equitable share. This is because reductions were not included in the calculations of the allocations to provincial government at the time the budget was tabled. This is part of the reduction of R160 billion to the growth of the public-service wage bill that was announced in the Budget tabled in February 2020. This change is shown in Schedule 2, Part A of the Bill.
24

R thousands
Eastern Cape 1 190 680 66 279 -3 476 922 -2 219 963Free State 411 622 27 853 -1 522 743 -1 083 268Gauteng 1 085 722 104 216 -4 997 729 -3 807 790KwaZulu-Natal 1 424 238 103 506 -5 362 154 -3 834 410Limpopo 987 826 57 848 -3 075 616 -2 029 942Mpumalanga 490 893 40 943 -1 999 519 -1 467 683Northern Cape 148 277 13 228 -702 001 -540 496North West 445 251 34 846 -1 720 521 -1 240 424Western Cape 814 291 51 281 -2 396 103 -1 530 532
Total 6 998 800 500 000 -25 253 307 -17 754 507
Source: National Treasury
Presidential Employment
Initiative
Total change Food relief Public service wage bill
Table A.1 Breakdown of provincial equitable share changes, 2020/21
Additional allocations to provinces for the Presidential Employment Initiative for the education sector are determined in terms of the applications received, food relief is determined in line with the provincial equitable share formula, while the provincial reductions for public service wage bill are determined in line with the individual personnel expenditure in the provinces.
Changes to local government allocations
Roll-over of funds
R390 million is rolled over in the urban settlements development grant to fund commitments for bulk infrastructure related projects in Nelson Mandela Bay Metropolitan Municipality. R98 million is rolled over in the public transport network grant to continue with the rollout of the integrated public transport network (IPTN) for public and non-motorised infrastructure in Nelson Mandela Bay Metropolitan Municipality. R307 million is rolled over in the regional bulk infrastructure grant for drought and COVID-19 water and sanitation interventions nation-wide. These changes are shown in Schedule 4, Part B; Schedule 5, Part B and Schedule 6, Part B of this Bill.
Additional allocation for the water services infrastructure grant
R12 million has been reprioritised from the department’s budget into the indirect component of the water services infrastructure grant for implementation of various water services interventions. This change is shown in Schedule 6, Part B of this Bill.
Reductions to municipal conditional grants
In terms of the rescue plan for South African Airways, R10.5 billion is required for this purpose. The reductions are made uniformly across programmes falling within national departments, these include local government conditional grants. There will be no reductions made to the local government equitable share for this purpose. With respect to the reductions to conditional grants, these are made proportionately across municipalities as much as possible. Local government conditional grants are reduced by R613 million, made up of:
R4 million is reduced from the integrated city development grant. This change is shown in Schedule 4, Part B of this Bill.
R2 million is reduced from the infrastructure skills development grant. R12 million is reduced from the integrated urban development grant. R180 million is reduced from the municipal infrastructure grant. R12 million is reduced from the neighbourhood development partnership grant. R253 million is reduced from the public transport network grant. R78 million is reduced from water services infrastructure grant. These changes are shown in Schedule 5, Part B of this Bill.
25
R18 million is reduced from the integrated national electrification programme (Eskom) grant. R55 million is reduced from regional bulk infrastructure grant. These changes are shown in Schedule 6, Part B of this Bill.
Part 3: Changes to gazetted frameworks and allocations Together with the tabling of the Division of Revenue Second Amendment Bill, 2020, National Treasury also submits to Parliament proposed changes to gazetted conditional grant frameworks and allocations. Section 16(4) of the Division of Revenue Act, 2020, requires National Treasury to consult Parliament on any proposed changes to a conditional grant framework for the purposes of correcting an error or omission, as envisaged in Section 16(2) of the Division of Revenue Act, 2020.
The proposed changes to conditional grant frameworks are described below and the revised frameworks and detailed allocations are included in the annexures and appendices to the Division of Revenue Second Amendment Bill, 2020. While these changes do not form part of the Bill, Parliament is requested to consider them in terms of the process set out in Section 16(4) of the Division of Revenue Act, 2020. Proposed changes to gazetted allocation appendixes that provide further details of grant allocations are also included here.
Additional conditions attached to the approval of Presidential Employment Initiative
The grant frameworks for the HIV, tuberculosis, malaria and community outreach grant, statutory human resources, training and development grant, early childhood development grant and provincial roads maintenance grant are amended to include the conditions attached to the approval of the Presidential Employment Initiative. The conditions include:
Transferring officers to monitor the progress in the implementation of the interventions, considering the progress reports submitted by the receiving officers on a monthly basis.
Transferring officers to report monthly on progress to the Presidency.
One month after the receipt of the allocations, receiving officers to provide a detailed breakdown to the relevant transferring officer, Presidency and National Treasury of the components funded through the allocation.
Receiving officers to report on the expenditure of the funds in line with the requirements in section 11 and section 12 of the Division of Revenue Act (DoRA), 2020, and the gazetted frameworks for the relevant grant.
HIV, tuberculosis, malaria and community outreach grant
The grant framework for the HIV, tuberculosis, malaria and community outreach grant: community outreach services component is amended to ring-fence the additional funds allocated for the Presidential Employment Initiative.
Statutory human resources, training and development grant
The grant framework for the statutory human resources, training and development grant is amended to make provision for the appointment of enrolled nurses and auxiliary nurses as part of the presidential employment programme. The conditional grant framework currently caters for the training of health science professionals and the hiring of community service posts and does not cater for the hiring of other positions. The grant framework is further amended to make corrections for allocations earmarked in the training and developmental component. The allocations were incorrectly captured due to a rounding error for Mpumalanga and North West.
Early childhood development grant
The framework for the early childhood development grant is amended to include conditions to allow for spending of the ring-fenced additional funds allocated for the Presidential Employment Initiative.
26

Provincial roads maintenance grant
The grant framework for the provincial roads maintenance grant is amended to ring-fence the additional funds allocated for the Presidential Employment Initiative.
National health insurance indirect grants
The grant framework for the national health indirect grant: health facility revitalisation component is amended to correct for an allocation earmarked for Limpopo Academic Hospital. The allocation is being corrected from R653 million to R454 million, as R198 million was shifted to the health facility revitalisation grant during the February 2020 Budget.
Rural roads asset management systems grant
The grant framework for the rural roads asset management systems grant is amended to correct for the due date of the submission of road condition data that was erroneously captured as 31 September 2020 instead of 30 September 2020. This correction is needed as 31 September 2020 does not exist in the calendar.
Changes to gazetted allocations
To correct allocations for ring-fenced sport projects in the municipal infrastructure grant, R25 million is proposed to be shifted to Polokwane Local Municipality from Musina Local Municipality and R9 million is proposed to be shifted to Swellendam Local Municipality from Mossel Bay Local Municipality. The amounts for each project are corrected in the gazetted list of the municipal infrastructure grant ring-fenced funding for sport infrastructure and allocations in the municipal infrastructure grant. This correction will ensure that sufficient funds are made available to complete planned sport infrastructure projects in all the affected municipalities.
Details per municipality of the changes to allocations for the integrated city development grant, urban settlements development grant, integrated urban development grant, municipal infrastructure grant, neighbourhood development partnership grant, public transport network grant, water services infrastructure grant, integrated national electrification programme (Eskom) grant and regional bulk infrastructure grant that have been described in parts 2 and 3 of this memorandum will be gazetted. These changes per municipality are shown in annexures D, E and F.
Details of the changes per provincial department for allocations for the early childhood development grant, HIV, TB, malaria and community outreach grant, statutory human resources, training and development grant, national health insurance indirect grant and school infrastructure backlogs grant are shown in Appendices B, C, D, E and F.
27

Annexure B: Frameworks for Conditional Grants
to Provinces Detailed frameworks on Schedule 4, Part A; Schedule 5, Part A; and Schedule 6, Part A grants to provinces Introduction This annexure provides the revised frameworks for the grants set out in Part A of Schedule 4, 5, and 6 of the 2020 Division of Revenue Second Amendment Bill. The following are key areas considered for each grant:
Strategic goal and purpose of the grant Outcome statements and outputs of the grant Priority outcome(s) of government that the grant primarily contributes to Conditions of the grant (additional to what is required in the Bill) Criteria for allocation between provinces Rationale for funding through a conditional grant Past performance The projected life of the grant 2020 MTEF allocations The payment schedule Responsibilities of transferring national department and receiving provincial departments Process for approval of business plans for 2021/22
The attached frameworks are not part of the Division of Revenue Second Amendment Bill, but are published in order to provide more information on each grant to parliament, legislatures, municipal councils, officials in all three spheres of government and the public. Once the 2020 Division of Revenue Second Amendment Bill is enacted, these frameworks will be gazetted.
The financial statements and annual reports for 2020/21 will report against the Division of Revenue Act, Division of Revenue Amendment Act, Division of Revenue Second Amendment Act and their schedules, and the grant frameworks as gazetted in terms of the Act. Such reports must cover both financial and non-financial performance, focusing on the outputs achieved.
28

HEALTH GRANTS HIV, TB, Malaria and Community Outreach Grant: Community Outreach Services Component
Transferring department Health (Vote 18) Grant schedule Schedule 5, Part A Strategic goal To improve access to community based primary care services through Ward Based Primary Health Care
Outreach Teams (WBPHCOTs) Grant purpose To ensure provision of quality community outreach services through WBPHCOTs by ensuring Community
Health Workers (CHWs) receive remuneration, tools of trade and training To improve efficiencies of the WBPHCOT programme by harmonising and standardising services and
strengthening performance monitoring Outcome statements Improved access to quality primary care services at community level with a focus on preventive and
promotive care, screening for health conditions and referral for relevant services Outputs Number of community health workers receiving a stipend
Number of community health workers trained Number of outreach team leaders trained Number of HIV defaulters traced Number of TB defaulters traced
Priority of government that this grant primarily contributes to
Priority 2: Education, skills and health
Details contained in the business plan
Output indicators Milestones with projected dates when these will be achieved Description of how the project will be managed including roles and responsibilities of national and provincial
departments Key activities and resource schedule Cash flow projections
Conditions The grant must be used for the implementation of the WBPHCOTs Policy Framework and Strategy A business plan must be completed and signed-off by the receiving officer and submitted to the transferring
officer by 28 February 2020 and signed by the transferring officer and submitted to the National Treasury by 30 March 2020
All contracted non-governmental organisations receiving funding from this grant must have a service level agreement with the relevant provincial department of health including performance indicators
Provinces that have contracted non-governmental organisations for the programme should make transfer payments as per the stipulations of section 8.4 of the Treasury Regulations and section 38(1)(j) of the Public Finance Management Act
To respond to the COVID-19 pandemic, funds may be used for COVID-19 screening and contact tracing Provinces must report separately on COVID-19 expenditure in their reports submitted in terms of the
requirements of section 12 of the Division of Revenue Act Presidential Employment Initiative No administration costs may be funded from this component Transferring officers to report monthly on progress to the Presidency in line with reporting requirements
established by the Presidency R213 million in 2020/21 is earmarked for the activities planned under the Presidential Employment
Initiative. The allocations are as follows: o Eastern Cape: R34 million o Free State: R14 million o KwaZulu-Natal: R56 million o Limpopo: R31 million o Mpumalanga: R23 million o Northern Cape: R6 million o North West: R20 million o Western Cape: R29 million
Allocation criteria Allocations are based on the existing number of CHWs providing community-based services in all provinces Reasons not incorporated in equitable share
Community outreach services are a national priority that require systematic, focused implementation and monitoring in order to achieve the desired outputs, outcomes and impact on defined health indicators
Past performance 2018/19 audited financial outcome Of the R1.5 billion made available, R1.5 billion was transferred to provinces (100 per cent), of which
R1.5 billion (100 per cent) was spent by provinces 2018/19 service delivery performance 2855 functional WBPHCOTs 46328 CHWs receiving stipends 1154 outreach team leaders employed 12514 TB defaulters traced 40422 HIV defaulters traced
Projected life Subject to policy developments that will be finalised as part of the implementation of National Health Insurance
MTEF allocations 2020/21: R2.6 billion; 2021/22: R2.6 billion and 2022/23: R2.7 billion Payment schedule Monthly instalments based on the approved payment schedule
29

HIV, TB, Malaria and Community Outreach Grant: Community Outreach Services Component Responsibilities of the transferring officer and receiving officer
Responsibilities of the national department Manage, monitor and support community outreach services planning and implementation Visit provinces twice a year to monitor implementation and provide support Report to the National Treasury on indicators agreed upon between the two departments Meet with National Treasury to review grant performance on a quarterly basis DoH must report separately on COVID-19 expenditure, in its reports submitted in terms of the requirements
of section 10 of the Division of Revenue Act and must share these reports with the National Disaster Management Centre
Responsibilities of provincial departments Completion of the business plan, in the prescribed format, signed by each receiving officer (provincial
department) by 28 February 2020 Quarterly performance output reports to be submitted within 30 days following the reporting period using
standard formats as determined by the national Department of Health. Submit an electronic version, which will be followed by a hard copy signed by the provincial grant receiving manager
Clearly indicate measurable objectives and performance targets as agreed to between the national department and provincial departments, in the provincial departmental business plan for 2020/21 and over the medium-term expenditure framework
Provide a list of contracted non-governmental organisations that will provide services Provincial departments must provide the national Department of Health with full and unrestricted access to
all records and data related to the programme and must facilitate the achievement of grant outputs Include the indicators in the provincial annual performance plans and ensure compliance with the Division
of Revenue Act Ensure that all national indicator data set indicators related to CHWs are entered into the district health
information system and that there is accordance between the metrics in the district health information system and the Division of Revenue Act reporting for COS
COS component to be managed as part of the HIV TB, Community Outreach Services and Malaria Grant by the provincial grant manager; however, each province must assign an official to manage the Community Outreach Services component to ensure accountability and reporting on COS financial and non-financial output indicators
Record and report COS component expenditure separately from the HIV, TB, Community Outreach Services and Malaria grant (create an appropriate category in the fund segment on the Basic Accounting System)
Process for approval of 2021/22 business plans
Submission of draft business plans to the national Department of Health by 30 October 2020 Submission of final business plans to the national Department of Health by 26 February 2021 Submission of final business plans to the National Treasury by 31 March 2021
30

National Health Insurance Indirect Grant: Health Facility Revitalisation Component Transferring department Health (Vote 18) Grant schedule Schedule 6, Part A Strategic goal To ensure appropriate health infrastructure that is in line with national and provincial policy objectives Grant purpose To create an alternative track to improve spending, performance as well as monitoring and evaluation on
infrastructure in preparation for National Health Insurance (NHI) To enhance capacity and capability to deliver infrastructure for NHI To accelerate the fulfilment of the requirements of occupational health and safety
Outcome statements Appropriate procurement of service providers for infrastructure delivery for NHI Improved spending, performance, monitoring and evaluation of infrastructure projects for NHI Improved employment and skills development in the delivery of infrastructure for NHI Value for money and cost-effectively designed facilities in line with the Framework for Infrastructure
Delivery and Procurement Management (FIDPM) Improved patient experience of care
Outputs Number of PHC facilities constructed or revitalised Number of hospitals constructed or revitalised Number of facilities maintained, repaired and/or refurbished
Priority of government that this grant primarily contributes to
Priority 2: Education, skills and health
Details contained in the business plan
The infrastructure programme management plan (IPMP) for the 2019 medium term expenditure framework (MTEF) aligned to the infrastructure delivery management system and FIDPM will be submitted on 28 May 2020 and will include the following: o costed project lists with annual cash flow projections per project for the full duration of the projects on
the programme o projected milestones per project for FIDPM control framework stages indicating current stage of the
project Conditions
The national Department of Health (DoH) must, in consultation with the provinces, have in place an intergovernmental protocol framework covering the 2019 MTEF and outlining how the grant will operate as well as the responsibility and functions of each sphere. Project sheets will form part of the agreement
Should there be an amendment to an existing protocol agreement, the amended agreement should be submitted to the National Treasury by 29 June 2020
Prior to submitting the IPMP, each provincial department must have signed-off a project sheet for all projects funded from the grant which lists scope of work, current stage and anticipated target dates for achieving stages of the control framework, operational budgets (i.e. personnel, equipment, etc.) and maintenance budgets
With all new projects, DoH must comply with FIDPM processes For projects with a total project cost exceeding R500 million, DoH must notify National Treasury when
FIDPM stage 3 is reached The grant component must only be spent on projects included in the business plan and project lists signed
by provinces. Projects can only be added to the business plan as part of the adjustment budget process, subject to National Treasury approval
Appropriately qualified built environment representatives from the national department must assist in the procurement of professional service providers and contractors by its implementing agent
DoH may utilise a portion of grant funding for the appointment of public servants on 36 month contracts to their infrastructure units. The amount that can be used for this is determined in terms of the conditions set in terms of the 2020 Appropriation Act
All completed projects must have a close-out report with a documented maintenance plan New facilities will only be funded from the grant if proof of operational budget that includes the approved
organisational structure (staff structure) is submitted prior to the approval of the clinical brief. Endorsement of the operational budget by the provincial treasury must be acquired as part of the approval
The amounts earmarked for Limpopo Academic Hospital may only be used for this project and are subject to the conditions set out in Annexure B of the 2019 MTEF allocation letter of the Department of Health
Allocation criteria Allocations for 2020/21 are project based Reasons not incorporated in equitable share
Funding infrastructure through an indirect conditional grant enables the national department to ensure the delivery and maintenance of health infrastructure in a coordinated and efficient manner that is consistent with national norms, standards and guidelines for health facilities
Past performance 2018/19 audited financial outcomes Allocated R836 million of which R706 million (84 per cent) was spent by the end of the financial year
2018/19 service delivery performance 0 new facilities completed 97 facilities maintained 0 (completed) facilities upgraded, extended, renovated and refurbished
Projected life NHI is a key government priority and given the need to continually maintain health infrastructure and ensure that norms and standards are maintained, the grant will continue over the 2020 MTEF, subject to review
MTEF allocations 2020/21: R853 million, 2021/22 R1.5 billion and 2022/23: R1.6 billion, of which the following amounts are earmarked for the Limpopo Academic Hospital (LAH) project: o 2020/21: R454 million, 2021/22: R488 million and 2022/23: R511 million
Payment schedule Monthly payments made according to verified and approved invoices from the services providers
31

National Health Insurance Indirect Grant: Health Facility Revitalisation Component Responsibilities of the transferring officer and receiving officer
Responsibilities of the national department Build and demonstrate the capacity necessary to manage this grant Ensure alignment between the IPMP and the annual performance plan Undertake the infrastructure development cycle to the extent agreed with the provinces in the implementation
protocol agreements Convene progress review committees with appropriate reporting and invite National Treasury and Provinces DoH must maintain an up-to-date database (project management information system), infrastructure
reporting model (IRM) with all contracts that are fully or partially funded by this grant and provide the IRM report on a monthly basis
Meet with National Treasury to review grant performance on a quarterly basis Collaboration and coordination with provincial departments of health for the full development cycle of
infrastructure development in respect of projects funded by this grant In instances where the capacity of the DoH and the provincial department are deemed insufficient, DoH is
entitled to engage alternative implementing agents, provided that supply chain management processes as prescribed in the Treasury Regulations for the appointment of service providers are followed. In those cases, service level agreements between DoH and the implementing agent must be in place
DoH must convene quarterly progress review committee meetings with all project managers, implementing agents and National Treasury for monitoring and oversight of the performance of all funded projects
Provide provincial departments of health with progress of the projects under this grant for inclusion in provincial annual reports
DoH must submit quarterly infrastructure reports to National Treasury, according to the agreed template between National Treasury and DoH, within 45 days after the end of each quarter
Responsibilities of provincial departments Provinces must ensure that the completed projects are included in the asset registers of the provincial
departments of public works Provinces should undertake life cycle maintenance as well as the full operation, staffing and management of
the projects in facilities completed under this grant by the DoH All immovable asset management and maintenance responsibilities of the completed projects under this
grant as prescribed by the Government Immovable Asset Management Act of 2007 rests with the provinces Provinces should report on progress of the projects under this grant in their annual reports and describe how
these facilities have been considered in their future planning and budgeting. The projects must be included in the provincial user-asset management plans
Process for approval of 2021/22 business plans
Submission of a draft IPMP to the National Treasury by 31 August 2020 Submission of the final IPMP to the National Treasury by 31 March 2021 Submission of signed implementation protocol by 25 June 2021
32

Statutory Human Resources, Training and Development Grant Transferring department Health (Vote 18) Grant schedule Schedule 5, Part A Strategic goal To contribute to the implementation of the national human resource plan for health through the clinical
training and supervision of health science trainees in designated public health facilities in South Africa Effective implementation of the human resources for health strategy, and health workforce capacity
development for sustainable service delivery Grant purpose To appoint statutory positions in the health sector for systematic realisation of the human resources for health
strategy and the phase-in of National Health Insurance Support provinces to fund service costs associated with clinical training and supervision of health science
trainees on the public service platform Outcome statements Progressive realisation of the national human resource plan for health
Clinical training and supervision capacity established in designated developmental provinces (Northern Cape, North West, Limpopo, Mpumalanga and Eastern Cape)
Enhanced access to healthcare services, by addressing critical skills shortages in underserved communities Outputs Number and percentage of statutory posts funded from this grant (per category and discipline) and other
funding sources Number and percentage of registrars posts funded from this grant (per discipline) and other funding sources Number and percentage of specialists posts funded from this grant (per discipline) and other funding sources Number of posts needed per funded category Number of nursing cadres funded from the grant as part of Presidential Employment Initiative
Priority of government that this grant primarily contributes to
Priority 2: Education, skills and health
Details contained in the business plan
Non-financial business plan – number of specialists, registrars, medical officers, clinical supervisors/tutors per category in nursing, emergency medical services, allied health, pharmacy and grant administration staff funded from the grant
Financial business plan – allocation by economic classification to each category of clinical trainer/supervisor Conditions Submission of an approved business plan in the prescribed format signed by the provincial Head of
Department to the national Department of Health by 28 February 2020, and to the National Treasury by 31 March 2020
Cost of administration of the grant must not exceed 1 per cent of the total grant allocation This grant has two components
Statutory Human Resources Component The statutory human resources component must only be utilised for funding of statutory posts, except for an
amount of R180.2 million which is allocated for appointment of nurses as part of Presidential Employment Initiative
Training and Development Component The training and development component must prioritise all registrar posts and the balance of the allocation
may be utilised for specialist (supervisors) and other approved categories A total of R16 million has been allocated for the developmental portion and the breakdown per province is
as follows: o Eastern Cape: R5 million o Limpopo: R3 million o Mpumalanga: R3 million o Northern Cape: R2 million o North West: R3 million
The developmental allocation will be withheld and transferred to other developmental provinces if a province fails to spend these funds. Developmental allocations are only applicable to the training and development component
Funds for the Presidential Employment Initiative have been allocated as follows: o Eastern Cape: R25 million o Free State: R10 million o Gauteng: R47 million o KwaZulu-Natal: R41 million o Limpopo: R23 million o Mpumalanga: R16 million o Northern Cape: R4 million o North West: R14 million
Transferring officers to report monthly on progress to the Presidency in line with reporting requirements established by the Presidency
Allocation criteria Training and development component is based on historical allocations and spending patterns Statutory Human Resources component allocations are based on the following criteria: o provinces with greatest needs have been prioritised o number of statutory posts o future projections of professional production versus need
Reasons not incorporated in equitable share
Provinces give effect to the national human resource strategy through the clinical training and supervision of health science trainees on the public health service platform
33
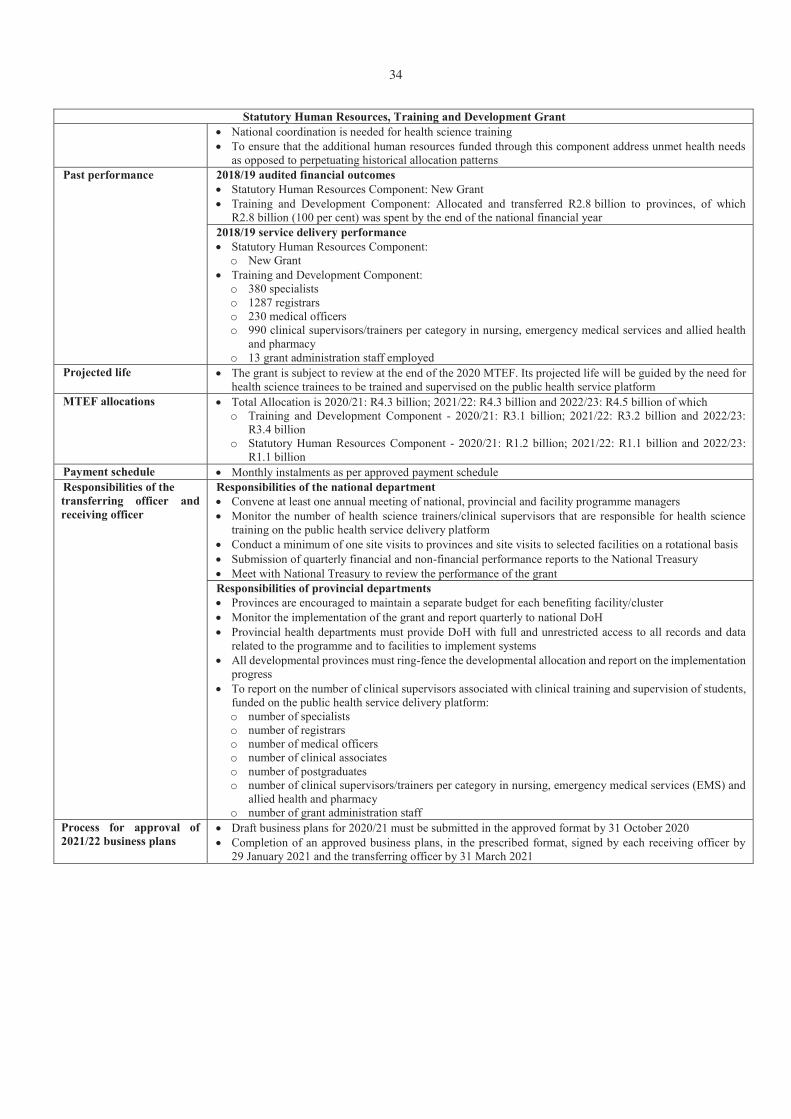
Statutory Human Resources, Training and Development Grant National coordination is needed for health science training To ensure that the additional human resources funded through this component address unmet health needs
as opposed to perpetuating historical allocation patterns Past performance 2018/19 audited financial outcomes
Statutory Human Resources Component: New Grant Training and Development Component: Allocated and transferred R2.8 billion to provinces, of which
R2.8 billion (100 per cent) was spent by the end of the national financial year 2018/19 service delivery performance Statutory Human Resources Component: o New Grant
Training and Development Component: o 380 specialists o 1287 registrars o 230 medical officers o 990 clinical supervisors/trainers per category in nursing, emergency medical services and allied health
and pharmacy o 13 grant administration staff employed
Projected life The grant is subject to review at the end of the 2020 MTEF. Its projected life will be guided by the need for health science trainees to be trained and supervised on the public health service platform
MTEF allocations Total Allocation is 2020/21: R4.3 billion; 2021/22: R4.3 billion and 2022/23: R4.5 billion of which o Training and Development Component - 2020/21: R3.1 billion; 2021/22: R3.2 billion and 2022/23:
R3.4 billion o Statutory Human Resources Component - 2020/21: R1.2 billion; 2021/22: R1.1 billion and 2022/23:
R1.1 billion Payment schedule Monthly instalments as per approved payment schedule Responsibilities of the transferring officer and receiving officer
Responsibilities of the national department Convene at least one annual meeting of national, provincial and facility programme managers Monitor the number of health science trainers/clinical supervisors that are responsible for health science
training on the public health service delivery platform Conduct a minimum of one site visits to provinces and site visits to selected facilities on a rotational basis Submission of quarterly financial and non-financial performance reports to the National Treasury Meet with National Treasury to review the performance of the grant
Responsibilities of provincial departments Provinces are encouraged to maintain a separate budget for each benefiting facility/cluster Monitor the implementation of the grant and report quarterly to national DoH Provincial health departments must provide DoH with full and unrestricted access to all records and data
related to the programme and to facilities to implement systems All developmental provinces must ring-fence the developmental allocation and report on the implementation
progress To report on the number of clinical supervisors associated with clinical training and supervision of students,
funded on the public health service delivery platform: o number of specialists o number of registrars o number of medical officers o number of clinical associates o number of postgraduates o number of clinical supervisors/trainers per category in nursing, emergency medical services (EMS) and
allied health and pharmacy o number of grant administration staff
Process for approval of 2021/22 business plans
Draft business plans for 2020/21 must be submitted in the approved format by 31 October 2020 Completion of an approved business plans, in the prescribed format, signed by each receiving officer by
29 January 2021 and the transferring officer by 31 March 2021
34
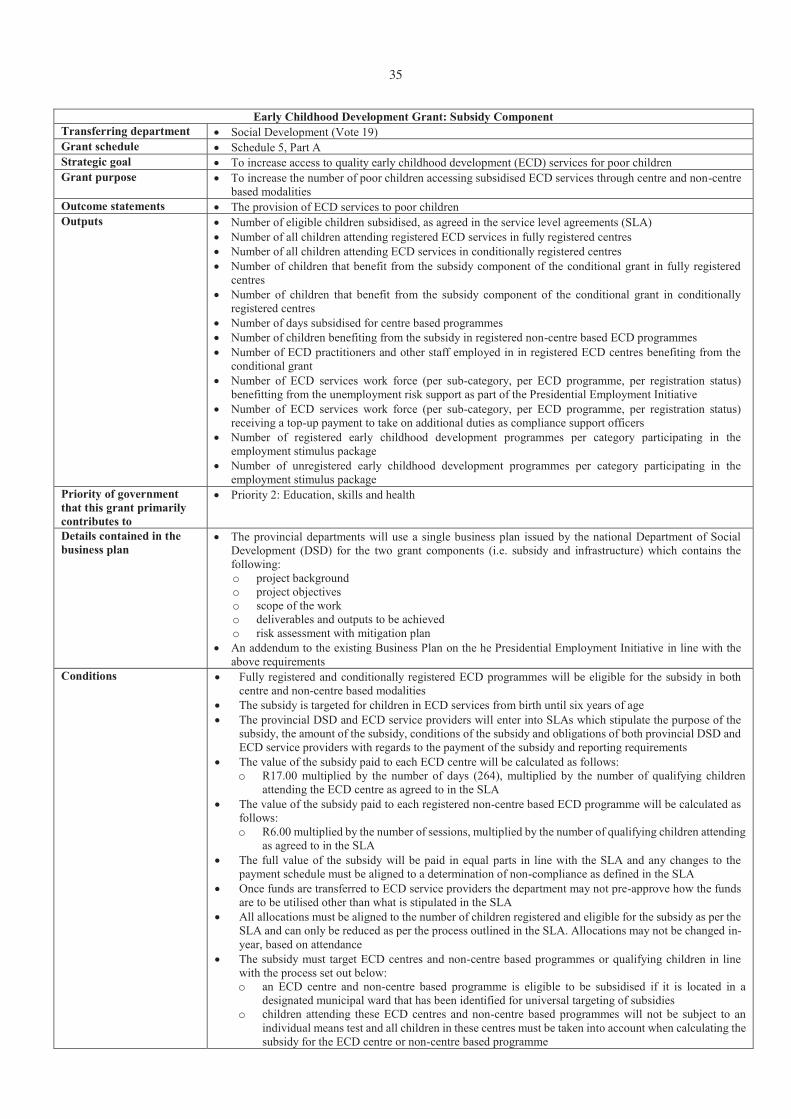
Early Childhood Development Grant: Subsidy Component Transferring department Social Development (Vote 19) Grant schedule Schedule 5, Part A Strategic goal To increase access to quality early childhood development (ECD) services for poor children Grant purpose To increase the number of poor children accessing subsidised ECD services through centre and non-centre
based modalities Outcome statements The provision of ECD services to poor children Outputs Number of eligible children subsidised, as agreed in the service level agreements (SLA)
Number of all children attending registered ECD services in fully registered centres Number of all children attending ECD services in conditionally registered centres Number of children that benefit from the subsidy component of the conditional grant in fully registered
centres Number of children that benefit from the subsidy component of the conditional grant in conditionally
registered centres Number of days subsidised for centre based programmes Number of children benefiting from the subsidy in registered non-centre based ECD programmes Number of ECD practitioners and other staff employed in in registered ECD centres benefiting from the
conditional grant Number of ECD services work force (per sub-category, per ECD programme, per registration status)
benefitting from the unemployment risk support as part of the Presidential Employment Initiative Number of ECD services work force (per sub-category, per ECD programme, per registration status)
receiving a top-up payment to take on additional duties as compliance support officers Number of registered early childhood development programmes per category participating in the
employment stimulus package Number of unregistered early childhood development programmes per category participating in the
employment stimulus package Priority of government that this grant primarily contributes to
Priority 2: Education, skills and health
Details contained in the business plan
The provincial departments will use a single business plan issued by the national Department of Social Development (DSD) for the two grant components (i.e. subsidy and infrastructure) which contains the following: o project background o project objectives o scope of the work o deliverables and outputs to be achieved o risk assessment with mitigation plan
An addendum to the existing Business Plan on the he Presidential Employment Initiative in line with the above requirements
Conditions Fully registered and conditionally registered ECD programmes will be eligible for the subsidy in both centre and non-centre based modalities
The subsidy is targeted for children in ECD services from birth until six years of age The provincial DSD and ECD service providers will enter into SLAs which stipulate the purpose of the
subsidy, the amount of the subsidy, conditions of the subsidy and obligations of both provincial DSD and ECD service providers with regards to the payment of the subsidy and reporting requirements
The value of the subsidy paid to each ECD centre will be calculated as follows: o R17.00 multiplied by the number of days (264), multiplied by the number of qualifying children
attending the ECD centre as agreed to in the SLA The value of the subsidy paid to each registered non-centre based ECD programme will be calculated as
follows: o R6.00 multiplied by the number of sessions, multiplied by the number of qualifying children attending
as agreed to in the SLA The full value of the subsidy will be paid in equal parts in line with the SLA and any changes to the
payment schedule must be aligned to a determination of non-compliance as defined in the SLA Once funds are transferred to ECD service providers the department may not pre-approve how the funds
are to be utilised other than what is stipulated in the SLA All allocations must be aligned to the number of children registered and eligible for the subsidy as per the
SLA and can only be reduced as per the process outlined in the SLA. Allocations may not be changed in-year, based on attendance
The subsidy must target ECD centres and non-centre based programmes or qualifying children in line with the process set out below: o an ECD centre and non-centre based programme is eligible to be subsidised if it is located in a
designated municipal ward that has been identified for universal targeting of subsidies o children attending these ECD centres and non-centre based programmes will not be subject to an
individual means test and all children in these centres must be taken into account when calculating the subsidy for the ECD centre or non-centre based programme
35

Early Childhood Development Grant: Subsidy Component o if the child is attending an ECD centre or non-centre based programme falling outside of those
municipal wards that have been identified for universal targeting of the subsidy, the subsidy will be targeted to an individual child using the means test criteria outlined below
Income based means test: Income of parents or caregivers may not exceed the means test values applied for receipt of the child support
grant for a single parent and married parents as gazetted by national DSD in 2020. This is updated each year with the increase in the grant value
In the case of children receiving a child related social assistance grant the original, reprinted or certified copies of proof of receipt of the child related grant (child support grant or the foster care grant) as issued by South African Social Security Agency must be submitted
In the case of children who are not beneficiaries of a child related grant the following must be submitted: o proof of income of parents (or caregivers) o three months’ bank statement of parents or guardians affidavit declaring status of income
Unemployment Risk Support ECD centres and non-centre based programmes that meet the qualifying criteria as per national DSD
guideline will be eligible for employment risk support Each province may use a maximum of two per cent of their total allocation received under the
unemployment risk support for administration which includes capacity to manage this initiative The Presidential Employment Initiative funds are allocated as follows:
o Eastern Cape: R60 million o Free State: R39 million o Gauteng: R78 million o KwaZulu-Natal: R90 million o Limpopo: R58 million o Mpumalanga: R42 million o Northern Cape: R42 million o North West: R34 million o Western Cape: R53 million
Transferring officers to report monthly on progress to the Presidency in line with reporting requirements established by the Presidency
Allocation criteria The provincial subsidy allocations are determined based on the following: o increasing the conditional grant funded subsidy rate from R15.00 to R17.00, multiplied by the number
of children targeted using the 2019/20 subsidy budget for the conditional grant o topping-up the equitable share funded subsidies to R17.00 using the actual number of children subsidised
through equitable share as at end of March 2019 For the 2020/21 expansion, the targeted number of children is based on the 2019/20 subsidy budget for the
conditional grant The provincial subsidy allocations for the Presidential Employment Initiative are determined based on
2020/21 equitable share allocations for ECD and partial care to ensure a fair and just distribution of the funding towards target groups.
Reasons not incorporated in equitable share
To allow DSD to better facilitate expansion of ECD in the country ECD is a national priority and requires uniform implementation in order to achieve the minimum coverage
of 60 per cent of all poor children and to have the desired impact of achieving universal access by 2030 To allow DSD to better ring-fence this allocation as part of ECD employment stimulus intervention and to
facilitate employment protection in the ECD sector and work exposure, containing the spread of COVID-19
Past performance 2018/19 audited financial outcomes Of the subsidy expansion grant allocation of R400 million, 100 per cent was transferred to provinces and
R375 million (94 per cent) was spent by the end of the financial year 2018/19 service delivery performance 107 153 children benefitted from the subsidy
Projected life The grant will be allocated over the 2020 medium term expenditure framework period, subject to review The amount for the Presidential Employment Initiative will cover the period from 1 October 2020 to 31
March 2021 MTEF allocations 2020/21: R1.4 billion; 2021/22: R963 million and 2022/23 R1.1 billion Payment schedule Instalments according to approved payment schedule
36
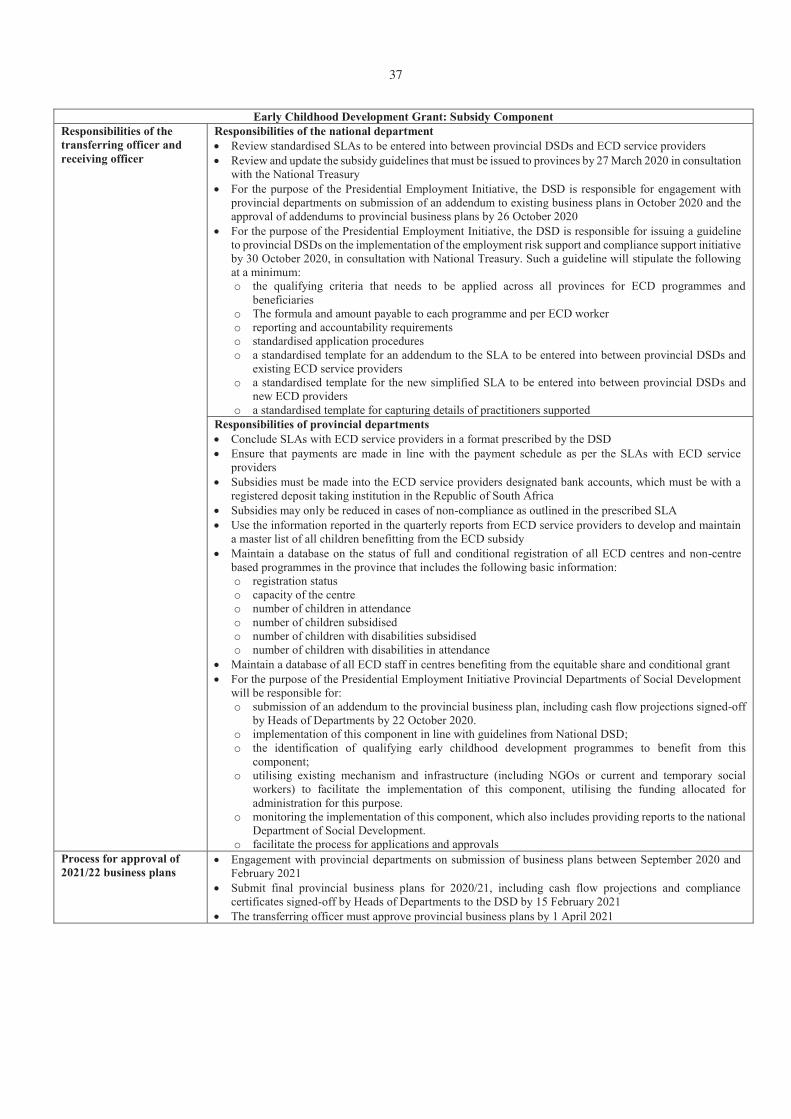
Early Childhood Development Grant: Subsidy Component Responsibilities of the transferring officer and receiving officer
Responsibilities of the national department Review standardised SLAs to be entered into between provincial DSDs and ECD service providers Review and update the subsidy guidelines that must be issued to provinces by 27 March 2020 in consultation
with the National Treasury For the purpose of the Presidential Employment Initiative, the DSD is responsible for engagement with
provincial departments on submission of an addendum to existing business plans in October 2020 and the approval of addendums to provincial business plans by 26 October 2020
For the purpose of the Presidential Employment Initiative, the DSD is responsible for issuing a guideline to provincial DSDs on the implementation of the employment risk support and compliance support initiative by 30 October 2020, in consultation with National Treasury. Such a guideline will stipulate the following at a minimum: o the qualifying criteria that needs to be applied across all provinces for ECD programmes and
beneficiaries o The formula and amount payable to each programme and per ECD worker o reporting and accountability requirements o standardised application procedures o a standardised template for an addendum to the SLA to be entered into between provincial DSDs and
existing ECD service providers o a standardised template for the new simplified SLA to be entered into between provincial DSDs and
new ECD providers o a standardised template for capturing details of practitioners supported
Responsibilities of provincial departments Conclude SLAs with ECD service providers in a format prescribed by the DSD Ensure that payments are made in line with the payment schedule as per the SLAs with ECD service
providers Subsidies must be made into the ECD service providers designated bank accounts, which must be with a
registered deposit taking institution in the Republic of South Africa Subsidies may only be reduced in cases of non-compliance as outlined in the prescribed SLA Use the information reported in the quarterly reports from ECD service providers to develop and maintain
a master list of all children benefitting from the ECD subsidy Maintain a database on the status of full and conditional registration of all ECD centres and non-centre
based programmes in the province that includes the following basic information: o registration status o capacity of the centre o number of children in attendance o number of children subsidised o number of children with disabilities subsidised o number of children with disabilities in attendance
Maintain a database of all ECD staff in centres benefiting from the equitable share and conditional grant For the purpose of the Presidential Employment Initiative Provincial Departments of Social Development
will be responsible for: o submission of an addendum to the provincial business plan, including cash flow projections signed-off
by Heads of Departments by 22 October 2020. o implementation of this component in line with guidelines from National DSD; o the identification of qualifying early childhood development programmes to benefit from this
component; o utilising existing mechanism and infrastructure (including NGOs or current and temporary social
workers) to facilitate the implementation of this component, utilising the funding allocated for administration for this purpose.
o monitoring the implementation of this component, which also includes providing reports to the national Department of Social Development.
o facilitate the process for applications and approvals Process for approval of 2021/22 business plans
Engagement with provincial departments on submission of business plans between September 2020 and February 2021
Submit final provincial business plans for 2020/21, including cash flow projections and compliance certificates signed-off by Heads of Departments to the DSD by 15 February 2021
The transferring officer must approve provincial business plans by 1 April 2021
37

TRANSPORT GRANTS
Provincial Roads Maintenance Grant Transferring department Transport (Vote 40) Grant schedule Schedule 4, Part A Strategic goal To ensure efficient and effective investment in provincial roads to implement the Road Infrastructure
Strategic Framework for South Africa in line with the S’hamba Sonke road programme and other related road infrastructure asset management programmes
Grant purpose To supplement provincial investments for road infrastructure maintenance (routine, periodic and special maintenance)
To ensure that all roads are classified as per the Road Infrastructure Strategic Framework for South Africa (RISFSA) and the technical recommendations for highways, and the Road Classification and Access Management guidelines
To implement and maintain road asset management systems (RAMS) To supplement provincial projects for the repair of roads and bridges damaged by unforeseen incidents
including natural disasters To improve road safety with a special focus on pedestrian safety in rural areas
Outcome statements Improve the condition and lifespan of provincial roads and level of service backed by a periodic five year review of the road network condtions
Improved rates of employment and community participation through labour-intensive construction methodologies and skills development through the delivery of roads infrastructure projects
Outputs Final road asset management plan (RAMP) and tabled project list for the 2020 medium term expenditure framework (MTEF) in a table B5 format finalised by 30 March 2020
Network condition assessment and determination of priority projects list from the road asset management systems (RAMS)
The following actual delivery related measures against 2020/21 targets defined in the final road asset management plan (RAMP) and annual perfomance plan (APP) for each province: o number of m² of surfaced roads rehabilitated (quarterly) o number of m² of surfaced roads resurfaced (overlay or reseal) o number of m² of blacktop patching (including pothole repairs) o number of kilometres of gravel roads re-gravelled o number of kilometres of gravel roads bladed o number of kilometres of gravel roads upgraded (funded from provincial equitable share)
The following performance, based on national job creation indicators: o number of jobs created o number of full time equivalents created o number of youths employed (age 18 – 35) o number of women employed o number of people living with disabilities employed
Number of small, medium micro enterprises contracted on the provinces’ contractor development programme
Updated road condition data (paved and unpaved) including instrumental/automated road survey data, traffic data, safety audit report and bridge conditions
Priority of government that this grant primarily contributes to
Priority 1: Economic transformation and job creation
Details contained in the business plan
This grant uses a road asset management plan (RAMP), which contains the following details: o network hierarchy o performance management framework o gap analysis o information and systems, and lifecycle planning o current and future demand o financial plan o monitoring, reviewing and continual improvements
Conditions This grant funds routine, periodic and special maintenance Provinces must show commitment by budgeting from the provincial equitable share to match or exceed grant
allocations Improvements, upgrading from gravel to surface roads and new facilities must be funded from the provincial
equitable share Provinces may use a maximum of 25 per cent of the allocation for rehabilitation activities The framework must be read in conjunction with the practice note as agreed with National Treasury The payment of the first instalment is dependent upon submission to the national Department of Transport
(DoT) and the relevant provincial treasury of the following: o planning for the infrastructure reporting model (IRM) for 2020 MTEF by 23 April 2020 o final road asset management plan (RAMP) and tabled project list for the 2020 MTEF in a table B5 format
by 30 March 2020 o submission to DoT of the third quarter performance report for the 2020/21 financial year
Payment of subsequent instalments is dependant upon the submission of monthly infrastructure reporting model (IRM) and qaurterly performance reports
38

Provincial Roads Maintenance Grant
In order to ensure effecient usage of grant funds, the Department of Transport in consultantion with National Treasury can instruct that provinces utilise national transversal appointments for project implementation
For RISFSA Class R1, R2 and R3 roads, data collection requirements are: o visual condition data according to technical methods for highway (TMH) 9 for pavements no older than
two years, and TMH 19 for bridges no older than five years o instrumental pavement data for roughness, rut depth and macro texture according to TMH 13 no older
than two years o instrumental pavement data for deflections according to TMH 13 no older than five year o traffic data according to TMH 3, TMH 8 and TMH 14 no older than three years
Provinces must submit into a central repository, updated road condition data, (for paved and unpaved) including instrumental/ automated road survey data, traffic data, safety audit report and bridge conditions by 30 September 2020
The Provincial Road Maintenance Grant (PRMG) allocation can be allocated to the following projects as identified and prioritised through the provincial road asset management systems (RAMS): o routine maintenance (opex): includes day-to-day routine activities such as cleaning drains and culverts,
vegetation control, line marking, guard rail repair, road sign repair, crack sealing, patching, edge repair, spot regraveling, and blading
o periodic maintenance (opex): includes periodically scheduled activities such as fog sprays/diluted emulsions/rejuvenators, surface seals and functional asphalt overlays < 50 mm in thickness. For gravel roads it includes re-gravelling up to 100 mm thick
o special maintenance (opex): includes the repair of selected pavement areas up to maximum of 25 per cent of project length followed by application of surface seal or functional asphalt overlay < 50 mm. Also includes reinstatement of slope stability, repairs to existing structures and the repair of damage caused by floods or accidents
o rehabilitation (capex): includes increasing the structural capacity of an existing pavement through the recycling of existing layers and/or addition of new granular layers or structural asphalt overlays > 80mm thick and upgrading or block paving of gravel roads with more than 300 vehicles per day. These rehabilitation activities are however limited to a maximum of 25 per cent of the PRMG allocation
The PRMG allocation cannot be allocated to the following projects: o improvements (capex): this comprises works that aim to improve the quality of service on roads with an
unacceptable quality of service. These include measures of improving quality of service on existing roads such as increases to the width in selected areas (i.e. addition of climbing/passing lanes), increases in the width over the total length of the project i.e. addition of paved shoulder and localised geometric and intersection improvements. These activities could in some instances include complete rehabilitation of the existing pavement structure
o the upgrading of gravel roads to surface roads, the construction of new roads and new interchanges do not qualify for funding under this grant
o new facilities (capex): this comprises works that aim to improve network capacity and includes the upgrading of earth (dirt) road to an engineered gravel road, the upgrading of a gravel road to a surfaced road and upgrading of single carriageway road to four-lane or dual carriageway road. The construction of new gravel or surfaced road where previously no road existed (brown/green fields construction). The construction of new bridge to replace existing bridge or new interchange to replace intersection
Presidentation Employment Initiative R630 million has been added as part of the Presidential Employment Initiative. These funds, will be
monitored differently to rest of the grants given its specific purpose. Reporting against spending for the Presidential Employment Initiative will be submitted to the Project Management Office of the Presidency on a monthly basis in line with reporting requirements established by the Presidency
Reporting on Presidential Employment Initiative funds will cover the following: o participants and beneficiaries ( number, age, gender, geography, and household size ) o budget expenditure (expenditure against defined categories like wage costs, tools and equipment,
administration costs) o public goods and services (km of road maintaince, refurbished) o social evaluation and attitudes (perception of programmes by participants)
Presidential Employment Initiative for provinces are allocated as follows: o Eastern Cape: R86 million o Free State: R75 million o Gauteng: R45 million o KwaZulu-Natal: R81 million o Limpopo: R71 million o Mpumalanga: R73 million o Northern Cape: R67 million o North West: R71 million o Western Cape: R61 million
Allocation criteria Allocations are based on the Provincial Roads Maintenance Grant formula, which takes into account the extent of the provincial road network (gravel/paved), the traffic volumes, the visual condition indices on the network and geo-climatic and topographic factors
Unallocated amounts in 2021/22 and 2022/23 will be allocated as an incentive based on the level of service efficiency achieved in road project investments undertaken
39
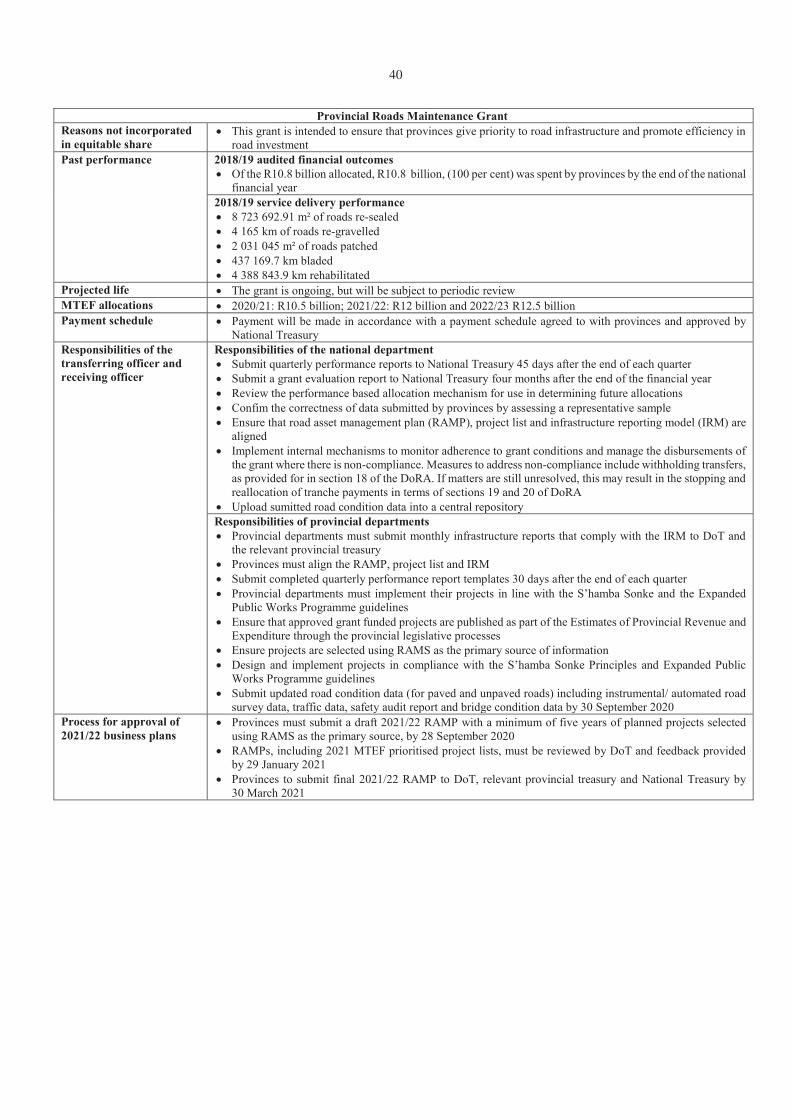
Provincial Roads Maintenance Grant
Reasons not incorporated in equitable share
This grant is intended to ensure that provinces give priority to road infrastructure and promote efficiency in road investment
Past performance 2018/19 audited financial outcomes Of the R10.8 billion allocated, R10.8 billion, (100 per cent) was spent by provinces by the end of the national
financial year 2018/19 service delivery performance
8 723 692.91 m² of roads re-sealed 4 165 km of roads re-gravelled 2 031 045 m² of roads patched 437 169.7 km bladed 4 388 843.9 km rehabilitated
Projected life The grant is ongoing, but will be subject to periodic review MTEF allocations 2020/21: R10.5 billion; 2021/22: R12 billion and 2022/23 R12.5 billion Payment schedule Payment will be made in accordance with a payment schedule agreed to with provinces and approved by
National Treasury Responsibilities of the transferring officer and receiving officer
Responsibilities of the national department Submit quarterly performance reports to National Treasury 45 days after the end of each quarter Submit a grant evaluation report to National Treasury four months after the end of the financial year Review the performance based allocation mechanism for use in determining future allocations Confim the correctness of data submitted by provinces by assessing a representative sample Ensure that road asset management plan (RAMP), project list and infrastructure reporting model (IRM) are
aligned Implement internal mechanisms to monitor adherence to grant conditions and manage the disbursements of
the grant where there is non-compliance. Measures to address non-compliance include withholding transfers, as provided for in section 18 of the DoRA. If matters are still unresolved, this may result in the stopping and reallocation of tranche payments in terms of sections 19 and 20 of DoRA
Upload sumitted road condition data into a central repository Responsibilities of provincial departments
Provincial departments must submit monthly infrastructure reports that comply with the IRM to DoT and the relevant provincial treasury
Provinces must align the RAMP, project list and IRM Submit completed quarterly performance report templates 30 days after the end of each quarter Provincial departments must implement their projects in line with the S’hamba Sonke and the Expanded
Public Works Programme guidelines Ensure that approved grant funded projects are published as part of the Estimates of Provincial Revenue and
Expenditure through the provincial legislative processes Ensure projects are selected using RAMS as the primary source of information Design and implement projects in compliance with the S’hamba Sonke Principles and Expanded Public
Works Programme guidelines Submit updated road condition data (for paved and unpaved roads) including instrumental/ automated road
survey data, traffic data, safety audit report and bridge condition data by 30 September 2020 Process for approval of 2021/22 business plans
Provinces must submit a draft 2021/22 RAMP with a minimum of five years of planned projects selected using RAMS as the primary source, by 28 September 2020
RAMPs, including 2021 MTEF prioritised project lists, must be reviewed by DoT and feedback provided by 29 January 2021
Provinces to submit final 2021/22 RAMP to DoT, relevant provincial treasury and National Treasury by 30 March 2021
40

Annexure C: Frameworks for Conditional Grants to Municipalities
Detailed frameworks on Schedule 5, Part B grants to municipalities Introduction This annexure provides the revised frameworks for the grants set out in Part B of Schedule 5 of the 2020 Division of Revenue Second Amendment Bill. The following are key areas considered for each grant:
Strategic goal and purpose of the grant Outcome statements and outputs of the grant Priority outcome(s) of government that the grant primarily contributes to Conditions of the grant (additional to what is required in the Bill) Criteria for allocation between municipalities Rationale for funding through a conditional grant Past performance The projected life of the grant 2020 MTEF allocations The payment schedule Responsibilities of transferring national department and receiving municipalities Process for approval of business plans for 2021/22
The attached frameworks are not part of the Division of Revenue Second Amendment Bill, but are published in order to provide more information on each grant to parliament, legislatures, municipal councils, officials in all three spheres of government and the public. Once the 2020 Division of Revenue Second Amendment Bill is enacted, these frameworks will be gazetted.
The financial statements and annual reports for 2020/21 will report against the Division of Revenue Act, Division of Revenue Amendment Act, Division of Revenue Second Amendment Act and their schedules, and the grant frameworks as gazetted in terms of the Act. Such reports must cover both financial and non-financial performance, focusing on the outputs achieved.
41

TRANSPORT GRANTS
Rural Roads Asset Management Systems Grant Transferring department Transport (Vote 40) Grant schedule Schedule 5, Part B Strategic goal Ensure efficient and effective investment in municipal roads through development of road asset
management systems (RAMS), collection and analysis of data Grant purpose To assist district municipalities to set up road asset management systems, and collect road, bridge and
traffic data on municipal road networks in line with the Road Infrastructure Strategic Framework for South Africa
Outcome statements Improved data on municipal roads to guide infrastructure maintenance and investments Reduced vehicle operating costs
Outputs
Road condition data (paved and unpaved) as per prescribed Technical Methods for Highways (TMH-series)
Traffic data Data on condition of structures (including bridges and culverts) as per prescribed Technical Methods for
Highways (TMH 19 series) Safety Assessments Data Prioritised project list for roads to inform Municipal Infrastructure Grant project selection
Priority of government that this grant primarily contributes to
Priority 4: Spatial integration, human settlements and local government
Details contained in the business plan
This grant uses Road Asset Management Business Plans which contain the following details: network hierarchy, performance management framework, gap analysis, information systems, lifecycle planning, current and future demand, financial plan, monitoring, reviewing and plans for continual improvements including sharing data with local municipalities
Conditions Transfer of the first tranche is conditional on submission of an approved business plan by 29 May 2020 Transfer of the second tranche is conditional on submission of evidence of engagements and sharing of
data with local municipalities and compliance with monthly and quarterly signed report submissions to the national Department of Transport (DoT), and the relevant Provincial Roads Authorities
Road authorities must conduct regular condition assessments for paved and unpaved roads, structure, traffic data and any other road inventory data
District municipalities must provide local municipalities with validated information from the condition data collected to enable municipalities to identify and prioritise road maintenance requirements within their own budgets, to improve the condition and extend the lifespan of road infrastructure
District municipalities must submit the above data to the national repository by 30 September 2020 For Road Infrastructure Strategic Framework for South Africa (RISFSA) Class R1, R2 and R3 roads,
data collection requirements are: o visual condition data not older than two years for pavements and five years for bridges o instrumental pavement data for roughness, rut depth and macro texture not older than two years o instrumental pavement data for structural strength not older than five years o traffic data not older than three years
For RISFSA Class R4 and R5 roads, data requirements are: o visual condition data not older than three years for pavements and five years for bridges o instrumental pavement data for roughness, rut depth and macro texture not older than four years on
paved roads only o traffic data not older than five years
All road condition reports and data collected must be submitted to the National DoT, and the relevant provincial roads authorities
This framework must be read in conjunction with the practice note as agreed with National Treasury Systems developed to record data must be compatible with DoT specifications District municipalities must participate in grant management structures, including attending monthly
and/or quarterly RRAMS progress as well as National meetings A maximum of 5 per cent may be used for municipal costs incurred as part of coordination, project
management and reporting by the district In order to ensure efficient usage of grant funds, the DoT can instruct that municipalities utilise national
transversal appointments for project implementation where these contracts exist District municipalities must appoint an independent assessor to assess a representative sample of all roads
assessed (which is about 10 per cent of their assessed network) to confirm the correctness of the assessments made by the municipality
Allocation criteria Allocations are based on the extent of the road network and number of local municipalities within a district municipality
42

Rural Roads Asset Management Systems Grant Reasons not incorporated in equitable share
This is a specific purpose grant mainly for the provision of systems to collect data on traffic and conditions of municipal roads and structures
Past performance 2018/19 audited financial outcomes Of the R107 million that was allocated, R107 million (100 per cent) was transferred to municipalities
2018/19 service delivery performance 18 873 kilometres of paved road network and 44 836 kilometres of unpaved road network was assessed
and 13 943 structures were identified in the district municipalities receiving the grant 160 graduates were recruited into the programme
Projected life Grant continues until 2022/23, subject to review MTEF allocations 2020/21: R108 million; 2021/22: R114 million and 2022/23: R121 million Payment schedule Transfers are made in accordance with an agreed payment schedule approved by the National Treasury Responsibilities of the transferring officer and receiving officer
Responsibilities of the national department Monitoring implementation of RAMS together with provincial road authorities Data integrity will be checked by DoT and provincial road authorities Provide guidance on sustainable RAMS operations and standards Facilitate interaction between local municipalities and district municipalities in using RAMS outputs to
guide municipal road infrastructure management Check the quality of data captured on municipalities’ RAMS in collaboration with provincial road
authorities Management, monitoring and reporting of the programme Agree on RAMP with participating municipalities Ensure that the Transversal Contract which district municipalities are involved in is up to date Implement internal mechanisms to monitor adherence to grant conditions and manage the disbursements
of the grant where there is non-compliance. Measures to address non-compliance include withholding transfers, as provided for in section 18 of the Division of Revenue Act (DoRA). If matters are still unresolved, this may result in the stopping and reallocation of tranche payments in terms of sections 19 and 20 of DoRA
Support municipalities with planning and implementation of municipal roads projects in terms of the conditions, standards and specifications applicable to this sector
Ensure that municipal road authorities conduct regular condition assessments for paved and unpaved roads, structure, traffic data and any other road inventory data
Responsibilities of municipalities Municipalities must make provision to maintain RAMS after the lifespan of the grant Data for all rural roads to be updated within two years Recruit unemployed youth, S3 experiential training students and young graduates Ensure human capacity at municipalities for the operation of RAMS is built Municipalities investing in roads infrastructure must utilise data from the Rural Road Asset Management
System (RRAMS), where available, to identify and prioritise their investment on roads projects; including maintenance
Identify municipal officials that will be recipients of skills transfer Ensure that municipal officials participate actively in all activities funded through this grant Ensure systems and practices developed through this grant are sustained as part of the operations of the
municipality Submit of updated RAMS data in TMH 18 format by 29 May 2020
Process for approval of 2021/22 business plans
District municipalities must submit a signed and council approved Road Asset Management Plan (RAMP)/business plan to DoT by 28 May 2021
RAMP must contain the following: o the extent of the road network in the municipality o the proportion of municipal roads with updated data captured on its RAMS o the condition of the network in the municipality o the maintenance and rehabilitation needs of the municipal road network o the status of the municipality’s RAMS o status of institutionalisation of RAMS in the district municipality
TMH 22 RAMP guideline can be used as template DoT together with provincial roads authorities will evaluate and approve the business plans and progress
reports by 30 June 2021
43

AN
NE
XU
RE
D
SPE
CIF
IC-P
UR
POSE
AL
LO
CA
TIO
NS
TO
MU
NIC
IPA
LIT
IES
( SC
HE
DU
LE
5, P
AR
T B
): C
UR
RE
NT
GR
AN
TS
(Nat
iona
l and
Mun
icip
al F
inan
cial
Yea
rs)
44

EASTERN CAPE
A BUF Buffalo City 11 514 ( 576) ( 130) 10 808 A NMA Nelson Mandela Bay 10 500 ( 576) ( 118) 9 806
B EC101 Dr Beyers Naude - - - - B EC102 Blue Crane Route - - - - B EC104 Makana - - - - B EC105 Ndlambe - - - - B EC106 Sundays River Valley - - - - B EC108 Kouga - - - - B EC109 Kou-Kamma - - - - C DC10 Sarah Baartman District Municipality - - - - Total: Sarah Baartman Municipalities - - - -
B EC121 Mbhashe - - - - B EC122 Mnquma - - - - B EC123 Great Kei - - - - B EC124 Amahlathi - - - - B EC126 Ngqushwa - - - - B EC129 Raymond Mhlaba - - - - C DC12 Amathole District Municipality - - - - Total: Amathole Municipalities - - - -
B EC131 Inxuba Yethemba - - - - B EC135 Intsika Yethu - - - - B EC136 Emalahleni - - - - B EC137 Engcobo - - - - B EC138 Sakhisizwe - - - - B EC139 Enoch Mgijima - - - - C DC13 Chris Hani District Municipality - - - - Total: Chris Hani Municipalities - - - -
B EC141 Elundini - - - - B EC142 Senqu - - - - B EC145 Walter Sisulu - - - - C DC14 Joe Gqabi District Municipality - - - - Total: Joe Gqabi Municipalities - - - -
B EC153 Ngquza Hill - - - - B EC154 Port St Johns - - - - B EC155 Nyandeni - - - - B EC156 Mhlontlo - - - - B EC157 King Sabata Dalindyebo 5 500 - ( 65) 5 435 C DC15 O.R. Tambo District Municipality - - - - Total: O.R. Tambo Municipalities 5 500 - ( 65) 5 435
B EC441 Matatiele - - - - B EC442 Umzimvubu - - - - B EC443 Mbizana - - - - B EC444 Ntabankulu - - - - C DC44 Alfred Nzo District Municipality 5 500 - ( 65) 5 435 Total: Alfred Nzo Municipalities 5 500 - ( 65) 5 435
Total: Eastern Cape Municipalities 33 014 ( 1 152) ( 378) 31 484
National and Municipal Financial Years
Category Municipality2020/21
MainAllocation
1st Adjustment2020/21Adjusted
Allocation2nd Adjustment
ANNEXURE D
SPECIFIC-PURPOSE ALLOCATIONS TO MUNICIPALITIES( SCHEDULE 5, PART B): CURRENT GRANTS
Infrastructure Skills Development Grant
45

National and Municipal Financial Years
Category Municipality2020/21
MainAllocation
1st Adjustment2020/21Adjusted
Allocation2nd Adjustment
ANNEXURE D
SPECIFIC-PURPOSE ALLOCATIONS TO MUNICIPALITIES( SCHEDULE 5, PART B): CURRENT GRANTS
Infrastructure Skills Development Grant
FREE STATE
A MAN Mangaung 2 500 ( 2 500) - -
B FS161 Letsemeng - - - - B FS162 Kopanong - - - - B FS163 Mohokare - - - - C DC16 Xhariep District Municipality - - - - Total: Xhariep Municipalities - - - -
B FS181 Masilonyana - - - - B FS182 Tokologo - - - - B FS183 Tswelopele - - - - B FS184 Matjhabeng - - - - B FS185 Nala - - - - C DC18 Lejweleputswa District Municipality - - - - Total: Lejweleputswa Municipalities - - - -
B FS191 Setsoto - - - - B FS192 Dihlabeng - - - - B FS193 Nketoana - - - - B FS194 Maluti-a-Phofung - - - - B FS195 Phumelela - - - - B FS196 Mantsopa - - - - C DC19 Thabo Mofutsanyana District Municipality - - - - Total: Thabo Mofutsanyana Municipalities - - - -
B FS201 Moqhaka - - - - B FS203 Ngwathe - - - - B FS204 Metsimaholo - - - - B FS205 Mafube - - - - C DC20 Fezile Dabi District Municipality - - - - Total: Fezile Dabi Municipalities - - - -
Total: Free State Municipalities 2 500 ( 2 500) - -
GAUTENG
A EKU City of Ekurhuleni - - - - A JHB City of Johannesburg 7 000 - ( 83) 6 917 A TSH City of Tshwane - - - -
B GT421 Emfuleni - - - - B GT422 Midvaal - - - - B GT423 Lesedi - - - - C DC42 Sedibeng District Municipality - - - - Total: Sedibeng Municipalities - - - -
B GT481 Mogale City - - - - B GT484 Merafong City - - - - B GT485 Rand West City - - - - C DC48 West Rand District Municipality - - - - Total: West Rand Municipalities - - - -
Total: Gauteng Municipalities 7 000 - ( 83) 6 917
46

National and Municipal Financial Years
Category Municipality2020/21
MainAllocation
1st Adjustment2020/21Adjusted
Allocation2nd Adjustment
ANNEXURE D
SPECIFIC-PURPOSE ALLOCATIONS TO MUNICIPALITIES( SCHEDULE 5, PART B): CURRENT GRANTS
Infrastructure Skills Development Grant
KWAZULU-NATAL
A ETH eThekwini 35 000 ( 2 673) ( 385) 31 942
B KZN212 uMdoni - - - - B KZN213 uMzumbe - - - - B KZN214 uMuziwabantu - - - - B KZN216 Ray Nkonyeni - - - - C DC21 Ugu District Municipality - - - - Total: Ugu Municipalities - - - -
B KZN221 uMshwathi - - - - B KZN222 uMngeni - - - - B KZN223 Mpofana - - - - B KZN224 iMpendle - - - - B KZN225 Msunduzi - - - - B KZN226 Mkhambathini - - - - B KZN227 Richmond - - - - C DC22 uMgungundlovu District Municipality - - - - Total: uMgungundlovu Municipalities - - - -
B KZN235 Okhahlamba - - - - B KZN237 iNkosi Langalibalele - - - - B KZN238 Alfred Duma 3 500 - ( 42) 3 458 C DC23 uThukela District Municipality - - - - Total: uThukela Municipalities 3 500 - ( 42) 3 458
B KZN241 eNdumeni - - - - B KZN242 Nquthu - - - - B KZN244 uMsinga - - - - B KZN245 uMvoti - - - - C DC24 uMzinyathi District Municipality - - - - Total: uMzinyathi Municipalities - - - -
B KZN252 Newcastle - - - - B KZN253 eMadlangeni - - - - B KZN254 Dannhauser - - - - C DC25 Amajuba District Municipality - - - - Total: Amajuba Municipalities - - - -
B KZN261 eDumbe - - - - B KZN262 uPhongolo - - - - B KZN263 AbaQulusi - - - - B KZN265 Nongoma - - - - B KZN266 Ulundi - - - - C DC26 Zululand District Municipality - - - - Total: Zululand Municipalities - - - -
B KZN271 uMhlabuyalingana - - - - B KZN272 Jozini - - - - B KZN275 Mtubatuba - - - - B KZN276 Big Five Hlabisa - - - - C DC27 uMkhanyakude District Municipality - - - - Total: uMkhanyakude Municipalities - - - -
B KZN281 uMfolozi - - - - B KZN282 uMhlathuze - - - - B KZN284 uMlalazi - - - - B KZN285 Mthonjaneni - - - - B KZN286 Nkandla - - - - C DC28 King Cetshwayo District Municipality - - - - Total: King Cetshwayo Municipalities - - - -
B KZN291 Mandeni - - - - B KZN292 KwaDukuza - - - - B KZN293 Ndwedwe - - - - B KZN294 Maphumulo - - - - C DC29 iLembe District Municipality - - - - Total: iLembe Municipalities - - - -
B KZN433 Greater Kokstad - - - - B KZN434 uBuhlebezwe - - - - B KZN435 uMzimkhulu - - - - B KZN436 Dr Nkosazana Dlamini Zuma - - - - C DC43 Harry Gwala District Municipality - - - - Total: Harry Gwala Municipalities - - - -
Total: KwaZulu-Natal Municipalities 38 500 ( 2 673) ( 427) 35 400
47

National and Municipal Financial Years
Category Municipality2020/21
MainAllocation
1st Adjustment2020/21Adjusted
Allocation2nd Adjustment
ANNEXURE D
SPECIFIC-PURPOSE ALLOCATIONS TO MUNICIPALITIES( SCHEDULE 5, PART B): CURRENT GRANTS
Infrastructure Skills Development Grant
LIMPOPO
B LIM331 Greater Giyani - - - - B LIM332 Greater Letaba - - - - B LIM333 Greater Tzaneen - - - - B LIM334 Ba-Phalaborwa - - - - B LIM335 Maruleng - - - - C DC33 Mopani District Municipality - - - - Total: Mopani Municipalities - - - -
B LIM341 Musina - - - - B LIM343 Thulamela 4 000 - ( 48) 3 952 B LIM344 Makhado - - - - B LIM345 Collins Chabane - - - - C DC34 Vhembe District Municipality - - - - Total: Vhembe Municipalities 4 000 - ( 48) 3 952
B LIM351 Blouberg - - - - B LIM353 Molemole - - - - B LIM354 Polokwane 6 278 - ( 75) 6 203 B LIM355 Lepele-Nkumpi - - - - C DC35 Capricorn District Municipality - - - - Total: Capricorn Municipalities 6 278 - ( 75) 6 203
B LIM361 Thabazimbi - - - - B LIM362 Lephalale - - - - B LIM366 Bela-Bela - - - - B LIM367 Mogalakwena - - - - B LIM368 Modimolle-Mookgophong - - - - C DC36 Waterberg District Municipality - - - - Total: Waterberg Municipalities - - - -
B LIM471 Ephraim Mogale - - - - B LIM472 Elias Motsoaledi - - - - B LIM473 Makhuduthamaga - - - - B LIM476 Fetakgomo Tubatse - - - - C DC47 Sekhukhune District Municipality - - - - Total: Sekhukhune Municipalities - - - -
Total: Limpopo Municipalities 10 278 - ( 123) 10 155
MPUMALANGA
B MP301 Chief Albert Luthuli - - - - B MP302 Msukaligwa - - - - B MP303 Mkhondo - - - - B MP304 Dr Pixley ka Isaka Seme - - - - B MP305 Lekwa - - - - B MP306 Dipaleseng - - - - B MP307 Govan Mbeki 25 500 ( 1 275) ( 288) 23 937 C DC30 Gert Sibande District Municipality 10 000 - ( 119) 9 881 Total: Gert Sibande Municipalities 35 500 ( 1 275) ( 407) 33 818
B MP311 Victor Khanye - - - - B MP312 Emalahleni - - - - B MP313 Steve Tshwete - - - - B MP314 Emakhazeni - - - - B MP315 Thembisile Hani - - - - B MP316 Dr JS Moroka - - - - C DC31 Nkangala District Municipality - - - - Total: Nkangala Municipalities - - - -
B MP321 Thaba Chweu - - - - B MP324 Nkomazi - - - - B MP325 Bushbuckridge - - - - B MP326 City of Mbombela - - - - C DC32 Ehlanzeni District Municipality - - - - Total: Ehlanzeni Municipalities - - - -
Total: Mpumalanga Municipalities 35 500 ( 1 275) ( 407) 33 818
48

National and Municipal Financial Years
Category Municipality2020/21
MainAllocation
1st Adjustment2020/21Adjusted
Allocation2nd Adjustment
ANNEXURE D
SPECIFIC-PURPOSE ALLOCATIONS TO MUNICIPALITIES( SCHEDULE 5, PART B): CURRENT GRANTS
Infrastructure Skills Development Grant
NORTHERN CAPE
B NC061 Richtersveld - - - - B NC062 Nama Khoi - - - - B NC064 Kamiesberg - - - - B NC065 Hantam - - - - B NC066 Karoo Hoogland - - - - B NC067 Khâi-Ma - - - - C DC6 Namakwa District Municipality - - - - Total: Namakwa Municipalities - - - -
B NC071 Ubuntu - - - - B NC072 Umsobomvu - - - - B NC073 Emthanjeni - - - - B NC074 Kareeberg - - - - B NC075 Renosterberg - - - - B NC076 Thembelihle - - - - B NC077 Siyathemba - - - - B NC078 Siyancuma - - - - C DC7 Pixley Ka Seme District Municipality - - - - Total: Pixley Ka Seme Municipalities - - - -
B NC082 !Kai !Garib - - - - B NC084 !Kheis - - - - B NC085 Tsantsabane - - - - B NC086 Kgatelopele - - - - B NC087 Dawid Kruiper - - - - C DC8 Z.F. Mgcawu District Municipality - - - - Total: Z.F. Mgcawu Municipalities - - - -
B NC091 Sol Plaatjie 5 000 - ( 59) 4 941 B NC092 Dikgatlong - - - - B NC093 Magareng - - - - B NC094 Phokwane - - - - C DC9 Frances Baard District Municipality - - - - Total: Frances Baard Municipalities 5 000 - ( 59) 4 941
B NC451 Joe Morolong - - - - B NC452 Ga-Segonyana - - - - B NC453 Gamagara - - - - C DC45 John Taolo Gaetsewe District Municipality 4 200 - ( 50) 4 150 Total: John Taolo Gaetsewe Municipalities 4 200 - ( 50) 4 150
Total: Northern Cape Municipalities 9 200 - ( 109) 9 091
NORTH WEST
B NW371 Moretele - - - - B NW372 Madibeng - - - - B NW373 Rustenburg - - - - B NW374 Kgetlengrivier - - - - B NW375 Moses Kotane - - - - C DC37 Bojanala Platinum District Municipality - - - - Total: Bojanala Platinum Municipalities - - - -
B NW381 Ratlou - - - - B NW382 Tswaing - - - - B NW383 Mafikeng - - - - B NW384 Ditsobotla - - - - B NW385 Ramotshere Moiloa - - - - C DC38 Ngaka Modiri Molema District Municipality - - - - Total: Ngaka Modiri Molema Municipalities - - - -
B NW392 Naledi - - - - B NW393 Mamusa - - - - B NW394 Greater Taung - - - - B NW396 Lekwa-Teemane - - - - B NW397 Kagisano-Molopo - - - - C DC39 Dr Ruth Segomotsi Mompati District Municipality - - - - Total: Dr Ruth Segomotsi Mompati Municipalities - - - -
B NW403 City of Matlosana - - - - B NW404 Maquassi Hills - - - - B NW405 JB Marks - - - - C DC40 Dr Kenneth Kaunda District Municipality - - - - Total: Dr Kenneth Kaunda Municipalities - - - -
Total: North West Municipalities - - - -
49

National and Municipal Financial Years
Category Municipality2020/21
MainAllocation
1st Adjustment2020/21Adjusted
Allocation2nd Adjustment
ANNEXURE D
SPECIFIC-PURPOSE ALLOCATIONS TO MUNICIPALITIES( SCHEDULE 5, PART B): CURRENT GRANTS
Infrastructure Skills Development Grant
WESTERN CAPE
A CPT City of Cape Town 11 000 - ( 131) 10 869
B WC011 Matzikama - - - - B WC012 Cederberg - - - - B WC013 Bergrivier - - - - B WC014 Saldanha Bay - - - - B WC015 Swartland - - - - C DC1 West Coast District Municipality - - - - Total: West Coast Municipalities - - - -
B WC022 Witzenberg - - - - B WC023 Drakenstein - - - - B WC024 Stellenbosch - - - - B WC025 Breede Valley - - - - B WC026 Langeberg - - - - C DC2 Cape Winelands District Municipality - - - - Total: Cape Winelands Municipalities - - - -
B WC031 Theewaterskloof - - - - B WC032 Overstrand - - - - B WC033 Cape Agulhas - - - - B WC034 Swellendam - - - - C DC3 Overberg District Municipality - - - - Total: Overberg Municipalities - - - -
B WC041 Kannaland - - - - B WC042 Hessequa - - - - B WC043 Mossel Bay - - - - B WC044 George 6 200 - ( 74) 6 126 B WC045 Oudtshoorn - - - - B WC047 Bitou - - - - B WC048 Knysna - - - - C DC4 Garden Route District Municipality - - - - Total: Garden Route Municipalities 6 200 - ( 74) 6 126
B WC051 Laingsburg - - - - B WC052 Prince Albert - - - - B WC053 Beaufort West - - - - C DC5 Central Karoo District Municipality - - - - Total: Central Karoo Municipalities - - - -
Total: Western Cape Municipalities 17 200 - ( 205) 16 995
National Total 153 192 ( 7 600) ( 1 732) 143 860
50

AN
NE
XU
RE
E
INFR
AST
RU
CT
UR
E G
RA
NT
AL
LO
CA
TIO
NS
TO
MU
NIC
IPA
LIT
IES
(SC
HE
DU
LE
4, P
AR
T B
AN
D S
CH
ED
UL
E 5
, PA
RT
B)
(Nat
iona
l and
Mun
icip
al F
inan
cial
Yea
rs)
51

EA
STE
RN
CA
PE
AB
UF
Buf
falo
City
-
-
-
-
-
-
-
-
-
-
-
-
761
354
(
74 2
33)
-
687
121
8
317
-
(
99)
8
218
1
8 00
0
-
-
18
000
-
-
-
-
A
NM
AN
elso
n M
ande
la B
ay-
-
-
-
-
-
-
-
-
-
-
-
9
03 7
20
( 88
114
) 3
90 2
74
1 2
05 8
80
10
481
-
(
125
) 1
0 35
6
35
000
(
9 45
0)
-
25
550
3
16 2
07
( 50
191
) 8
3 37
0
349
386
BEC
101
Dr B
eyer
s Nau
de 2
0 49
5
-
( 2
52)
20
243
7
000
-
-
7
000
-
-
-
-
-
-
-
-
-
-
-
-
-
-
-
-
-
-
-
-
B
EC10
2B
lue
Cra
ne R
oute
14
253
-
(
175
) 1
4 07
8
15
000
-
-
1
5 00
0
-
-
-
-
-
-
-
-
-
-
-
-
-
-
-
-
-
-
-
-
BEC
104
Mak
ana
24
260
-
(
298
) 2
3 96
2
20
000
-
-
2
0 00
0
-
-
-
-
-
-
-
-
-
-
-
-
-
-
-
-
-
-
-
-
BEC
105
Ndl
ambe
36
535
-
(
448
) 3
6 08
7
15
000
-
-
1
5 00
0
-
-
-
-
-
-
-
-
-
-
-
-
-
-
-
-
-
-
-
-
BEC
106
Sund
ays R
iver
Val
ley
25
464
-
(
312
) 2
5 15
2
10
000
-
-
1
0 00
0
-
-
-
-
-
-
-
-
-
-
-
-
-
-
-
-
-
-
-
-
BEC
108
Kou
ga 3
1 57
8
-
( 3
88)
31
190
-
-
-
-
-
-
-
-
-
-
-
-
-
-
-
-
-
-
-
-
-
-
-
-
B
EC10
9K
ou-K
amm
a 1
5 32
2
-
( 1
88)
15
134
-
-
-
-
-
-
-
-
-
-
-
-
-
-
-
-
-
-
-
-
-
-
-
-
C
DC
10Sa
rah
Baa
rtman
Dist
rict M
unic
ipal
ity-
-
-
-
-
-
-
-
-
-
-
-
-
-
-
-
-
-
-
-
-
-
-
-
-
-
-
-
To
tal:
Sara
h B
aart
man
Mun
icip
aliti
es 1
67 9
07
-
( 2
061)
1
65 8
46
67
000
-
-
6
7 00
0
-
-
-
-
-
-
-
-
-
-
-
-
-
-
-
-
-
-
-
-
BEC
121
Mbh
ashe
59
595
-
(
731
) 5
8 86
4
-
-
-
-
-
-
-
-
-
-
-
-
-
-
-
-
-
-
-
-
-
-
-
-
BEC
122
Mnq
uma
62
194
-
(
763
) 6
1 43
1
-
-
-
-
-
-
-
-
-
-
-
-
-
-
-
-
-
-
-
-
-
-
-
-
BEC
123
Gre
at K
ei 1
1 20
8
-
( 1
38)
11
070
-
-
-
-
-
-
-
-
-
-
-
-
-
-
-
-
-
-
-
-
-
-
-
-
B
EC12
4A
mah
lath
i 2
7 97
2
-
( 3
43)
27
629
-
-
-
-
-
-
-
-
-
-
-
-
-
-
-
-
-
-
-
-
-
-
-
-
B
EC12
6N
gqus
hwa
22
378
-
(
275
) 2
2 10
3
-
-
-
-
-
-
-
-
-
-
-
-
-
-
-
-
-
-
-
-
-
-
-
-
BEC
129
Ray
mon
d M
hlab
a 3
8 98
6
-
( 4
78)
38
508
-
-
-
-
-
-
-
-
-
-
-
-
-
-
-
-
-
-
-
-
-
-
-
-
C
DC
12A
mat
hole
Dist
rict M
unic
ipal
ity 4
25 4
18
-
( 5
221)
4
20 1
97
80
000
-
-
8
0 00
0
-
-
-
-
-
-
-
-
-
-
-
-
-
-
-
-
-
-
-
-
Tota
l: A
mat
hole
Mun
icip
aliti
es 6
47 7
51
-
( 7
949)
6
39 8
02
80
000
-
-
8
0 00
0
-
-
-
-
-
-
-
-
-
-
-
-
-
-
-
-
-
-
-
-
BEC
131
Inxu
ba Y
ethe
mba
16
024
-
(
197
) 1
5 82
7
-
-
-
-
-
-
-
-
-
-
-
-
-
-
-
-
-
-
-
-
-
-
-
-
BEC
135
Ints
ika
Yet
hu 5
2 74
6
-
( 6
47)
52
099
-
-
-
-
-
-
-
-
-
-
-
-
-
-
-
-
-
-
-
-
-
-
-
-
B
EC13
6Em
alah
leni
3
3 31
9
-
( 4
09)
32
910
-
-
-
-
-
-
-
-
-
-
-
-
-
-
-
-
-
-
-
-
-
-
-
-
B
EC13
7En
gcob
o 3
8 28
4
-
( 4
70)
37
814
-
-
-
-
-
-
-
-
-
-
-
-
-
-
-
-
-
-
-
-
-
-
-
-
B
EC13
8Sa
khisi
zwe
18
104
-
(
222
) 1
7 88
2
-
-
-
-
-
-
-
-
-
-
-
-
-
-
-
-
-
-
-
-
-
-
-
-
BEC
139
Enoc
h M
gijim
a 5
3 75
8
-
( 6
60)
53
098
-
-
-
-
-
-
-
-
-
-
-
-
-
-
-
-
-
-
-
-
-
-
-
-
C
DC
13C
hris
Han
i Dist
rict M
unic
ipal
ity 2
85 0
00
-
( 3
497)
2
81 5
03
85
000
-
(
15 0
00)
70
000
-
-
-
-
-
-
-
-
-
-
-
-
-
-
-
-
-
-
-
-
To
tal:
Chr
is H
ani M
unic
ipal
ities
497
235
-
(
6 10
2)
491
133
8
5 00
0
-
( 15
000
) 7
0 00
0
-
-
-
-
-
-
-
-
-
-
-
-
-
-
-
-
-
-
-
-
BEC
141
Elun
dini
38
703
-
(
475
) 3
8 22
8
-
-
-
-
-
-
-
-
-
-
-
-
-
-
-
-
-
-
-
-
-
-
-
-
BEC
142
Senq
u 3
8 24
4
-
( 4
69)
37
775
-
-
-
-
-
-
-
-
-
-
-
-
-
-
-
-
-
-
-
-
-
-
-
-
B
EC14
5W
alte
r Sisu
lu 1
8 77
2
-
( 2
30)
18
542
-
-
-
-
-
-
-
-
-
-
-
-
-
-
-
-
-
-
-
-
-
-
-
-
C
DC
14Jo
e G
qabi
Dist
rict M
unic
ipal
ity 1
55 7
73
-
( 1
912)
1
53 8
61
70
000
-
-
7
0 00
0
-
-
-
-
-
-
-
-
-
-
-
-
-
-
-
-
-
-
-
-
Tota
l: Jo
e G
qabi
Mun
icip
aliti
es 2
51 4
92
-
( 3
086)
2
48 4
06
70
000
-
-
7
0 00
0
-
-
-
-
-
-
-
-
-
-
-
-
-
-
-
-
-
-
-
-
BEC
153
Ngq
uza
Hill
54
149
-
(
664
) 5
3 48
5
-
-
-
-
-
-
-
-
-
-
-
-
-
-
-
-
-
-
-
-
-
-
-
-
BEC
154
Port
St Jo
hns
34
134
-
(
419
) 3
3 71
5
-
-
-
-
-
-
-
-
-
-
-
-
-
-
-
-
-
-
-
-
-
-
-
-
BEC
155
Nya
nden
i 6
0 44
1
-
( 7
42)
59
699
-
-
-
-
-
-
-
-
-
-
-
-
-
-
-
-
-
-
-
-
-
-
-
-
B
EC15
6M
hlon
tlo 4
3 96
7
-
( 5
40)
43
427
-
-
-
-
-
-
-
-
-
-
-
-
-
-
-
-
-
-
-
-
-
-
-
-
B
EC15
7K
ing
Saba
ta D
alin
dyeb
o 8
5 69
3
-
( 1
052)
8
4 64
1
-
-
-
-
-
-
-
-
-
-
-
-
-
-
-
-
-
-
-
-
-
-
-
-
CD
C15
O.R
. Tam
bo D
istric
t Mun
icip
ality
628
864
-
(
7 71
7)
621
147
9
0 00
0
-
( 10
000
) 8
0 00
0
-
-
-
-
-
-
-
-
-
-
-
-
-
-
-
-
-
-
-
-
Tota
l: O
.R. T
ambo
Mun
icip
aliti
es 9
07 2
48
-
( 11
134
) 8
96 1
14
90
000
-
(
10 0
00)
80
000
-
-
-
-
-
-
-
-
-
-
-
-
-
-
-
-
-
-
-
-
BEC
441
Mat
atie
le 4
8 93
6
-
( 6
01)
48
335
-
-
-
-
-
-
-
-
-
-
-
-
-
-
-
-
-
-
-
-
-
-
-
-
B
EC44
2U
mzi
mvu
bu 5
6 11
2
-
( 6
89)
55
423
-
-
-
-
-
-
-
-
-
-
-
-
-
-
-
-
-
-
-
-
-
-
-
-
B
EC44
3M
biza
na 4
8 04
9
-
( 5
90)
47
459
-
-
-
-
-
-
-
-
-
-
-
-
-
-
-
-
-
-
-
-
-
-
-
-
B
EC44
4N
taba
nkul
u 2
7 00
5
-
( 3
31)
26
674
-
-
-
-
-
-
-
-
-
-
-
-
-
-
-
-
-
-
-
-
-
-
-
-
C
DC
44A
lfred
Nzo
Dist
rict M
unic
ipal
ity 3
73 3
34
-
( 4
581)
3
68 7
53
94
950
-
-
9
4 95
0
-
-
-
-
-
-
-
-
-
-
-
-
-
-
-
-
-
-
-
-
Tota
l: A
lfred
Nzo
Mun
icip
aliti
es 5
53 4
36
-
( 6
792)
5
46 6
44
94
950
-
-
9
4 95
0
-
-
-
-
-
-
-
-
-
-
-
-
-
-
-
-
-
-
-
-
Tota
l: E
aste
rn C
ape
Mun
icip
aliti
es 3
025
069
-
(
37 1
24)
2 9
87 9
45
486
950
-
(
25 0
00)
461
950
-
-
-
-
1
665
074
(
162
347)
3
90 2
74
1 8
93 0
01
18
798
-
(
224
) 1
8 57
4
53
000
(
9 45
0)
-
43
550
3
16 2
07
( 50
191
) 8
3 37
0
349
386
1st A
djus
tmen
tC
ateg
ory
Mun
icip
ality
Inte
grat
ed C
ity D
evel
opm
ent G
rant
M
unic
ipal
Infr
astr
uctu
re G
rant
2020
/21
Mai
nAl
loca
tion
Wat
er S
ervi
ces I
nfra
stru
ctur
e G
rant
2020
/21
Adju
sted
Al
loca
tion
Nei
ghbo
urho
od D
evel
opm
ent P
artn
ersh
ip G
rant
(Cap
ital)
Publ
ic T
rans
port
Net
wor
k G
rant
1st A
djus
tmen
t20
20/2
1Ad
just
ed
Allo
catio
n2n
d Ad
just
men
t20
20/2
1Ad
just
ed
Allo
catio
n
2020
/21
Mai
nAl
loca
tion
1st A
djus
tmen
t1s
t Adj
ustm
ent
Nat
iona
l and
Mun
icip
al F
inan
cial
Yea
rs
1st A
djus
tmen
t20
20/2
1Ad
just
ed
Allo
catio
n
Nat
iona
l and
Mun
icip
al F
inan
cial
Yea
rs
2020
/21
Mai
nAl
loca
tion
2020
/21
Adju
sted
Al
loca
tion
2020
/21
Mai
nAl
loca
tion
2020
/21
Adju
sted
Al
loca
tion
2020
/21
Mai
nAl
loca
tion
Nat
iona
l and
Mun
icip
al F
inan
cial
Yea
rs
AN
NEX
UR
E E
INFR
AST
RU
CTU
RE
GR
AN
T A
LLO
CA
TIO
NS
TO M
UN
ICIP
ALI
TIES
(SC
HED
ULE
4, P
AR
T B
AN
D S
CH
EDU
LE 5
, PA
RT
B)
Urb
an S
ettle
men
ts D
evel
opm
ent G
rant
Nat
iona
l and
Mun
icip
al F
inan
cial
Yea
rsN
atio
nal a
nd M
unic
ipal
Fin
anci
al Y
ears
Inte
grat
ed U
rban
Dev
elop
men
t Gra
nt
Nat
iona
l and
Mun
icip
al F
inan
cial
Yea
rsN
atio
nal a
nd M
unic
ipal
Fin
anci
al Y
ears
2nd
Adju
stm
ent
2nd
Adju
stm
ent
2nd
Adju
stm
ent
2nd
Adju
stm
ent
2nd
Adju
stm
ent
2nd
Adju
stm
ent
2020
/21
Mai
nAl
loca
tion
1st A
djus
tmen
t20
20/2
1Ad
just
ed
Allo
catio
n
2020
/21
Mai
nAl
loca
tion
1st A
djus
tmen
t
52

1st A
djus
tmen
tC
ateg
ory
Mun
icip
ality
Inte
grat
ed C
ity D
evel
opm
ent G
rant
M
unic
ipal
Infr
astr
uctu
re G
rant
2020
/21
Mai
nAl
loca
tion
Wat
er S
ervi
ces I
nfra
stru
ctur
e G
rant
2020
/21
Adju
sted
Al
loca
tion
Nei
ghbo
urho
od D
evel
opm
ent P
artn
ersh
ip G
rant
(Cap
ital)
Publ
ic T
rans
port
Net
wor
k G
rant
1st A
djus
tmen
t20
20/2
1Ad
just
ed
Allo
catio
n2n
d Ad
just
men
t20
20/2
1Ad
just
ed
Allo
catio
n
2020
/21
Mai
nAl
loca
tion
1st A
djus
tmen
t1s
t Adj
ustm
ent
Nat
iona
l and
Mun
icip
al F
inan
cial
Yea
rs
1st A
djus
tmen
t20
20/2
1Ad
just
ed
Allo
catio
n
Nat
iona
l and
Mun
icip
al F
inan
cial
Yea
rs
2020
/21
Mai
nAl
loca
tion
2020
/21
Adju
sted
Al
loca
tion
2020
/21
Mai
nAl
loca
tion
2020
/21
Adju
sted
Al
loca
tion
2020
/21
Mai
nAl
loca
tion
Nat
iona
l and
Mun
icip
al F
inan
cial
Yea
rs
AN
NEX
UR
E E
INFR
AST
RU
CTU
RE
GR
AN
T A
LLO
CA
TIO
NS
TO M
UN
ICIP
ALI
TIES
(SC
HED
ULE
4, P
AR
T B
AN
D S
CH
EDU
LE 5
, PA
RT
B)
Urb
an S
ettle
men
ts D
evel
opm
ent G
rant
Nat
iona
l and
Mun
icip
al F
inan
cial
Yea
rsN
atio
nal a
nd M
unic
ipal
Fin
anci
al Y
ears
Inte
grat
ed U
rban
Dev
elop
men
t Gra
nt
Nat
iona
l and
Mun
icip
al F
inan
cial
Yea
rsN
atio
nal a
nd M
unic
ipal
Fin
anci
al Y
ears
2nd
Adju
stm
ent
2nd
Adju
stm
ent
2nd
Adju
stm
ent
2nd
Adju
stm
ent
2nd
Adju
stm
ent
2nd
Adju
stm
ent
2020
/21
Mai
nAl
loca
tion
1st A
djus
tmen
t20
20/2
1Ad
just
ed
Allo
catio
n
2020
/21
Mai
nAl
loca
tion
1st A
djus
tmen
t
FRE
E S
TATE
AM
AN
Man
gaun
g-
-
-
-
-
-
-
-
-
-
-
-
7
54 5
93
( 73
574
) -
6
81 0
19
6 4
50
-
( 7
7)
6 3
73
10
000
-
-
1
0 00
0
242
210
(
38 4
46)
( 11
331
) 1
92 4
33
BFS
161
Lets
emen
g 1
7 06
1
-
( 2
09)
16
852
2
4 20
1
-
-
24
201
-
-
-
-
-
-
-
-
-
-
-
-
-
-
-
-
-
-
-
-
B
FS16
2K
opan
ong
20
428
-
(
251
) 2
0 17
7
30
000
-
(
8 00
0)
22
000
-
-
-
-
-
-
-
-
-
-
-
-
-
-
-
-
-
-
-
-
B
FS16
3M
ohok
are
17
898
-
(
220
) 1
7 67
8
28
025
-
-
2
8 02
5
-
-
-
-
-
-
-
-
-
-
-
-
-
-
-
-
-
-
-
-
CD
C16
Xha
riep
Dist
rict M
unic
ipal
ity-
-
-
-
-
-
-
-
-
-
-
-
-
-
-
-
-
-
-
-
-
-
-
-
-
-
-
-
To
tal:
Xha
riep
Mun
icip
aliti
es 5
5 38
7
-
( 6
80)
54
707
8
2 22
6
-
( 8
000)
7
4 22
6
-
-
-
-
-
-
-
-
-
-
-
-
-
-
-
-
-
-
-
-
BFS
181
Mas
ilony
ana
30
017
-
(
368
) 2
9 64
9
11
000
-
6
000
1
7 00
0
-
-
-
-
-
-
-
-
-
-
-
-
-
-
-
-
-
-
-
-
BFS
182
Toko
logo
16
470
-
(
202
) 1
6 26
8
12
000
-
-
1
2 00
0
-
-
-
-
-
-
-
-
-
-
-
-
-
-
-
-
-
-
-
-
BFS
183
Tsw
elop
ele
16
405
-
(
201
) 1
6 20
4
10
000
-
-
1
0 00
0
-
-
-
-
-
-
-
-
-
-
-
-
-
-
-
-
-
-
-
-
BFS
184
Mat
jhab
eng
118
247
-
(
1 45
1)
116
796
3
5 00
0
-
-
35
000
-
-
-
-
-
-
-
-
-
-
-
-
-
-
-
-
-
-
-
-
B
FS18
5N
ala
29
468
-
(
362
) 2
9 10
6
10
000
-
-
1
0 00
0
-
-
-
-
-
-
-
-
-
-
-
-
-
-
-
-
-
-
-
-
CD
C18
Lejw
elep
utsw
a D
istric
t Mun
icip
ality
-
-
-
-
-
-
-
-
-
-
-
-
-
-
-
-
-
-
-
-
-
-
-
-
-
-
-
-
Tota
l: L
ejw
elep
utsw
a M
unic
ipal
ities
210
607
-
(
2 58
4)
208
023
7
8 00
0
-
6 0
00
84
000
-
-
-
-
-
-
-
-
-
-
-
-
-
-
-
-
-
-
-
-
BFS
191
Sets
oto
46
899
-
(
576
) 4
6 32
3
26
375
-
-
2
6 37
5
-
-
-
-
-
-
-
-
-
-
-
-
-
-
-
-
-
-
-
-
BFS
192
Dih
labe
ng 4
7 40
5
-
( 5
82)
46
823
1
5 11
0
-
-
15
110
-
-
-
-
-
-
-
-
-
-
-
-
-
-
-
-
-
-
-
-
B
FS19
3N
keto
ana
25
225
-
(
310
) 2
4 91
5
15
000
-
1
5 50
0
30
500
-
-
-
-
-
-
-
-
-
-
-
-
-
-
-
-
-
-
-
-
B
FS19
4M
alut
i-a-P
hofu
ng 1
61 6
26
-
( 1
983)
1
59 6
43
50
000
-
-
5
0 00
0
-
-
-
-
-
-
-
-
-
-
-
-
-
-
-
-
-
-
-
-
BFS
195
Phum
elel
a 2
0 93
3
-
( 2
57)
20
676
2
1 10
0
-
-
21
100
-
-
-
-
-
-
-
-
-
-
-
-
-
-
-
-
-
-
-
-
B
FS19
6M
ants
opa
19
863
-
(
244
) 1
9 61
9
47
000
-
(
17 0
00)
30
000
-
-
-
-
-
-
-
-
-
-
-
-
-
-
-
-
-
-
-
-
C
DC
19Th
abo
Mof
utsa
nyan
a D
istric
t Mun
icip
ality
-
-
-
-
-
-
-
-
-
-
-
-
-
-
-
-
-
-
-
-
-
-
-
-
-
-
-
-
Tota
l: Th
abo
Mof
utsa
nyan
a M
unic
ipal
ities
321
951
-
(
3 95
2)
317
999
1
74 5
85
-
( 1
500)
1
73 0
85
-
-
-
-
-
-
-
-
-
-
-
-
-
-
-
-
-
-
-
-
BFS
201
Moq
haka
49
924
-
(
613
) 4
9 31
1
15
825
-
3
500
1
9 32
5
-
-
-
-
-
-
-
-
-
-
-
-
-
-
-
-
-
-
-
-
BFS
203
Ngw
athe
41
704
-
(
512
) 4
1 19
2
25
000
-
-
2
5 00
0
-
-
-
-
-
-
-
-
-
-
-
-
-
-
-
-
-
-
-
-
BFS
204
Met
simah
olo
44
366
-
(
544
) 4
3 82
2
25
000
-
-
2
5 00
0
-
-
-
-
-
-
-
-
-
-
-
-
-
-
-
-
-
-
-
-
BFS
205
Maf
ube
22
318
-
(
274
) 2
2 04
4
15
000
-
-
1
5 00
0
-
-
-
-
-
-
-
-
-
-
-
-
-
-
-
-
-
-
-
-
CD
C20
Fezi
le D
abi D
istric
t Mun
icip
ality
-
-
-
-
-
-
-
-
-
-
-
-
-
-
-
-
-
-
-
-
-
-
-
-
-
-
-
-
Tota
l: Fe
zile
Dab
i Mun
icip
aliti
es 1
58 3
12
-
( 1
943)
1
56 3
69
80
825
-
3
500
8
4 32
5
-
-
-
-
-
-
-
-
-
-
-
-
-
-
-
-
-
-
-
-
Tota
l: Fr
ee S
tate
Mun
icip
aliti
es 7
46 2
57
-
( 9
159)
7
37 0
98
415
636
-
-
4
15 6
36
-
-
-
-
754
593
(
73 5
74)
-
681
019
6
450
-
(
77)
6
373
1
0 00
0
-
-
10
000
2
42 2
10
( 38
446
) (
11 3
31)
192
433
GA
UTE
NG
AEK
UC
ity o
f Eku
rhul
eni
-
-
-
-
-
-
-
-
-
-
-
-
1 9
67 5
05
( 19
1 83
5)
-
1 7
75 6
70
53
577
-
(
637
) 5
2 94
0
75
000
-
-
7
5 00
0
716
466
(
113
724)
(
33 5
18)
569
224
A
JHB
City
of J
ohan
nesb
urg
-
-
-
-
-
-
-
-
-
-
-
-
1 8
48 2
87
( 18
0 21
1)
-
1 6
68 0
76
74
754
-
(
889
) 7
3 86
5
62
406
-
-
6
2 40
6
1 0
51 5
18
( 16
6 90
9)
( 49
193
) 8
35 4
16
ATS
HC
ity o
f Tsh
wan
e-
-
-
-
-
-
-
-
-
-
-
-
1
602
161
(
156
213)
-
1
445
948
5
1 51
2
-
( 6
13)
50
899
5
000
-
-
5
000
7
71 9
54
( 12
2 53
2)
( 36
114
) 6
13 3
08
BG
T421
Emfu
leni
167
785
-
(
2 05
9)
165
726
-
-
-
-
-
-
-
-
-
-
-
-
-
-
-
-
-
-
-
-
-
-
-
-
B
GT4
22M
idva
al 3
1 59
2
-
( 3
88)
31
204
1
5 82
5
-
-
15
825
-
-
-
-
-
-
-
-
-
-
-
-
1
500
-
-
1
500
-
-
-
-
B
GT4
23Le
sedi
26
249
-
(
322
) 2
5 92
7
15
825
-
-
1
5 82
5
-
-
-
-
-
-
-
-
-
-
-
-
-
-
-
-
-
-
-
-
CD
C42
Sedi
beng
Dist
rict M
unic
ipal
ity-
-
-
-
1
5 82
5
-
-
15
825
-
-
-
-
-
-
-
-
-
-
-
-
-
-
-
-
-
-
-
-
To
tal:
Sedi
beng
Mun
icip
aliti
es 2
25 6
26
-
( 2
769)
2
22 8
57
47
475
-
-
4
7 47
5
-
-
-
-
-
-
-
-
-
-
-
-
1 5
00
-
-
1 5
00
-
-
-
-
BG
T481
Mog
ale
City
-
-
-
-
42
200
-
-
4
2 20
0
119
766
-
(
1 47
3)
118
293
-
-
-
-
-
-
-
-
1
0 00
0
-
-
10
000
-
-
-
-
B
GT4
84M
eraf
ong
City
65
834
-
(
808
) 6
5 02
6
36
925
-
-
3
6 92
5
-
-
-
-
-
-
-
-
-
-
-
-
-
-
-
-
-
-
-
-
BG
T485
Ran
d W
est C
ity 9
0 53
4
-
( 1
111)
8
9 42
3
38
460
-
-
3
8 46
0
-
-
-
-
-
-
-
-
-
-
-
-
1 5
00
-
-
1 5
00
-
-
-
-
CD
C48
Wes
t Ran
d D
istric
t Mun
icip
ality
-
-
-
-
-
-
-
-
-
-
-
-
-
-
-
-
-
-
-
-
-
-
-
-
-
-
-
-
Tota
l: W
est R
and
Mun
icip
aliti
es 1
56 3
68
-
( 1
919)
1
54 4
49
117
585
-
-
1
17 5
85
119
766
-
(
1 47
3)
118
293
-
-
-
-
-
-
-
-
1
1 50
0
-
-
11
500
-
-
-
-
Tota
l: G
aute
ng M
unic
ipal
ities
381
994
-
(
4 68
8)
377
306
1
65 0
60
-
-
165
060
1
19 7
66
-
( 1
473)
1
18 2
93
5 4
17 9
53
( 52
8 25
9)
-
4 8
89 6
94
179
843
-
(
2 13
9)
177
704
1
55 4
06
-
-
155
406
2
539
938
(
403
165)
(
118
825)
2
017
948
53
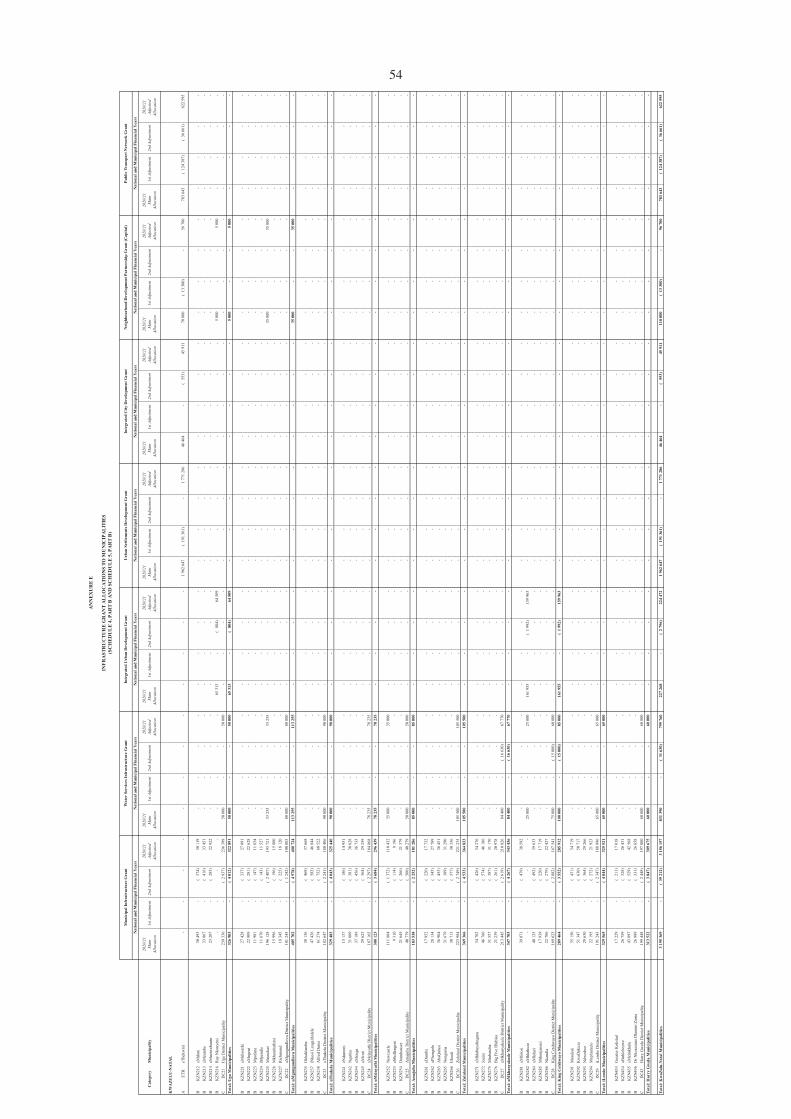
1st A
djus
tmen
tC
ateg
ory
Mun
icip
ality
Inte
grat
ed C
ity D
evel
opm
ent G
rant
M
unic
ipal
Infr
astr
uctu
re G
rant
2020
/21
Mai
nAl
loca
tion
Wat
er S
ervi
ces I
nfra
stru
ctur
e G
rant
2020
/21
Adju
sted
Al
loca
tion
Nei
ghbo
urho
od D
evel
opm
ent P
artn
ersh
ip G
rant
(Cap
ital)
Publ
ic T
rans
port
Net
wor
k G
rant
1st A
djus
tmen
t20
20/2
1Ad
just
ed
Allo
catio
n2n
d Ad
just
men
t20
20/2
1Ad
just
ed
Allo
catio
n
2020
/21
Mai
nAl
loca
tion
1st A
djus
tmen
t1s
t Adj
ustm
ent
Nat
iona
l and
Mun
icip
al F
inan
cial
Yea
rs
1st A
djus
tmen
t20
20/2
1Ad
just
ed
Allo
catio
n
Nat
iona
l and
Mun
icip
al F
inan
cial
Yea
rs
2020
/21
Mai
nAl
loca
tion
2020
/21
Adju
sted
Al
loca
tion
2020
/21
Mai
nAl
loca
tion
2020
/21
Adju
sted
Al
loca
tion
2020
/21
Mai
nAl
loca
tion
Nat
iona
l and
Mun
icip
al F
inan
cial
Yea
rs
AN
NEX
UR
E E
INFR
AST
RU
CTU
RE
GR
AN
T A
LLO
CA
TIO
NS
TO M
UN
ICIP
ALI
TIES
(SC
HED
ULE
4, P
AR
T B
AN
D S
CH
EDU
LE 5
, PA
RT
B)
Urb
an S
ettle
men
ts D
evel
opm
ent G
rant
Nat
iona
l and
Mun
icip
al F
inan
cial
Yea
rsN
atio
nal a
nd M
unic
ipal
Fin
anci
al Y
ears
Inte
grat
ed U
rban
Dev
elop
men
t Gra
nt
Nat
iona
l and
Mun
icip
al F
inan
cial
Yea
rsN
atio
nal a
nd M
unic
ipal
Fin
anci
al Y
ears
2nd
Adju
stm
ent
2nd
Adju
stm
ent
2nd
Adju
stm
ent
2nd
Adju
stm
ent
2nd
Adju
stm
ent
2nd
Adju
stm
ent
2020
/21
Mai
nAl
loca
tion
1st A
djus
tmen
t20
20/2
1Ad
just
ed
Allo
catio
n
2020
/21
Mai
nAl
loca
tion
1st A
djus
tmen
t
KW
AZU
LU
-NA
TAL
AET
HeT
hekw
ini
-
-
-
-
-
-
-
-
-
-
-
-
1 9
62 6
47
( 19
1 36
1)
-
1 7
71 2
86
46
464
-
(
553
) 4
5 91
1
70
000
(
13 3
00)
-
56
700
7
83 6
43
( 12
4 38
7)
( 36
661
) 6
22 5
95
BK
ZN21
2uM
doni
30
493
-
(
374
) 3
0 11
9
-
-
-
-
-
-
-
-
-
-
-
-
-
-
-
-
-
-
-
-
-
-
-
-
BK
ZN21
3uM
zum
be 3
3 86
7
-
( 4
16)
33
451
-
-
-
-
-
-
-
-
-
-
-
-
-
-
-
-
-
-
-
-
-
-
-
-
B
KZN
214
uMuz
iwab
antu
23
207
-
(
285
) 2
2 92
2
-
-
-
-
-
-
-
-
-
-
-
-
-
-
-
-
-
-
-
-
-
-
-
-
BK
ZN21
6R
ay N
kony
eni
-
-
-
-
-
-
-
-
65
313
-
(
804
) 6
4 50
9
-
-
-
-
-
-
-
-
5 0
00
-
-
5 0
00
-
-
-
-
CD
C21
Ugu
Dist
rict M
unic
ipal
ity 2
39 3
36
-
( 2
937)
2
36 3
99
50
000
-
-
5
0 00
0
-
-
-
-
-
-
-
-
-
-
-
-
-
-
-
-
-
-
-
-
Tota
l: U
gu M
unic
ipal
ities
326
903
-
(
4 01
2)
322
891
5
0 00
0
-
-
50
000
6
5 31
3
-
( 8
04)
64
509
-
-
-
-
-
-
-
-
5
000
-
-
5
000
-
-
-
-
BK
ZN22
1uM
shw
athi
27
428
-
(
337
) 2
7 09
1
-
-
-
-
-
-
-
-
-
-
-
-
-
-
-
-
-
-
-
-
-
-
-
-
BK
ZN22
2uM
ngen
i 2
2 90
9
-
( 2
81)
22
628
-
-
-
-
-
-
-
-
-
-
-
-
-
-
-
-
-
-
-
-
-
-
-
-
B
KZN
223
Mpo
fana
11
981
-
(
147
) 1
1 83
4
-
-
-
-
-
-
-
-
-
-
-
-
-
-
-
-
-
-
-
-
-
-
-
-
BK
ZN22
4iM
pend
le 1
1 67
0
-
( 1
43)
11
527
-
-
-
-
-
-
-
-
-
-
-
-
-
-
-
-
-
-
-
-
-
-
-
-
B
KZN
225
Msu
nduz
i 1
96 1
28
-
( 2
407)
1
93 7
21
33
255
-
-
3
3 25
5
-
-
-
-
-
-
-
-
-
-
-
-
35
000
-
-
3
5 00
0
-
-
-
-
BK
ZN22
6M
kham
bath
ini
15
996
-
(
196
) 1
5 80
0
-
-
-
-
-
-
-
-
-
-
-
-
-
-
-
-
-
-
-
-
-
-
-
-
BK
ZN22
7R
ichm
ond
18
345
-
(
225
) 1
8 12
0
-
-
-
-
-
-
-
-
-
-
-
-
-
-
-
-
-
-
-
-
-
-
-
-
CD
C22
uMgu
ngun
dlov
u D
istric
t Mun
icip
ality
101
245
-
(
1 24
2)
100
003
8
0 00
0
-
-
80
000
-
-
-
-
-
-
-
-
-
-
-
-
-
-
-
-
-
-
-
-
To
tal:
uMgu
ngun
dlov
u M
unic
ipal
ities
405
702
-
(
4 97
8)
400
724
1
13 2
55
-
-
113
255
-
-
-
-
-
-
-
-
-
-
-
-
3
5 00
0
-
-
35
000
-
-
-
-
BK
ZN23
5O
khah
lam
ba 3
8 13
6
-
( 4
68)
37
668
-
-
-
-
-
-
-
-
-
-
-
-
-
-
-
-
-
-
-
-
-
-
-
-
B
KZN
237
iNko
si La
ngal
ibal
ele
47
426
-
(
582
) 4
6 84
4
-
-
-
-
-
-
-
-
-
-
-
-
-
-
-
-
-
-
-
-
-
-
-
-
BK
ZN23
8A
lfred
Dum
a 6
1 27
4
-
( 7
52)
60
522
-
-
-
-
-
-
-
-
-
-
-
-
-
-
-
-
-
-
-
-
-
-
-
-
C
DC
23uT
huke
la D
istric
t Mun
icip
ality
182
647
-
(
2 24
1)
180
406
9
0 00
0
-
-
90
000
-
-
-
-
-
-
-
-
-
-
-
-
-
-
-
-
-
-
-
-
To
tal:
uThu
kela
Mun
icip
aliti
es 3
29 4
83
-
( 4
043)
3
25 4
40
90
000
-
-
9
0 00
0
-
-
-
-
-
-
-
-
-
-
-
-
-
-
-
-
-
-
-
-
BK
ZN24
1eN
dum
eni
15
137
-
(
186
) 1
4 95
1
-
-
-
-
-
-
-
-
-
-
-
-
-
-
-
-
-
-
-
-
-
-
-
-
BK
ZN24
2N
quth
u 3
1 00
9
-
( 3
81)
30
628
-
-
-
-
-
-
-
-
-
-
-
-
-
-
-
-
-
-
-
-
-
-
-
-
B
KZN
244
uMsin
ga 3
7 18
9
-
( 4
56)
36
733
-
-
-
-
-
-
-
-
-
-
-
-
-
-
-
-
-
-
-
-
-
-
-
-
B
KZN
245
uMvo
ti 2
9 62
3
-
( 3
64)
29
259
-
-
-
-
-
-
-
-
-
-
-
-
-
-
-
-
-
-
-
-
-
-
-
-
C
DC
24uM
ziny
athi
Dist
rict M
unic
ipal
ity 1
87 1
65
-
( 2
297)
1
84 8
68
78
235
-
-
7
8 23
5
-
-
-
-
-
-
-
-
-
-
-
-
-
-
-
-
-
-
-
-
Tota
l: uM
ziny
athi
Mun
icip
aliti
es 3
00 1
23
-
( 3
684)
2
96 4
39
78
235
-
-
7
8 23
5
-
-
-
-
-
-
-
-
-
-
-
-
-
-
-
-
-
-
-
-
BK
ZN25
2N
ewca
stle
111
804
-
(
1 37
2)
110
432
3
5 00
0
-
-
35
000
-
-
-
-
-
-
-
-
-
-
-
-
-
-
-
-
-
-
-
-
B
KZN
253
eMad
lang
eni
9 3
10
-
( 1
14)
9 1
96
-
-
-
-
-
-
-
-
-
-
-
-
-
-
-
-
-
-
-
-
-
-
-
-
BK
ZN25
4D
annh
ause
r 2
1 64
5
-
( 2
66)
21
379
-
-
-
-
-
-
-
-
-
-
-
-
-
-
-
-
-
-
-
-
-
-
-
-
C
DC
25A
maj
uba
Dist
rict M
unic
ipal
ity 4
0 77
9
-
( 5
00)
40
279
5
0 00
0
-
-
50
000
-
-
-
-
-
-
-
-
-
-
-
-
-
-
-
-
-
-
-
-
To
tal:
Am
ajub
a M
unic
ipal
ities
183
538
-
(
2 25
2)
181
286
8
5 00
0
-
-
85
000
-
-
-
-
-
-
-
-
-
-
-
-
-
-
-
-
-
-
-
-
BK
ZN26
1eD
umbe
17
952
-
(
220
) 1
7 73
2
-
-
-
-
-
-
-
-
-
-
-
-
-
-
-
-
-
-
-
-
-
-
-
-
BK
ZN26
2uP
hong
olo
28
134
-
(
345
) 2
7 78
9
-
-
-
-
-
-
-
-
-
-
-
-
-
-
-
-
-
-
-
-
-
-
-
-
BK
ZN26
3A
baQ
ulus
i 3
6 90
4
-
( 4
53)
36
451
-
-
-
-
-
-
-
-
-
-
-
-
-
-
-
-
-
-
-
-
-
-
-
-
B
KZN
265
Non
gom
a 3
1 67
9
-
( 3
89)
31
290
-
-
-
-
-
-
-
-
-
-
-
-
-
-
-
-
-
-
-
-
-
-
-
-
B
KZN
266
Ulu
ndi
30
713
-
(
377
) 3
0 33
6
-
-
-
-
-
-
-
-
-
-
-
-
-
-
-
-
-
-
-
-
-
-
-
-
CD
C26
Zulu
land
Dist
rict M
unic
ipal
ity 2
23 9
84
-
( 2
749)
2
21 2
35
105
500
-
-
1
05 5
00
-
-
-
-
-
-
-
-
-
-
-
-
-
-
-
-
-
-
-
-
Tota
l: Zu
lula
nd M
unic
ipal
ities
369
366
-
(
4 53
3)
364
833
1
05 5
00
-
-
105
500
-
-
-
-
-
-
-
-
-
-
-
-
-
-
-
-
-
-
-
-
BK
ZN27
1uM
hlab
uyal
inga
na 3
4 70
2
-
( 4
26)
34
276
-
-
-
-
-
-
-
-
-
-
-
-
-
-
-
-
-
-
-
-
-
-
-
-
B
KZN
272
Jozi
ni 4
6 76
0
-
( 5
74)
46
186
-
-
-
-
-
-
-
-
-
-
-
-
-
-
-
-
-
-
-
-
-
-
-
-
B
KZN
275
Mtu
batu
ba 3
1 55
7
-
( 3
87)
31
170
-
-
-
-
-
-
-
-
-
-
-
-
-
-
-
-
-
-
-
-
-
-
-
-
B
KZN
276
Big
Fiv
e H
labi
sa 2
1 23
9
-
( 2
61)
20
978
-
-
-
-
-
-
-
-
-
-
-
-
-
-
-
-
-
-
-
-
-
-
-
-
C
DC
27uM
khan
yaku
de D
istric
t Mun
icip
ality
213
445
-
(
2 61
9)
210
826
8
4 40
0
-
( 16
630
) 6
7 77
0
-
-
-
-
-
-
-
-
-
-
-
-
-
-
-
-
-
-
-
-
Tota
l: uM
khan
yaku
de M
unic
ipal
ities
347
703
-
(
4 26
7)
343
436
8
4 40
0
-
( 16
630
) 6
7 77
0
-
-
-
-
-
-
-
-
-
-
-
-
-
-
-
-
-
-
-
-
BK
ZN28
1uM
folo
zi 3
9 07
1
-
( 4
79)
38
592
-
-
-
-
-
-
-
-
-
-
-
-
-
-
-
-
-
-
-
-
-
-
-
-
B
KZN
282
uMhl
athu
ze-
-
-
-
2
5 00
0
-
-
25
000
1
61 9
55
-
( 1
992)
1
59 9
63
-
-
-
-
-
-
-
-
-
-
-
-
-
-
-
-
BK
ZN28
4uM
lala
zi 4
0 12
5
-
( 4
92)
39
633
-
-
-
-
-
-
-
-
-
-
-
-
-
-
-
-
-
-
-
-
-
-
-
-
B
KZN
285
Mth
onja
neni
17
939
-
(
220
) 1
7 71
9
-
-
-
-
-
-
-
-
-
-
-
-
-
-
-
-
-
-
-
-
-
-
-
-
BK
ZN28
6N
kand
la 2
2 70
6
-
( 2
79)
22
427
-
-
-
-
-
-
-
-
-
-
-
-
-
-
-
-
-
-
-
-
-
-
-
-
C
DC
28K
ing
Cet
shw
ayo
Dist
rict M
unic
ipal
ity 1
69 6
23
-
( 2
082)
1
67 5
41
75
000
-
(
15 0
00)
60
000
-
-
-
-
-
-
-
-
-
-
-
-
-
-
-
-
-
-
-
-
To
tal:
Kin
g C
etsh
way
o M
unic
ipal
ities
289
464
-
(
3 55
2)
285
912
1
00 0
00
-
( 15
000
) 8
5 00
0
161
955
-
(
1 99
2)
159
963
-
-
-
-
-
-
-
-
-
-
-
-
-
-
-
-
BK
ZN29
1M
ande
ni 3
5 15
0
-
( 4
31)
34
719
-
-
-
-
-
-
-
-
-
-
-
-
-
-
-
-
-
-
-
-
-
-
-
-
B
KZN
292
Kw
aDuk
uza
51
347
-
(
630
) 5
0 71
7
-
-
-
-
-
-
-
-
-
-
-
-
-
-
-
-
-
-
-
-
-
-
-
-
BK
ZN29
3N
dwed
we
29
630
-
(
364
) 2
9 26
6
-
-
-
-
-
-
-
-
-
-
-
-
-
-
-
-
-
-
-
-
-
-
-
-
BK
ZN29
4M
aphu
mul
o 2
2 19
5
-
( 2
72)
21
923
-
-
-
-
-
-
-
-
-
-
-
-
-
-
-
-
-
-
-
-
-
-
-
-
C
DC
29iL
embe
Dist
rict M
unic
ipal
ity 1
91 2
43
-
( 2
347)
1
88 8
96
65
000
-
-
6
5 00
0
-
-
-
-
-
-
-
-
-
-
-
-
-
-
-
-
-
-
-
-
Tota
l: iL
embe
Mun
icip
aliti
es 3
29 5
65
-
( 4
044)
3
25 5
21
65
000
-
-
6
5 00
0
-
-
-
-
-
-
-
-
-
-
-
-
-
-
-
-
-
-
-
-
BK
ZN43
3G
reat
er K
okst
ad 1
7 22
9
-
( 2
11)
17
018
-
-
-
-
-
-
-
-
-
-
-
-
-
-
-
-
-
-
-
-
-
-
-
-
B
KZN
434
uBuh
lebe
zwe
26
759
-
(
328
) 2
6 43
1
-
-
-
-
-
-
-
-
-
-
-
-
-
-
-
-
-
-
-
-
-
-
-
-
BK
ZN43
5uM
zim
khul
u 4
3 09
7
-
( 5
29)
42
568
-
-
-
-
-
-
-
-
-
-
-
-
-
-
-
-
-
-
-
-
-
-
-
-
B
KZN
436
Dr N
kosa
zana
Dla
min
i Zum
a 2
6 98
9
-
( 3
31)
26
658
-
-
-
-
-
-
-
-
-
-
-
-
-
-
-
-
-
-
-
-
-
-
-
-
C
DC
43H
arry
Gw
ala
Dist
rict M
unic
ipal
ity 1
99 4
48
-
( 2
448)
1
97 0
00
60
000
-
-
6
0 00
0
-
-
-
-
-
-
-
-
-
-
-
-
-
-
-
-
-
-
-
-
Tota
l: H
arry
Gw
ala
Mun
icip
aliti
es 3
13 5
22
-
( 3
847)
3
09 6
75
60
000
-
-
6
0 00
0
-
-
-
-
-
-
-
-
-
-
-
-
-
-
-
-
-
-
-
-
Tota
l: K
waZ
ulu-
Nat
al M
unic
ipal
ities
3 1
95 3
69
-
( 39
212
) 3
156
157
8
31 3
90
-
( 31
630
) 7
99 7
60
227
268
-
(
2 79
6)
224
472
1
962
647
(
191
361)
-
1
771
286
4
6 46
4
-
( 5
53)
45
911
1
10 0
00
( 13
300
) -
9
6 70
0
783
643
(
124
387)
(
36 6
61)
622
595
54

1st A
djus
tmen
tC
ateg
ory
Mun
icip
ality
Inte
grat
ed C
ity D
evel
opm
ent G
rant
M
unic
ipal
Infr
astr
uctu
re G
rant
2020
/21
Mai
nAl
loca
tion
Wat
er S
ervi
ces I
nfra
stru
ctur
e G
rant
2020
/21
Adju
sted
Al
loca
tion
Nei
ghbo
urho
od D
evel
opm
ent P
artn
ersh
ip G
rant
(Cap
ital)
Publ
ic T
rans
port
Net
wor
k G
rant
1st A
djus
tmen
t20
20/2
1Ad
just
ed
Allo
catio
n2n
d Ad
just
men
t20
20/2
1Ad
just
ed
Allo
catio
n
2020
/21
Mai
nAl
loca
tion
1st A
djus
tmen
t1s
t Adj
ustm
ent
Nat
iona
l and
Mun
icip
al F
inan
cial
Yea
rs
1st A
djus
tmen
t20
20/2
1Ad
just
ed
Allo
catio
n
Nat
iona
l and
Mun
icip
al F
inan
cial
Yea
rs
2020
/21
Mai
nAl
loca
tion
2020
/21
Adju
sted
Al
loca
tion
2020
/21
Mai
nAl
loca
tion
2020
/21
Adju
sted
Al
loca
tion
2020
/21
Mai
nAl
loca
tion
Nat
iona
l and
Mun
icip
al F
inan
cial
Yea
rs
AN
NEX
UR
E E
INFR
AST
RU
CTU
RE
GR
AN
T A
LLO
CA
TIO
NS
TO M
UN
ICIP
ALI
TIES
(SC
HED
ULE
4, P
AR
T B
AN
D S
CH
EDU
LE 5
, PA
RT
B)
Urb
an S
ettle
men
ts D
evel
opm
ent G
rant
Nat
iona
l and
Mun
icip
al F
inan
cial
Yea
rsN
atio
nal a
nd M
unic
ipal
Fin
anci
al Y
ears
Inte
grat
ed U
rban
Dev
elop
men
t Gra
nt
Nat
iona
l and
Mun
icip
al F
inan
cial
Yea
rsN
atio
nal a
nd M
unic
ipal
Fin
anci
al Y
ears
2nd
Adju
stm
ent
2nd
Adju
stm
ent
2nd
Adju
stm
ent
2nd
Adju
stm
ent
2nd
Adju
stm
ent
2nd
Adju
stm
ent
2020
/21
Mai
nAl
loca
tion
1st A
djus
tmen
t20
20/2
1Ad
just
ed
Allo
catio
n
2020
/21
Mai
nAl
loca
tion
1st A
djus
tmen
t
LIM
POPO
BLI
M33
1G
reat
er G
iyan
i 6
0 28
6
-
( 7
40)
59
546
-
-
-
-
-
-
-
-
-
-
-
-
-
-
-
-
-
-
-
-
-
-
-
-
B
LIM
332
Gre
ater
Let
aba
57
229
-
(
702
) 5
6 52
7
-
-
-
-
-
-
-
-
-
-
-
-
-
-
-
-
-
-
-
-
-
-
-
-
BLI
M33
3G
reat
er T
zane
en 9
3 61
9
-
( 1
149)
9
2 47
0
-
-
-
-
-
-
-
-
-
-
-
-
-
-
-
-
-
-
-
-
-
-
-
-
BLI
M33
4B
a-Ph
alab
orw
a 3
1 83
1
-
( 3
91)
31
440
-
-
-
-
-
-
-
-
-
-
-
-
-
-
-
-
-
-
-
-
-
-
-
-
B
LIM
335
Mar
ulen
g 2
6 65
5
-
( 3
27)
26
328
-
-
-
-
-
-
-
-
-
-
-
-
-
-
-
-
-
-
-
-
-
-
-
-
C
DC
33M
opan
i Dist
rict M
unic
ipal
ity 4
51 0
56
-
( 5
535)
4
45 5
21
45
000
-
-
4
5 00
0
-
-
-
-
-
-
-
-
-
-
-
-
-
-
-
-
-
-
-
-
Tota
l: M
opan
i Mun
icip
aliti
es 7
20 6
76
-
( 8
844)
7
11 8
32
45
000
-
-
4
5 00
0
-
-
-
-
-
-
-
-
-
-
-
-
-
-
-
-
-
-
-
-
BLI
M34
1M
usin
a 5
8 84
3
-
( 25
422
) 3
3 42
1
-
-
-
-
-
-
-
-
-
-
-
-
-
-
-
-
-
-
-
-
-
-
-
-
BLI
M34
3Th
ulam
ela
98
702
-
(
1 21
1)
97
491
-
-
-
-
-
-
-
-
-
-
-
-
-
-
-
-
-
-
-
-
-
-
-
-
B
LIM
344
Mak
hado
88
968
-
(
1 09
2)
87
876
-
-
-
-
-
-
-
-
-
-
-
-
-
-
-
-
-
-
-
-
-
-
-
-
B
LIM
345
Col
lins C
haba
ne 8
1 47
5
-
( 1
000)
8
0 47
5
-
-
-
-
-
-
-
-
-
-
-
-
-
-
-
-
-
-
-
-
-
-
-
-
CD
C34
Vhe
mbe
Dist
rict M
unic
ipal
ity 5
11 0
93
-
( 6
272)
5
04 8
21
52
750
-
-
5
2 75
0
-
-
-
-
-
-
-
-
-
-
-
-
-
-
-
-
-
-
-
-
Tota
l: V
hem
be M
unic
ipal
ities
839
081
-
(
34 9
97)
804
084
5
2 75
0
-
-
52
750
-
-
-
-
-
-
-
-
-
-
-
-
-
-
-
-
-
-
-
-
BLI
M35
1B
loub
erg
44
066
-
(
541
) 4
3 52
5
-
-
-
-
-
-
-
-
-
-
-
-
-
-
-
-
-
-
-
-
-
-
-
-
BLI
M35
3M
olem
ole
34
933
-
(
429
) 3
4 50
4
-
-
-
-
-
-
-
-
-
-
-
-
-
-
-
-
-
-
-
-
-
-
-
-
BLI
M35
4Po
lokw
ane
-
-
24
700
2
4 70
0
50
000
-
-
5
0 00
0
350
966
-
(
4 31
8)
346
648
-
-
-
-
-
-
-
-
3
5 00
0
( 3
500)
-
3
1 50
0
189
292
(
30 0
46)
( 8
856)
1
50 3
90
BLI
M35
5Le
pele
-Nku
mpi
53
720
-
(
659
) 5
3 06
1
-
-
-
-
-
-
-
-
-
-
-
-
-
-
-
-
-
-
-
-
-
-
-
-
CD
C35
Cap
ricor
n D
istric
t Mun
icip
ality
229
161
-
(
2 81
2)
226
349
8
0 00
0
-
-
80
000
-
-
-
-
-
-
-
-
-
-
-
-
-
-
-
-
-
-
-
-
To
tal:
Cap
rico
rn M
unic
ipal
ities
361
880
-
2
0 25
9
382
139
1
30 0
00
-
-
130
000
3
50 9
66
-
( 4
318)
3
46 6
48
-
-
-
-
-
-
-
-
35
000
(
3 50
0)
-
31
500
1
89 2
92
( 30
046
) (
8 85
6)
150
390
BLI
M36
1Th
abaz
imbi
44
024
-
(
540
) 4
3 48
4
-
-
-
-
-
-
-
-
-
-
-
-
-
-
-
-
-
-
-
-
-
-
-
-
BLI
M36
2Le
phal
ale
43
364
-
(
532
) 4
2 83
2
35
200
-
-
3
5 20
0
-
-
-
-
-
-
-
-
-
-
-
-
-
-
-
-
-
-
-
-
BLI
M36
6B
ela-
Bel
a 2
5 76
0
-
( 3
16)
25
444
3
7 47
5
-
-
37
475
-
-
-
-
-
-
-
-
-
-
-
-
-
-
-
-
-
-
-
-
B
LIM
367
Mog
alak
wen
a 1
55 3
26
-
( 1
906)
1
53 4
20
43
850
-
-
4
3 85
0
-
-
-
-
-
-
-
-
-
-
-
-
-
-
-
-
-
-
-
-
BLI
M36
8M
odim
olle
-Moo
kgop
hong
38
317
-
(
470
) 3
7 84
7
-
-
-
-
-
-
-
-
-
-
-
-
-
-
-
-
-
-
-
-
-
-
-
-
CD
C36
Wat
erbe
rg D
istric
t Mun
icip
ality
-
-
-
-
-
-
-
-
-
-
-
-
-
-
-
-
-
-
-
-
-
-
-
-
-
-
-
-
Tota
l: W
ater
berg
Mun
icip
aliti
es 3
06 7
91
-
( 3
764)
3
03 0
27
116
525
-
-
1
16 5
25
-
-
-
-
-
-
-
-
-
-
-
-
-
-
-
-
-
-
-
-
BLI
M47
1Ep
hrai
m M
ogal
e 3
3 23
8
-
( 4
08)
32
830
-
-
-
-
-
-
-
-
-
-
-
-
-
-
-
-
-
-
-
-
-
-
-
-
B
LIM
472
Elia
s Mot
soal
edi
54
561
-
(
670
) 5
3 89
1
-
-
-
-
-
-
-
-
-
-
-
-
-
-
-
-
-
-
-
-
-
-
-
-
BLI
M47
3M
akhu
duth
amag
a 6
1 71
0
-
( 7
57)
60
953
-
-
-
-
-
-
-
-
-
-
-
-
-
-
-
-
-
-
-
-
-
-
-
-
B
LIM
476
Feta
kgom
o Tu
bats
e 8
3 79
7
-
( 1
028)
8
2 76
9
-
-
-
-
-
-
-
-
-
-
-
-
-
-
-
-
-
-
-
-
-
-
-
-
CD
C47
Sekh
ukhu
ne D
istric
t Mun
icip
ality
471
805
-
(
5 79
0)
466
015
5
3 47
1
-
-
53
471
-
-
-
-
-
-
-
-
-
-
-
-
-
-
-
-
-
-
-
-
To
tal:
Sekh
ukhu
ne M
unic
ipal
ities
705
111
-
(
8 65
3)
696
458
5
3 47
1
-
-
53
471
-
-
-
-
-
-
-
-
-
-
-
-
-
-
-
-
-
-
-
-
Tota
l: L
impo
po M
unic
ipal
ities
2 9
33 5
39
-
( 35
999
) 2
897
540
3
97 7
46
-
-
397
746
3
50 9
66
-
( 4
318)
3
46 6
48
-
-
-
-
-
-
-
-
35
000
(
3 50
0)
-
31
500
1
89 2
92
( 30
046
) (
8 85
6)
150
390
MPU
MA
LA
NG
A
BM
P301
Chi
ef A
lber
t Lut
huli
86
480
-
(
1 06
1)
85
419
2
6 37
5
-
-
26
375
-
-
-
-
-
-
-
-
-
-
-
-
-
-
-
-
-
-
-
-
B
MP3
02M
suka
ligw
a 5
2 36
6
-
( 6
43)
51
723
2
0 00
0
-
-
20
000
-
-
-
-
-
-
-
-
-
-
-
-
-
-
-
-
-
-
-
-
B
MP3
03M
khon
do 7
7 80
7
-
( 9
55)
76
852
2
6 00
0
-
30
000
5
6 00
0
-
-
-
-
-
-
-
-
-
-
-
-
-
-
-
-
-
-
-
-
BM
P304
Dr P
ixle
y ka
Isak
a Se
me
26
269
-
(
322
) 2
5 94
7
30
000
-
-
3
0 00
0
-
-
-
-
-
-
-
-
-
-
-
-
-
-
-
-
-
-
-
-
BM
P305
Lekw
a 2
8 67
2
-
( 3
52)
28
320
-
-
-
-
-
-
-
-
-
-
-
-
-
-
-
-
-
-
-
-
-
-
-
-
B
MP3
06D
ipal
esen
g 1
8 71
7
-
( 2
30)
18
487
-
-
-
-
-
-
-
-
-
-
-
-
-
-
-
-
-
-
-
-
-
-
-
-
B
MP3
07G
ovan
Mbe
ki 5
7 42
2
-
( 7
05)
56
717
3
0 00
0
-
-
30
000
-
-
-
-
-
-
-
-
-
-
-
-
-
-
-
-
-
-
-
-
C
DC
30G
ert S
iban
de D
istric
t Mun
icip
ality
-
-
-
-
-
-
-
-
-
-
-
-
-
-
-
-
-
-
-
-
-
-
-
-
-
-
-
-
Tota
l: G
ert S
iban
de M
unic
ipal
ities
347
733
-
(
4 26
8)
343
465
1
32 3
75
-
30
000
1
62 3
75
-
-
-
-
-
-
-
-
-
-
-
-
-
-
-
-
-
-
-
-
BM
P311
Vic
tor K
hany
e 2
4 76
8
-
( 3
04)
24
464
-
-
-
-
-
-
-
-
-
-
-
-
-
-
-
-
-
-
-
-
-
-
-
-
B
MP3
12Em
alah
leni
119
146
-
(
1 46
2)
117
684
3
0 00
0
-
( 30
000
) -
-
-
-
-
-
-
-
-
-
-
-
-
-
-
-
-
-
-
-
-
B
MP3
13St
eve
Tshw
ete
-
-
-
-
25
000
-
-
2
5 00
0
92
937
-
(
1 14
3)
91
794
-
-
-
-
-
-
-
-
-
-
-
-
-
-
-
-
B
MP3
14Em
akha
zeni
18
139
-
(
223
) 1
7 91
6
30
000
-
-
3
0 00
0
-
-
-
-
-
-
-
-
-
-
-
-
-
-
-
-
-
-
-
-
BM
P315
Them
bisil
e H
ani
122
575
-
(
1 50
4)
121
071
5
0 00
0
-
-
50
000
-
-
-
-
-
-
-
-
-
-
-
-
-
-
-
-
-
-
-
-
B
MP3
16D
r JS
Mor
oka
124
245
-
(
1 52
5)
122
720
-
-
-
-
-
-
-
-
-
-
-
-
-
-
-
-
-
-
-
-
-
-
-
-
C
DC
31N
kang
ala
Dist
rict M
unic
ipal
ity-
-
-
-
-
-
-
-
-
-
-
-
-
-
-
-
-
-
-
-
-
-
-
-
-
-
-
-
To
tal:
Nka
ngal
a M
unic
ipal
ities
408
873
-
(
5 01
8)
403
855
1
35 0
00
-
( 30
000
) 1
05 0
00
92
937
-
(
1 14
3)
91
794
-
-
-
-
-
-
-
-
-
-
-
-
-
-
-
-
BM
P321
Thab
a C
hweu
47
076
-
(
578
) 4
6 49
8
15
000
-
-
1
5 00
0
-
-
-
-
-
-
-
-
-
-
-
-
-
-
-
-
-
-
-
-
BM
P324
Nko
maz
i 2
23 4
76
-
( 2
742)
2
20 7
34
40
000
-
-
4
0 00
0
-
-
-
-
-
-
-
-
-
-
-
-
-
-
-
-
-
-
-
-
BM
P325
Bus
hbuc
krid
ge 3
71 3
79
-
( 4
557)
3
66 8
22
80
000
-
-
8
0 00
0
-
-
-
-
-
-
-
-
-
-
-
-
-
-
-
-
-
-
-
-
BM
P326
City
of M
bom
bela
331
383
-
(
4 06
7)
327
316
-
-
-
-
-
-
-
-
-
-
-
-
-
-
-
-
2
500
-
-
2
500
-
-
-
-
C
DC
32Eh
lanz
eni D
istric
t Mun
icip
ality
-
-
-
-
-
-
-
-
-
-
-
-
-
-
-
-
-
-
-
-
-
-
-
-
-
-
-
-
Tota
l: E
hlan
zeni
Mun
icip
aliti
es 9
73 3
14
-
( 11
944
) 9
61 3
70
135
000
-
-
1
35 0
00
-
-
-
-
-
-
-
-
-
-
-
-
2 5
00
-
-
2 5
00
-
-
-
-
Tota
l: M
pum
alan
ga M
unic
ipal
ities
1 7
29 9
20
-
( 21
230
) 1
708
690
4
02 3
75
-
-
402
375
9
2 93
7
-
( 1
143)
9
1 79
4
-
-
-
-
-
-
-
-
2 5
00
-
-
2 5
00
-
-
-
-
55

1st A
djus
tmen
tC
ateg
ory
Mun
icip
ality
Inte
grat
ed C
ity D
evel
opm
ent G
rant
M
unic
ipal
Infr
astr
uctu
re G
rant
2020
/21
Mai
nAl
loca
tion
Wat
er S
ervi
ces I
nfra
stru
ctur
e G
rant
2020
/21
Adju
sted
Al
loca
tion
Nei
ghbo
urho
od D
evel
opm
ent P
artn
ersh
ip G
rant
(Cap
ital)
Publ
ic T
rans
port
Net
wor
k G
rant
1st A
djus
tmen
t20
20/2
1Ad
just
ed
Allo
catio
n2n
d Ad
just
men
t20
20/2
1Ad
just
ed
Allo
catio
n
2020
/21
Mai
nAl
loca
tion
1st A
djus
tmen
t1s
t Adj
ustm
ent
Nat
iona
l and
Mun
icip
al F
inan
cial
Yea
rs
1st A
djus
tmen
t20
20/2
1Ad
just
ed
Allo
catio
n
Nat
iona
l and
Mun
icip
al F
inan
cial
Yea
rs
2020
/21
Mai
nAl
loca
tion
2020
/21
Adju
sted
Al
loca
tion
2020
/21
Mai
nAl
loca
tion
2020
/21
Adju
sted
Al
loca
tion
2020
/21
Mai
nAl
loca
tion
Nat
iona
l and
Mun
icip
al F
inan
cial
Yea
rs
AN
NEX
UR
E E
INFR
AST
RU
CTU
RE
GR
AN
T A
LLO
CA
TIO
NS
TO M
UN
ICIP
ALI
TIES
(SC
HED
ULE
4, P
AR
T B
AN
D S
CH
EDU
LE 5
, PA
RT
B)
Urb
an S
ettle
men
ts D
evel
opm
ent G
rant
Nat
iona
l and
Mun
icip
al F
inan
cial
Yea
rsN
atio
nal a
nd M
unic
ipal
Fin
anci
al Y
ears
Inte
grat
ed U
rban
Dev
elop
men
t Gra
nt
Nat
iona
l and
Mun
icip
al F
inan
cial
Yea
rsN
atio
nal a
nd M
unic
ipal
Fin
anci
al Y
ears
2nd
Adju
stm
ent
2nd
Adju
stm
ent
2nd
Adju
stm
ent
2nd
Adju
stm
ent
2nd
Adju
stm
ent
2nd
Adju
stm
ent
2020
/21
Mai
nAl
loca
tion
1st A
djus
tmen
t20
20/2
1Ad
just
ed
Allo
catio
n
2020
/21
Mai
nAl
loca
tion
1st A
djus
tmen
t
NO
RTH
ER
N C
APE
BN
C06
1R
icht
ersv
eld
7 3
21
-
( 9
0)
7 2
31
10
000
-
-
1
0 00
0
-
-
-
-
-
-
-
-
-
-
-
-
-
-
-
-
-
-
-
-
BN
C06
2N
ama
Kho
i 2
2 02
4
-
( 2
70)
21
754
1
6 70
0
-
-
16
700
-
-
-
-
-
-
-
-
-
-
-
-
-
-
-
-
-
-
-
-
B
NC
064
Kam
iesb
erg
7 5
34
-
( 9
2)
7 4
42
12
000
-
-
1
2 00
0
-
-
-
-
-
-
-
-
-
-
-
-
-
-
-
-
-
-
-
-
BN
C06
5H
anta
m 9
726
-
(
119
) 9
607
2
4 00
0
-
-
24
000
-
-
-
-
-
-
-
-
-
-
-
-
-
-
-
-
-
-
-
-
B
NC
066
Kar
oo H
oogl
and
8 0
65
-
( 9
9)
7 9
66
-
-
-
-
-
-
-
-
-
-
-
-
-
-
-
-
-
-
-
-
-
-
-
-
BN
C06
7K
hâi-M
a 7
753
-
(
95)
7
658
-
-
-
-
-
-
-
-
-
-
-
-
-
-
-
-
-
-
-
-
-
-
-
-
C
DC
6N
amak
wa
Dist
rict M
unic
ipal
ity-
-
-
-
-
-
-
-
-
-
-
-
-
-
-
-
-
-
-
-
-
-
-
-
-
-
-
-
To
tal:
Nam
akw
a M
unic
ipal
ities
62
423
-
(
765
) 6
1 65
8
62
700
-
-
6
2 70
0
-
-
-
-
-
-
-
-
-
-
-
-
-
-
-
-
-
-
-
-
BN
C07
1U
bunt
u 9
934
-
(
122
) 9
812
7
500
-
-
7
500
-
-
-
-
-
-
-
-
-
-
-
-
-
-
-
-
-
-
-
-
B
NC
072
Um
sobo
mvu
11
443
-
(
140
) 1
1 30
3
-
-
3 3
00
3 3
00
-
-
-
-
-
-
-
-
-
-
-
-
-
-
-
-
-
-
-
-
BN
C07
3Em
than
jeni
12
106
-
(
149
) 1
1 95
7
-
-
-
-
-
-
-
-
-
-
-
-
-
-
-
-
-
-
-
-
-
-
-
-
BN
C07
4K
aree
berg
8 0
16
-
( 9
8)
7 9
18
15
000
-
-
1
5 00
0
-
-
-
-
-
-
-
-
-
-
-
-
-
-
-
-
-
-
-
-
BN
C07
5R
enos
terb
erg
18
962
-
(
233
) 1
8 72
9
-
-
-
-
-
-
-
-
-
-
-
-
-
-
-
-
-
-
-
-
-
-
-
-
BN
C07
6Th
embe
lihle
20
917
-
(
257
) 2
0 66
0
-
-
-
-
-
-
-
-
-
-
-
-
-
-
-
-
-
-
-
-
-
-
-
-
BN
C07
7Si
yath
emba
9 7
94
-
( 1
20)
9 6
74
16
600
-
9
671
2
6 27
1
-
-
-
-
-
-
-
-
-
-
-
-
-
-
-
-
-
-
-
-
BN
C07
8Si
yanc
uma
16
524
-
(
203
) 1
6 32
1
15
000
-
-
1
5 00
0
-
-
-
-
-
-
-
-
-
-
-
-
-
-
-
-
-
-
-
-
CD
C7
Pixl
ey K
a Se
me
Dist
rict M
unic
ipal
ity-
-
-
-
-
-
-
-
-
-
-
-
-
-
-
-
-
-
-
-
-
-
-
-
-
-
-
-
To
tal:
Pixl
ey K
a Se
me
Mun
icip
aliti
es 1
07 6
96
-
( 1
322)
1
06 3
74
54
100
-
1
2 97
1
67
071
-
-
-
-
-
-
-
-
-
-
-
-
-
-
-
-
-
-
-
-
BN
C08
2!K
ai !G
arib
22
290
-
(
274
) 2
2 01
6
2 0
00
-
-
2 0
00
-
-
-
-
-
-
-
-
-
-
-
-
-
-
-
-
-
-
-
-
BN
C08
4!K
heis
19
980
-
(
245
) 1
9 73
5
-
-
-
-
-
-
-
-
-
-
-
-
-
-
-
-
-
-
-
-
-
-
-
-
BN
C08
5Ts
ants
aban
e 1
5 46
6
-
( 1
90)
15
276
-
-
-
-
-
-
-
-
-
-
-
-
-
-
-
-
-
-
-
-
-
-
-
-
B
NC
086
Kga
telo
pele
8 0
20
-
( 9
8)
7 9
22
8 0
00
-
-
8 0
00
-
-
-
-
-
-
-
-
-
-
-
-
-
-
-
-
-
-
-
-
BN
C08
7D
awid
Kru
iper
24
946
-
(
306
) 2
4 64
0
15
000
-
-
1
5 00
0
-
-
-
-
-
-
-
-
-
-
-
-
20
000
-
-
2
0 00
0
-
-
-
-
CD
C8
Z.F.
Mgc
awu
Dist
rict M
unic
ipal
ity-
-
-
-
-
-
-
-
-
-
-
-
-
-
-
-
-
-
-
-
-
-
-
-
-
-
-
-
To
tal:
Z.F.
Mgc
awu
Mun
icip
aliti
es 9
0 70
2
-
( 1
113)
8
9 58
9
25
000
-
-
2
5 00
0
-
-
-
-
-
-
-
-
-
-
-
-
20
000
-
-
2
0 00
0
-
-
-
-
BN
C09
1So
l Pla
atjie
-
-
-
-
25
943
-
(
12 9
71)
12
972
5
0 95
5
-
( 6
27)
50
328
-
-
-
-
-
-
-
-
2
0 00
0
-
-
20
000
-
-
-
-
B
NC
092
Dik
gatlo
ng 1
9 42
2
-
( 2
38)
19
184
7
000
-
-
7
000
-
-
-
-
-
-
-
-
-
-
-
-
-
-
-
-
-
-
-
-
B
NC
093
Mag
aren
g 1
1 11
9
-
( 1
36)
10
983
-
-
-
-
-
-
-
-
-
-
-
-
-
-
-
-
-
-
-
-
-
-
-
-
B
NC
094
Phok
wan
e 2
6 11
2
-
( 3
20)
25
792
2
1 00
0
-
-
21
000
-
-
-
-
-
-
-
-
-
-
-
-
-
-
-
-
-
-
-
-
C
DC
9Fr
ance
s Baa
rd D
istric
t Mun
icip
ality
-
-
-
-
-
-
-
-
-
-
-
-
-
-
-
-
-
-
-
-
-
-
-
-
-
-
-
-
Tota
l: Fr
ance
s Baa
rd M
unic
ipal
ities
56
653
-
(
694
) 5
5 95
9
53
943
-
(
12 9
71)
40
972
5
0 95
5
-
( 6
27)
50
328
-
-
-
-
-
-
-
-
2
0 00
0
-
-
20
000
-
-
-
-
BN
C45
1Jo
e M
orol
ong
59
628
-
(
732
) 5
8 89
6
50
000
-
-
5
0 00
0
-
-
-
-
-
-
-
-
-
-
-
-
-
-
-
-
-
-
-
-
BN
C45
2G
a-Se
gony
ana
52
954
-
(
650
) 5
2 30
4
40
000
-
-
4
0 00
0
-
-
-
-
-
-
-
-
-
-
-
-
-
-
-
-
-
-
-
-
BN
C45
3G
amag
ara
11
803
-
(
145
) 1
1 65
8
15
000
-
-
1
5 00
0
-
-
-
-
-
-
-
-
-
-
-
-
-
-
-
-
-
-
-
-
CD
C45
John
Tao
lo G
aets
ewe
Dist
rict M
unic
ipal
ity-
-
-
-
-
-
-
-
-
-
-
-
-
-
-
-
-
-
-
-
-
-
-
-
-
-
-
-
To
tal:
John
Tao
lo G
aets
ewe
Mun
icip
aliti
es 1
24 3
85
-
( 1
527)
1
22 8
58
105
000
-
-
1
05 0
00
-
-
-
-
-
-
-
-
-
-
-
-
-
-
-
-
-
-
-
-
Tota
l: N
orth
ern
Cap
e M
unic
ipal
ities
441
859
-
(
5 42
1)
436
438
3
00 7
43
-
-
300
743
5
0 95
5
-
( 6
27)
50
328
-
-
-
-
-
-
-
-
4
0 00
0
-
-
40
000
-
-
-
-
NO
RTH
WE
ST
BN
W37
1M
oret
ele
113
988
-
(
1 39
9)
112
589
8
4 40
0
-
-
84
400
-
-
-
-
-
-
-
-
-
-
-
-
-
-
-
-
-
-
-
-
B
NW
372
Mad
iben
g 2
79 8
01
-
( 3
434)
2
76 3
67
-
-
-
-
-
-
-
-
-
-
-
-
-
-
-
-
-
-
-
-
-
-
-
-
BN
W37
3R
uste
nbur
g 2
33 4
48
-
( 2
865)
2
30 5
83
72
840
-
-
7
2 84
0
-
-
-
-
-
-
-
-
-
-
-
-
10
000
-
-
1
0 00
0
230
939
(
36 6
57)
( 10
804
) 1
83 4
78
BN
W37
4K
getle
ngriv
ier
35
697
-
(
438
) 3
5 25
9
-
-
-
-
-
-
-
-
-
-
-
-
-
-
-
-
-
-
-
-
-
-
-
-
BN
W37
5M
oses
Kot
ane
148
649
-
(
1 82
4)
146
825
5
8 02
5
-
-
58
025
-
-
-
-
-
-
-
-
-
-
-
-
-
-
-
-
-
-
-
-
C
DC
37B
ojan
ala
Plat
inum
Dist
rict M
unic
ipal
ity-
-
-
-
-
-
-
-
-
-
-
-
-
-
-
-
-
-
-
-
-
-
-
-
-
-
-
-
To
tal:
Boj
anal
a Pl
atin
um M
unic
ipal
ities
811
583
-
(
9 96
0)
801
623
2
15 2
65
-
-
215
265
-
-
-
-
-
-
-
-
-
-
-
-
1
0 00
0
-
-
10
000
2
30 9
39
( 36
657
) (
10 8
04)
183
478
BN
W38
1R
atlo
u 2
9 22
4
-
( 3
59)
28
865
-
-
-
-
-
-
-
-
-
-
-
-
-
-
-
-
-
-
-
-
-
-
-
-
B
NW
382
Tsw
aing
29
099
-
(
357
) 2
8 74
2
-
-
-
-
-
-
-
-
-
-
-
-
-
-
-
-
-
-
-
-
-
-
-
-
BN
W38
3M
afik
eng
80
825
-
(
992
) 7
9 83
3
-
-
-
-
-
-
-
-
-
-
-
-
-
-
-
-
-
-
-
-
-
-
-
-
BN
W38
4D
itsob
otla
46
612
-
(
572
) 4
6 04
0
-
-
-
-
-
-
-
-
-
-
-
-
-
-
-
-
-
-
-
-
-
-
-
-
BN
W38
5R
amot
sher
e M
oilo
a 3
6 92
3
-
( 4
53)
36
470
-
-
-
-
-
-
-
-
-
-
-
-
-
-
-
-
-
-
-
-
-
-
-
-
C
DC
38N
gaka
Mod
iri M
olem
a D
istric
t Mun
icip
ality
297
376
-
(
3 64
9)
293
727
-
-
-
-
-
-
-
-
-
-
-
-
-
-
-
-
-
-
-
-
-
-
-
-
To
tal:
Nga
ka M
odir
i Mol
ema
Mun
icip
aliti
es 5
20 0
59
-
( 6
382)
5
13 6
77
-
-
-
-
-
-
-
-
-
-
-
-
-
-
-
-
-
-
-
-
-
-
-
-
BN
W39
2N
aled
i 1
6 89
3
-
( 2
07)
16
686
-
-
-
-
-
-
-
-
-
-
-
-
-
-
-
-
-
-
-
-
-
-
-
-
B
NW
393
Mam
usa
15
618
-
(
192
) 1
5 42
6
-
-
-
-
-
-
-
-
-
-
-
-
-
-
-
-
-
-
-
-
-
-
-
-
BN
W39
4G
reat
er T
aung
47
297
-
(
580
) 4
6 71
7
-
-
-
-
-
-
-
-
-
-
-
-
-
-
-
-
-
-
-
-
-
-
-
-
BN
W39
6Le
kwa-
Teem
ane
14
722
-
(
181
) 1
4 54
1
-
-
-
-
-
-
-
-
-
-
-
-
-
-
-
-
-
-
-
-
-
-
-
-
BN
W39
7K
agisa
no-M
olop
o 2
9 88
7
-
( 3
67)
29
520
-
-
-
-
-
-
-
-
-
-
-
-
-
-
-
-
-
-
-
-
-
-
-
-
C
DC
39D
r Rut
h Se
gom
otsi
Mom
pati
Dist
rict M
unic
ipal
ity 1
37 4
31
-
( 1
686)
1
35 7
45
32
000
-
-
3
2 00
0
-
-
-
-
-
-
-
-
-
-
-
-
-
-
-
-
-
-
-
-
Tota
l: D
r R
uth
Sego
mot
si M
ompa
ti M
unic
ipal
ities
261
848
-
(
3 21
3)
258
635
3
2 00
0
-
-
32
000
-
-
-
-
-
-
-
-
-
-
-
-
-
-
-
-
-
-
-
-
BN
W40
3C
ity o
f Mat
losa
na 8
6 89
4
-
( 1
066)
8
5 82
8
16
000
-
-
1
6 00
0
-
-
-
-
-
-
-
-
-
-
-
-
40
000
(
6 84
3)
-
33
157
-
-
-
-
B
NW
404
Maq
uass
i Hill
s 2
8 04
2
-
( 3
44)
27
698
3
0 00
0
-
-
30
000
-
-
-
-
-
-
-
-
-
-
-
-
-
-
-
-
-
-
-
-
B
NW
405
JB M
arks
66
245
-
(
813
) 6
5 43
2
15
000
-
-
1
5 00
0
-
-
-
-
-
-
-
-
-
-
-
-
2 0
00
-
-
2 0
00
-
-
-
-
CD
C40
Dr K
enne
th K
aund
a D
istric
t Mun
icip
ality
-
-
-
-
-
-
-
-
-
-
-
-
-
-
-
-
-
-
-
-
-
-
-
-
-
-
-
-
Tota
l: D
r K
enne
th K
aund
a M
unic
ipal
ities
181
181
-
(
2 22
3)
178
958
6
1 00
0
-
-
61
000
-
-
-
-
-
-
-
-
-
-
-
-
4
2 00
0
( 6
843)
-
3
5 15
7
-
-
-
-
Tota
l: N
orth
Wes
t Mun
icip
aliti
es 1
774
671
-
(
21 7
78)
1 7
52 8
93
308
265
-
-
3
08 2
65
-
-
-
-
-
-
-
-
-
-
-
-
52
000
(
6 84
3)
-
45
157
2
30 9
39
( 36
657
) (
10 8
04)
183
478
56

1st A
djus
tmen
tC
ateg
ory
Mun
icip
ality
Inte
grat
ed C
ity D
evel
opm
ent G
rant
M
unic
ipal
Infr
astr
uctu
re G
rant
2020
/21
Mai
nAl
loca
tion
Wat
er S
ervi
ces I
nfra
stru
ctur
e G
rant
2020
/21
Adju
sted
Al
loca
tion
Nei
ghbo
urho
od D
evel
opm
ent P
artn
ersh
ip G
rant
(Cap
ital)
Publ
ic T
rans
port
Net
wor
k G
rant
1st A
djus
tmen
t20
20/2
1Ad
just
ed
Allo
catio
n2n
d Ad
just
men
t20
20/2
1Ad
just
ed
Allo
catio
n
2020
/21
Mai
nAl
loca
tion
1st A
djus
tmen
t1s
t Adj
ustm
ent
Nat
iona
l and
Mun
icip
al F
inan
cial
Yea
rs
1st A
djus
tmen
t20
20/2
1Ad
just
ed
Allo
catio
n
Nat
iona
l and
Mun
icip
al F
inan
cial
Yea
rs
2020
/21
Mai
nAl
loca
tion
2020
/21
Adju
sted
Al
loca
tion
2020
/21
Mai
nAl
loca
tion
2020
/21
Adju
sted
Al
loca
tion
2020
/21
Mai
nAl
loca
tion
Nat
iona
l and
Mun
icip
al F
inan
cial
Yea
rs
AN
NEX
UR
E E
INFR
AST
RU
CTU
RE
GR
AN
T A
LLO
CA
TIO
NS
TO M
UN
ICIP
ALI
TIES
(SC
HED
ULE
4, P
AR
T B
AN
D S
CH
EDU
LE 5
, PA
RT
B)
Urb
an S
ettle
men
ts D
evel
opm
ent G
rant
Nat
iona
l and
Mun
icip
al F
inan
cial
Yea
rsN
atio
nal a
nd M
unic
ipal
Fin
anci
al Y
ears
Inte
grat
ed U
rban
Dev
elop
men
t Gra
nt
Nat
iona
l and
Mun
icip
al F
inan
cial
Yea
rsN
atio
nal a
nd M
unic
ipal
Fin
anci
al Y
ears
2nd
Adju
stm
ent
2nd
Adju
stm
ent
2nd
Adju
stm
ent
2nd
Adju
stm
ent
2nd
Adju
stm
ent
2nd
Adju
stm
ent
2020
/21
Mai
nAl
loca
tion
1st A
djus
tmen
t20
20/2
1Ad
just
ed
Allo
catio
n
2020
/21
Mai
nAl
loca
tion
1st A
djus
tmen
t
WE
STE
RN
CA
PE
AC
PTC
ity o
f Cap
e To
wn
-
-
-
-
-
-
-
-
-
-
-
-
1 4
81 6
04
( 14
4 45
9)
-
1 3
37 1
45
65
944
-
(
784
) 6
5 16
0
66
536
(
34 6
00)
( 12
332
) 1
9 60
4
1 9
89 9
74
( 1 1
94 9
95)
( 44
208
) 7
50 7
71
BW
C01
1M
atzi
kam
a 3
1 19
0
-
( 3
83)
30
807
4
7 00
0
-
( 17
000
) 3
0 00
0
-
-
-
-
-
-
-
-
-
-
-
-
-
-
-
-
-
-
-
-
BW
C01
2C
eder
berg
15
590
-
(
191
) 1
5 39
9
30
000
-
(
30 0
00)
-
-
-
-
-
-
-
-
-
-
-
-
-
-
-
-
-
-
-
-
-
BW
C01
3B
ergr
ivie
r 1
4 47
9
-
( 1
78)
14
301
-
-
6
596
6
596
-
-
-
-
-
-
-
-
-
-
-
-
-
-
-
-
-
-
-
-
B
WC
014
Sald
anha
Bay
19
311
-
(
237
) 1
9 07
4
-
-
-
-
-
-
-
-
-
-
-
-
-
-
-
-
-
-
-
-
-
-
-
-
BW
C01
5Sw
artla
nd 2
1 18
3
-
( 2
60)
20
923
-
-
-
-
-
-
-
-
-
-
-
-
-
-
-
-
-
-
-
-
-
-
-
-
C
DC
1W
est C
oast
Dist
rict M
unic
ipal
ity-
-
-
-
-
-
-
-
-
-
-
-
-
-
-
-
-
-
-
-
-
-
-
-
-
-
-
-
To
tal:
Wes
t Coa
st M
unic
ipal
ities
101
753
-
(
1 24
9)
100
504
7
7 00
0
-
( 40
404
) 3
6 59
6
-
-
-
-
-
-
-
-
-
-
-
-
-
-
-
-
-
-
-
-
BW
C02
2W
itzen
berg
22
286
-
(
273
) 2
2 01
3
-
-
-
-
-
-
-
-
-
-
-
-
-
-
-
-
-
-
-
-
-
-
-
-
BW
C02
3D
rake
nste
in-
-
-
-
-
-
4
095
4
095
5
8 64
9
-
( 7
22)
57
927
-
-
-
-
-
-
-
-
-
-
-
-
-
-
-
-
B
WC
024
Stel
lenb
osch
-
-
-
-
-
-
-
-
47
490
-
(
584
) 4
6 90
6
-
-
-
-
-
-
-
-
-
-
-
-
-
-
-
-
BW
C02
5B
reed
e V
alle
y 3
4 24
0
-
( 4
20)
33
820
-
-
-
-
-
-
-
-
-
-
-
-
-
-
-
-
-
-
-
-
-
-
-
-
B
WC
026
Lang
eber
g 2
1 86
0
-
( 2
68)
21
592
-
-
2
1 09
3
21
093
-
-
-
-
-
-
-
-
-
-
-
-
2
0 00
0
-
-
20
000
-
-
-
-
C
DC
2C
ape
Win
elan
ds D
istric
t Mun
icip
ality
-
-
-
-
-
-
-
-
-
-
-
-
-
-
-
-
-
-
-
-
-
-
-
-
-
-
-
-
Tota
l: C
ape
Win
elan
ds M
unic
ipal
ities
78
386
-
(
961
) 7
7 42
5
-
-
25
188
2
5 18
8
106
139
-
(
1 30
6)
104
833
-
-
-
-
-
-
-
-
2
0 00
0
-
-
20
000
-
-
-
-
BW
C03
1Th
eew
ater
sklo
of 2
6 27
5
-
( 3
22)
25
953
-
-
2
500
2
500
-
-
-
-
-
-
-
-
-
-
-
-
-
-
-
-
-
-
-
-
B
WC
032
Ove
rstra
nd 2
1 88
7
-
( 2
69)
21
618
-
-
-
-
-
-
-
-
-
-
-
-
-
-
-
-
-
-
-
-
-
-
-
-
B
WC
033
Cap
e A
gulh
as 1
0 96
1
-
( 1
35)
10
826
-
-
7
700
7
700
-
-
-
-
-
-
-
-
-
-
-
-
-
-
-
-
-
-
-
-
B
WC
034
Swel
lend
am 2
0 88
7
-
( 9
148)
1
1 73
9
-
-
10
707
1
0 70
7
-
-
-
-
-
-
-
-
-
-
-
-
-
-
-
-
-
-
-
-
CD
C3
Ove
rber
g D
istric
t Mun
icip
ality
-
-
-
-
-
-
-
-
-
-
-
-
-
-
-
-
-
-
-
-
-
-
-
-
-
-
-
-
Tota
l: O
verb
erg
Mun
icip
aliti
es 8
0 01
0
-
( 9
874)
7
0 13
6
-
-
20
907
2
0 90
7
-
-
-
-
-
-
-
-
-
-
-
-
-
-
-
-
-
-
-
-
BW
C04
1K
anna
land
10
233
-
(
126
) 1
0 10
7
20
000
-
(
10 0
00)
10
000
-
-
-
-
-
-
-
-
-
-
-
-
-
-
-
-
-
-
-
-
B
WC
042
Hes
sequ
a 1
3 58
8
-
( 1
67)
13
421
-
-
-
-
-
-
-
-
-
-
-
-
-
-
-
-
-
-
-
-
-
-
-
-
B
WC
043
Mos
sel B
ay 2
3 96
7
-
8 5
98
32
565
-
-
-
-
-
-
-
-
-
-
-
-
-
-
-
-
-
-
-
-
-
-
-
-
B
WC
044
Geo
rge
39
851
-
(
485
) 3
9 36
6
-
-
-
-
-
-
-
-
-
-
-
-
-
-
-
-
-
-
-
-
153
645
(
24 3
88)
( 7
188)
1
22 0
69
BW
C04
5O
udts
hoor
n 2
1 62
7
-
( 2
65)
21
362
4
0 00
0
-
( 30
000
) 1
0 00
0
-
-
-
-
-
-
-
-
-
-
-
-
-
-
-
-
-
-
-
-
BW
C04
7B
itou
20
063
-
(
246
) 1
9 81
7
-
-
-
-
-
-
-
-
-
-
-
-
-
-
-
-
-
-
-
-
-
-
-
-
BW
C04
8K
nysn
a 2
4 88
7
-
( 3
05)
24
582
-
-
5
835
5
835
-
-
-
-
-
-
-
-
-
-
-
-
1
5 00
0
-
-
15
000
-
-
-
-
C
DC
4G
arde
n R
oute
Dist
rict M
unic
ipal
ity-
-
-
-
-
-
-
-
-
-
-
-
-
-
-
-
-
-
-
-
-
-
-
-
-
-
-
-
To
tal:
Gar
den
Rou
te M
unic
ipal
ities
154
216
-
7
004
1
61 2
20
60
000
-
(
34 1
65)
25
835
-
-
-
-
-
-
-
-
-
-
-
-
1
5 00
0
-
-
15
000
1
53 6
45
( 24
388
) (
7 18
8)
122
069
BW
C05
1La
ings
burg
6 6
09
-
( 8
0)
6 5
29
-
-
7 4
96
7 4
96
-
-
-
-
-
-
-
-
-
-
-
-
-
-
-
-
-
-
-
-
BW
C05
2Pr
ince
Alb
ert
7 5
43
-
( 9
3)
7 4
50
-
-
-
-
-
-
-
-
-
-
-
-
-
-
-
-
-
-
-
-
-
-
-
-
BW
C05
3B
eauf
ort W
est
13
906
-
(
172
) 1
3 73
4
-
-
-
-
-
-
-
-
-
-
-
-
-
-
-
-
-
-
-
-
-
-
-
-
CD
C5
Cen
tral K
aroo
Dist
rict M
unic
ipal
ity-
-
-
-
-
-
-
-
-
-
-
-
-
-
-
-
-
-
-
-
-
-
-
-
-
-
-
-
To
tal:
Cen
tral
Kar
oo M
unic
ipal
ities
28
058
-
(
345
) 2
7 71
3
-
-
7 4
96
7 4
96
-
-
-
-
-
-
-
-
-
-
-
-
-
-
-
-
-
-
-
-
Tota
l: W
este
rn C
ape
Mun
icip
aliti
es 4
42 4
23
-
( 5
425)
4
36 9
98
137
000
-
(
20 9
78)
116
022
1
06 1
39
-
( 1
306)
1
04 8
33
1 4
81 6
04
( 14
4 45
9)
-
1 3
37 1
45
65
944
-
(
784
) 6
5 16
0
101
536
(
34 6
00)
( 12
332
) 5
4 60
4
2 1
43 6
19
( 1 2
19 3
83)
( 51
396
) 8
72 8
40
Nat
iona
l Tot
al 1
4 67
1 10
1
-
( 18
0 03
6)
14
491
065
3
445
165
-
(
77 6
08)
3 3
67 5
57
948
031
-
(
11 6
63)
936
368
1
1 28
1 87
1
( 1 1
00 0
00)
390
274
1
0 57
2 14
5
317
499
-
(
3 77
7)
313
722
5
59 4
42
( 67
693
) (
12 3
32)
479
417
6
445
848
( 1
902
275
) (
154
503)
4
389
070
57

AN
NE
XU
RE
F
AL
LO
CA
TIO
NS-
IN-K
IND
TO
MU
NIC
IPA
LIT
IES
(SC
HE
DU
LE
6, P
AR
T B
)
(Nat
iona
l and
Mun
icip
al F
inan
cial
Yea
rs)
58
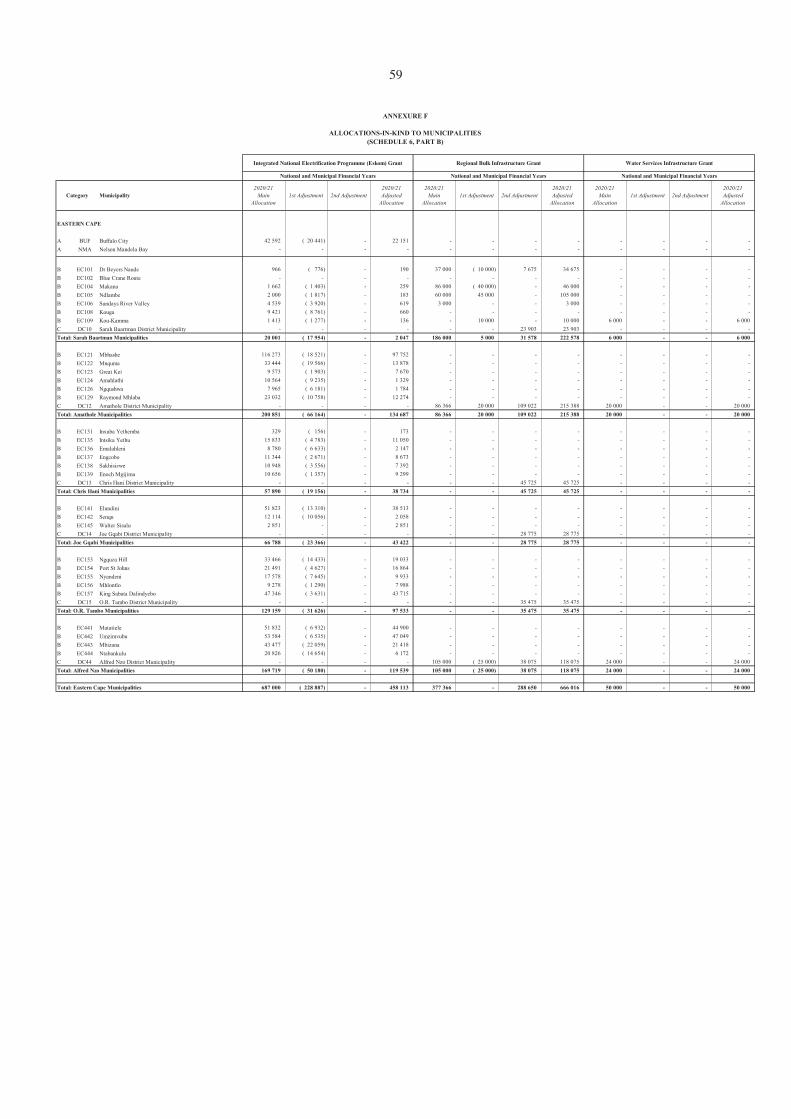
EASTERN CAPE
A BUF Buffalo City 42 592 ( 20 441) - 22 151 - - - - - - - - A NMA Nelson Mandela Bay - - - - - - - - - - - -
B EC101 Dr Beyers Naude 966 ( 776) - 190 37 000 ( 10 000) 7 675 34 675 - - - - B EC102 Blue Crane Route - - - - - - - - - - - - B EC104 Makana 1 662 ( 1 403) - 259 86 000 ( 40 000) - 46 000 - - - - B EC105 Ndlambe 2 000 ( 1 817) - 183 60 000 45 000 - 105 000 - - - - B EC106 Sundays River Valley 4 539 ( 3 920) - 619 3 000 - - 3 000 - - - - B EC108 Kouga 9 421 ( 8 761) - 660 - - - - - - - - B EC109 Kou-Kamma 1 413 ( 1 277) - 136 - 10 000 - 10 000 6 000 - - 6 000 C DC10 Sarah Baartman District Municipality - - - - - - 23 903 23 903 - - - - Total: Sarah Baartman Municipalities 20 001 ( 17 954) - 2 047 186 000 5 000 31 578 222 578 6 000 - - 6 000
B EC121 Mbhashe 116 273 ( 18 521) - 97 752 - - - - - - - - B EC122 Mnquma 33 444 ( 19 566) - 13 878 - - - - - - - - B EC123 Great Kei 9 573 ( 1 903) - 7 670 - - - - - - - - B EC124 Amahlathi 10 564 ( 9 235) - 1 329 - - - - - - - - B EC126 Ngqushwa 7 965 ( 6 181) - 1 784 - - - - - - - - B EC129 Raymond Mhlaba 23 032 ( 10 758) - 12 274 - - - - - - - - C DC12 Amathole District Municipality - - - - 86 366 20 000 109 022 215 388 20 000 - - 20 000 Total: Amathole Municipalities 200 851 ( 66 164) - 134 687 86 366 20 000 109 022 215 388 20 000 - - 20 000
B EC131 Inxuba Yethemba 329 ( 156) - 173 - - - - - - - - B EC135 Intsika Yethu 15 833 ( 4 783) - 11 050 - - - - - - - - B EC136 Emalahleni 8 780 ( 6 633) - 2 147 - - - - - - - - B EC137 Engcobo 11 344 ( 2 671) - 8 673 - - - - - - - - B EC138 Sakhisizwe 10 948 ( 3 556) - 7 392 - - - - - - - - B EC139 Enoch Mgijima 10 656 ( 1 357) - 9 299 - - - - - - - - C DC13 Chris Hani District Municipality - - - - - - 45 725 45 725 - - - - Total: Chris Hani Municipalities 57 890 ( 19 156) - 38 734 - - 45 725 45 725 - - - -
B EC141 Elundini 51 823 ( 13 310) - 38 513 - - - - - - - - B EC142 Senqu 12 114 ( 10 056) - 2 058 - - - - - - - - B EC145 Walter Sisulu 2 851 - - 2 851 - - - - - - - - C DC14 Joe Gqabi District Municipality - - - - - - 28 775 28 775 - - - - Total: Joe Gqabi Municipalities 66 788 ( 23 366) - 43 422 - - 28 775 28 775 - - - -
B EC153 Ngquza Hill 33 466 ( 14 433) - 19 033 - - - - - - - - B EC154 Port St Johns 21 491 ( 4 627) - 16 864 - - - - - - - - B EC155 Nyandeni 17 578 ( 7 645) - 9 933 - - - - - - - - B EC156 Mhlontlo 9 278 ( 1 290) - 7 988 - - - - - - - - B EC157 King Sabata Dalindyebo 47 346 ( 3 631) - 43 715 - - - - - - - - C DC15 O.R. Tambo District Municipality - - - - - - 35 475 35 475 - - - - Total: O.R. Tambo Municipalities 129 159 ( 31 626) - 97 533 - - 35 475 35 475 - - - -
B EC441 Matatiele 51 832 ( 6 932) - 44 900 - - - - - - - - B EC442 Umzimvubu 53 584 ( 6 535) - 47 049 - - - - - - - - B EC443 Mbizana 43 477 ( 22 059) - 21 418 - - - - - - - - B EC444 Ntabankulu 20 826 ( 14 654) - 6 172 - - - - - - - - C DC44 Alfred Nzo District Municipality - - - - 105 000 ( 25 000) 38 075 118 075 24 000 - - 24 000 Total: Alfred Nzo Municipalities 169 719 ( 50 180) - 119 539 105 000 ( 25 000) 38 075 118 075 24 000 - - 24 000
Total: Eastern Cape Municipalities 687 000 ( 228 887) - 458 113 377 366 - 288 650 666 016 50 000 - - 50 000
Category2020/21
MainAllocation
2020/21Adjusted
Allocation2nd Adjustment
2020/21Main
Allocation1st AdjustmentMunicipality
2020/21Adjusted
Allocation
ANNEXURE F
ALLOCATIONS-IN-KIND TO MUNICIPALITIES(SCHEDULE 6, PART B)
Integrated National Electrification Programme (Eskom) Grant Regional Bulk Infrastructure Grant Water Services Infrastructure Grant
2nd Adjustment 2nd Adjustment1st Adjustment 1st Adjustment
National and Municipal Financial Years National and Municipal Financial Years
2020/21Adjusted
Allocation
2020/21Main
Allocation
National and Municipal Financial Years
59

Category2020/21
MainAllocation
2020/21Adjusted
Allocation2nd Adjustment
2020/21Main
Allocation1st AdjustmentMunicipality
2020/21Adjusted
Allocation
ANNEXURE F
ALLOCATIONS-IN-KIND TO MUNICIPALITIES(SCHEDULE 6, PART B)
Integrated National Electrification Programme (Eskom) Grant Regional Bulk Infrastructure Grant Water Services Infrastructure Grant
2nd Adjustment 2nd Adjustment1st Adjustment 1st Adjustment
National and Municipal Financial Years National and Municipal Financial Years
2020/21Adjusted
Allocation
2020/21Main
Allocation
National and Municipal Financial Years
FREE STATE
A MAN Mangaung 4 108 ( 2 996) - 1 112 - 80 000 - 80 000 - - - -
B FS161 Letsemeng 72 ( 38) - 34 - - - - 10 000 - - 10 000 B FS162 Kopanong 75 ( 58) - 17 4 000 - - 4 000 20 000 - - 20 000 B FS163 Mohokare 136 ( 119) - 17 - - - - 6 763 - - 6 763 C DC16 Xhariep District Municipality - - - - - - - - - - - - Total: Xhariep Municipalities 283 ( 215) - 68 4 000 - - 4 000 36 763 - - 36 763
B FS181 Masilonyana 36 ( 19) - 17 153 064 ( 81 597) ( 18 070) 53 397 10 000 - - 10 000 B FS182 Tokologo 36 ( 19) - 17 75 000 ( 5 000) - 70 000 49 381 - - 49 381 B FS183 Tswelopele 9 852 472 - 10 324 20 000 ( 6 000) ( 4 000) 10 000 - - - - B FS184 Matjhabeng 25 359 ( 1 619) - 23 740 - - - - - - - - B FS185 Nala 159 ( 117) - 42 - - - - - - - - C DC18 Lejweleputswa District Municipality - - - - - - - - - - - - Total: Lejweleputswa Municipalities 35 442 ( 1 302) - 34 140 248 064 ( 92 597) ( 22 070) 133 397 59 381 - - 59 381
B FS191 Setsoto 96 ( 37) - 59 127 080 ( 20 000) ( 35 000) 72 080 22 698 - - 22 698 B FS192 Dihlabeng 155 ( 96) - 59 30 000 ( 20 000) ( 5 000) 5 000 7 000 - - 7 000 B FS193 Nketoana 80 ( 37) - 43 157 572 14 968 ( 79 968) 92 572 40 678 - - 40 678 B FS194 Maluti-a-Phofung 5 004 ( 4 343) - 661 66 000 34 284 41 347 141 631 13 128 - - 13 128 B FS195 Phumelela 3 681 813 - 4 494 - - - - 5 000 - - 5 000 B FS196 Mantsopa 4 173 ( 4 131) - 42 10 000 8 660 ( 8 660) 10 000 14 220 - - 14 220 C DC19 Thabo Mofutsanyana District Municipality - - - - - - 41 761 41 761 - - - - Total: Thabo Mofutsanyana Municipalities 13 189 ( 7 831) - 5 358 390 652 17 912 ( 45 520) 363 044 102 724 - - 102 724
B FS201 Moqhaka 17 082 ( 10 962) - 6 120 10 000 ( 10 000) 10 000 10 000 4 010 - - 4 010 B FS203 Ngwathe 40 ( 40) - - 20 000 ( 20 000) - - - - - - B FS204 Metsimaholo 8 - - 8 25 000 24 685 ( 19 946) 29 739 - - - - B FS205 Mafube 40 ( 40) - - 40 000 - 5 000 45 000 10 000 - - 10 000 C DC20 Fezile Dabi District Municipality - - - - - - 72 536 72 536 - - - - Total: Fezile Dabi Municipalities 17 170 ( 11 042) - 6 128 95 000 ( 5 315) 67 590 157 275 14 010 - - 14 010
Total: Free State Municipalities 70 192 ( 23 386) - 46 806 737 716 - - 737 716 212 878 - - 212 878
GAUTENG
A EKU City of Ekurhuleni 85 319 ( 65 654) - 19 665 - - - - - - - - A JHB City of Johannesburg 29 547 ( 8 233) - 21 314 - - - - - - - - A TSH City of Tshwane 2 616 ( 316) - 2 300 - - - - - - - -
B GT421 Emfuleni 3 292 1 321 - 4 613 1 113 000 136 000 ( 743 293) 505 707 40 000 - - 40 000 B GT422 Midvaal - - - - 130 000 ( 80 000) 10 000 60 000 - - - - B GT423 Lesedi - - - - - - - - - - - - C DC42 Sedibeng District Municipality - - - - - - 26 560 26 560 - - - - Total: Sedibeng Municipalities 3 292 1 321 - 4 613 1 243 000 56 000 ( 706 733) 592 267 40 000 - - 40 000
B GT481 Mogale City 21 782 7 013 - 28 795 - - - - - - - - B GT484 Merafong City 144 8 - 152 - - - - - - - - B GT485 Rand West City 49 256 1 907 - 51 163 57 747 ( 56 000) 28 253 30 000 - - - - C DC48 West Rand District Municipality - - - - - - 8 574 8 574 - - - - Total: West Rand Municipalities 71 182 8 928 - 80 110 57 747 ( 56 000) 36 827 38 574 - - - -
Total: Gauteng Municipalities 191 956 ( 63 954) - 128 002 1 300 747 - ( 669 906) 630 841 40 000 - - 40 000
60

Category2020/21
MainAllocation
2020/21Adjusted
Allocation2nd Adjustment
2020/21Main
Allocation1st AdjustmentMunicipality
2020/21Adjusted
Allocation
ANNEXURE F
ALLOCATIONS-IN-KIND TO MUNICIPALITIES(SCHEDULE 6, PART B)
Integrated National Electrification Programme (Eskom) Grant Regional Bulk Infrastructure Grant Water Services Infrastructure Grant
2nd Adjustment 2nd Adjustment1st Adjustment 1st Adjustment
National and Municipal Financial Years National and Municipal Financial Years
2020/21Adjusted
Allocation
2020/21Main
Allocation
National and Municipal Financial Years
KWAZULU-NATAL
A ETH eThekwini 10 142 ( 9 488) - 654 - - - - - - - -
B KZN212 uMdoni 27 756 ( 1 670) - 26 086 - - - - - - - - B KZN213 uMzumbe 39 860 ( 39 129) - 731 - - - - - - - - B KZN214 uMuziwabantu 11 913 ( 11 875) - 38 - - - - - - - - B KZN216 Ray Nkonyeni 9 191 ( 8 229) - 962 - - - - - - - - C DC21 Ugu District Municipality - - - - - - - - - - - - Total: Ugu Municipalities 88 720 ( 60 903) - 27 817 - - - - - - - -
B KZN221 uMshwathi 8 263 ( 1 587) - 6 676 - - - - - - - - B KZN222 uMngeni - - - - - - - - - - - - B KZN223 Mpofana - - - - - - - - - - - - B KZN224 iMpendle - - - - - - - - - - - - B KZN225 Msunduzi 15 864 ( 3 487) - 12 377 - - - - - - - - B KZN226 Mkhambathini - - - - - - - - - - - - B KZN227 Richmond - - - - - - - - - - - - C DC22 uMgungundlovu District Municipality - - - - - - 34 296 34 296 - - - - Total: uMgungundlovu Municipalities 24 127 ( 5 074) - 19 053 - - 34 296 34 296 - - - -
B KZN235 Okhahlamba - - - - - - - - - - - - B KZN237 iNkosi Langalibalele 1 750 ( 1 102) - 648 - - - - - - - - B KZN238 Alfred Duma 37 493 10 114 - 47 607 - - - - - - - - C DC23 uThukela District Municipality - - - - - - - - - - - - Total: uThukela Municipalities 39 243 9 012 - 48 255 - - - - - - - -
B KZN241 eNdumeni 14 350 ( 12 577) - 1 773 - - - - - - - - B KZN242 Nquthu 22 803 ( 22 155) - 648 - - - - - - - - B KZN244 uMsinga 75 822 ( 3 037) - 72 785 - - - - - - - - B KZN245 uMvoti 3 888 2 587 - 6 475 - - - - - - - - C DC24 uMzinyathi District Municipality - - - - - - - - - - - - Total: uMzinyathi Municipalities 116 863 ( 35 182) - 81 681 - - - - - - - -
B KZN252 Newcastle 14 163 ( 10 690) - 3 473 - - - - - - - - B KZN253 eMadlangeni 1 475 ( 827) - 648 - - - - - - - - B KZN254 Dannhauser 8 830 ( 22) - 8 808 - - - - - - - - C DC25 Amajuba District Municipality - - - - - - - - - - - - Total: Amajuba Municipalities 24 468 ( 11 539) - 12 929 - - - - - - - -
B KZN261 eDumbe 7 963 ( 7 200) - 763 - - - - - - - - B KZN262 uPhongolo 3 125 ( 2 383) - 742 - - - - - - - - B KZN263 AbaQulusi 15 753 ( 13 466) - 2 287 - - - - - - - - B KZN265 Nongoma 1 100 ( 1 100) - - - - - - - - - - B KZN266 Ulundi 13 593 ( 1 837) - 11 756 - - - - - - - - C DC26 Zululand District Municipality - - - - - - 19 638 19 638 - - - - Total: Zululand Municipalities 41 534 ( 25 986) - 15 548 - - 19 638 19 638 - - - -
B KZN271 uMhlabuyalingana 182 070 ( 57 733) - 124 337 - - - - - - - - B KZN272 Jozini 74 722 ( 12 490) - 62 232 - - - - - - - - B KZN275 Mtubatuba 38 482 ( 10 052) - 28 430 - - - - - - - - B KZN276 Big Five Hlabisa 1 925 ( 1 925) - - - - - - - - - - C DC27 uMkhanyakude District Municipality - - - - 591 - - 591 - - - - Total: uMkhanyakude Municipalities 297 199 ( 82 200) - 214 999 591 - - 591 - - - -
B KZN281 uMfolozi 550 ( 550) - - - - - - - - - - B KZN282 uMhlathuze 11 110 ( 2 222) - 8 888 - - - - - - - - B KZN284 uMlalazi 12 874 ( 1 282) - 11 592 - - - - - - - - B KZN285 Mthonjaneni 1 200 ( 552) - 648 - - - - - - - - B KZN286 Nkandla 1 650 ( 1 650) - - - - - - - - - - C DC28 King Cetshwayo District Municipality - - - - - - - - - - - - Total: King Cetshwayo Municipalities 27 384 ( 6 256) - 21 128 - - - - - - - -
B KZN291 Mandeni 825 ( 825) - - - - - - - - - - B KZN292 KwaDukuza 650 ( 2) - 648 - - - - - - - - B KZN293 Ndwedwe 30 968 ( 6 477) - 24 491 - - - - - - - - B KZN294 Maphumulo 2 475 ( 829) - 1 646 - - - - - - - - C DC29 iLembe District Municipality - - - - - - - - - - - - Total: iLembe Municipalities 34 918 ( 8 133) - 26 785 - - - - - - - -
B KZN433 Greater Kokstad 275 ( 275) - - - - - - - - - - B KZN434 uBuhlebezwe 7 652 ( 1 362) - 6 290 - - - - - - - - B KZN435 uMzimkhulu 2 475 ( 829) - 1 646 - - - - - - - - B KZN436 Dr Nkosazana Dlamini Zuma - - - - - - - - - - - - C DC43 Harry Gwala District Municipality - - - - - - - - - - - - Total: Harry Gwala Municipalities 10 402 ( 2 466) - 7 936 - - - - - - - -
Total: KwaZulu-Natal Municipalities 715 000 ( 238 215) - 476 785 591 - 53 934 54 525 - - - -
61

Category2020/21
MainAllocation
2020/21Adjusted
Allocation2nd Adjustment
2020/21Main
Allocation1st AdjustmentMunicipality
2020/21Adjusted
Allocation
ANNEXURE F
ALLOCATIONS-IN-KIND TO MUNICIPALITIES(SCHEDULE 6, PART B)
Integrated National Electrification Programme (Eskom) Grant Regional Bulk Infrastructure Grant Water Services Infrastructure Grant
2nd Adjustment 2nd Adjustment1st Adjustment 1st Adjustment
National and Municipal Financial Years National and Municipal Financial Years
2020/21Adjusted
Allocation
2020/21Main
Allocation
National and Municipal Financial Years
LIMPOPO
B LIM331 Greater Giyani 17 796 ( 9 281) - 8 515 - - - - - - - - B LIM332 Greater Letaba 19 628 ( 1 127) - 18 501 - - - - - - - - B LIM333 Greater Tzaneen 9 041 ( 5 937) - 3 104 - - - - - - - - B LIM334 Ba-Phalaborwa 11 533 ( 1 323) - 10 210 - - - - - - - - B LIM335 Maruleng 9 183 ( 4 313) - 4 870 - - - - - - - - C DC33 Mopani District Municipality - - - - 408 354 44 344 60 600 513 298 60 600 - - 60 600 Total: Mopani Municipalities 67 181 ( 21 981) - 45 200 408 354 44 344 60 600 513 298 60 600 - - 60 600
B LIM341 Musina 13 328 ( 5 689) - 7 639 - - - - - - - - B LIM343 Thulamela 34 780 438 ( 15 000) 20 218 - - - - - - - - B LIM344 Makhado 10 576 ( 1 455) - 9 121 - - - - - - - - B LIM345 Collins Chabane 27 470 ( 794) - 26 676 - - - - - - - - C DC34 Vhembe District Municipality - - - - 115 332 ( 30 000) - 85 332 - - - - Total: Vhembe Municipalities 86 154 ( 7 500) ( 15 000) 63 654 115 332 ( 30 000) - 85 332 - - - -
B LIM351 Blouberg 8 705 ( 4 411) - 4 294 - - - - - - - - B LIM353 Molemole 5 277 ( 3 983) - 1 294 - - - - - - - - B LIM354 Polokwane 52 108 ( 28 414) ( 3 498) 20 196 - - - - - - - - B LIM355 Lepele-Nkumpi 5 934 ( 1 001) - 4 933 - - - - - - - - C DC35 Capricorn District Municipality - - - - - - 54 085 54 085 - - - - Total: Capricorn Municipalities 72 024 ( 37 809) ( 3 498) 30 717 - - 54 085 54 085 - - - -
B LIM361 Thabazimbi 15 048 ( 14 789) - 259 - - - - 45 000 - - 45 000 B LIM362 Lephalale 26 706 ( 5 059) - 21 647 - - - - - - - - B LIM366 Bela-Bela 12 167 ( 11 650) - 517 - - - - - - - - B LIM367 Mogalakwena 26 911 ( 8 384) - 18 527 74 434 ( 30 000) - 44 434 - - - - B LIM368 Modimolle-Mookgophong 1 443 ( 1 184) - 259 - - - - 39 152 - - 39 152 C DC36 Waterberg District Municipality - - - - - - - - - - - - Total: Waterberg Municipalities 82 275 ( 41 066) - 41 209 74 434 ( 30 000) - 44 434 84 152 - - 84 152
B LIM471 Ephraim Mogale 11 465 ( 768) - 10 697 - - - - - - - - B LIM472 Elias Motsoaledi 9 441 ( 7 100) - 2 341 - - - - - - - - B LIM473 Makhuduthamaga 24 998 ( 13 944) - 11 054 - - - - - - - - B LIM476 Fetakgomo Tubatse 61 461 ( 8 097) - 53 364 - - - - - - - - C DC47 Sekhukhune District Municipality - - - - 135 000 15 656 - 150 656 - - - - Total: Sekhukhune Municipalities 107 365 ( 29 909) - 77 456 135 000 15 656 - 150 656 - - - -
Total: Limpopo Municipalities 414 999 ( 138 265) ( 18 498) 258 236 733 120 - 114 685 847 805 144 752 - - 144 752
MPUMALANGA
B MP301 Chief Albert Luthuli 12 760 ( 881) - 11 879 - - - - - - - - B MP302 Msukaligwa 15 915 ( 436) - 15 479 - - - - - - - - B MP303 Mkhondo 16 062 ( 102) - 15 960 - - - - - - - - B MP304 Dr Pixley ka Isaka Seme 2 350 ( 508) - 1 842 - - - - - - - - B MP305 Lekwa 7 026 370 - 7 396 - 51 040 - 51 040 50 650 - 12 258 62 908 B MP306 Dipaleseng 2 275 120 - 2 395 74 868 - ( 8 061) 66 807 - - - - B MP307 Govan Mbeki 1 700 89 - 1 789 - - - - - - - - C DC30 Gert Sibande District Municipality - - - - - - - - - - - - Total: Gert Sibande Municipalities 58 088 ( 1 348) - 56 740 74 868 51 040 ( 8 061) 117 847 50 650 - 12 258 62 908
B MP311 Victor Khanye 4 098 ( 3 420) - 678 - - - - - - - - B MP312 Emalahleni - - - - - - - - - - - - B MP313 Steve Tshwete 902 48 - 950 - - - - - - - - B MP314 Emakhazeni 3 708 195 - 3 903 - - - - - - - - B MP315 Thembisile Hani 93 524 ( 53 260) - 40 264 32 498 ( 10 000) - 22 498 - - - - B MP316 Dr JS Moroka 26 795 ( 9 505) - 17 290 5 000 ( 4 000) - 1 000 - - - - C DC31 Nkangala District Municipality - - - - - - 28 061 28 061 - - - - Total: Nkangala Municipalities 129 027 ( 65 942) - 63 085 37 498 ( 14 000) 28 061 51 559 - - - -
B MP321 Thaba Chweu 920 48 - 968 - - - - - - - - B MP324 Nkomazi 8 000 421 - 8 421 130 000 ( 5 040) ( 1 060) 123 900 - - - - B MP325 Bushbuckridge 71 092 ( 26 408) - 44 684 - - - - - - - - B MP326 City of Mbombela 36 193 ( 7 828) - 28 365 25 000 ( 24 000) - 1 000 - - - - C DC32 Ehlanzeni District Municipality - - - - - - 68 592 68 592 - - - - Total: Ehlanzeni Municipalities 116 205 ( 33 767) - 82 438 155 000 ( 29 040) 67 532 193 492 - - - -
Total: Mpumalanga Municipalities 303 320 ( 101 057) - 202 263 267 366 8 000 87 532 362 898 50 650 - 12 258 62 908
62

Category2020/21
MainAllocation
2020/21Adjusted
Allocation2nd Adjustment
2020/21Main
Allocation1st AdjustmentMunicipality
2020/21Adjusted
Allocation
ANNEXURE F
ALLOCATIONS-IN-KIND TO MUNICIPALITIES(SCHEDULE 6, PART B)
Integrated National Electrification Programme (Eskom) Grant Regional Bulk Infrastructure Grant Water Services Infrastructure Grant
2nd Adjustment 2nd Adjustment1st Adjustment 1st Adjustment
National and Municipal Financial Years National and Municipal Financial Years
2020/21Adjusted
Allocation
2020/21Main
Allocation
National and Municipal Financial Years
NORTHERN CAPE
B NC061 Richtersveld - - - - - - 34 963 34 963 - - - - B NC062 Nama Khoi 2 346 - - 2 346 - - 751 751 - - - - B NC064 Kamiesberg - - - - - - 84 714 84 714 - - - - B NC065 Hantam - - - - - - 59 423 59 423 - - - - B NC066 Karoo Hoogland - - - - - - 188 188 - - - - B NC067 Khâi-Ma - - - - - - 188 188 - - - - C DC6 Namakwa District Municipality - - - - - - - - - - - - Total: Namakwa Municipalities 2 346 - - 2 346 - - 180 227 180 227 - - - -
B NC071 Ubuntu - - - - - - 248 248 - - - - B NC072 Umsobomvu 302 - - 302 - - 188 188 - - - - B NC073 Emthanjeni - - - - - - 1 500 1 500 - - - - B NC074 Kareeberg - - - - - - 11 483 11 483 - - - - B NC075 Renosterberg - - - - - - 751 751 - - - - B NC076 Thembelihle - - - - - - 21 515 21 515 - - - - B NC077 Siyathemba 2 875 - - 2 875 - - 6 963 6 963 - - - - B NC078 Siyancuma - - - - 36 840 - 5 425 42 265 7 603 - - 7 603 C DC7 Pixley Ka Seme District Municipality - - - - - - - - - - - - Total: Pixley Ka Seme Municipalities 3 177 - - 3 177 36 840 - 48 073 84 913 7 603 - - 7 603
B NC082 !Kai !Garib 3 105 - - 3 105 - - 3 984 3 984 - - - - B NC084 !Kheis - - - - - - 791 791 - - - - B NC085 Tsantsabane 9 247 - - 9 247 - - 3 001 3 001 16 211 - - 16 211 B NC086 Kgatelopele - - - - - - 751 751 - - - - B NC087 Dawid Kruiper 240 - - 240 57 904 ( 21 000) ( 30 249) 6 655 - - - - C DC8 Z.F. Mgcawu District Municipality - - - - - - - - - - - - Total: Z.F. Mgcawu Municipalities 12 592 - - 12 592 57 904 ( 21 000) ( 21 722) 15 182 16 211 - - 16 211
B NC091 Sol Plaatjie 145 - - 145 - - 16 675 16 675 162 - - 162 B NC092 Dikgatlong 4 450 - - 4 450 - - 5 251 5 251 - - - - B NC093 Magareng - - - - 21 221 28 000 34 000 83 221 - - - - B NC094 Phokwane 3 335 - - 3 335 - - 3 000 3 000 - - - - C DC9 Frances Baard District Municipality - - - - - - - - - - - - Total: Frances Baard Municipalities 7 930 - - 7 930 21 221 28 000 58 926 108 147 162 - - 162
B NC451 Joe Morolong 31 597 - - 31 597 - - 54 229 54 229 - - - - B NC452 Ga-Segonyana 116 934 ( 58 163) - 58 771 - - 18 718 18 718 - - - - B NC453 Gamagara - - - - - - 3 751 3 751 - - - - C DC45 John Taolo Gaetsewe District Municipality - - - - - - - - - - - - Total: John Taolo Gaetsewe Municipalities 148 531 ( 58 163) - 90 368 - - 76 698 76 698 - - - -
Total: Northern Cape Municipalities 174 576 ( 58 163) - 116 413 115 965 7 000 342 202 465 167 23 976 - - 23 976
NORTH WEST
B NW371 Moretele 37 782 ( 14 417) - 23 365 35 000 ( 5 000) - 30 000 - - - - B NW372 Madibeng 21 844 ( 11 640) - 10 204 120 000 - ( 20 559) 99 441 14 008 - - 14 008 B NW373 Rustenburg 44 620 ( 11 899) - 32 721 - - - - - - - - B NW374 Kgetlengrivier 1 500 227 - 1 727 3 000 5 000 34 000 42 000 22 542 - - 22 542 B NW375 Moses Kotane 45 977 ( 10 762) - 35 215 - - - - - - - - C DC37 Bojanala Platinum District Municipality - - - - - - - - - - - - Total: Bojanala Platinum Municipalities 151 723 ( 48 491) - 103 232 158 000 - 13 441 171 441 36 550 - - 36 550
B NW381 Ratlou 4 360 ( 1 374) - 2 986 - - - - - - - - B NW382 Tswaing 19 910 ( 7 435) - 12 475 - - - - - - - - B NW383 Mafikeng 48 550 ( 8 655) - 39 895 - - - - - - - - B NW384 Ditsobotla 7 210 2 410 - 9 620 - - - - - - - - B NW385 Ramotshere Moiloa 10 445 ( 3 253) - 7 192 - - - - - - - - C DC38 Ngaka Modiri Molema District Municipality - - - - 73 000 - ( 27 629) 45 371 20 000 - - 20 000 Total: Ngaka Modiri Molema Municipalities 90 475 ( 18 307) - 72 168 73 000 - ( 27 629) 45 371 20 000 - - 20 000
B NW392 Naledi 610 ( 535) - 75 - - - - - - - - B NW393 Mamusa 10 845 ( 2 187) - 8 658 - - - - - - - - B NW394 Greater Taung 43 449 ( 23 502) - 19 947 - - - - - - - - B NW396 Lekwa-Teemane 12 359 ( 11 638) - 721 - - - - - - - - B NW397 Kagisano-Molopo 17 656 ( 3 041) - 14 615 - - - - - - - - C DC39 Dr Ruth Segomotsi Mompati District Municipality - - - - - - 8 005 8 005 - - - - Total: Dr Ruth Segomotsi Mompati Municipalities 84 919 ( 40 903) - 44 016 - - 8 005 8 005 - - - -
B NW403 City of Matlosana 3 640 ( 563) - 3 077 - - - - - - - - B NW404 Maquassi Hills 650 ( 575) - 75 - - - - - - - - B NW405 JB Marks 3 033 ( 2 586) - 447 20 375 - - 20 375 - - - - C DC40 Dr Kenneth Kaunda District Municipality - - - - - - 28 904 28 904 - - - - Total: Dr Kenneth Kaunda Municipalities 7 323 ( 3 724) - 3 599 20 375 - 28 904 49 279 - - - -
Total: North West Municipalities 334 440 ( 111 425) - 223 015 251 375 - 22 721 274 096 56 550 - - 56 550
63

Category2020/21
MainAllocation
2020/21Adjusted
Allocation2nd Adjustment
2020/21Main
Allocation1st AdjustmentMunicipality
2020/21Adjusted
Allocation
ANNEXURE F
ALLOCATIONS-IN-KIND TO MUNICIPALITIES(SCHEDULE 6, PART B)
Integrated National Electrification Programme (Eskom) Grant Regional Bulk Infrastructure Grant Water Services Infrastructure Grant
2nd Adjustment 2nd Adjustment1st Adjustment 1st Adjustment
National and Municipal Financial Years National and Municipal Financial Years
2020/21Adjusted
Allocation
2020/21Main
Allocation
National and Municipal Financial Years
WESTERN CAPE
A CPT City of Cape Town 76 547 ( 27 411) - 49 136 - - - - - - - -
B WC011 Matzikama - - - - 6 000 - ( 6 000) - - - - - B WC012 Cederberg - - - - 36 587 15 000 ( 15 326) 36 261 - - - - B WC013 Bergrivier - - - - - - - - - - - - B WC014 Saldanha Bay 3 892 ( 3 892) - - - - - - - - - - B WC015 Swartland 885 ( 2) - 883 - - - - - - - - C DC1 West Coast District Municipality - - - - - - 15 326 15 326 - - - - Total: West Coast Municipalities 4 777 ( 3 894) - 883 42 587 15 000 ( 6 000) 51 587 - - - -
B WC022 Witzenberg - - - - - - - - - - - - B WC023 Drakenstein - - - - - - - - - - - - B WC024 Stellenbosch 2 548 ( 6) - 2 542 - - - - - - - - B WC025 Breede Valley 15 203 ( 5 410) - 9 793 - - - - - - - - B WC026 Langeberg - - - - - - - - - - - - C DC2 Cape Winelands District Municipality - - - - - - 17 834 17 834 - - - - Total: Cape Winelands Municipalities 17 751 ( 5 416) - 12 335 - - 17 834 17 834 - - - -
B WC031 Theewaterskloof 8 073 780 - 8 853 - - - - - - - - B WC032 Overstrand - - - - - - - - - - - - B WC033 Cape Agulhas - - - - - - - - - - - - B WC034 Swellendam - - - - - - - - - - - - C DC3 Overberg District Municipality - - - - - - - - - - - - Total: Overberg Municipalities 8 073 780 - 8 853 - - - - - - - -
B WC041 Kannaland - - - - 30 000 ( 30 000) - - - - - - B WC042 Hessequa - - - - - - - - - - - - B WC043 Mossel Bay - - - - - - - - - - - - B WC044 George 2 852 ( 707) - 2 145 - - - - - - - - B WC045 Oudtshoorn - - - - - - - - - - - - B WC047 Bitou - - - - - - - - - - - - B WC048 Knysna - - - - - - - - - - - - C DC4 Garden Route District Municipality - - - - - - - - - - - - Total: Garden Route Municipalities 2 852 ( 707) - 2 145 30 000 ( 30 000) - - - - - -
B WC051 Laingsburg - - - - - - - - - - - - B WC052 Prince Albert - - - - - - - - - - - - B WC053 Beaufort West - - - - - - - - - - - - C DC5 Central Karoo District Municipality - - - - - - - - - - - - Total: Central Karoo Municipalities - - - - - - - - - - - -
Total: Western Cape Municipalities 110 000 ( 36 648) - 73 352 72 587 ( 15 000) 11 834 69 421 - - - -
National Total 3 001 483 ( 1 000 000) ( 18 498) 1 982 985 3 856 833 - 251 652 4 108 485 578 806 - 12 258 591 064
Unallocated
64
APP
EN
DIX
A
APP
EN
DIX
TO
SC
HE
DU
LE
5, P
AR
T B
: MU
NIC
IPA
L IN
FRA
STR
UC
TU
RE
GR
AN
T (M
IG) A
ND
INT
EG
RA
TE
D U
RB
AN
D
EV
EL
OPM
EN
T G
RA
NT
(IU
DG
)
(Nat
iona
l and
Mun
icip
al F
inan
cial
Yea
rs)
RIN
G-F
EN
CE
D F
UN
DIN
G F
OR
SPO
RT
S IN
FRA
STR
UC
TU
RE
- B
RE
AK
DO
WN
PE
R M
UN
ICIP
AL
ITY
65

EASTERN CAPE
B EC105 Ndlambe MIG 9 400 ( 113) 9 287 Total: Sarah Baartman Municipalities 9 400 - ( 113) 9 287 B EC135 Intsika Yethu MIG 10 000 ( 120) 9 880 Total: Chris Hani Municipalities 10 000 - ( 120) 9 880 B EC442 Umzimvubu MIG 10 000 ( 120) 9 880 Total: Alfred Nzo Municipalities 10 000 - ( 120) 9 880
Total: Eastern Cape Municipalities 29 400 - ( 353) 29 047
FREE STATE
B FS181 Masilonyana MIG 6 728 ( 81) 6 647 Total: Lejweleputswa Municipalities 6 728 - ( 81) 6 647 B FS192 Dihlabeng MIG 9 000 ( 108) 8 892 Total: Thabo Mofutsanyana Municipalities 9 000 - ( 108) 8 892 B FS201 Moqhaka MIG 10 000 ( 120) 9 880 Total: Fezile Dabi Municipalities 10 000 - ( 120) 9 880
Total: Free State Municipalities 25 728 - ( 309) 25 419
KWAZULU-NATAL
B KZN235 Okhahlamba MIG 10 000 ( 120) 9 880 B KZN237 iNkosi Langalibalele MIG 10 000 ( 120) 9 880 Total: uThukela Municipalities 20 000 - ( 240) 19 760 B KZN272 Jozini MIG 9 600 ( 115) 9 485 Total: uMkhanyakude Municipalities 9 600 - ( 115) 9 485 B KZN281 uMfolozi MIG 13 000 ( 156) 12 844 Total: King Cetshwayo Municipalities 13 000 - ( 156) 12 844
Total: KwaZulu-Natal Municipalities 42 600 - ( 511) 42 089
LIMPOPO
B LIM341 MusinaMIG 30 000 ( 25 053) 4 947
Total: Vhembe Municipalities 30 000 - ( 25 053) 4 947
B LIM354 PolokwaneMIG 5 000 24 633 29 633
Total: Capricorn Municipalities 5 000 - 24 633 29 633 B LIM361 Thabazimbi MIG 11 000 ( 132) 10 868 Total: Waterberg Municipalities 11 000 - ( 132) 10 868
Total: Limpopo Municipalities 46 000 - ( 552) 45 448
MPUMALANGA
B MP313 Steve Tshwete IUDG 10 000 ( 120) 9 880 Total: Nkangala Municipalities 10 000 - ( 120) 9 880
Total: Mpumalanga Municipalities 10 000 - ( 120) 9 880
NORTHERN CAPE
B NC062 Nama Khoi MIG 7 500 ( 90) 7 410 Total: Namakwa Municipalities 7 500 - ( 90) 7 410 B NC075 Renosterberg MIG 11 500 ( 138) 11 362 B NC076 Thembelihle MIG 11 500 ( 138) 11 362 Total: Pixley Ka Seme Municipalities 23 000 - ( 276) 22 724 B NC084 !Kheis MIG 9 330 ( 112) 9 218 Total: Z.F. Mgcawu Municipalities 9 330 - ( 112) 9 218
Total: Northern Cape Municipalities 39 830 - ( 478) 39 352
APPENDIX A
RING-FENCED FUNDING FOR SPORTS INFRASTRUCTURE - BREAKDOWN PER MUNICIPALITY
Ring-fenced Municipal Infrastructure Grant and Integrated Urban Development Grant allocations for sports infrastructure
APPENDIX TO SCHEDULE 5, PART B: MUNICIPAL INFRASTRUCTURE GRANT (MIG) AND INTEGRATED URBAN DEVELOPMENT GRANT (IUDG)
ProjectCategory Municipality
National and Municipal Financial Years
Upgrading of Magwala sports facility
Upgrading of Marselle sports field Kenton-on-Sea phase 2
2020/21Main
Allocation1st Adjustment 2nd Adjustment
2020/21Adjusted
Allocation
Construction of Pepeni sports facility
Upgrading of Winnie Mandela Museum and Recreation Precinct
Construction of KoeKoe village sports facility
Construction of Fateng-Tse-Ntso sports facility
Construction of Khethani sports field - ward 01Upgrade of Wembezi sports field ward 9
Construction of Ndumo sports complex phase 4
Construction of the Dondotha sports field
Construction of Moletjie field and softball field (Updated project name: Completion of Harper sport facility)
Completion of Harper sports facility (Updated project name: Construction of Polokwane softball field)
Upgrading of sports and recreation facilities in Raphuti (ward 4)
Construction of Kwazamokuhle stadium
Upgrading of Vanderkloof sports facility Development of Steynville sports facility
Buffelsrivier sports facility
Development of Grootdrink sports facility
Grant
66

APPENDIX A
RING-FENCED FUNDING FOR SPORTS INFRASTRUCTURE - BREAKDOWN PER MUNICIPALITY
Ring-fenced Municipal Infrastructure Grant and Integrated Urban Development Grant allocations for sports infrastructure
APPENDIX TO SCHEDULE 5, PART B: MUNICIPAL INFRASTRUCTURE GRANT (MIG) AND INTEGRATED URBAN DEVELOPMENT GRANT (IUDG)
ProjectCategory Municipality
National and Municipal Financial Years2020/21
MainAllocation
1st Adjustment 2nd Adjustment2020/21Adjusted
AllocationGrant
NORTH WEST
B NW374 Kgetlengrivier MIG 10 000 ( 120) 9 880 Total: Bojanala Platinum Municipalities 10 000 - ( 120) 9 880 B NW383 Mafikeng MIG 20 000 ( 240) 19 760 B NW384 Ditsobotla MIG 10 300 ( 121) 10 179 Total: Ngaka Modiri Molema Municipalities 30 300 - ( 361) 29 939
Total: North West Municipalities 40 300 - ( 481) 39 819
WESTERN CAPE
B WC011 Matzikama MIG 10 000 ( 120) 9 880 Total: West Coast Municipalities 10 000 - ( 120) 9 880 B WC034 Swellendam MIG 9 000 ( 9 000) - Total: Overberg Municipalities 9 000 - ( 9 000) - B WC043 Mossel Bay MIG - - 8 890 8 890
Total: Western Cape Municipalities 19 000 - ( 230) 18 770
MIG
National Total 252 858 - ( 3 034) 249 824
Unallocated
Construction of Reagile sports ground
Construction of tennis courts at Mmabatho stadiumRefurbishment of Iketleng sports facility
Upgrading of existing and construction of new sports facilities in Klawer (ward 6)
New soccer facility for Wolwedans
New soccer facility for Wolwedans
67

APP
EN
DIX
B
(Nat
iona
l Fin
anci
al Y
ears
)
APP
EN
DIX
TO
SC
HE
DU
LE
5, P
AR
T A
: BR
EA
KD
OW
N O
F T
HE
EA
RL
Y C
HIL
DH
OO
D D
EV
EL
OPM
EN
T G
RA
NT
: AL
LO
CA
TIO
NS
PER
GR
AN
T C
OM
PON
EN
T P
ER
PR
OV
INC
E
68

Social Development (Vote 19)
Early Childhood Development GrantEastern Cape 134 142 - 59 792 193 934 Free State 55 768 - 38 880 94 648 Gauteng 135 229 - 77 763 212 992 KwaZulu-Natal 193 437 - 89 898 283 335 Limpopo 127 724 - 58 241 185 965 Mpumalanga 80 872 - 42 372 123 244 Northern Cape 24 085 - 42 372 66 457 North West 76 740 - 33 865 110 605 Western Cape 87 152 - 53 067 140 219 Unallocated - - - -
Total 915 149 - 496 250 1 411 399 of which:Maintenance Component
Eastern Cape 9 181 9 181 Free State 9 579 9 579 Gauteng 7 582 7 582 KwaZulu-Natal 14 047 14 047 Limpopo 17 492 17 492 Mpumalanga 9 181 9 181 Northern Cape 6 508 6 508 North West 6 797 6 797 Western Cape 8 350 8 350 Unallocated - -
Total: Maintenance Component 88 717 - - 88 717 Subsidy Component -
Eastern Cape 124 961 59 792 184 753 Free State 46 189 38 880 85 069 Gauteng 127 647 77 763 205 410 KwaZulu-Natal 179 390 89 898 269 288 Limpopo 110 232 58 241 168 473 Mpumalanga 71 691 42 372 114 063 Northern Cape 17 577 42 372 59 949 North West 69 943 33 865 103 808 Western Cape 78 802 53 067 131 869 Unallocated - -
Total: Subsidy Component 826 432 - 496 250 1 322 682
APPENDIX B
APPENDIX TO SCHEDULE 5, PART A: BREAKDOWN OF THE EARLY CHILDHOOD DEVELOPMENT GRANT: ALLOCATIONS PER GRANT COMPONENT PER PROVINCE
Early Childhood Development GrantNational Financial Year
Province /Components2020/21
MainAllocation
1st Adjustment 2nd Adjustment2020/21Adjusted
Allocation
69

APP
EN
DIX
C
(Nat
iona
l Fin
anci
al Y
ear)
APP
EN
DIX
TO
SC
HE
DU
LE
5, P
AR
T A
: BR
EA
KD
OW
N O
F T
HE
HIV
, TB
, MA
LA
RIA
AN
D C
OM
MU
NIT
Y O
UT
RE
AC
H G
RA
NT
: A
LL
OC
AT
ION
S PE
R G
RA
NT
CO
MPO
NE
NT
PE
R P
RO
VIN
CE
70

Health (Vote 18)
HIV, TB, Malaria and Community Outreach GrantEastern Cape 2 667 462 481 076 8 761 3 157 299 Free State 1 472 363 125 159 725 1 598 247 Gauteng 5 256 234 607 442 ( 47 977) 5 815 699 KwaZulu-Natal 6 453 923 446 764 ( 1 798) 6 898 889 Limpopo 2 179 020 223 429 11 335 2 413 784 Mpumalanga 2 205 714 173 061 3 656 2 382 431 Northern Cape 656 487 61 575 168 718 230 North West 1 628 527 175 100 5 095 1 808 722 Western Cape 1 867 472 552 220 9 426 2 429 118 Unallocated - - - -
Total 24 387 202 2 845 826 ( 10 609) 27 222 419 of which:HIV and AIDS Component
Eastern Cape 2 334 101 - ( 19 197) 2 314 904 Free State 1 278 805 - ( 10 518) 1 268 287 Gauteng 4 530 092 - ( 37 259) 4 492 833 KwaZulu-Natal 5 660 394 - ( 46 554) 5 613 840 Limpopo 1 555 254 - ( 12 791) 1 542 463 Mpumalanga 1 813 880 - ( 14 918) 1 798 962 Northern Cape 488 778 - ( 4 020) 484 758 North West 1 322 296 - ( 10 875) 1 311 421 Western Cape 1 562 888 - ( 12 854) 1 550 034
Total 20 546 488 - ( 168 986) 20 377 502 TB Component
Eastern Cape 73 566 - ( 605) 72 961 Free State 31 079 - ( 256) 30 823 Gauteng 89 801 - ( 739) 89 062 KwaZulu-Natal 112 869 - ( 928) 111 941 Limpopo 47 314 - ( 389) 46 925 Mpumalanga 35 799 - ( 294) 35 505 Northern Cape 33 358 - ( 274) 33 084 North West 21 745 - ( 179) 21 566 Western Cape 66 458 - ( 547) 65 911
Total 511 989 - ( 4 211) 507 778 Malaria Component
Eastern Cape - - - - Free State - - - - Gauteng - - - - KwaZulu-Natal 18 033 - - 18 033 Limpopo 70 370 - ( 964) 69 406 Mpumalanga 28 795 - - 28 795 Northern Cape - - - - North West - - - - Western Cape - - - -
Total 117 198 - ( 964) 116 234 Community Outreach Services Component
Eastern Cape 167 506 - 32 972 200 478 Free State 123 365 - 12 744 136 109 Gauteng 462 701 - ( 3 805) 458 896 KwaZulu-Natal 525 672 - 51 906 577 578 Limpopo 337 473 - 28 452 365 925 Mpumalanga 260 315 - 20 680 280 995 Northern Cape 90 661 - 5 284 95 945 North West 236 724 - 17 860 254 584 Western Cape 179 583 - 27 671 207 254
Total 2 384 000 - 193 764 2 577 764 HPV Component
Eastern Cape 37 289 - - 37 289 Free State 12 932 - - 12 932 Gauteng 30 427 - - 30 427 KwaZulu-Natal 50 108 - ( 1 833) 48 275 Limpopo 30 604 - - 30 604 Mpumalanga 19 680 - - 19 680 Northern Cape 5 164 - - 5 164 North West 14 777 - - 14 777 Western Cape 21 835 - - 21 835
Total 222 816 - ( 1 833) 220 983 COVID-19 component
Eastern Cape 55 000 481 076 ( 4 409) 531 667 Free State 26 182 125 159 ( 1 245) 150 096 Gauteng 143 213 607 442 ( 6 174) 744 481 KwaZulu-Natal 86 847 446 764 ( 4 389) 529 222 Limpopo 138 005 223 429 ( 2 973) 358 461 Mpumalanga 47 245 173 061 ( 1 812) 218 494 Northern Cape 38 526 61 575 ( 822) 99 279 North West 32 985 175 100 ( 1 711) 206 374 Western Cape 36 708 552 220 ( 4 844) 584 084
Total 604 711 2 845 826 ( 28 379) 3 422 158 Mental Health Component
Unallocated - - - - Total - - - - Oncology Component
Unallocated - - - - Total - - - -
APPENDIX C
APPENDIX TO SCHEDULE 5, PART A: BREAKDOWN OF THE HIV, TB, MALARIA AND COMMUNITY OUTREACH GRANT: ALLOCATIONS PER GRANT COMPONENT PER PROVINCE
HIV, TB, Malaria and Community Outreach Grant
National Financial Year
Province /Components2020/21
MainAllocation
1st Adjustment2020/21Adjusted
Allocation2nd Adjustment
71

APP
EN
DIX
D
(Nat
iona
l Fin
anci
al Y
ear)
APP
EN
DIX
TO
SC
HE
DU
LE
5, P
AR
T A
: BR
EA
KD
OW
N O
F ST
AT
UT
OR
Y H
UM
AN
RE
SOU
RC
ES,
TR
AIN
ING
AN
D
DE
VE
LO
PME
NT
GR
AN
T: A
LL
OC
AT
ION
S PE
R G
RA
NT
CO
MPO
NE
NT
PE
R P
RO
VIN
CE
72

Health (Vote 18)
Statutory Human Resources, Training and Development GrantEastern Cape 366 523 - 24 770 391 293 Free State 237 019 - 9 921 246 940 Gauteng 1 336 008 - 33 354 1 369 362 KwaZulu-Natal 593 830 - 40 548 634 378 Limpopo 232 171 - 22 519 254 690 Mpumalanga 189 495 - 16 457 205 952 Northern Cape 125 465 - 4 348 129 813 North West 192 723 - 14 283 207 006 Western Cape 881 370 - ( 11 514) 869 856 Unallocated - - - -
Total 4 154 604 - 154 686 4 309 290 of which:Statutory Human Resources Component
Eastern Cape 95 408 - 24 770 120 178 Free State 42 410 - 9 921 52 331 Gauteng 257 920 - 47 354 305 274 KwaZulu-Natal 204 610 - 40 548 245 158 Limpopo 74 547 - 22 519 97 066 Mpumalanga 60 243 - 16 457 76 700 Northern Cape 21 431 - 4 348 25 779 North West 50 860 - 14 283 65 143 Western Cape 245 023 - - 245 023 Unallocated - - -
Total 1 052 452 - 180 200 1 232 652 Training and Development Component
Eastern Cape 271 115 - - 271 115 Free State 194 609 - - 194 609 Gauteng 1 078 088 - ( 14 000) 1 064 088 KwaZulu-Natal 389 220 - - 389 220 Limpopo 157 624 - - 157 624 Mpumalanga 129 252 - - 129 252 Northern Cape 104 034 - - 104 034 North West 141 863 - - 141 863 Western Cape 636 347 - ( 11 514) 624 833 Unallocated - - -
Total 3 102 152 - ( 25 514) 3 076 638
APPENDIX D
APPENDIX TO SCHEDULE 5, PART A: BREAKDOWN OF STATUTORY HUMAN RESOURCES, TRAINING AND DEVELOPMENT GRANT: ALLOCATIONS PER GRANT COMPONENT PER PROVINCE
Statutory Human Resources, Training and Development Grant
National Financial Year
Province /Components2020/21
MainAllocation
1st Adjustment 2nd Adjustment2020/21Adjusted
Allocation
73

{
APP
EN
DIX
E
(Nat
iona
l Fin
anci
al Y
ear)
APP
EN
DIX
TO
SC
HE
DU
LE
6, P
AR
T A
: BR
EA
KD
OW
N O
F T
HE
SC
HO
OL
INFR
AST
RU
CT
UR
E B
AC
KL
OG
S G
RA
NT
: A
LL
OC
AT
ION
S PE
R P
RO
VIN
CE
74

Basic Education (Vote 16)
Schools Infrastructure Backlogs GrantEastern Cape 1 010 968 147 000 ( 63 979) 1 093 989 Free State 32 000 20 000 - 52 000 Gauteng - - - - KwaZulu-Natal 280 000 196 000 313 938 789 938 Limpopo 104 000 95 000 134 461 333 461 Mpumalanga 32 000 104 000 - 136 000 Northern Cape - - - - North West 32 000 38 000 - 70 000 Western Cape - - - - Unallocated 245 445 ( 60 000) ( 245 878) ( 60 433)
Total 1 736 413 540 000 138 542 2 414 955
APPENDIX E
APPENDIX TO SCHEDULE 6, PART A: BREAKDOWN OF THE SCHOOL INFRASTRUCTURE BACKLOGS GRANT: ALLOCATIONS PER PROVINCE
School Infrastructure Backlogs GrantNational Financial Year
Province2020/21
MainAllocation
1st Adjustment2020/21Adjusted
Allocation2nd Adjustment
75
APP
EN
DIX
F
(Nat
iona
l Fin
anci
al Y
ear)
APP
EN
DIX
TO
SC
HE
DU
LE
6, P
AR
T A
: BR
EA
KD
OW
N O
F T
HE
NA
TIO
NA
L H
EA
LT
H IN
SUR
AN
CE
IND
IRE
CT
GR
AN
T:
AL
LO
CA
TIO
NS
PER
GR
AN
T C
OM
PON
EN
T P
ER
PR
OV
INC
E
76

Health (Vote 18)
National Health Insurance Indirect GrantEastern Cape 360 339 - ( 60 000) 300 339 Free State 300 702 - ( 79 166) 221 536 Gauteng 50 676 - - 50 676 KwaZulu-Natal 2 778 - - 2 778 Limpopo 310 317 ( 20 000) ( 60 000) 230 317 Mpumalanga 79 416 - ( 15 417) 63 999 Northern Cape 2 778 - - 2 778 North West 2 778 - - 2 778 Western Cape 2 777 - - 2 777 Unallocated 1 175 303 ( 318 468) ( 25 200) 831 635
Total 2 287 864 ( 338 468) ( 239 783) 1 709 613 of which:Health Facility Revitalisation Component
Eastern Cape 357 561 - ( 60 000) 297 561 Free State 297 924 - ( 79 166) 218 758 Gauteng 47 899 - - 47 899 KwaZulu-Natal - - - - Limpopo 307 539 ( 20 000) ( 60 000) 227 539 Mpumalanga 76 638 - ( 15 417) 61 221 Northern Cape - - - - North West - - - - Western Cape - - - - Unallocated 204 583 ( 200 000) ( 4 583) -
Total 1 292 144 ( 220 000) ( 219 166) 852 978 Personal Services Component
Eastern Cape - - - - Free State - - - - Gauteng - - - - KwaZulu-Natal - - - - Limpopo - - - - Mpumalanga - - - - Northern Cape - - - - North West - - - - Western Cape - - - - Unallocated 255 320 ( 80 000) ( 4 133) 171 187
Total 255 320 ( 80 000) ( 4 133) 171 187 Non-Personal Services Component
Eastern Cape 2 778 - - 2 778 Free State 2 778 - - 2 778 Gauteng 2 777 - - 2 777 KwaZulu-Natal 2 778 - - 2 778 Limpopo 2 778 - - 2 778 Mpumalanga 2 778 - - 2 778 Northern Cape 2 778 - - 2 778 North West 2 778 - - 2 778 Western Cape 2 777 - - 2 777 Unallocated 715 400 ( 38 468) ( 16 484) 660 448
Total 740 400 ( 38 468) ( 16 484) 685 448
APPENDIX TO SCHEDULE 6, PART A: BREAKDOWN OF THE NATIONAL HEALTH INSURANCE INDIRECT GRANT: ALLOCATIONS PER GRANT COMPONENT PER PROVINCE
National Health Insurance Indirect GrantNational Financial Year
Province /Components
APPENDIX F
2020/21Main
Allocation1st Adjustment
2020/21Adjusted
Allocation2nd Adjustment
77


Printed by Creda Communications
ISBN 978-1-4850-0667-1


![State Revenue Legislation Amendment (Budget Measures… · Page 2 State Revenue Legislation Amendment (Budget Measures) Bill 2016 [NSW] The Legislature of New South Wales enacts:](https://img.pdfslide.net/doc/110x75/5b79f3617f8b9a99718b4725/state-revenue-legislation-amendment-budget-measures-page-2-state-revenue-legislation.jpg)