Embed Size (px)
Citation preview

MANONMANIAM SUNDARANAR UNIVERSITY
DIRECTORATE OF DISTANCE & CONTINUING EDUCATION
TIRUNELVELI 627012, TAMIL NADU
M.B.A. MARKETING - II YEAR
DKB22 - FUNCTIONAL MANAGEMENT II
(From the academic year 2016-17)
Most Student friendly University - Strive to Study and Learn to Excel
For more information visit: http://www.msuniv.ac.in

DKB22 - FUNCTIONAL MANAGEMENT
Unit - I
Financial Management - Objectives – functions – Role of financial Management Risk –
Return Relationship – Time value of Money – Sources of Capital – Cost of Capital Cost of debt,
Cost of Preference shares, Cost of equity, weighted average cost of capital Average and Marginal
cost of capital.
Unit - II
Capital Budgeting, Capital budgeting under the conditions of Capital rationing and
inflationary conditions. Working Capital Decisions – Working capital policy – management of
cash and near – cash assets. Management of Receivables. Management of inventory.
Unit - III
Financial analysis and planning: Financial Statements, Financial Ration Analysis,
Operating and Financial leverage. Break even Analysis.
Unit - IV
Production and operations management – Definition – Scope – Importance. Plant
Location – Selection techniques for new and expansion. Layout – Types – Advantages –
Applicability. Capacity Planning. Models – Process Planning – Economic Batch Quantity – Joint
Cycle – Multiple Products.
Unit - V
Production Planning and Control – Master Production Schedule – Sequencing –
Scheduling – Statistical Techniques in controlling – Maintenance Management. Quality
Management. Work Study. Procedures – Applicability. Industrial Safety.

Lesson
CONTENTS
Page No.
Lesson 1 Financial management 1
Lesson 2 Time value money 8
Lesson 3 Capital budgeting 18
Lesson 4 Receivable management 28
Lesson 5 Financial planning 42
Lesson 6 Financial statement analysis 47
Lesson 7 Production and operation management 54
Lesson 8 Capacity planning 60
Lesson 9 Production planning controlling 67
Lesson 10 Material management 85

Functional Management – II MS University - DDCE
1
LESSON - 1
FINANCIAL MANAGEMENT
1.0. Financial management:
Introduction: Financial Management means the efficient and effective management of
money (funds) in such a manner as to accomplish the objectives of the organization.
Financial management can be defined as the management of the finances of an organization
in order to achieve the financial objectives of the organization.
Business concern needs finance to meet their requirements in the economic world. Any kind
of business activity depends on the finance. Hence, it is called as lifeblood of business
organization. Whether the business concerns are big or small, they need finance to fulfill their
business activities.
In the modern world, all the activities are concerned with the economic activities and very
particular to earning profit through any venture or activities. The entire business activities are
directly related with making profit. (According to the economics concept of factors of
production, rent given to landlord, wage given to labour, interest given to capital and profit
given to shareholders or proprietors), a business concern needs finance to meet all the
requirements. Hence finance may be called as capital, investment, fund etc., but each term is
having different meanings and unique characters. Increasing the profit is the main aim of any
kind of economic activity.
CONTENTS
1.0 Financial management Introduction
1.1 Meaning of Finance
1.2 Definition of Financial Management
1.3 Function of Financial Management
1.4 Risk Return Relationship
1.5 Objectives of Financial Management
1.6 Role of Financial Manager

Functional Management – II MS University - DDCE
2
1.1 MEANING OF FINANCE
Finance may be defined as the art and science of managing money. It includes financial
service and financial instruments. Finance also is referred as the provision of money at the
time when I is needed. Finance function is the procurement of funds and their effective
utilization in business concerns.
The concept of finance includes capital, funds, money, and amount. But each word is having
unique meaning. Studying and understanding the concept of finance become an important
part of the business concern.
1.2 DEFINITION OF FINANCIAL MANAGEMENT:
Financial management is the management of monetary resources. It involves planning
accurately, directing the monetary resources at correct time and controlling the financial
activities of a firm. Financial management is very important for a business to ensure it can
run smoothly. Finance is an aspect which, if neglected, can lead to severe losses and closure
of a firm.
1.3 The Functions of Financial Management are as follows:
Estimation of capital requirement: The main function of a finance manager is to
estimate the costs of the firm. They must be capable to estimate the expected profits
and future requirements of finance with regards to new policies, etc. This leads to an
increase in the earning capacity of the firm.
Determination of capital composition: The finance manager has to determine the ratio
of capital involved in various projects. For example, the amount to be invested in
short term projects and long term projects, what is the amount required to be kept for
sundry expenses, staff salary, etc. If the money is short they must find outways to
increase the equity from outside resources.
Investment decision: The finance manager is a key decision makerin terms of
investment making. They should always be aware of all the monetary resources
available with the business which can help increase the company's profit
margins by investing it.
Profit management: In case of surplus profit, the finance manager can declare either
dividends or issue bonus shares

Functional Management – II MS University - DDCE
3
1.4 RISK AND RETURN RELATIONSHIP
Capital budgeting requires the projection of cash inflow and outflow of the future. The future
in always uncertain, estimate of demand, production, selling price, cost etc., cannot be exact.
For example: The product at any time it become obsolete therefore, the future in unexpected.
The following methods for considering the accounting of risk in capital budgeting. Various
evaluation methods are used for risk and uncertainty in capital budgeting is as follows:
(i) Risk-adjusted cut off rate (or method of varying discount rate)
(ii) Certainly equivalent method.
(iii) Sensitivity technique.
(iv) Probability technique
(v) Standard deviation method.
(vi) Co-efficient of variation method.
(vii) Decision tree analysis.
(i) Risk-adjusted cutoff rate (or Method of varying): This is one of the simplest
methods while calculating the risk in capital budgeting increase cut of rate or discount
factor by certain percentage an account of risk.
(ii) Certainly equivalent method: It is also another simplest method for calculating
risk in capital budgeting in for educed expected cash inflows by certain amounts it
can be employed by multiplying the expected cash inflows by certainly equivalent co-
efficient in order the uncertain cash inflow to certain cash inflows.
(iii) Sensitivity technique: When cash inflows are sensitive under different
circumstances more than one forecast of the future cash inflows may be made. These
inflows may be regarded on ‗Optimistic‘, ‗most likely‘ and ‗pessimistic‘. Further cash
inflows may be discounted to find out the net present values under these three
different situations. If the net present values under the three situations differ widely it
implies that there is a great risk in the project and the investor‘s is decision to accept
or reject a project will depend upon his risk bearing activities.
(iv) Probability technique: Probability technique refers to the each event of future
happenings are assigned with relative frequency probability. Probability means the

Functional Management – II MS University - DDCE
4
likelihood of future event. The cash inflows of the future years further discounted
with the probability. The higher present value may be accepted.
(v) Standard deviation method: Two Projects have the same cash outflow and their
net values are also the same, standard durations of the expected cash inflows of the
two Projects may be calculated to measure the comparative and risk of the Projects.
The project having
(vi) Coefficient of variation method: Coefficient of variation is a relative measure of
dispersion. It the projects here the same cost but different net present values,
relatives measure, i.e., Co-efficient of variation should be risk induced. It can be
calculated assigner standard deviation in said to be more risky as compared to the
other.
(vii) Decision tree analysis: In the modern business world, putting the investments
are become more complex and taking decisions in the risky situations. So, the
decision tree analysis helpful for taking risky and complex decisions, because it
considers all the possible events and each possible events are assigned with the
probability.
1.5 OBJECTIVES OF FINANCIAL MANAGEMENT
Effective procurement and efficient use of finance lead to proper utilization of the finance by
the business concern. It is the essential part of the financial manager. Hence, the financial
manager must determine the basic objectives of the financial management. Objectives of
Financial Management may be broadly divided into two parts such as:
1. Profit maximization
2. Wealth maximization.
Profit Maximization: Main aim of any kind of economic activity is earning profit. A
business concern is also functioning mainly for the purpose of earning profit. Profit is the
measuring techniques to understand the business efficiency of the concern. Profit
maximization is also the traditional and narrow approach, which aims at, maximizes the
profit of the concern.

Functional Management – II MS University - DDCE
5
Profit Maximization consists of the following important features.
1. Profit maximization is also called as cashing per share maximization. It leads
to maximize the business operation for profit maximization.
2. Ultimate aim of the business concern is earning profit, hence, it considers all
the possible ways to increase the profitability of the concern.
3. Profit is the parameter of measuring the efficiency of the business concern.
4. So it shows the entire position of the business concern.
5. Profit maximization objectives help to reduce the risk of the business.
Favorable Arguments for Profit Maximization
The following important points are in support of the profit maximization objectives of the
business concern:
(i) Main aim is earning profit.
(ii) Profit is the parameter of the business operation.
(iii) Profit reduces risk of the business concern.
(iv) Profit is the main source of finance.
(v) Profitability meets the social needs also.
Unfavorable Arguments for Profit Maximization
The following important points are against the objectives of profit maximization:
(i) Profit maximization leads to exploiting workers and consumers.
(ii) Profit maximization creates immoral practices such as corrupt practice, unfair
trade practice, etc.
(iii)Profit maximization objectives leads to inequalities among the share holders
such as customers, suppliers, public shareholders, etc.
Drawbacks of Profit Maximization
Profit maximization objective consists of certain drawback also:
(i) It is vague: In this objective, profit is not defined precisely or correctly. It
creates some unnecessary opinion regarding earning habits of the business
concern.
(ii) It ignores the time value of money: Profit maximization does not consider the
time value of money or the net present value of the cash inflow. It leads certain
differences between the actual cash inflow and net present cash flow during a
particular period.
Functional Management – II MS University - DDCE
6
(iii) It ignores risk: Profit maximization does not consider risk of the business
concern. Risks may be internal or external which will affect the overall
operation of the business concern.
Wealth Maximization: Wealth maximization is one of the modern approaches, which
involves latest innovations and improvements in the field of the business concern. The term
wealth means shareholder wealth or the wealth of the persons those who are involved in the
business concern.
Wealth maximization is also known as value maximization or net present worth
maximization. This objective is a universally accepted concept in the field of business.
Favorable Arguments for Wealth Maximization
(i) Wealth maximization is superior to the profit maximization because the main
aim of the business concern under this concept is to improve the value or wealth
of the shareholders.
(ii) Wealth maximization considers the comparison of the value to cost associated
with the business concern. Total value detected from the total cost incurred for
the business operation. It provides extract value of the business sconce
(iii) Wealth maximization considers both time and risk of the business concern.
(iv) Wealth maximization provides efficient allocation of resource
(v) It ensures the economic interest of the society.
Unfavorable Arguments for Wealth Maximization
(i) Wealth maximization leads to prescriptive idea of the business concern but it
may not be suitable to present day business activities
(ii) Wealth maximization is nothing, it is also profit maximization, it is the indirect
name of the profit maximization
(iii) Wealth maximization creates ownership-management contrivers
(iv) Management alone enjoys certain benefits.
(v) The ultimate aim of the wealth maximization objectives is to maximize the
profit.
(vi) Wealth maximization can be activated only with the help of the profitable
position of the business concern.
Functional Management – II MS University - DDCE
7
1.6 Role of finance manager: A description of the relationship between management and
shareholders expressing the idea that managers act as agent for the shareholders, using
delegated power to run the company in the shareholders best interest
providing and interpreting financial information;
monitoring and interpreting cash flows and predicting future trends;
analyzing change and advising accordingly;
formulating strategic and long-term business plans;
researching and reporting on factors influencing business performance;
analyzing competitors and market trends;
developing financial management mechanisms that minimize financial risk;
conducting reviews and evaluations for cost-reduction opportunities;
Managing a company's financial accounting, monitoring and reporting systems;
liaising with auditors to ensure annual monitoring is carried out;
Developing external relationships with appropriate contacts, e.g. auditors,
solicitors, bankers and statutory organizations such as the Inland Revenue;
producing accurate financial reports to specific deadlines;
managing budgets;
arranging new sources of finance for a company's debt facilities;
supervising staff;
Keeping abreast of changes in financial regulations and legislation.
QUESTIONS FOR DISCUSSION
1. Define financial management
2. Explain the functions of financial management
3. Discuss the Risk Return Relationship

Functional Management – II MS University - DDCE
8
LESSON – 2
2.0 THE TIME VALUE OF MONEY
Introduction
Now, we are going to learn one of the most important topics in finance, that is, the time
value of money. Note that almost every course, which you will take as finance major,
depends largely on the time value of money. Hence, it is a good idea to spend a fair amount
of time in learning the concepts.
2.1 Essentially, we will learn the following concepts:
1. The conventions used in the study of time value of money
2. The time value of money under simple rate of interest
The simple rate of interest nowadays is mostly of academic interest. You will seldom find
any transaction either in the real world or in the academics that is based on the simple rate of
interest. In fact, this is a fortunate development in the sense that the only thing that is simple
about the simple rate of interest is its name. Otherwise the mathematical foundations and the
CONTENTS
2.0 The time value of money
2.1 Essentially we will learn the following concepts
2.2 Sources of working capital
2.3 Cost debt
2.4 Cost of preference share capital
2.5 Cost of equity
2.6 Weighted average method
2.7 Average and marginal cost
2.8 Importance of cost of capital

Functional Management – II MS University - DDCE
9
resultant applications are almost impossible to deal with mathematically. Just to understand
its complexity we will devote some time on this topic.
In the simple rate of interest we will learn
a. Future value of an amount
b. Present value of an amount
c. Future value of an annuity
d. Present value of an annuity
3. Compound rate of interest: All the topics in the time value of money that we will learn
are under compound rate of interest. The topic that will be covered can be broadly
categorized as in two main categories
a. The time value concepts under the lump sum case
b. The time value concepts under a series of payments case
In lump sum case we will learn
a. Present value of an amount
b. Future value of an amount
c. Finding the unknown rate of interest
d. Finding the unknown time period
Under the series of payments topic we will learn present and future value of a series of
payments including future and present value of annuities and annuity dues. We will also learn
how to find the unknown rate of interest as well as the unknown time period. All of the above
concepts will be dealt with under annual compounding, compounding ‗m‘ (m>1) times per
year and continuous compounding.
4. Special topics : Under this we will discuss the concept of time value of money for such
topics but not limited to cash flows growing at a constant rate (under the constant growth
rate) and/or under constant level increments, when compounding and deposit intervals are
different etc
2.2 SOURCES OF WORKING CAPITAL
Working Capital requirement can be normalized from short-term and long-term sources.
Each source will have both merits and limitations up to certain extract. Uses of Working

Functional Management – II MS University - DDCE
10
Capital may be differing from stage to stage.
The above sources are also classified into internal sources and external sources of working
capital.
Internal sources such as:
o Retained Earnings
o Reserve and Surplus
o Depreciation Funds etc.
External sources such as:
o Debentures and Public Deposits
o Loans from Banks and Financial Institutions
o Advances and Credit
o Financial arrangements like Factoring, etc.
Determining the Finance Mix
Determining the finance mix is an important part of working capital management. Under this
decision, the relationship among risk, return and liquidity are measured and also which type
of financing is suitable to meet the Working Capital requirements of the business concern.

Functional Management – II MS University - DDCE
11
There are three basic approaches for determining an appropriate Working Capital finance
mix.
1. Hedging or matching approach
2. Conservative approach
3. Aggressive approach.
1. Hedging Approach: Hedging approach is also known as matching approach. Under
this approach, the business concern can adopt a financial plan which matches the
expected life of assets with the expected life of the sources of funds raised to
finance assets.
When the business follows matching approach, long-term finance shall be used to
fixed assets and permanent current assets and short-term financing to finance
temporary or variable assets.
2. Conservative Approach: Under this approach, the entire estimated finance in
current assets should be financed from long-term sources and the short-term sources
should be used only for emergency requirements. This approach is called as ―Low
Profit – Low Risk‖ concept.

Functional Management – II MS University - DDCE
12
3. Aggressive Approach: Under this approach, the entire estimated requirement of
current assets should be financed from short-term sources and even a part of fixed
assets financing be financed from short- term sources. This approach makes the
finance mix more risky, less costly and more profitable.
2.3 COST OF DEBT:
Cost of debt is the after tax cost of long-term funds through borrowing. Debt may be issued at
par, at premium or at discount and also it may be perpetual or redeemable.
Debt Issued at Par: Debt issued at par means, debt is issued at the face value of the debt. It
may be calculated with the help of the following formula.
Kd = (1 – t) R
Where,
Kd = Cost of debt capital
t = Tax rate
R = Debenture interest rate
Debt Issued at Premium or Discount: If the debt is issued at premium or discount, the cost
of debt is calculated with the help of the following formula.
Kd =pIN (1 – t)
Where,
Kd = Cost of debt capital
I = Annual interest payable
Np = Net proceeds of debenture
t = Tax rate

Functional Management – II MS University - DDCE
13
Cost of Perpetual Debt and Redeemable Debt: It is the rate of return which the lenders
expect. The debt carries a certain rate of interest.
Kdb =ppI 1/n(P N )n\1/ n(P N )/ 2+
Where,
I = Annual interest payable
P = Par value of debt
Np = Net proceeds of the debenture
n = Number of years to maturity
Kdb = Cost of debt before t
Cost of debt after tax can be calculated with the help of the following formula:
K da=K db×(1–t)
Where,
Kda = Cost of debt after tax
Kdb = Cost of debt before tax
t = Tax rate
2.4 Cost of Preference Share Capital: Cost of preference share capital is the annual
preference share dividend by the net proceeds from the sale of preference share.
Cost of Retained Earnings: A Retained earnings is one of the sources of finance for
investment proposal; it is different from other sources like debt, equity and preference shares.
Cost of retained earnings is the same as the cost of an equivalent fully subscripted issue of
additional shares, which is measured by the cost of equity capital.
Measurement of Overall Cost of Capital: It is also called as weighted average cost of
capital and composite cost of capital. Weighted average cost of capital is the expected
average future cost of funds over the long run found by weighting the cost of each specific
type of capital by its proportion in the firms capital structure.
The computation of the overall cost of capital (Ko) involves the following steps.
(a) Assigning weights to specific costs.
(b) Multiplying the cost of each of the sources by the appropriate weights.
(c) Dividing the total weighted cost by the total weights.
Functional Management – II MS University - DDCE
14
2.5 Cost of Equity: Cost of equity capital is the rate at which investors discount the expected
dividends of the firm to determine its share value. Conceptually the cost of equity capital
(Ke) defined as the ―Minimum rate of return that a firm must earn on the equity financed
portion of an investment project in order to leave unchanged the market price of the shares‖.
Cost of equity can be calculated from the following approach:
• Dividend price (D/P) approach
• Dividend price plus growth (D/P + g) approach
• Earning price (E/P) approach
• Realized yield approach.
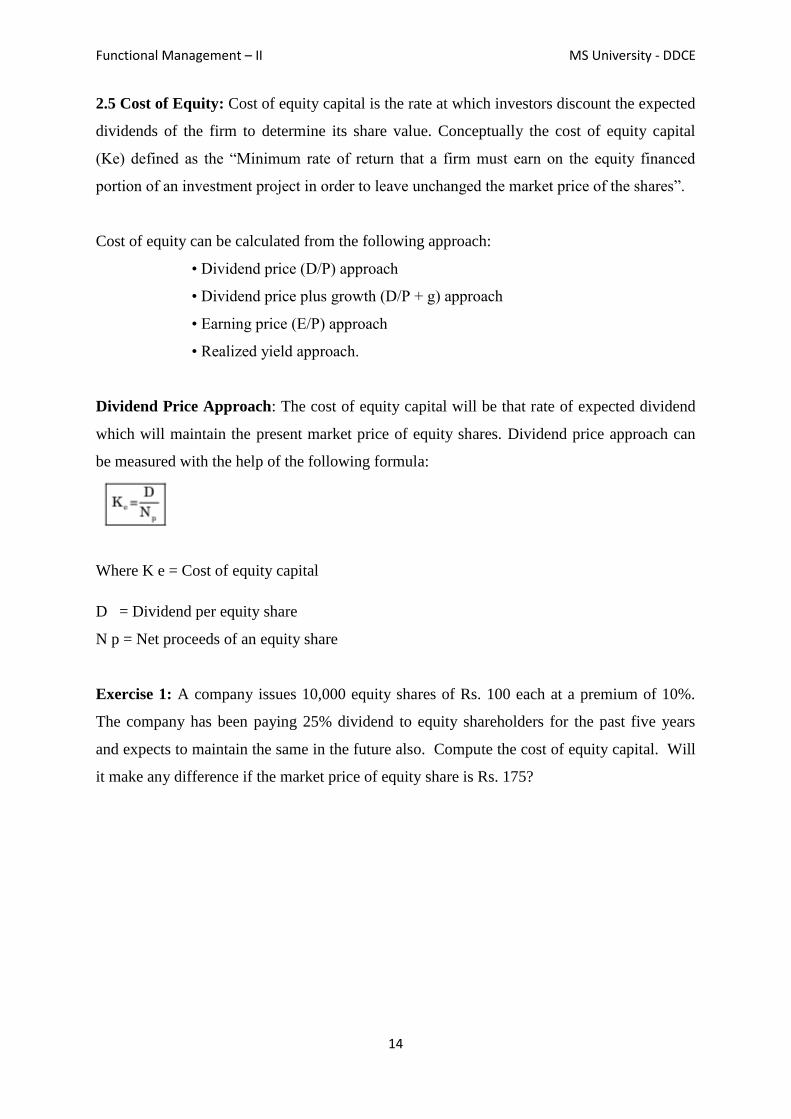
Dividend Price Approach: The cost of equity capital will be that rate of expected dividend
which will maintain the present market price of equity shares. Dividend price approach can
be measured with the help of the following formula:
Where K e = Cost of equity capital
D = Dividend per equity share
N p = Net proceeds of an equity share
Exercise 1: A company issues 10,000 equity shares of Rs. 100 each at a premium of 10%.
The company has been paying 25% dividend to equity shareholders for the past five years
and expects to maintain the same in the future also. Compute the cost of equity capital. Will
it make any difference if the market price of equity share is Rs. 175?

Functional Management – II MS University - DDCE
15
Solution
2.6 The Weighted Average Method | Weighted Average Costing
The weighted average method is used to assign the average cost of production to a product.
Weighted average costing is commonly used in situations where:
Inventory items are so intermingled that it is impossible to assign a specific cost to an
individual unit.
The accounting system is not sufficiently sophisticated to track FIFO or LIFO
inventory layers.
Inventory items are so commoditized (i.e., identical to each other) that there is no way
to assign a cost to an individual unit.
When using the weighted average method, divide the cost of goods available for sale
by the number of units available for sale, which yields the weighted-average cost per
unit. In this calculation, the cost of goods available for sale is the sum of beginning
inventory and net purchases. You then use this weighted-average figure to assign a
cost to both ending inventory and the cost of goods sold.
The net result of using weighted average costing is that the recorded amount of
inventory on hand represents a value somewhere between the oldest and newest units
purchased into stock. Similarly, the cost of goods sold will reflect a cost somewhere
between that of the oldest and newest units that were sold during the period.
The weighted average method is allowed under both generally accepted accounting
principles and international financial reporting standards.

Functional Management – II MS University - DDCE
16
2.7 Average and Marginal Cost: Average cost of capital is the weighted average cost of
each component of capital employed by the company. It considers weighted average cost of
all kinds of financing such as equity, debt, retained earnings etc.
Marginal cost is the weighted average cost of new finance raised by the company. It is the
additional cost of capital when the company goes for further rising of finance.
Historical and Future Cost: Historical cost is the cost which has already been incurred for
financing a particular project. It is based on the actual cost incurred in the previous project.
Future cost is the expected cost of financing in the proposed project. Expected cost is
calculated on the basis of previous experience.
Specific and Combine Cost: The cost of each sources of capital such as equity, debt,
retained earnings and loans is called as specific cost of capital. It is very useful to determine
the each and every specific source of capital. The composite or combined cost of capital is
the combination of all sources of capital. It is also called as overall cost of capital. It is used
to understand the total cost associated with the total finance of the firm.
2.8 IMPORTANCE OF COST OF CAPITAL
Computation of cost of capital is a very important part of the financial management to decide
the capital structure of the business concern. The reasons are as follows
1. Importance to Capital Budgeting Decision: Capital budget decision largely depends
on the cost of capital of each source. According to net present value method, present
value of cash inflow must be more than the present value of cash outflow. Hence, cost
of capital is used to capital budgeting decision.
2. Importance to Structure Decision: Capital structure is the mix or proportion of the
different kinds of long term securities. A firm uses particular type of sources if the
cost of capital is suitable. Hence, cost of capital helps to take decision regarding
structure.
3. Importance to Evolution of Financial Performance: Cost of capital is one of the
important determining which affects the capital budgeting, capital structure and value
of the firm. Hence, it helps to evaluate the financial performance of the firm.

Functional Management – II MS University - DDCE
17
4. Importance to Other Financial Decisions: Apart from the above points, cost of
capital is also used in some other areas such as, market value of share, earning
capacity of securities etc. hence; it plays a major part in the financial management.
QUESTIONS FOR DISCUSSION
1. What is time value of money
2. Explain the sources of working capital
3. Discuss the methods of equity calculation
4. Explain the importance of cost of capital

Functional Management – II MS University - DDCE
18
LESSON – 3
3.0 CAPITAL BUDGETING
INTRODUCTION
The word Capital refers to be the total investment of a company of firm in money, tangible
and intangible assets. Whereas budgeting defined by the ―Rowland and William‖ it may be
said to be the art of building budgets. Budgets are a blue print of a plan and action expressed
in quantities and manners.
The examples of capital expenditure:
1. Purchase of fixed assets such as land and building, plant and machinery, good will,
etc.
2. The expenditure relating to addition, expansion, improvement and alteration to the
fixed assets.
3. The replacement of fixed assets.
4. Research and development project.
CONTENTS
3.0 Capital budgeting
3.1 Capital Rationing
3.2 Capital budgeting decisions
3.3 Working capital management policy
3.4 Cash management
3.5 Cash management techniques
3.6 Cash management models
Functional Management – II MS University - DDCE
19
Definitions: According to the definition of Charles T. Hrongreen, ―capital budgeting is a
long-term Planning for making and financing proposed capital out lays
According to the definition of G.C. Philippatos, ―capital budgeting is concerned with the
allocation of the firms source financial resources among the available opportunities.
The consideration of investment opportunities involves the comparison of the expected future
streams of earnings from a project with the immediate and subsequent streams of earning
from a project, with the immediate and subsequent streams of expenditure‖.
According to the definition of Richard and Green law, ―capital budgeting is acquiring inputs
with long-term return‖
According to the definition of Lyrich, ―capital budgeting consists in planning development of
available capital for the purpose of maximizing the long-term profitability of the
concern‖.120 Financial Management
It is clearly explained in the above definitions that a firm‘s scarce financial resources are
utilizing the available opportunities. The overall objective of the company from is to
maximize the profits and minimize the expenditure of cost.
A number of capital budgeting techniques are used in practice. They may be grouped in the
following two categories: -
1. Capital budgeting techniques under certainty; and
2. Capital budgeting techniques under uncertainty
Capital budgeting techniques under certainty: Capital budgeting techniques (Investment
appraisal criteria) under certainty can also be divided into following two groups:
1. Non-Discounted Cash Flow Criteria: -
i. Pay Back Period (PBP)
ii. Accounting Rate Of Return (ARR)
2. Discounted Cash Flow Criteria: -
i. Net Present Value (NPV)

Functional Management – II MS University - DDCE
20
ii. Internal Rate of Return (IRR)
iii. Profitability Index (PI) 2
1. Non-Discounted Cash Flow Criteria: These are also known as traditional
techniques:
a) Pay Back Period (PBP) : The pay back period (PBP) is the traditional method of
capital budgeting. It is the simplest and perhaps, the most widely used
quantitative method for appraising capital expenditure decision. Meaning: It is
the number of years required to recover the original cash outlay invested in a
project. There are two methods of calculating the PBP.
i. The first method can be applied when the CFAT is uniform. In such a
situation the initial cost of the investment is divided by the constant
annual cash flow: For example, if an investment of Rs. 100000 in a
machine is expected to generate cash inflow of Rs. 20,000 p.a. for 10
years. Its PBP will be calculated using following formula:
PBP = Initial Investment/Constant annual cash flow
=100000/20000 = 5 Years
ii. The second method is used when a project‘s CFAT are not equal. In such
a situation PBP is calculated by the process of cumulating CFAT till the
time when cumulative cash flow becomes equal to the original investment
outlays.
b) Accounting/Average Rate of Return (ARR): This method is also known as the
return on investment (ROI), return on capital employed (ROCE) and is using
accounting information rather than cash flow. The ARR is the ratio of the average
after tax profit divided by the average investment.
Method to compute ARR: There are a number of alternative methods for
calculating ARR. The most common method of computing ARR is using the
following formula:
ARR=(Avg. Annual Profit after Tax/Avg. Investment)x100

Functional Management – II MS University - DDCE
21
2. Discounted Cash Flow Criteria: These are also known as modern or time adjusted
techniques because all these techniques take into consideration time value of money. The
different types are
(a) Net Present Value (NPV): The net present value is one of the discounted cash flow
or time-adjusted technique. It recognizes that cash flow streams at different time
period differs in value and can be computed only when they are expressed in terms of
common denominator i.e. present value. The NPV is the difference between the
present value of future cash inflows and the present value of the initial outlay,
discounted at the firm‘s cost of capital. The procedure for determining the present
values consists of two stages. The first stage involves determination of an appropriate
discount rate. With the discount rate so selected, the cash flow streams are converted
into present values in the second stage.
Method to compute NPV: The important steps for calculating NPV are given below.
i. Cash flows of the investment project should be forecasted based on realistic
assumptions. These cash flows are the incremental cash inflow after taxes and
are inclusive of depreciation (CFAT) which is assumed to be received at the
end of each year. CFAT should take into account salvage value and working
capital released at the end.
ii. Appropriate discount rate should be identified to discount the forecasted cash
flows. The appropriate discount rate is the firm‘s opportunity cost of capital
which is equal to the required rate of return expected by investors on
investments of equivalent risk.
iii. Present value (PV) of cash flows should be calculated using opportunity cost
of capital as the discount rate.
iv. NPV should be found out by subtracting present value of cash outflows from
present value of cash inflows. The project should be accepted if NPV is
positive (i.e. NPV >0) The NPV can be calculated with the help of equation.
NPV = Present value of cash inflows – Initial investment
b) Profitability Index (PI): Profitability Index (PI) or Benefit-cost ratio (B/C) is similar
to the NPV approach. PI approach measures the present value of returns per rupee

Functional Management – II MS University - DDCE
22
invested. It is observed in shortcoming of NPV that, being an absolute measure, it is
not a reliable method to evaluate projects requiring different initial investments. The
PI method provides solution to this kind of problem. It is a relative measure and can
be defined as the ratio which is obtained by dividing the present value of future cash
inflows by the present value of cash outlays.
PI = Present value of Cash Inflow/Initial Cash Outlay
c) Internal Rate of Return (IRR): This technique is also known as yield on
investment, marginal productivity of capital, marginal efficiency of capital, rate of
return, and time-adjusted rate of return and so on. It also considers the time value of
money by discounting the cash flow streams, like NPV. While computing the required
rate of return and finding out present value of cash flows-inflows as well as outflows-
are not considered. But the IRR depends entirely on the initial outlay and the cash
proceeds of the projects which are being evaluated for acceptance or rejection. It is,
therefore, appropriately referred to as internal rate of return. The IRR is usually the
rate of return that a project earns. It is the discount rate that equates the NPV of an
investment opportunity with Rs.0 (because the present value of cash inflows equals
the initial investment). It is the compound annual rate of return that the firm will earn
if it invests in the project and receives the given cash inflows.
3.1 Capital Rationing
In the rationing the company has only limited investment the projects are selected according
to the profitability. The project has selected the combination of proposal that will yield the
greatest portability.
Exercise 12 Let us assume that a firm has only Rs. 20 lakhs to invest and funds cannot be
provided. The various proposals along with the cost and profitability index are as follows.
Proposal Pool of the project Profitability Index
1 6, 00,000 1.46
2 2, 00,000 .098
3 10, 00,000 2.31
4 4, 00,000 1.32
5 3, 00,000 1.25

Functional Management – II MS University - DDCE
23
Solution
In this example all proposals expect number 2 give profitability exceeding one and are
profitable investments. The total outlay required to be invested in all other (profitable) project
is Rs. 25,00,000(1+2+3+4+5) but total funds available with the firm are Rs. 20 lakhs and
hence the firm has to do capital combination of project within a total which has the lowest
profitability index along with the profitable proposals cannot be taken.
3.2 CAPITAL BUDGETING DECISIONS
The overall objective of capital budgeting is to maximize the profitability. If a firm
concentrates return on investment, this objective can be achieved either by increasing the
revenues or reducing the costs. The increasing revenues can be achieved by expansion or the
size of operations by adding a new product line. Reducing costs mean representing obsolete
return on assets.
3.3 WORKING CAPITAL MANAGEMENT POLICY
Working Capital Management formulates policies to manage and handle efficiently; for that
purpose, the management established three policies based on the relationship between Sales
and Working Capital.
1. Conservative Working Capital Policy.
2. Moderate Working Capital Policy.
3. Aggressive Working Capital Policy.
1. Conservative working capital policy: Conservative Working Capital Policy refers to
minimize risk by maintaining a higher level of Working Capital. This type of
Working Capital Policy is suitable to meet the seasonal fluctuation of the
manufacturing operation.
2. Moderate working capital policy: Moderate Working Capital Policy refers to the
moderate level of Working Capital maintenances according to moderate level of sales.
It means one percent of change in Working Capital that is Working Capital is equal to
sales.
3. Aggressive working capital policy: Aggressive Working Capital Policy is one of the
high risky and profitability policies which maintain low level of Aggressive Working

Functional Management – II MS University - DDCE
24
Capital against the high level of sales, in the business concern during a particular
period.
3.4 CASH MANAGEMENT
Business concern needs cash to make payments for acquisition of resources and services for
the normal conduct of business. Cash is one of the important and key parts of the current
assets.
Cash is the money which a business concern can disburse immediately without any
restriction. The term cash includes coins, currency, cheques held by the business concern and
balance in its bank accounts. Management of cash consists of cash inflow and outflows, cash
flow within the concern and cash balance held by the concern etc.
Motives for Holding Cash
1. Transaction motive: It is a motive for holding cash or near cash to meet routine
cash requirements to finance transaction in the normal course of business. Cash is
needed to make purchases of raw materials, pay expenses, taxes, dividends etc.
2. Precautionary motive: It is the motive for holding cash or near cash as a
cushion to meet unexpected contingencies. Cash is needed to meet the
unexpected situation like, floods strikes etc.
3. Speculative motive: It is the motive for holding cash to quickly take advantage
of opportunities typically outside the normal course of business. Certain amount
of cash is needed to meet an opportunity to purchase raw materials at a reduced
price or make purchase at favorable prices.

Functional Management – II MS University - DDCE
25
4. Compensating motive: It is a motive for holding cash to compensate banks for
providing certain services or loans. Banks provide variety of services to the
business concern, such as clearance of cheque, transfer of funds etc.
3.5 Cash Management Techniques: Managing cash flow constitutes two important parts:
A. Speedy Cash Collections.
B. Slowing Disbursements.
Speedy Cash Collections: Business concern must concentrate in the field of Speedy Cash
Collections from customers. For that, the concern prepares systematic plan and refined
techniques. These techniques aim at, the customer who should be encouraged to pay as
quickly as possible and the payment from customer without delay. Speedy Cash Collection
business concern applies some of the important techniques as follows:
(i) Prompt Payment by Customers: Business concern should encourage the
customer to pay promptly with the help of offering discounts, special offer etc.
It helps to reduce the delaying payment of customers and the firm can avoid
delays from the customers. The firms may use some of the techniques for
prompt payments like billing devices, self address cover with stamp etc.
(ii) Early Conversion of Payments into Cash: Business concern should take
careful action regarding the quick conversion of the payment into cash. For
this purpose, the firms may use some of the techniques like postal float,
processing float, bank float and deposit float.
(iii) Concentration Banking: It is a collection procedure in which payments are
made to regionally dispersed collection centers, and deposited in local banks
for quick clearing. It is a system of decentralized billing and multiple
collection points.
(iv) Lock Box System: It is a collection procedure in which payers send their
payment or cheques to a nearby post box that is cleared by the firm‘s bank.
Several times that the bank deposits the cheque in the firms account. Under
the lock box system, business concerns hire a post office lock box at important
collection centers where the customers remit payments. The local banks are
authorized to open the box and pick up the remittances received from the

Functional Management – II MS University - DDCE
26
customers. As a result, there is some extra savings in mailing time compared
to concentration bank.
Slowing Disbursement: An effective cash management is not only in the part of speedy
collection of its cash and receivables but also it should concentrate to slowing their
disbursement of cash to the customers or suppliers. Slowing disbursement of cash is not the
meaning of delaying the payment or avoiding the payment. Slowing disbursement of cash is
possible with the help of the following methods:
1. Avoiding the early payment of cash: The firm should pay its payable only on the
last day of the payment. If the firm avoids early payment of cash, the firm can
retain the cash with it and that can be used for other purpose.
2. Centralized disbursement system: Decentralized collection system will provide
the speedy cash collections. Hence centralized disbursement of cash system takes
time for collection from our accounts as well as we can pay on the date.
3.6 Cash Management Models: Cash management models analyze methods which provide
certain framework as to how the cash management is conducted in the firm. Cash
management models are the development of the theoretical concepts into analytical
approaches with the mathematical applications. There are three cash management models
which are very popular in the field of finance.
1. Baumol model: The basic objective of the Baumol model is to determine the
minimum cost amount of cash conversion and the lost opportunity cost. It is a model
that provides for cost efficient transactional balances and assumes that the demand for
cash can be predicated with certainty and determines the optimal conversion size.
Total conversion cost per period can be calculated with the help of the following
formula:
Where,
i = interest rate earned
C/2 = Average cash balance
Optimal cash conversion can be calculated with the help of the following
formula;
Functional Management – II MS University - DDCE
27
Where,
C = Optimal conversion amount
b = Cost of conversion into cash per lot or transaction
T = Projected cash requirement
i = interest rate earned
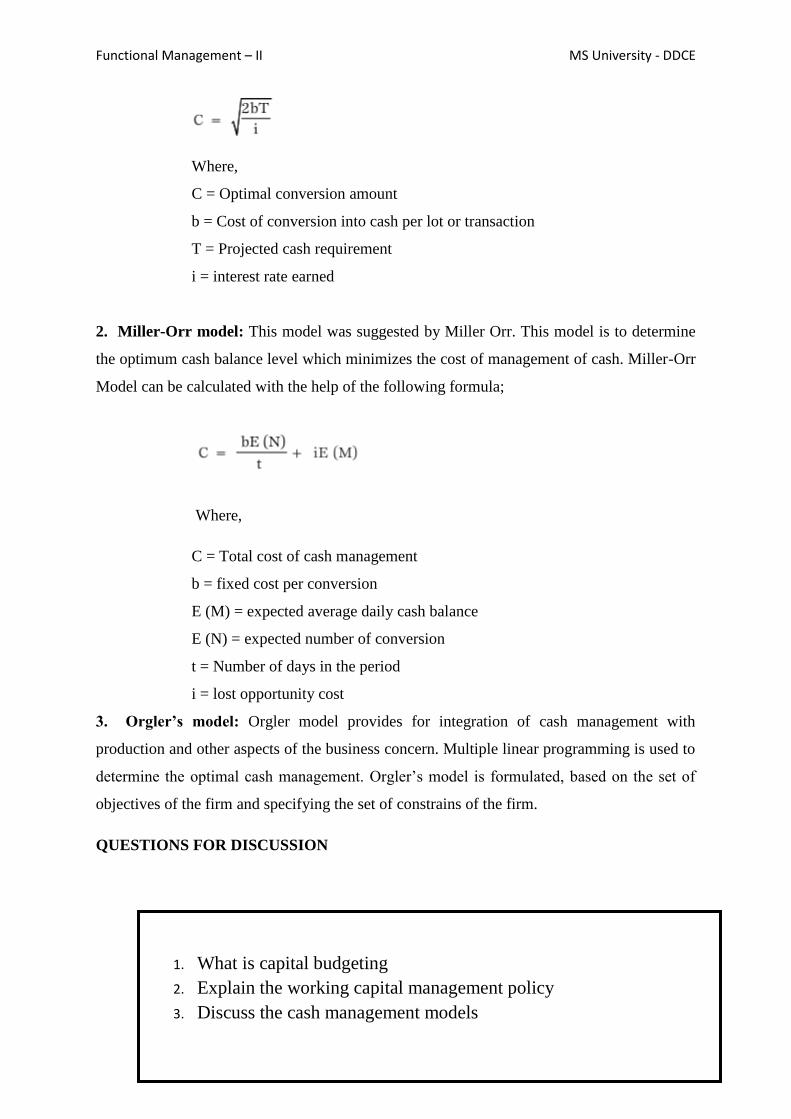
2. Miller-Orr model: This model was suggested by Miller Orr. This model is to determine
the optimum cash balance level which minimizes the cost of management of cash. Miller-Orr
Model can be calculated with the help of the following formula;
Where,
C = Total cost of cash management
b = fixed cost per conversion
E (M) = expected average daily cash balance
E (N) = expected number of conversion
t = Number of days in the period
i = lost opportunity cost
3. Orgler’s model: Orgler model provides for integration of cash management with
production and other aspects of the business concern. Multiple linear programming is used to
determine the optimal cash management. Orgler‘s model is formulated, based on the set of
objectives of the firm and specifying the set of constrains of the firm.
QUESTIONS FOR DISCUSSION
1. What is capital budgeting
2. Explain the working capital management policy
3. Discuss the cash management models

Functional Management – II MS University - DDCE
28
LESSON - 4
4.0 RECEIVABLE MANAGEMENT
The term receivable is defined as debt owed to the concern by customers arising from sale of
goods or services in the ordinary course of business. Receivables are also one of the major
parts of the current assets of the business concerns. It arises only due to credit sales to
customers, hence, it is also known as Account Receivables or Bills Receivables.
Management of account receivable is defined as the process of making decision resulting to
the investment of funds in these assets which will result in maximizing the overall return on
the investment of the firm. The objective of receivable management is to promote sales and
profit until that point is reached where the return on investment in further funding receivables
is less than the cost of funds raised to finance that additional credit.
The costs associated with the extension of credit and accounts receivables are identified as
follows:
a. Collection Cost
b. Capital Cost
c. Administrative Cost
d. Default Cost.
a. Collection Cost: This cost incurred in collecting the receivables from the customers
to whom credit sales have been made.
CONTENTS
4.0 Receivable management
4.1 Receivable management various factors
4.2 Inventory management
4.3 Kinds of inventories
4.4 Objectives of inventory management
4.5 Techniques of inventory management
4.6 Economic order quantity

Functional Management – II MS University - DDCE
29
b. Capital Cost This is the cost on the use of additional capital to support credit sales
which alternatively could have been employed elsewhere.
c. Administrative Cost This is an additional administrative cost for maintaining
account receivable in the form of salaries to the staff kept for maintaining accounting
records relating to customers, cost of investigation etc.
d. Default Cost Default costs are the over dues that cannot be recovered. Business
concern may not be able to recover the over dues because of the inability of the
customers. Factors Considering the Receivable Size
Receivables size of the business concern depends upon various factors. Some of the
important factors are as follows:
4.1 RECEIVABLES MANAGEMENT VARIOUS FACTORS
1. Sales Level: Sales level is one of the important factors which determine the size of
receivable of the firm. If the firm wants to increase the sales level, they have to
liberalize their credit policy and terms and Conditions. When the firms maintain more
sales, there will be a possibility of large size of receivable.
2. Credit Policy: Credit policy is the determination of credit standards and analysis. It
may vary from firm to firm or even some times product to product in the same
industry. Liberal credit policy leads to increase the sales volume and also increases
the size of receivable. Stringent credit policy reduces the size of the receivable.
3. Credit Terms: Credit terms specify the repayment terms required of credit
receivables, depend upon the credit terms, size of the receivables may increase or
decrease. Hence, credit term is one of the factors which affect the size of receivable.
4. Credit Period: It is the time for which trade credit is extended to customer in the case
of credit sales. Normally it is expressed in terms of ‗Net days‘.
5. Cash Discount: Cash discount is the incentive to the customers to make early
payment of the due date. A special discount will be provided to the customer for his
payment before the due date.

Functional Management – II MS University - DDCE
30
6. Management of Receivable:It is also one of the factors which affect the size of
receivable in the firm. When the management Involves systematic approaches to the
receivable, the firm can reduce the size of receivable.
Exercise: The board of directors of Aravind mills limited requests you to prepare a statement
showing the working capital requirements for a level of activity of 30,000 units of output for
the year. The cost structure for the company‘s product for the above mentioned activity level
is given below.
(a) Past experience indicates that raw materials are held in stock, on an average for 2 months.
(b) Work in progress (100% complete in regard to materials and 50% for labor and
overheads) will be half a month‘s production.
(c) Finished goods are in stock on an average for 1 month.
(d) Credit allowed to suppliers: 1 month.
(e) Credit allowed to debtors: 2 months.
(f) A minimum cash balance of Rs 25,000 is expected to be maintained.
Prepare a statement of working capital requirements.
Solution
Output per annum = 30,000 units
Output per annum = 12% of 30,000 =2,500 units
Raw materials p. m. Rs. 20×2500 = 50,000
Labour p. m. Rs. 5×2,500 = 12,500
Overheads p. m. Rs. 15×2,500 = 37,500
1, 00,000

Functional Management – II MS University - DDCE
31
Prepare an estimate of working capital requirement from the following information of a
trading concern.
Projected annual sales 10,000 units
Selling price Rs. 10 per unit
Percentage of net profit on sales 20%
Average credit period allowed to customers 8 Weeks
Average credit period allowed by suppliers 4 Weeks
Average stock holding in terms of sales requirements 12 Weeks
Allow 10 for contingencies
Solution
Working Notes
Sales = 10000×10 = Rs. 1,00,000
Profit 20% of Rs. 1,00,000 = Rs. 20,000
Cost of Sales=Rs.1,00,000 – 20,000 = Rs. 80,000

Functional Management – II MS University - DDCE
32
As it is a trading concern, cost of sales is assumed to be the purchases.
Exercise: Prepare an estimate of working capital requirement from the following information
of a trading concern.
Projected annual sales Rs. 6,50,000
Percentage of net profit on sales 25%
Average credit period allowed to debtors 10 Weeks
Average credit period allowed by creditors 4 Weeks
Average stock holding in terms of sales requirements 8 Weeks
Allow 20% for contingencies
Working Notes
Sales=Rs. 6,50,000
Profit 25/125 of Rs. 6,50,000 = Rs. 1,30,000
Cost of Sales=Rs. 6,50,000 –1,30,000=Rs. 5,20,000
As it is a trading concern, cost of sales is assumed to be the purchases.
Exercise 7
A Performa cost sheet of a company provides the following particulars:
Elements of cost
Material 35%
Direct Labors 25%
Overheads 20%
Further particulars available are:
(i) It is proposed to maintain a level of activity of 2,50,000 units.
(ii) Selling price is Rs. 10/- per unit

Functional Management – II MS University - DDCE
33
(iii) Raw materials are to remain in stores for an average period of one month.
(iv) Finished foods are required to be in stock for an average period of one month.
(v) Credit allowed to debtors is 3 months.
(vi) Credit allowed by suppliers is 2 months.
You are required to prepare a statement of working capital requirements, a fore cost profit
and loss account and balance sheet of the company assuring that
Share Capital Rs. 12,00,000
10% Debentures Rs. 3,00,000
Fixed Assets Rs. 11,00,000
Solution

Functional Management – II MS University - DDCE
34
Selva and Co. desires to purchase a business and has consulted you and one point on which
you are to advise them is the average amount of working capital which will be required in the
first year‘s working.
You have given the following estimates and instructed to add 10% to your computed figure to
allow for contingencies.
(i) Amount blocked up for stocks: Figures for the year
Stocks of finished product 3,000
Stocks of stores, materials, etc., 5,000
(ii) Average credit given:
Inland sales 4 weeks credit 26,000
Export sales— 1 2 1 weeks credit 65,000
(iii) Lag in payment of wages and other outputs
Wages— 1 2 1 weeks 2, 40,000
Stocks of materials, etc. — 1 2 1 month 36,000

Functional Management – II MS University - DDCE
35
Rent, Royalties, etc.—4 months 8,000
Clerical staff— 1 2 1 month 60,000
Manager— 1 2 month 4,000
Miscellaneous expenses— 121 month 36,000
(iv) Payment in advance
Sundry Expenses (paid quarterly in advance) 6,000
(v) Undrawn profit on the average throughout the year 9,000
State your calculations for the average amount of working capital required.
A Performa cost sheet of a company provides the following particulars:
Elements of Cost Amt. Per Unit (Rs.)
Raw Materials 140
Direct Labours 60
Overheads 70
Total Cost 270
Profit 30
Selling Price 300

Functional Management – II MS University - DDCE
36
Further particulars available are:
Raw materials are in stock on an average for one month. Materials are in process on an
average for half a month. Finished goods are in stock on an average for one month.
Credit allowed by suppliers is one month – credit allowed to customers is two months. Lag in
payment of wages is 11 2 weeks. Lag in payment of overhead expenses is one month. One
fourth of the output is sold against cash. Cash in hand and at bank is expected to be Rs.
50,000.
You are required to prepare a statement showing the working capital needed to finance, a
level of activity of 2,40,000 units of production. You may assume that production is carried
on evenly throughout the year; wages and overhead accrue similarly and a time period of 4
weeks is equivalent to a month.
Note: Year = 4×12 = 48 weeks

Functional Management – II MS University - DDCE
37
4.2 INVENTORY MANAGEMENT
Introduction: Inventories constitute the most significant part of current assets of the business
concern. It is also essential for smooth running of the business activities. A proper planning
of purchasing of raw material, handling, storing and recording is to be considered as a part of
inventory management. Inventory management means, management of raw materials and
related items. Inventory management considers what to purchase, how to purchase, how
much to purchase, from where to purchase, where to store and when to use for production etc.
Meaning: The dictionary meaning of the inventory is stock of goods or a list of goods. In
accounting language, inventory means stock of finished goods. In a manufacturing point of
view, inventory includes, raw material, work in process, stores, etc.
4.3 KINDS OF INVENTORIES
Inventories can be classified into five major categories.
a. Raw Material It is basic and important part of inventories. These are goods which
have not yet been committed to production in a manufacturing business concern.
b. Work in Progress These include those materials which have been committed to
production process but have not yet been completed.
c. Consumables These are the materials which are needed to smooth running of the
manufacturing process.
d. Finished Goods These are the final output of the production process of the business
concern. It is ready for consumers.
e. Spares It is also a part of inventories, which includes small spares and parts.
4.4 OBJECTIVES OF INVENTORY MANAGEMENT
Inventory occupies 30–80% of the total current assets of the business concern. It is also very
essential part not only in the field of Financial Management but also it is closely associated
with production management. Hence, in any working capital decision regarding the
inventories, it will affect both financial and production function of the concern. Hence,
efficient management of inventories is an essential part of any kind of manufacturing process
concern.

Functional Management – II MS University - DDCE
38
The major objectives of the inventory management are as follows:
• To efficient and smooth production process.
• To maintain optimum inventory to maximize the profitability.
• To meet the seasonal demand of the products.
• To avoid price increase in future.
• To ensure the level and site of inventories required.
• To plan when to purchase and where to purchase
• To avoid both over stock and under stock of inventory.
4.5 TECHNIQUES OF INVENTORY MANAGEMENT
Inventory management consists of effective control and administration of inventories.
Inventory controls refers to a system which ensures supply of required quantity and quality of
inventories at the required time and at the same time prevent unnecessary investment in
inventories. It needs the following important techniques. Inventory management techniques
may be classified into various types:
A. Techniques based on the order quantity of Inventories
Order quantity of inventories can be determined with the help of the following techniques:
Stock Level: Stock level is the level of stock which is maintained by the business concern at
all times. Therefore, the business concern must maintain optimum level of stock to smooth
running of the business process. Different level of stock can be determined based on the
volume of the stock.

Functional Management – II MS University - DDCE
39
Minimum Level: The business concern must maintain minimum level of stock at all times. If
the stocks are less than the minimum level, then the work will stop due to shortage of
material.
Re-order Level: Re-ordering level is fixed between minimum level and maximum level.
Re-order level is the level when the business concern makes fresh order at this level.
Re-order level=maximum consumption × maximum Re-order period.
Maximum Level: It is the maximum limit of the quantity of inventories, the business
concern must maintain. If the quantity exceeds maximum level limit then it will be
overstocking.
Maximum level = Re-order level + Re-order quantity
– (Minimum consumption × Minimum delivery period)
Danger Level: It is the level below the minimum level. It leads to stoppage of the production
process.
Average Stock Level
It is calculated such as,
Average stock level= Minimum stock level + ½ of re-order quantity
Maximum Level
It is the maximum limit of the quantity of inventories, the business concern must maintain.
If the quantity exceeds maximum level limit then it will be overstocking.
Maximum level = Re-order level + Re-order quantity
– (Minimum consumption × Minimum delivery period)
Danger Level
It is the level below the minimum level. It leads to stoppage of the production process.
Average Stock Level
It is calculated such as,

Functional Management – II MS University - DDCE
40
Lead Time: Lead time is the time normally taken in receiving delivery after placing orders
with suppliers. The time taken in processing the order and then executing it is known as lead
time.
Safety Stock: Safety stock implies extra inventories that can be drawn down when actual
lead time and/ or usage rates are greater than expected. Safety stocks are determined by
opportunity cost and carrying cost of inventories. If the business concerns maintain low level
of safety stock, it will lead to larger opportunity cost and the larger quantity of safety stock
involves higher carrying costs.
4.6 ECONOMIC ORDER QUANTITY (EOQ)
EOQ refers to the level of inventory at which the total cost of inventory comprising ordering
cost and carrying cost. Determining an optimum level involves two types of cost such as
ordering cost and carrying cost. The EOQ is that inventory level that minimizes the total of
ordering of carrying cost.
EOQ can be calculated with the help of the mathematical formula:
Where,
a = Annual usage of inventories (units)
b = Buying cost per order
c = Carrying cost per unit

Functional Management – II MS University - DDCE
41
Exercise 1
(a) Find out the economic order quantity and the number of orders per year from the
following information:
Annual consumption: 36,000 units
Purchase price per units: Rs. 54
Ordering cost per order: Rs. 150
Inventory carrying cost is 20% of the average inventory.
QUESTIONS FOR DISCUSSION
1. What is receivable management
2. What is inventory management
3. Explain the techniques of inventory management

Functional Management – II MS University - DDCE
42
LESSON -5
LESSON – 5
5.0 FINANCIAL PLANNING
Financial planning is about planning and organizing the future business activities of a firm.
Planning is the managerial function that involves the selection, from amongst the various
alternatives of future objectives, procedures, policies and programs.10
Financial planning
determines the direction for future growth of the business. It helps to establish the basic
premises for fund procurement and utilization for value creation. Effective financial planning
helps to establish future business plans for the firm like expansion, diversification or
restructuring, etc.
Financial planning is a predetermination of ―future course of action‖ and encompasses the
following activities:
Translating the mission, vision and objectives of the firm into quantifiable,
measurable terms.
Predetermine the policies and functional structures of the firm for attainment of its
objectives.
Laying down the detailed procedures, guidelines and the activities to be pursued for
moving the firm in the desired direction.
CONTENTS
5.0 Financial planning
5.1 Steps in financial planning
5.2 tools of financial planning
5.3 Limitations of financial planning
5.4 Financial statements
5.5 Financial statement generally consist of two important statements

Functional Management – II MS University - DDCE
43
Financial planning lays down the realistic financial goals and, further, establishes the
financial policies and procedures to attain these goals. Financial planning is all about long-
term investment decisions, budgeting, financial decisions and cost benefit analysis of a
firm.
5.1 STEPS IN FINANCIAL PLANNING
The following are the steps in financial planning:
1. Setting the financial goals: Financial planning starts with establishing the financial
goals for the overall firm and the various departments like cost reduction,
increasing market share by 5 per cent and so on.
2. Establishing the financial policies related to various financial activities: Once the
feasible and realistic target financial goals are set, the firm is all set to lay down
policies regarding the various activities and course of action to be pursued to
achieve the set targets.
3. Establishing the financial procedures for attainment of financial goals: The next
step is to establish the financial procedures to be undertaken to attain the financial
goals.
4. Monitoring the financial plan: Once the plan is implemented, the firm needs to
monitor the progress. Both online monitoring as well as post-activity monitoring
are beneficial to control any deviations.
5.2 TOOLS OF FINANCIAL PLANNING
Financial planning includes various tools that can be used for financial analysis; some of
them are as follows:
Financial statements: Financial statements such as the forecasted balance sheet, the
statement of income and the cash flow statement assist in the financial planning of a
firm.
Ratio analysis: A tool that helps investors, analysts and management to evaluate the
business performance and compare it with its competitors, for a single year period or
series of years.
Cost–volume–profit (CVP) analysis: CVP analysis establishes the relationship
among the costs incurred, volume produced and profits generated by the firm. The

Functional Management – II MS University - DDCE
44
CVP uses the concept of break-even point to ascertain the desired profits, target sales
and margin of safety for the firm.
Budgeting: Budgeting involves forecasting future fund requirement for different
activities of the firm. This helps the fund raising process of the firm.
5.3 LIMITATIONS OF FINANCIAL PLANNING
The limitations of financial planning are as follows:
The future is uncertain: The financial plan is all about achieving the future
objectives. The plan envisages the underlying premises that form the base for
laying down the financial plan. However, it is important to understand that these
assumptions are forecasts for future; and future is uncertain.
Problems with information use: Not all firms are able to make effective use of
available information. Many a time, relevant information is not available or
accessible; and sometimes, relevant information is not available at the right time.
With such information asymmetries, problems may arise in the implementation of
the financial plan.
Flexibility of the management: The management has to be flexible enough to
incorporate changes that occur with the passage of time. No financial plan can be
rigid and static. There is a need to have a flexible approach while dealing with the
implementation of any financial plan.
Dispute amongst the management: There should be harmony and coordination
amongst the various goals and objectives of the various departments of the firm. In
case dispute arises amongst the different divisions and departments, they may be
vis-à-vis the implementation of the financial plan and its outcome.
Lack of feed-forward control mechanism: A feed forward control mechanism is
similar to online monitoring. Absence of feed forward control system affects the
implementation of the financial plan negatively.
5.4 FINANCIAL STATEMENT:
INTRODUCTION: A financial statement is an official document of the firm, which
explores the entire financial information of the firm. The main aim of the financial statement

Functional Management – II MS University - DDCE
45
is to provide information and understand the financial aspects of the firm. Hence, preparation
of the financial statement is important as much as the financial decisions.
MEANING AND DEFINITION: According to Hamptors John, the financial statement is an
organized collection of data according to logical and consistent accounting procedures. Its
purpose is to convey an understanding of financial aspects of a business firm. It may show a
position at a moment of time as in the case of a balance-sheet or may reveal a service of
activities over a given period of time, as in the case of an income statement. Financial
statements are the summary of the accounting process, which provides useful information to
both internal and external parties.
John N. Nyer also defines it ―Financial statements provide a summary of the accounting of a
business enterprise, the balance-sheet reflecting the assets, liabilities and capital as on a
certain data and the income statement showing the results of operations during a certain
period‖.
5.5 FINANCIAL STATEMENTS GENERALLY CONSIST OF TWO IMPORTANT
STATEMENTS
(i) The income statement or profit and loss account.
(ii) Balance sheet or the position statement.
A part from that, the business concern also prepares some of the other parts of statements,
which are very useful to the internal purpose such as:
(i) Statement of changes in owner‘s equity.
(ii) Statement of changes in financial position.
Financial Statement
Income Statement Position Statement
Statement of changes in Owner's Equity
Statement of changes in Financial Position
Income Statement Income statement is also called as profit and loss account, which reflects
the operational position of the firm during a particular period. Normally it consists of one
accounting year. It determines the entire operational performance of the concern like total
revenue generated and expenses incurred for earning that revenue. Income statement helps to

Functional Management – II MS University - DDCE
46
ascertain the gross profit and net profit of the concern. Gross profit is determined by
preparation of trading or manufacturing a/c and net profit is determined by preparation of
profit and loss account.
Position Statement Position statement is also called as balance sheet, which reflects the
financial position of the firm at the end of the financial year. Position statement helps to
ascertain and understand the total assets, liabilities and capital of the firm. One can
understand the strength and weakness of the concern with the help of the position statement.
Statement of Changes in Owner’s Equity It is also called as statement of retained earnings.
This statement provides information about the changes or position of owner‘s equity in the
company. How the retained earnings are employed in the business concern. Nowadays,
preparation of this statement is not popular and nobody is going to prepare the separate
statement of changes in owner‘s equity.
Statement of Changes in Financial Position Income statement and position statement
shows only about the position of the finance, hence it can‘t measure the actual position of the
financial statement. Statement of changes in financial position helps to understand the
changes in financial position from one period to another period. Statement of changes in
financial position involves two important areas such as fund flow statement which involves
the changes in working capital position and cash flow Statement which involves the changes
in cash position.
QUESTIONS FOR DISCUSSION
1. What is financial planning
2. Explain the tools for financial planning
3. Discuss the financial statement analysis

Functional Management – II MS University - DDCE
47
LESSON - 6
6.0 FINANCIAL STATEMENT ANALYSIS
Analysis of Financial Statement is also necessary to understand the financial positions during
a particular period. According to Myres, ―Financial statement analysis is largely a study of
the relationship among the various financial factors in a business as disclosed by a single set
of statements and a study of the trend of these factors as shown in a series of statements‖.
Analysis of financial statement may be broadly classified into two important types on the
basis of material used and methods of operations.
6.1 TYPES OF FINANCIAL ANALYSIS
On the basis of Materials Used
On the basis of Methods of Operations
External Analysis
Internal Analysis
Horizontal Analysis
Vertical Analysis
6.2 TYPES OF FINANCAIL STATEMENT ANALYSIS
1. Based on Material Used Based on the material used, financial statement analysis may be
classified into two major types such as External analysis and internal analysis.
CONTENTS
6.0 Financial statements analysis
6.1 Types of financial analysis
6.2 Types of financial statement analysis
6.3 Techniques of financial statement analysis
6.4 Leverages
6.5 Working capital leverage
6.6 Break even analysis

Functional Management – II MS University - DDCE
48
a) External Analysis Outsiders of the business concern do normally external analyses
but they are indirectly involved in the business concern such as investors, creditors,
government organizations and other credit agencies. External analysis is very much
useful to understand the financial and operational position of the business concern.
External analysis mainly depends on the published financial statement of the concern.
This analysis provides only limited information about the business concern.
b) Internal Analysis The company itself does disclose some of the valuable
information‘s to the business concern in this type of analysis. This analysis is used to
understand 14 Financial Management the operational performances of each and every
department and unit of the business concern. Internal analysis helps to take decisions
regarding achieving the goals of the business concern.
2. Based on Method of Operation Based on the methods of operation, financial statement
analysis may be classified in to two major types such as horizontal analysis and vertical
analysis.
a. Horizontal Analysis: Under the horizontal analysis, financial statements are
compared with several years and based on that, a firm may take decisions. Normally,
the current year‘s figures are compared with the base year (base year is consider as
100) and how the financial information are changed from one year to another. This
analysis is also called as dynamic analysis.
b. Vertical Analysis: Under the vertical analysis, financial statements measure the
quantities relationship of the various items in the financial statement on a particular
period. It is also called asstatic analysis, because, this analysis helps to determine the
relationship with various items appeared in the financial statement. For example, a
sale is assumed as 100 and other items are converted into sales figures.
6.3 TECHNIQUES OF FINANCIAL STATEMENT ANALYSIS
Financial statement analysis is interpreted mainly to determine the financial and operational
performance of the business concern. A number of methods or techniques are used to
Analyze the financial statement of the business concern. The following are the common
methods or techniques, which are widely used by the business concern.
Techniques
Ratio Analysis
Comparative Statement

Functional Management – II MS University - DDCE
49
Trend Analysis
Cash Flow Statement
Funds Flow Statement
Common Size Analysis
Techniques of Financial Statement Analysis
1. Comparative Statement Analysis
a. Comparative Income Statement Analysis
b. Comparative Position Statement Analysis
2. Trend Analysis
3. Common Size Analysis
4. Fund Flow Statement
5. Cash Flow Statement
6. Ratio Analysis
Comparative Statement Analysis Comparative statement analysis is an analysis of financial
statement at different period of time. This statement helps to understand the comparative
position of financial and operational performance at different period of time. Comparative
financial statements again classified into two major parts such as comparative balance sheet
analysis and comparative profit and loss account analysis.
Comparative Balance Sheet Analysis Comparative balance sheet analysis concentrates only
the balance sheet of the concern at different period of time. Under this analysis the balance
sheets are compared with previous year‘s figures or one-year balance sheet figures are
compared with other years. Comparative balance sheet analysis may be horizontal or vertical
basis. This type of analysis helps to understand the real financial position of the concern as
well as how the assets, liabilities and capitals are placed during a particular period.
Comparative Profit and Loss Account Analysis Another comparative financial statement
analysis is comparative profit and loss account analysis. Under this analysis, only profit and
loss account is taken to compare with previous year‘s figure or compare within the statement.
This analysis helps to understand the operational performance of the business concern in a
given period. It may be analyzed on horizontal basis or vertical basis.

Functional Management – II MS University - DDCE
50
Trend Analysis The financial statements may be analyzed by computing trends of series of
information. It may be upward or downward directions which involve the percentage
relationship of each and every item of the statement with the common value of 100%. Trend
analysis helps to understand the trend relationship with various items, which appear in the
financial statements. These percentages may also be taken as index number showing relative
changes in the financial information resulting with the various period of time. In this analysis,
only major items are considered for calculating the trend percentage.
Common Size Analysis Another important financial statement analysis techniques are
common size analysis in which figures reported are converted into percentage to some
common base. In the balance sheet the total assets figures is assumed to be 100 and all
figures are expressed as a percentage of this total. It is one of the simplest methods of
financial statement analysis, which reflects the relationship of each and every item with the
base value of 100%.
FUNDS FLOW STATEMENT Funds flow statement is one of the important tools, which is
used in many ways. It helps to understand the changes in the financial position of a business
enterprise between the beginning and ending financial statement dates. It is also called as
statement of sources and uses of funds. Institute of Cost and Works Accounts of India, funds
flow statement is defined as ―a statement prospective or retrospective, setting out the sources
and application of the funds of an enterprise. The purpose of the statement is to indicate
clearly the requirement of funds and how they are proposed to be raised and the efficient
utilization and application of the same‖.
CASH FLOW STATEMENT Cash flow statement is a statement which shows the sources
of cash inflow and uses of cash out-flow of the business concern during a particular period of
time. It is the statement, which involves only short-term financial position of the business
concern. Cash flow statement provides a summary of operating, investment and financing
cash flows and reconciles them with changes in its cash and cash equivalents such as
marketable securities. Institute of Chartered Accountants of India issued the Accounting
Standard (AS-3) related to the preparation of cash flow statement in 1998.
RATIO ANALYSIS Ratio analysis is a commonly used tool of financial statement analysis.
Ratio is a mathematical relationship between one numbers to another number. Ratio is used

Functional Management – II MS University - DDCE
51
as an index for evaluating the financial performance of the business concern. An accounting
ratio shows the mathematical relationship between two figures, which have meaningful
relation with each other. Ratio can be classified into various types. Classification from the
point of view of financial management is as follows:
● Liquidity Ratio
● Activity Ratio
● Solvency Ratio
● Profitability Ratio
Liquidity Ratio It is also called as short-term ratio. This ratio helps to understand the
liquidity in a business which is the potential ability to meet current obligations. This ratio
expresses the relationship between current assets and current assets of the business concern
during a particular period.
Activity Ratio It is also called as turnover ratio. This ratio measures the efficiency of the
current assets and liabilities in the business concern during a particular period. This ratio is
helpful to understand the performance of the business concern.
6.4 LEVERAGES
INTRODUCTION Financial decision is one of the integral and important parts of financial
management in any kind of business concern. A sound financial decision must consider the
board coverage of the financial mix (Capital Structure), total amount of capital
(capitalization) and cost of capital (Ko). Capital structure is one of the significant things for
the management, since it influences the debt equity mix of the business concern, which
affects the shareholder‘s return and risk. Hence, deciding the debt-equity mix plays a major
role in the part of the value of the company and market value of the shares. The debt equity
mix of the company can be examined with the help of leverage.
Meaning of Leverage The term leverage refers to an increased means of accomplishing
some purpose. Leverage is used to lifting heavy objects, which may not be otherwise
possible. In the financial point of view, leverage refers to furnish the ability to use fixed cost
assets or funds to increasethe return to its shareholders.

Functional Management – II MS University - DDCE
52
Definition of Leverage
James Horne has defined leverage as, ―the employment of an asset or fund for which the
firm pays a fixed cost or fixed return.
6.5 TYPES OF LEVERAGE
Leverage can be classified into three major headings according to the nature of the finance
mix of the company.
Leverage
Financial Leverage Operating Leverage
The company may use finance or leverage or operating leverage, to increase the EBIT and
EPS.
FINANCIAL LEVERAGE: Leverage activities with financing activities are called financial
leverage. Financial leverage represents the relationship between the company‘s earnings
before interest and taxes (EBIT) or operating profit and the earning available to equity
shareholders. Financial leverage is defined as ―the ability of a firm to use fixed financial
charges to magnify the effects of changes in EBIT on the earnings per share‖. It involves the
use of funds obtained at a fixed cost in the hope of increasing the return to the shareholders.
―The use of long-term fixed interest bearing debt and preference share capital along with
share capital is called financial leverage or trading on equity‖. Financial leverage may be
favorable or unfavorable depends upon the use of fixed cost funds. Favourable financial
leverage occurs when the company earns more on the assets purchased with the funds, then
the fixed cost of their use. Hence, it is also called as positive financial leverage. Unfavourable
financial leverage occurs when the company does not earn as much as the funds cost. Hence,
it is also called as negative financial leverage.
OPERATING LEVERAGE: The leverage associated with investment activities is called as
operating leverage. It is caused due to fixed operating expenses in the company. Operating
leverage may be defined as the company‘s ability to use fixed operating costs to magnify the
effects of changes in sales on its earnings before interest and taxes. Operating leverage
consists of two important costs viz., fixed cost and variable cost. When the company is said

Functional Management – II MS University - DDCE
53
to have a high degree of operating leverage if it employs a great amount of fixed cost and
smaller amount of variable Cost. Thus, the degree of operating leverage depends upon the
amount of various costs Structure. Operating leverage can be determined with the help of a
break even analysis.
6.5 WORKING CAPITAL LEVERAGE
One of the new models of leverage is working capital leverage which is used to locate the
investment in working capital or current assets in the company. Working capital leverage
measures the sensitivity of return in investment of charges in the level of current assets.
6.6 BREAK EVEN ANALYSIS
Break-even analysis is used as an important planning and controlling technique. Breakeven
charts and break-even analysis have become widespread and known within no time and they
are extensively employed by executives in organisations, investment agencies, labour unions,
and government agencies. Break-even analysis has become useful in price determination and
expense control in several organisations.
According to Joel Dean, "break analysis produces flexible projections of the impact of the
output rate upon expenses receipts, and profits assuming other things equal. In this way; it
provides an important bridge between business behaviour and theory of firm.
QUESTIONS FOR DISCUSSION
1. Explain the types techniques of financial statement analysis
2. Discuss the types of leverage
3. What is break even analysis

Functional Management – II MS University - DDCE
54
LESSON – 7
7.0 PRODUCTION AND OPERATIONS MANAGEMENT
INTRODUCTION
Production/operations management is the process, which combines and transforms various
resources used in the production/operations subsystem of the organization into value added
product/services in a controlled manner as per the policies of the organization. Therefore, it is
that part of an organization, which is concerned with the transformation of a range of inputs
into the required (products/services) having the requisite quality lev
The set of interrelated management activities, which are involved in manufacturing certain
products, is called as production management. If the same concept is extended to services
management, then the corresponding set of management activities is called as operations
management.
PRODUCTION MANAGEMENT
Production management is a process of planning, organizing, directing and controlling the
activities of the production function. It combines and transforms various resources used in the
production subsystem of the organization into value added product in a controlled manner as
per the policies of the organization.
E.S. Buffa defines production management as, ―Production management deals with decision
making related to production processes so that the resulting goods or services are produced
CONTENTS
7.0 Production and operations management
7.1 Operations management
7.2 Scope of production and operation management
7.3 Layout
7.4 Layout types
7.5 Layout design

Functional Management – II MS University - DDCE
55
according to specifications, in the amount and by the schedule demanded and out of
minimum cost.‖
7.1 OPERATIONS MANAGEMENT
Managing operations can be enclosed in a frame of general management function as shn in
Operation managers are concerned with planning, organizing, and controlling the activities
which affect human behaviour through models.
PLANNING: Activities that establishes a course of action and guide future decision-making
is planning. The operations manager defines the objectives for the operations subsystem of
the organization, and the policies, and procedures for achieving the objectives. This stage
includes clarifying the role and focus of operations in the organization‘s overall strategy. It
also involves product planning, facility designing and using the conversion process.
ORGANIZING: Activities that establishes a structure of tasks and authority. Operation
managers establish a structure of roles and the flow of information within the operations
subsystem. They determine the activities required to achieve the goals and assign authority
and responsibility for carrying them out.
CONTROLLING: Activities that assure the actual performance in accordance with planned
performance. To ensure that the plans for the operations subsystems are accomplished, the
operations manager must exercise control by measuring actual outputs and comparing them
to planned operations management. Controlling costs, quality, and schedules are the
important functions here.
BEHAVIOUR: Operation managers are concerned with how their efforts to plan, organize,
and control affect human behaviour. They also want to know how the behaviour of
subordinates can affect management‘s planning, organizing, and controlling actions. Their
interest lies in decision-making behaviour.
MODELS
As operation managers plan, organize, and control the conversion process, they encounter
many problems and must make many decisions. They can simplify their difficulties using
models like aggregate planning models for examining how best to use existing capacity in
short-term, break even analysis to identify break even volumes, linear programming and
computer simulation for capacity utilization, decision tree analysis for long-term capacity

Functional Management – II MS University - DDCE
56
problem of facility expansion, simple median model for determining best locations of
facilities etc.
7.2 SCOPE OF PRODUCTION AND OPERATIONS MANAGEMENT
Production and operations management concern with the conversion of inputs into outputs,
using physical resources, so as to provide the desired utilities to the customer while meeting
the other organizational objectives of effectiveness, efficiency and adoptability. It
distinguishes itself from other functions such as personnel, marketing, finance, etc., by its
primary concern for ‗conversion by using physical resources.‘ Following are the activities
which are listed under production and operations management functions:
1. Location of facilities
2. Plant layouts and material handling
3. Product design
4. Process design
5. Production and planning control
6. Quality control
7. Materials management
8. Maintenance management.
LOCATION OF FACILITIES: Location of facilities for operations is a long-term capacity
decision which involves a long term commitment about the geographically static factors that
affect a business organization. It is an important strategic level decision-making for an
organization. It deals with the questions such as ‗where our main operations should be
based?‘ The selection of location is a key-decision as large investment is made in building
plant and machinery. An improper location of plant may lead to waste of all the investments
made in plant and machinery equipments. Hence, location of plant should be based on the
company‘s expansion plan and policy, diversification plan for the products, changing sources
of raw materials and many factors. The purpose of the location study is to find the optimal
location that will results in the greatest advantage to the organization.
7.2 ECONOMIC BATCH QUANTITY
Economic batch quantity (EBQ), also called "optimal batch quantity" or economic production
quantity, is a measure used to determine the quantity of units that can be produced at
minimum average costs in a given batch or production run. Economic Production Quantity

Functional Management – II MS University - DDCE
57
model (also known as the EPQ model) is an extension of the Economic Order Quantity
model. The Economic Batch Quantity model, or production lot-size model, is similar to the
EOQ model in that an optimum is to be calculated for the batch quantity to be produced.
In working with this EBQ model, principal assumptions are:
The demand (D) is known and constant within a certain period of time.
The unit cost of the inventory item (U) is constant.
The annual holding-cost per unit (Ch) is constant.
The setup-cost per batch (C) is constant.
The production time (tp) is known and constant.
There is one kind of product.
There is no interaction with other products.
The aspect of time does not play a role, just the setup time does.
The setup cost is constant and does not act upon the batch quantity.
Variables
K = setup cost
D = demand rate
F = holding cost
T = cycle length
P = production rate
Formula:
7.3 LAYOUT
For many people the issues of layout and flow are the most important within the general area
design in operations management. This is because the way facilities are positioned relative to
each other has an important effect on so many aspects of operations. First, it affects the total
distance travelled by materials, information or customers as they move through the operation.
Generally, layouts try and minimize distance travelled. Second, layout can affect quality. If
materials or information or customers are continually being passed from one part of the
operation to another there will be many points at which damage (or annoyance) can occur.
Third, layout will affect throughput time. The further the distance travelled, the longer it
takes to get through the operation. Fourth, layout can affect how much space is necessary for

Functional Management – II MS University - DDCE
58
the operation. Space costs money. Consider a financial services operation in a high cost
location such London. Every square meter is important so a compact layout can save costs.
7.4 BASIC LAYOUT TYPES
The chapter describes four basic layout types. Remember though, at the end of doing this the
chapter does make the point that most layout types are hybrids of two or more of these four
basic types. Nevertheless it is important to understand each of them so that their advantages
and disadvantages can be identified.
Fixed position layout: Unusually, in a fixed position layout the resources travel to the
product or customer rather than the other way round. Several examples are mentioned in the
text. An additional one is the production of movies. Most movies are shot in a studio and on
location. In both cases resources centre around a fixed position (the studio set or the
location). This is because moving the actors, technicians, cameras etc. to the set or location is
considerably easier than the other way round.
Process layout: Process layouts are sometimes called functional layouts because the
transforming resources with the same, or similar, function are grouped together. ‗Products‘
with different requirements move between the clusters of transforming resources in different
ways. This makes this kind of layout particularly flexible. It can usually cope with a wide
variety of different processing requirements. However, it is complex to manage with flows
crossing each other and moving on irregular and intermittent paths.
Cell layout: Primarily this type of layout is an attempt to reduce the complexity of process
layouts. It divides transforming resource up into small clusters which can be used to act upon
different products or product groups. Within each cell layout can be almost identical to
product layout (treated next).
Product layout: Here the transforming resources are arranged for the convenience of product
flow. It is the processing requirements of a particular product or service which dictates
exactly where and in what order facilities are located. The classic image of the assembly line
is typical of how we think of product layouts. In fact this type of layout is also common in
many service industries, especially the ‗back office‘ of services such as banks and insurance
companies.

Functional Management – II MS University - DDCE
59
7.5 DETAILED LAYOUT DESIGN
Several techniques are described in the chapter. It is not worth repeating those here but it is
worth making one important point. Most techniques are inevitably simplifications. They are
intended to provide the underlying principles which help in putting a layout together. In
practice, there are nearly always more considerations than those which can be included in a
particular technique. For example, considerations of safety will always need to be included in
layout decisions but often these are brought into the decision making process after an initial
layout has been suggested by using one of the techniques. This suggested layout is then
modified to ensure full compliance with safety considerations.
QUESTIONS FOR DISCUSSION
1. What is layout
2. What is economic order quantity
3. Explain the types of layout

Functional Management – II MS University - DDCE
60
LESSON – 8
8.0 CAPACITY PLANNING
Capacity Planning: The production system design planning considers input requirements,
conversion process and output. After considering the forecast and long-term planning
organization should undertake capacity planning.
Capacity is defined as the ability to achieve, store or produce. For an organization, capacity
would be the ability of a given system to produce output within the specific time period. In
operations, management capacity is referred as an amount of the input resources available to
produce relative output over period of time.
In general, terms capacity is referred as maximum production capacity, which can be attained
within a normal working schedule.
Capacity planning is essential to be determining optimum utilization of resource and plays an
important role decision-making process, for example, extension of existing operations,
modification to product lines, starting new products, etc.
1. Strategic Capacity Planning: A technique used to identify and measure overall
capacity of production is referred to as strategic capacity planning. Strategic capacity
planning is utilized for capital intensive resource like plant, machinery, labor, etc.
Strategic capacity planning is essential as it helps the organization in meeting the
future requirements of the organization. Planning ensures that operating cost are
CONTENTS
8.0 CAPACITY PLANNING
8.1 PROCESS PLANNING
8.2 ECONOMIC BATCH QUANTITY(EBQ)

Functional Management – II MS University - DDCE
61
maintained at a minimum possible level without affecting the quality. It ensures the
organization remain competitive and can achieve the long-term growth plan.
2. Capacity Planning Classification: Capacity planning based on the timeline is
classified into three main categories long range, medium range and short range.
1. Long Term Capacity: Long range capacity of an organization is dependent on various
other capacities like design capacity, production capacity, sustainable capacity and effective
capacity.
a. Design capacity is the maximum output possible as indicated by equipment
manufacturer under ideal working condition.
b. Production capacity is the maximum output possible from equipment under normal
working condition or day.
c. Sustainable capacity is the maximum production level achievable in realistic work
condition and considering normal machine breakdown, maintenance, etc.
d. Effective capacity is the optimum production level under pre-defined job and work-
schedules, normal machine breakdown, maintenance, etc.
2. Medium Term Capacity: The strategic capacity planning undertaken by organization for
2 to 3 years of a time frame is referred to as medium term capacity planning.
3. Short Term Capacity: The strategic planning undertaken by organization for a daily
weekly or quarterly time frame is referred to as short term capacity planning.
Goal of Capacity Planning: The ultimate goal of capacity planning is to meet the current
and future level of the requirement at a minimal wastage. The three types of capacity
planning based on goal are lead capacity planning, lag strategy planning and match strategy
planning.
8.1 PROCESS PLANNING
Process Planning: A process is a set of steps that result in a specific outcome. For example,
a customer service request might have the following steps:
Customer requests service:
Service department enters request into a tracking system
The request is routed to the repair department

Functional Management – II MS University - DDCE
62
A repair technician is assigned to evaluate the request and to respond to the customer
A technician is dispatched, if appropriate
Once the response is made, a survey is sent to the customer to confirm their issue was
resolved
In this case, the process is response to customer service request, and the outcome is resolution
of the customer's problem.
Goal of Process Planning: The goal of process planning is to improve and streamline the
business methods of a company. This would have results like:
Lower costs, due to fewer staff needed to complete the same process
Higher efficiency, by eliminating problematic process steps like loops and bottlenecks
Higher accuracy, by including checkpoints and success measures to make sure
process steps are completed accurately
Greater understanding by all staff of what they need to do to meet their department
objectives
Principles of Process Planning: Here are some general principles to keep in mind when
evaluating or improving processes:
First, define the outputs, and then look toward the inputs needed to achieve those
outputs.
Define the goals of the process and evaluate them regularly to make sure they are still
appropriate. This would include specific measures like quality scores and turnaround
times.
When mapped, the process should appear as a logical flow, without loops back to
earlier steps or departments.
Any step performed needs to be included in the documentation. If not, it should be
eliminated or documented, depending on whether or not it's necessary to the process.
People involved in the process should be consulted, because they often have the most
current information on what works and what does not.
Steps to Plan a Process: Process planning involves the definition, documentation, review
and improvement of steps in business processes used at a company. Each of these steps will
be described below.

Functional Management – II MS University - DDCE
63
1. Goal setting: Now whenever we plan something we have some goal in our mind that
we have to achieve or something that we want to do. These are called goals or targets.
In organizations also there are some goals around which the efforts of the managers
and executives revolves. These goals should be clear and measurable so that the
efforts made against those goals should be evaluated easily. Goals should not be rigid
that is they should be flexible and can be modified, if needed. More, the goals should
be information and self motivating so that the executives and the managers should not
feel fallen into a rigid process.
2. Identify available resources: Once the goals are set the next step is to identify the
available resources in the organization to analyze whether the available resources are
enough or its need to have some more. Analyzing available resources means to take
into account all the resources including monetary resources, sales people, technical
resources, etc. This helps managers to make necessary arrangements for future needs,
so that the required resources should be available when needed.
3. Creating steps and strategies: Now the next step comes with thinking in a practical
way as to what will be the steps to do a particular task. For example, if the sales plans
are to be made then the steps and strategies will include as to how to approach a
particular client/customer, what should be proposed to him first and in what manner,
there should be some alternative strategies too keeping in mind the future scenario.
Also whatever the strategies will be, they should be discussed well with the
executives or with the team that will be assigned that particular tasks.
4. Review meetings: Regular review meetings should be planned so as to check whether
the plans are carried effectively. This also helps to managers to achieve their goals in
time. Further the executives and the team is also aware that they are held responsible
for the tasks that are assigned to them. This provides better level of control to the
managers and the top management.
5. Implement necessary steps: If needed he managers may require changing the steps
or strategies to accomplish their goals. These can be the alternative course of action or
can be the solution to the present problems.
Planning process though can never be the same in all the organization. It also depends on the
organization/team size as with the small teams the risk factor can be higher as they need to do
their tasks in very effective way with limited resources.

Functional Management – II MS University - DDCE
64
8.2 ECONOMIC BATCH QUANTITY(EBQ)
Definitions: Economic Batch Quantity (EBQ), also known as the optimum production
quantity (EPQ), is the order size of a production batch that minimizes the total cost.
Batch production is a technique which is commonly used today for distributing the total
production in a series of small batches rather than mass producing in one go. Sometimes the
production of goods in batches is necessary because, for example, certain equipment used in
manufacturing (e.g. dyes) may wear out and need replacement before the production can run
again.
Batch production may be desirable in other cases as well. For example, where the objects
being produced are perishable, the entire production requirement for say a year can‘t be
manufactured in a week as it might cause the goods to expire after some time. Batch
production also reduces the risk of obsolescence as any minor changes required in the
specification of goods (e.g. size, color, etc.) can be made in future batches according to the
feedback received from customers or retailers instead of producing everything in one go and
hoping for the best.
Whereas EOQ is suitable for determining the order size when the parts, materials or finished
goods are ready to be delivered by external suppliers when the order is placed, EBQ is used
to determine the size of a production run (i.e. batch size) when the manufacturing takes place
internally and any raw materials or parts required for production are either acquired internally
or are supplied incrementally by other companies according to the production requirement.
Formula:
Economic Batch Quantity = √(2 x Cs x D)/Ch(1 - D/P)
Where:
Cs is the setup cost of a batch
D is the annual demand
P is the annual production capacity
Ch is the annual cost of holding one unit of finished inventory
The formula for calculating EBQ is very similar to EOQ with one notable difference in the
denominator. The cost of holding in EBQ formula is decreased by the amount of inventory

Functional Management – II MS University - DDCE
65
that will be produced and sold on the same day therefore not contributing to the annual cost
of holding the inventory.
Example: Sarah owns and operates a small factory that manufactures plastic bottles which
she sells to bottling companies.
Additional information:
Annual demand is 1 million bottles spread evenly over the year
Setup cost is $5000 per batch
Holding cost is $3 per annum for each bottle
Maximum production capacity is 2 million bottles per annum
Currently, bottles are manufactured in 10 batches
A. Find the optimum production quantity that Sarah should produce to minimize her costs
B. Calculate the current annual holding cost and setup cost
C. Calculate the savings to Sarah if she adopts the EBQ
Solution A: Optimum Production Quantity
Economic Batch Quantity
= √ (2 x Cs x D)/ Ch(1 - D/P)
= √ (2 × 5000× 1,000,000)/3 x (1-(1,000,000/2,000,000))
= √ (10,000,000,000)/1.5
= 6,666,666,666
= 81,650
Sarah should manufacture bottles in batches of 81,650 units.
Solution B: Current Costs
Batch Quantity = Annual Demand ÷ Number of batches
= 1,000,000 ÷ 10
= 100,000 units
Annual Holding Cost = (Batch Quantity/2) × Ch × (1- D/P)
= (100,000/2) × 3 × (1-(1,000,000/2,000,000))
= $75,000
Setup Cost = Number of setups × setup cost
= 10 × 5000
= $50,000

Functional Management – II MS University - DDCE
66
Total Current Cost = ($75,000 + $50,000) = $125,000
Solution C: Savings from EBQ
Annual Holding Cost:
= (Batch Quantity/2) × Ch × (1- D/P)
= (81,650/2) × 3 × (1-(1,000,000/2,000,000))
= $61,238 (A)
Setup Cost:
Number of batches = 1,000,000 ÷ 81,650 = 12.2475
Setup Cost = Number of batches × Cost of setup
= 12.2475 × $5000 = $61,23 (B)
Total Cost (EBQ) = (A) + (B) = $122,476 (C)
Total Current Cost = 125,000 (D)
Savings = (D) - (C) = 2,524

Functional Management – II MS University - DDCE
67
LESSON - 9
9.0 PRODUCTION PLANNING AND CONTROL
Production: It is an organized activity of converting raw materials into useful products. But
before starting the actual production, production planning is done to anticipate possible
difficulties and to decide in advance as to how the production process should be carried out in
a best and economical way to satisfy customers. Since only planning of production is not
sufficient, hence management takes all possible steps to see that plans chalked out by
planning department are properly adhered to and the standard set are attained. In order to
achieve it, control over production is exercised. The ultimate aim of production planning and
control (PPC) is to produce the products of right quality in right quantity at the right time by
using the best and least expensive methods.
Production planning and control can thus be defined as:
The process of planning the production in advance.
Setting the exact route of each item.
Fixing the starting and finishing date for each item.
To give production orders to different shops.
To see the progress of products according to order.
Functions of PPC:
1. Forecasting: Estimation of type, quantity and quality of future work.
2. Order writing: Giving authority to one or more persons to undertake a particular job.
3. Product design: Collection of information regarding specification, bill of
materials, drawing, etc.
4. Process planning and routing: Finding the most economical process of doing work
and then deciding how and where the work will be done.
CONTENTS
9.0 PRODUCTION PLANNING AND CONTROL
9.1 SEQUENCING
9.2 STATISICAL TECHNIQUES IN CONTROLLING

Functional Management – II MS University - DDCE
68
5. Material control: It involves determining the material requirement and control of
materials.
6. Tool control: It involves determining the requirement and control of tools used.
7. Loading: Assignment of work to man power and machining etc.
8. Scheduling: It determines when and in what sequence the work will be carried out.
It fixes the starting and finishing time for the job.
9. Dispatching: It is the transition from planning to action phase. In this phase the
worker is ordered to start the actual work.
10. Progress reporting: Data regarding the job progress is collected. It is
interpreted by comparison with the preset level of performance.
11. Corrective action:
a. Expediting means taking action if the progress reporting indicates a deviation
of the plan from the original set target.
b. Replanning of the whole affair becomes essential, in case expediting fails to
bring the deviation plan to its right path.
Objectives of PPC
1. To determine the sequence of operations to continue production.
2. To issue co-ordinated work schedule of production to the supervisor/foreman of
various shops.
3. To plan out the plant capacity to provide sufficient facilities for future
production programme.
4. To maintain sufficient raw materials for continuous production.
5. To follow up production schedule to ensure delivery promises.
6. To evaluate the performance of various shops and individuals.
7. To give authority to right person to do right job.
Aggregate Planning: The aggregate planning concentrates on scheduling production,
personnel and inventory levels during intermediate term planning horizon such as 3-12
months. Aggregate plans act as an interface between strategic decision (which fixes the
operating environment) and short term scheduling and control decision which guides firm‘s
day-to-day operations. Aggregate planning typically focuses on manipulating several aspects
of operations-aggregate production, inventory and personnel levels to minimize costs over

Functional Management – II MS University - DDCE
69
some planning horizon while satisfying demand and policy requirements. In brief the
objectives of AP are to develop plans that are feasible and optimal.
Aggregate planning
Aggregate Production Planning Aggregate Capacity Planning
Aggregate Production Planning indicates the level of output. Aggregate Capacity Planning
keep capacity utilization at desired level and test the feasibility of planned output.
Decision options in Aggregate Planning: The decision options are basically of 2 types:
(i) Modification of demand for a product.
(ii) Modification of supply of a product.
(i) Modification of demand: Demand can be modified in several ways:
(a) Differential pricing: It is often used to reduce the peak demand or to
increase the off period demand. Some examples are: reducing off season
fan/woollen item rate, reducing the hotel rate in off season.
(b) Advertising and promotion: These methods are used to stimulate/smooth out
demand. Advertising is generally so timed as to increase demand during off
period and to shift demand from peak period to he off period.
(c) Backlogs: Through the creation of backlogs, the manufacturers ask customers
to wait for the delivery of products, thereby shifting the demand from peak
period to off period.
(d) Development of complementary products: Producer, who produces products
which are highly seasonal in nature, applies this technique. Ex: Refrigerator
company produce room heater, TV Company produces DVD, etc.
(ii) Modification of supply: There are various methods of modification of supply.
(a) Hiring and lay off employees: The policy varies from company to company.
The man power/work force varies from peak period to slack/off period.
Accordingly, firing/lay off employee is followed without affecting employee
morale.
(b) Overtime and undertime: Overtime and undertime are common options used
in cases of temporary change of demand.
(c) Use of part time or temporary labour: This method is attractive as the payment
of part time/temporary labour is less.
Functional Management – II MS University - DDCE
70
(d) Subcontracting: The subcontractor may supply the entire
product/some of the components needed for the product.
(e) Carrying inventories: It is used by manufacturers who produces items in a
particular season and sell them throughout the year
Aggregate Planning Strategies:
Pure strategy: If the demand and supply is regulated by any one of the following
strategy, i.e.
(a) Utilizing inventory through constant work force.
(b) Varying the size of workforce.
(c) Subcontracting.
(d) Making changes in demand pattern.
Mixed strategy: If the demand and supply is regulated by mixture of the strategies as
mentioned, it is called mixed strategy.
9.1 SEQUENCING
Sequencing: The order in which jobs pass through the machines or work stations is
called sequencing. The relative priorities are based on certain rules as discussed in the
following:
1. First Come, First Served (FCFS) rule: This is a fair approach particularly
applicable to people. In case of inventory management, it is First In First Out
(FIFO). That means the 1st piece of inventory at a storage area is the 1
st one to
be used.
2. The shortest processing time (SPT) rule: SPT rule sequences jobs in
increasing order of their processing times (including set up).
3. The Earliest Due Date (EDD) rule: Sequences jobs in order of their due dates,
earliest first.
4. The critical ratio (CR) rule: Sequences jobs in increasing order of their critical
ratio.
Due date- Today‘s date
CR =
Remaining processing time
If CR>1 The job is ahead of schedule.
If CR<1 The job is behind schedule.

Functional Management – II MS University - DDCE
71
If CR=1 The job is exactly on schedule.
The Slack Time Remaining (STR) rule: It employs that the next job
processed is the one that has the least amount of slack time.
Slack = (Due date – Today‘s date) – Remaining processing time
Sequencing of n jobs through 2 machines (Johnson’s rule) Considering 2 machines
and ‗n‘ jobs as shown in following table
1 t11 t12
2 t21 t22
3 t31 t32
4 t11 t42
. . .
. . .
i ti1 ti2
. . .
n tn1 tn2
Step 1: Find the minimum among ti1 and ti2.
Step 2(a): If the minimum processing time requires m/c-1, place the associated job
in the 1st available position in sequence.
Step 2(b): If the minimum processing time requires machine-2, place the associated
job in the last available position in sequence.
Step 3: Remove the assigned job from the table and return to Step 1 until all
positions in sequence are filled. (Ties may be considered randomly)
The above algorithm is illustrated with the following example.
Ex.1 Consider two machines and six jobs flow shop scheduling problem. Using
Johnson‘s algorithm, obtain the optimal sequence which will minimize the
makespan.
Job Time taken by machines
1 2
1 5 4
2 2 3
3 13 14
4 10 1
5 8 9
6 12 11
Sum 50 42

Functional Management – II MS University - DDCE
72
Solution: The working of the algorithm is summarized in the form of a table which is
shown below.
Stage Unscheduled job Min Assignment Partial sequence/
Full sequence
1 1 2 3 4 5 6 t42 Job 4-[6] × × × × × 4
2 1 2 3 5 6 t21 Job 2-[1] 2 × × × × 4
3 1 3 5 6 t12 Job 1-[5] 2 × × × 1 4
4 3 5 6 t51 Job 5-[2] 2 5 × × 1 4
5 3 6 t62 Job 6-[4] 2 5 × 6 1 4
6 3 t31 Job 3-[3] 2 5 3 6 1 4
Now the optimal sequence is 2-5-3-6-1-4.
The make span is determined as shown below.
Job M/C-1 M/C-1 Idle time on
Time in Time out Time in Time out m/c-2
2 0 2 2 5 2
5 2 10 10 19 5
3 10 23 23 37 4
6 23 35 37 48 0
1 35 40 48 52 0
4 40 50 52 53 0
The make span for this schedule is 53.
Line balancing: Plants having continuous flow process and producing large volume of
standardized components prefer conveyor assembly line. Here the work centres are
sequenced in such a way that at each stage a certain amount of total work is carried out so
that at the end of conveyor line, the final product comes out. This requires careful
preplanning to balance the timing between each work centres so that idle/waiting time is
minimized. This process of internal balancing is called Assembly line balancing.
Line balancing is defined as the procedure for creating work stations and assigning tasks to
them according to a predetermined technological sequence such that the idle time at each
work station is minimized.
In perfect line balancing, each work centre completes its assigned work within a fixed time
duration so that output from all operations are equal on the line. Such a perfect balancing is
difficult to achieve. Certain work station/centre take more operation time causing
subsequent work centre to become idle.

Functional Management – II MS University - DDCE
73
Balancing may be achieved by
Rearrangement of work stations
Adding m/c and or workers at some work stations.
So that all work centres take about the same amount of time.
Some terminologies used in line balancing:
1. Work station: It is a location on the assembly line where specified work is
performed.
2. Cycle time: It is the amount of average time a product spends at one work station
Available time period
Cycle time (CT) =
Total no. of products/output
3. Task : The smallest grouping of work that can be assigned to a work station.
4. Task time: Standard time to perform task.
5. Station time: Total standard time at a particular work station.
A typical example will clarify the procedure of line balancing.
Ex: A company is setting an assembly line to produce 192 units per 8 hour shift. The
information regarding work elements in terms of times and intermediate predecessors
are given below:
Work Time (Sec) Immediate
element predecessor
A 40 None
B 80 A
C 30 D,E,F
D 25 B
E 20 B
F 15 B
G 120 A
H 145 G
I 130 H
J 115 C,I
Total 720
1. What is the desired cycle time?
2. What are the theoretical numbers of stations?

Functional Management – II MS University - DDCE
74
3. Use largest work element time rule to work out a solution on a precedence diagram.
4. What are efficiency and balance delay of the solution obtained?
(a) Cycle time: 8hours/192 units = 150 sec/unit.
(b) Sum of the time of all work elements = 720 secs
(c) So, minimum number of work station = 720/150 = 4.8 = 5 stations.
b) Assignment of work element to stations:
Station/ Elements
Work element
time Cumulative time (Sec) Idle time for
stations (Sec) station (Sec)
S1 A 40 40 05
B 80 120
D 25 145
S2 G 120 120 10
E 20 140
S3 H 145 145 05
S4 I 130 130 05
F 15 145
S5 C 30 30 05
J 115 145
(d) Efficiency: ∑t×100/n×CT = 720×100/5×150 = 96%.
(e) Balance delay = 100-96 = 4%.
Flow control: Flow control applies to the control of continuous production as found in oil
refineries, bottling works, cigarette making factories, paper making mills and other mass
manufacturing plants.
Flow control can be performed through the following:
(a) Operation time: It amounts the time required to manufacture each part, to
make one subassembly and to execute one assembly. This information is
available from the operation sheet.
(b) Line balancing: the assembly line should be balanced. Each work station
should have the more or less same operating time and the various operations
should be sequenced properly.
(c) Control of parts subassemblies and Assembly: A supervisory function
coupled with an appropriate information feedback system keeps a check
whether the small parts arriving in lots and big parts coming continuously are

Functional Management – II MS University - DDCE
75
available at right time, in proper quantities for making subassemblies as per
scheduled plan.
(d) Dispatching: Dispatching is nothing but issuing orders and instructions to start
a particular work which has already been planned under routing and
scheduling.
Functions of Dispatching
(i) Assignment of work to individual man, m/c or work place.
(ii) Release necessary order and production firm.
(iii) Authorize for issue of materials, tools, jigs, fixtures, gauges, dies for various
jobs.
(iv) Required materials are authorized to move from stores or from operation to
operation.
(v) Issue m/c loading and schedule chart, route sheet, etc.
(vi) To fix up the responsibilities of guiding and controlling the materials and
operation processes.
(vii) To issue inspection order.
(viii) Issue of time tickets, drawing, instruction cards.
Dispatch procedure:
The various steps of dispatch procedure for each operation are listed below:
(a) Store issue order: Authorise store department to deliver required material.
(b) Tool order: Authorise tool store to release the necessary tools. The tools can be
collected by the tool room attendant.
(c) Job order: Instruct the worker to proceed with operation.
(d) Time tickets: It records the beginning and ending time of the operation and
forms the basis for workers pay.
(e) Inspection order: Notify the inspectors to carry out necessary inspections and
report the quality of the component.
(f) Move order: Authorise the movement of materials and components for one
facility to another for further operation.
In addition, there are certain dispatch aspects such as:
(1) All production information should be available beforehand.
(2) Various order cards and drawing with specification should be ready.
(3) Equipment should be ready for use.
(4) Progress of various orders should be recorded.

Functional Management – II MS University - DDCE
76
(5) All production records should be on Gantt chart.
Centralized and decentralized dispatching
a) Centralized Dispatching: In centralized dispatching system, a central dispatching
department orders directly to the work stations. It maintains a full record of the
characteristics and capacity of each equipment and work load against each m/c. The
orders are given to the shop supervisor who runs his machine accordingly. In most of
the cases, the supervisor can also give suggestions as regards to loading of m/cs under
him. A centralized system has the following advantages:
i. A greater degree of overall control can be achieved.
ii. Effective coordination between different facilities is possible.
iii. It has greater flexibility.
iv. Because of urgency of orders, changes in the schedule can be made
easily without upsetting the whole system.
v. Progress of orders can be readily assessed at any time because all the
information is available is available at a central place.
vi. There is effective and better utilization of manpower and machines.
b) Decentralized Dispatching: In decentralized dispatching system, the shop supervisor
performs the dispatch function. He/she decides the sequence of handling different
orders. He/she dispatches the orders and materials to each equipment and worker,
and is required to complete the work within the prescribed duration. In case he/she
suspects delay, he/she informs the production control department. A centralized
dispatching system has the following advantages:
(i) Much of red tape (excessive adherence to official rules) is minimized.
(ii) Shop supervisor knows the best about his shop.
(iii) Communication gap is reduced.
(iv) It is easy to solve day to day problem.
Levels of Dispatch office: At plant manager‘s level.
At shop superintendent level.
At shop supervisor‘s level.
At specialist level.

Functional Management – II MS University - DDCE
77
Expediting: Expediting and dispatching are frequently performed under the same
agency, particularly in special project control. An expeditor follows the development of
an order from the raw material stage to the finished product. He/she is often given the
authority and facilities to move materials or semi-finished products to relieve congestion
in production flow.
Gantt chart: HL Gantt has developed a simplified graph which represents/displays the
planned starting and finishing time of each task on a time scale. But it does not show the
interrelationship among the tasks. On the left of the chart is a list of the activities and
along the top is a suitable time scale. Each activity is represented by a bar; the position
and length of the bar reflects the start date, duration and end date of the activity. This
allows you to see at a glance:
What the various activities are
When each activity begins and ends
How long each activity is scheduled to last
Where activities overlap with other activities, and by how much
The start and end date of the whole project
Line of balance (LOB): LOB is a graphical technique used to find out the state of
completion of various processes at a given time for a product. This technique is economical
when the production volume is limited and applied to the production of aircrafts, missiles,
heavy machines, etc.
For drawing the LOB, the following information are required:
Contracted schedule of delivery
Key operations in making the product.
The sequence of key events.
The expected/observed lead time w.r.t. delivery of final product.
Based on above information, a diagram is drawn which compares pictorically the planned
verses actual progress. This is called line of balance (LOB).

Functional Management – II MS University - DDCE
78
Learning curve: From our everyday experience, we know that the first time we perform a
skilled job, it takes much longer time than an experienced worker. But the next time if we
perform the same job, we can perform it not only at faster rate but also with higher quality.
Each additional time we do the same job, we become faster and better in performing. This
improvement in productivity and quality of work as a job is repeated is called quality of
work, as a job is repeated is called learning effect.
Similarly, when the number of units produced increases, the direct labour hours required per
unit decreases for a variety of reasons such as:
(i) Workers become more and more skilled for a particular set of task.
(ii) Improvement in production methods and tooling takes place.
(iii) Improvement in layout and flow takes place and many other reasons.
While designing jobs, estimating work standards, scheduling production and planning
capacity, it is important to know at what rate workers productivity will increase through
learning. For example, if it takes a worker 10 hours to make the first 50 units of product, we
don‘t want to plan on it taking 10 hours for every additional 50 units. Otherwise we will
underestimate our production capacity and overstaff our operations. The role of worker
learning in production, its effect on production costs and ways to measure it were
popularized long ago.
The rate of learning and learning curve: The labour content (in person-hrs per unit)
requires to make a product, expressed as a function of the cumulative number of units made
is called Learning Curve. A typical learning curve is shown below.
We normally express the rate of leraning in terms of how quickly the labour requirement
decrease as we double the cumulative amount of output. We say that an activity exhibits an
x% learning rate or has an x% learning curve, if the amounts of labour required to make the
2nth units of the product is x% of that required to make the nth unit.

Functional Management – II MS University - DDCE
79
Labour
content
90%
learning
(person-
hrs/unit)
0 5 10 15 20 25 30 35
Cumulative no. of unit produced
More generally, the amount of time required to make the nth unit of the product will be
Tn = T1×na
where Tn = Time to make the nth unit.
T1 = Time to make 1st unit.
a = (ln x/ln 2)
x = learning rate (expressed as decimal)
This learning data can also be represented in tabular form.
9.2 STATISICAL TECHNIQUES IN CONTROLLING
Project: A project is an interrelated set of activities that has a definite starting and ending
point and those results in a unique product. That means projects are not repetitive. Few
examples of projects are:
1. Constructing a bridge, dam, highway or building.
2. Producing an airplane, missile or large machine.
3. Introducing a new product.
4. Installing a large computer system.
5. Redesigning the layout of plant or office.
6. Construction of a ship.
7. Fabrication of a steam boiler.
8. Maintenance of major equipments/Plants.

Functional Management – II MS University - DDCE
80
9. Commissioning of a power plant/factory.
10. Conducting National Election.
Basic steps in project management: Managing a project, regardless of its size and
complexity, requires identifying every activity to be undertaken and planning when each
activity must begin and end in order to complete the overall project on time. Typically, all
projects involve the following steps:
1. Describe the project.
2. Develop a network model.
3. Insert time estimates.
4. Analyze the model.
5. Develop the project plan.
6. Periodically assess the progress of the project and repeat steps 2-6 as needed.
Network: A network is the graphical representation of the project activities arranged in a
logical sequence and depicting all the interrelationships among them.
Terminologies used in Network diagram:
1. Activity: An activity means work/job. It is a time consuming process. It is
represented by an arrow in the network diagram (AOA system).
2. Event: An event is a specific instant of time marks the start and end of an
activity.
3. Critical path: It is the sequence of activities which decides the total project
duration.
4. Duration (d): Duration is the estimated or actual time required to complete a
task or an activity.
5. Total project time: Time to complete the project. In other words, it is the
duration of critical path.
6. Earliest start time (E): It is the earliest possible time at which an activity can
start. It is calculated by moving from 1st to last event in the network diagram.
7. Latest start time (Li): It is the latest possible time by which an activity can start.
8. Earliest finish time (Ej): It is the last event time of the head event. It is
calculated by moving backward in the network diagram.
9. Latest finish time (Lj): It is the last event time of the head event. It is calculated
by moving backward in the network diagram.
10. Float/Slack: Slack is with reference to an event and Float is with reference to an
activity.

Functional Management – II MS University - DDCE
81
11. Free float: (Latest Finish Time – Earliest Start Time) – Activity duration.
Rules for Network Construction: The following are the primary needs for constructing
Activity on Arc (AOA) network diagram.
1. The starting event and ending event of an activity are called tail and head event
respectively.
2. The network should have a unique starting node. (tail event)
3. The network should have a unique completion node. (head event)
4. No activity should be represented by more than one are ( ) in the network.
5. No two activities should have the same starting node and same ending node.
6. Dummy activity is an imaginary activity indicating precedence relationship only.
Duration of dummy activity is zero.
7. The length of the arrow bears no relationship to the activity time.
8. The arrow in a network identifies the logical condition of dependence.
9. The direction of arrow indicates the direction of workflow.
10. All networks are constructed logically or based on the principle of dependency.
11. No event can be reached in a project before the completion of precedence activity.
12. Every activity in the network should be completed to reach the objective.
13. No set of activities should form a circular loop.
Time estimation of an activity
If t0 = Optimistic time (i.e. time estimate for fast activity
completion). tp = Pessimistic time (maximum time duration
an activity can take). tm = Most likely time
te = The expected time of an activity = (t0+ 4tm+ tp)/6
The biggest advance in project scheduling since the development of the Gantt chart in
1917 was made between1956-58. During this period, two new scheduling techniques
were developed. These techniques are
(i) Program evaluation and review technique (PERT)
(ii) Critical path method (CPM)

Functional Management – II MS University - DDCE
82
Both are based on the use of a network/graphical model to depict the work tasks being
scheduled. The popularity of network based scheduling can be attributed to its many
benefits, especially its ease use. Other benefits include the following.
1. It provides a visual display of needed task and their temporal ordering, which
makes it easy to see how tasks should be sequenced as shown below. This assists
communication and co-operation among task teams because each team can see how
its work affects other team.
2. It provides a relatively accurate estimate of the time required to complete the
project at the proposed resource level.
3. It identified and highlights the tasks that are critical to keep the project on schedule.
4. It provides a method for evaluating the time-cost tradeoffs resulting from
reallocating resources among tasks.
5. It provides a method for monitoring the project throughout its life cycle. As the
project progresses, PERT/CPM easily identifies change in which tasks are critical
and how the expected completion date is affected.
6. It provides a convenient method for incorporating uncertainty regarding task times
into the schedule and it helps to evaluate the effect of this uncertainty on project
completion time.
Difference between PERT and CPM
S.No. PERT CPM
1
PERT is a probabilistic model with
uncertainty in activity duration.
Activity duration is calculated from t0,
tp and tm.
CPM is a deterministic model with
well known activity duration
2 It is an event oriented approach. It is an activity oriented approach.
3 PERT terminology uses word CPM terminology employs word like
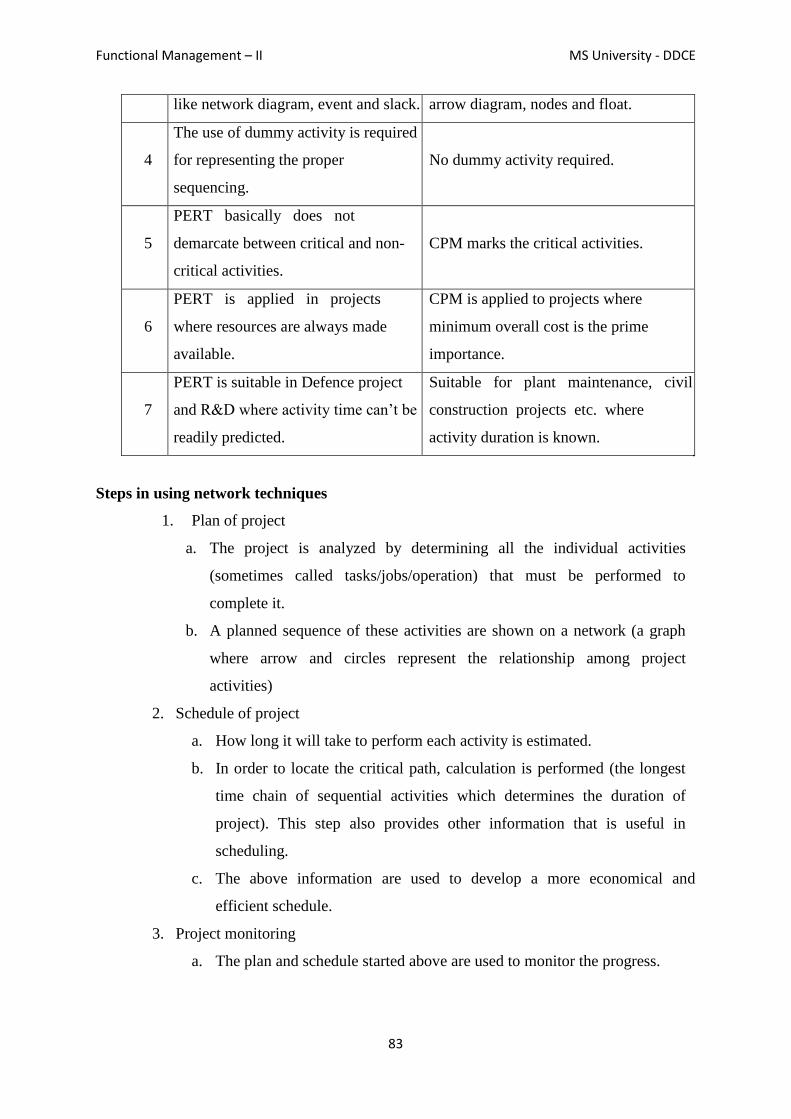
Functional Management – II MS University - DDCE
83
like network diagram, event and slack. arrow diagram, nodes and float.
4
The use of dummy activity is required
for representing the proper
sequencing.
No dummy activity required.
5
PERT basically does not
demarcate between critical and non-
critical activities.
CPM marks the critical activities.
6
PERT is applied in projects
where resources are always made
available.
CPM is applied to projects where
minimum overall cost is the prime
importance.
7
PERT is suitable in Defence project
and R&D where activity time can‘t be
readily predicted.
Suitable for plant maintenance, civil
construction projects etc. where
activity duration is known.
Steps in using network techniques
1. Plan of project
a. The project is analyzed by determining all the individual activities
(sometimes called tasks/jobs/operation) that must be performed to
complete it.
b. A planned sequence of these activities are shown on a network (a graph
where arrow and circles represent the relationship among project
activities)
2. Schedule of project
a. How long it will take to perform each activity is estimated.
b. In order to locate the critical path, calculation is performed (the longest
time chain of sequential activities which determines the duration of
project). This step also provides other information that is useful in
scheduling.
c. The above information are used to develop a more economical and
efficient schedule.
3. Project monitoring
a. The plan and schedule started above are used to monitor the progress.

Functional Management – II MS University - DDCE
84
b. Throughout the execution of project, the schedule is revised and updated
so that the schedule represents the current plan and status of progress.
c. PERT, Critical path, Most likely time estimates.
Resource leveling: There are two types of resource problem
(i) Resource smoothing
(ii) Resource levelling
(i) Resource smoothing: There may be a ceiling on the availability of resources in a
particular period of time. For instance, only Rs 125 lakh per annum may be available to
the project and if unutilized during the year, the remaining amount lapses. The resource
analysis used for this type of case is called Resource smoothing.
(ii) Resource levelling: A resource may be required to be used in a uniform manner. For
instance, in the present day labour situation one cannt have 100 labourers yesterday, 30
today and 80 tomorrow. Once a labour is hired, it is difficult to hire him. The rate of
usage of labour has to be uniform. Resource analysis used for this category of problems
is called Resource levelling.

Functional Management – II MS University - DDCE
85
LESSON – 10
10.0 QUALITY MANAGEMENT
Quality Management: Quality circle may be defined as a small group of workers (5 to 10)
who do the same work voluntarily meeting together regularly during their normal working
time usually under the leadership of their own supervisor to identify, analyze and solve work
related problems.
This group presents the solution to the management and wherever possible implement the
solution themselves. The QC concept was first originated in Japan in 1960. The basic cycle
of a quality circle starts from identification of problem.
Philosophical basis of QC
1. A belief that people will take pride and interest in their work if they get
autonomy and take part in decision making.
2. It develops a sense of belongingness in the employees towards a particular
organization.
3. A belief that each employee desires to participate in making the organization a
better place.
4. It is a mean/method for the development of human resources through the
process of training, work experience and participation in problem solving.
5. A willingness to allow people to volunteer their time and effort for
improvement of performance of organization.
6. The importance of each member‘s role in meeting organizational goal.
7. QCs are small primary groups of employees/workers whose lower limit is 3
and upper limit is 12.
CONTENTS
10.0 QUALITY MANAGEMENT
10.1 WORK STUDY

Functional Management – II MS University - DDCE
86
8. Membership is voluntary. The interested employees in some areas may come
together to form a quality circle.
9. Each quality circle is led by area supervisor.
10. The members meet regularly every week/ as per agreeable schedule.
11. The QC members are specially trained in technique of analysis and problem
solving in order to play their role efficiently.
12. The basic role of quality circle is to identify work related problems for
improving quality and productivity.
13. QC enables the members to exercise their hidden talents, creative skills, etc.
14. It promotes the mutual development of their member through cooperative
participation.
15. It gives job satisfaction because of identifying and solving challenging
problems while performing the job.
16. It provides their member with opportunities for receiving public recognition
from the company‘s management.
17. The members also receive recognition in the form of memento, certificate and
privileges.
18. It also contributes to their self-esteem and self-confidence through acceptance
of their recommendation by the management.
Objectives of QC
a. To improve the quality and productivity.
b. To reduce the cost of products/ services by waste reduction, effective utilization
of resources eliminating error/ defects.
c. To utilize the hidden creative intelligence of the employees.
d. To identify and solve work related problems.
e. To motivate people for solving challenging tasks.
f. To improve communication within the organization.
g. To increase employee‘s loyalty and commitment to organizational goals.
h. To enrich human capability, confidence, morale, attitude and relationship.
i. To pay respect to humanity and create a happy bright workplace.
j. To satisfy the human needs of recognition and self development.

Functional Management – II MS University - DDCE
87
Kaizan: Kaizen means change (Kai) to become good (Zen). In other words, it means
continuous improvement. In fact, continuous improvement is required in all activities of the
organization such as:
Productivity improvement
New product development
Labor management relation
Total productive maintenance
Just in time production & delivery system
Customer orientation etc.
The various activities of an organization where continuous improvement is required is
presented under the kaizen umbrells. This continuous improvement in all areas are taken
through small step by step process. Because various behavioural, cultural and philosophical
changes are better brought about through small step by step improvement than through
radical changes.
10.1 WORK STUDY
Work Study: Work study is a technique which is employed to ensure the best possible use of
men, machine, materials and energy in carrying out a specific activity. It deals with the
techniques of method study and work measurement.
Motion study: It is defined as a systematic and critical study of existing method of doing a
task with a view to evolve the most efficient and economic method of doing it. It is a method
for setting up employee productivity standards in which:
A complex job is broken down into small or simple steps.
The sequence of movements taken by the employee in performing those steps is
carefully observed to detect and eliminate wasteful motion.
Precise time taken for each correct movement is measured.
From these measurements, production and delivery times and prices are computed
and incentive schemes are devised. Generally it is appropriate only for repetitive
tasks. Time and motion studies were pioneered by the US industrial engineer

Functional Management – II MS University - DDCE
88
Frederick Winslow Taylor (1856-1915) and developed by the husband and wife
team of Frank Gilbreth (1868-1924) and Dr. Lillian Gilbreth (1878-1972).
Objectives of motion study: The objectives of motion study are:
To improve the procedure of doing a work.
To improve the workplace layout (ultimately plant layout).
To minimize the human motion for minimum fatigue of operators.
To maximize the utility of resources (men, m/c, materials).
To improve the overall working environment.
Principles of motion economy
Analysis of an operation when carried out in terms of individual motion of a worker
is known as Motion analysis.
The purpose of motion analysis is to design an improved method which would
eliminate unnecessary motion and employs human effort more productively. In
doing so, the Principle of motion economy is very much helpful.
It consists of a set of rules designed by Gilbreth and later rearranged and amplified
by others (Branes Lowry et al) to develop better methods.
i. It is classified into following 04 categories: Rules concerning human body,
workplace layout and material handling, Tools and Equipment Design and time
conservation.
ii. Rules concerning human body
a. Both hands should be used for productive work.
b. Both hands should start and finish their motion at the same time.
c. Except for the rest period, the two hands should not be idle at one time.
d. Motion of both the hands and arms are symmetrical, simultaneous and opposite to
each other.
e. Motions should be simple and involve minimum number of limbs. (The purpose-
shortest duration and minimum fatigue)
f. Motion should be smooth and continuous. There should not be sharp direction
change and frequent stop.
g. It is desirable for a worker to employ momentum to assist him.

Functional Management – II MS University - DDCE
89
h. A worker may use mechanical aids to assist him to overcome muscular effort.
iii. Rules concerning workplace layout and material handling
a. There should be a definite, fixed and easy accessible location for materials and
tools.
b. As far as possible, materials, tools and other mechanical devices should be kept
close to work place.
c. Gravity should preferably be employed wherever feasible with a conveyor for
transportation and delivering materials at the workplace between various
workstations and departments.
d. An assembled and final product should preferably be dropped on a conveyor near
the workplace so that gravity delivers the job at the required place.
e. Tools and materials should preferably be located in the order/sequence in which
they will be required for use.
f. Good illumination is required for proper seeing, fast operating and reducing the
accidents.
g. In order to impart rest to some of the limbs, an operator may sometimes sit or
stand while working. This necessitates a relationship between his chair, height of
table or workpiece.
h. In order to reduce fatigue, the sitting arrangement of the worker should be
comfortable and adjustable.
i. All heavy parts should be lifted by mechanical devices.
iv. Rules concerning Tools and Equipment Design
a. Jigs, fixtures and foot operated devices should be employed to reduce the work
load on hand.
b. Tools should be multipurpose and easy to handle.
c. Foot-operated switches and controls should be designed as far as possible to
reduce the workload on the hands.
d. Tools and materials should be properly arranged and located near the workpiece.
e. Tools and materials should be located in the order of their use.
f. There should be maximum surface contact between the tool handle and hand. It
helps proper application of hand force and minimizes fatigue.
g. Gravity should be used for delivery of materials and finished goods.

Functional Management – II MS University - DDCE
90
h. Where the work is supposed to be carried out by fingers, the load distribution on
each finger should be as per normal capacity of finger.
i. A worker should have the flexibility to stand or sit comfortably while working.
j. A worker should be able to operate levers and handles without changing the body
position.
k. The workplace should have proper ergonomics in terms of illumination, proper
conditions of heat, cold and humidity, reduced dust and noise, etc.
v. Rules concerning time conservation
a. Even temporary ceasing of work by a man or m/c should not be encouraged.
b. Machine should not run idle as it leads to loss of production and power.
c. Two or more jobs should be done at the same time, or two or more operations
should be carried out on a job simultaneously.
d. Number of motions involved in completing a job should be minimized.
e. The loading and unloading of the job and the cycle time should be synchronized
in such a manner that one operator can be multi-functional or can simultaneously
operate a number of machines.
Procedure in Motion Analysis: The steps in motion analysis are as follows:
a) Select: Select the work to be studied.
b) Record: Record all the relevant facts of the proposed work by direct observation.
c) Examine: Examine the facts critically in sequence, using special critical
examination sheet.
d) Develop: Develop the best method i.e. the most practical, economic and
effective method under prevailing circumstances using the principle of motion
economy.
e) Install: install that method as standard practice.
f) Maintain: maintain that standard practice by regular routine check.
Recording: The recording may trace the movements of men, material or details of
various processes. The principle is to use the simplest technique which will contain all
relevant information needed for investigation.
Time study
It was proposed by Frederick Taylor and later modified to include a performance
rating (PR) adjustment.

Functional Management – II MS University - DDCE
91
Once the method is established, the next objective is to set the standard time for the
work. This aspect of work study is called Time study (or Work measurement).
The main objectives of time study are:
1) To determine the standard time for various operations which helps in fixing
wage rates and incentives.
2) To estimate the cost of product accurately.
3) To predict accurately the duration for a particular work and customer is
promised accordingly.
4) To determine the number of machines an operator can run.
5) To determine the optimum number of men and machine.
6) To provide information for planning and scheduling.
7) To balance the work of all workers working in a group.
8) To compare the work efficiency of different workers/operators.
Work measurement techniques
1. Time study using stop watch.
2. Predetermined motion time system (PMTS).
3. Work sampling.
4. Analytical estimating.
The following table shows the application of each technique and unit of measurement.
Technique Application Unit of measurement
Time study using stop watch Short cycle repetitive jobs Centiminute
(0.01 min)
PMTS Manual operations confined TMU
to one work centre (I TMU = 0.006 min)
Work sampling Long cycle jobs/ Minute
Heterogeneous operation
Analytical estimating
Short cycle non-repetitive
job Minute
Time study using stop watch is the most popular technique for determining standard
time. The first task of the analyst is to divide the work/job into smaller work elements
in such a way that the time for each element should not be less than 3 seconds because
for such elements, recording time is difficult. The steps of time study are as follows:
Step 1: First select the job to be studied. Breakdown the work content of the job into
smallest possible elements. Then, inform the worker and define the best method.

Functional Management – II MS University - DDCE
92
Step 2: Observe the time for appropriate number of cycles (such as 25 to 50).
Step 3: Determine the average cycle time (CT)
∑ Times
CT =
No. of cycles
Step 4: Determine the normal time (NT)
NT = CT (PR)
Where, PR is the performance rating.
Step 5: Determine the standard time using the following formula.
1
ST = NT (AF) where AF =
1- % Allowance
AF being the allowance factor.
Selection of job for Time Study: Time Study is conducted on a job
which has not been previously time-studied.
for which method change has taken place recently.
for which worker(s) might have complained as having tight time standards.
Selection of Worker for Time Study: The worker on which time study should be conducted
must
have necessary skill for the job.
have sufficient experience with the given method on the job (that is, he
should have crossed the learning stage).
be an ‗average' worker as regards the speed of working.
be temperamentally suited to the study (those who can't work in normal
fashion when watched, are not suitable for the study).
have knowledge about the purpose of study.
Time Study Equipment: The following equipment is needed for time study work.
• Timing device
• Time study observation sheet
• Time study observation board
• Other equipment

Functional Management – II MS University - DDCE
93
Timing Device. The stop watch is the most widely used timing device used for time study,
although electronic timer is also sometimes used. The two perform the same function with
the difference that electronic timer can measure time to the second or third decimal of a
second and can keep a large volume of time data in memory.
Time Study Observation Sheet. It is a printed form with spaces provided for noting down
the necessary information about the operation being studied, like name of operation,
drawing number, and name of the worker, name of time study person, and the date and
place of study. Spaces are provided in the form for writing detailed description of the
process (element-wise), recorded time or stop-watch readings for each element of the
process, performance rating(s) of operator, and computation. Fig. shows a typical time
study observation sheet.
Time Study Board. It is a light -weight board used for holding the observation sheet and
stopwatch in position. It is of size slightly larger than that of observation sheet used.
Generally, the watch is mounted at the center of the top edge or as shown in Figure near the
upper right-hand corner of the board. The board has a clamp to hold the observation sheet.
During the time study, the board is held against the body and the upper left arm by the time
study person in such a way that the watch could be operated by the thumb/index finger of
the left hand. Watch readings are recorded on the observation sheet by the right hand.

Functional Management – II MS University - DDCE
94
Other Equipment. This includes pencil, eraser, device like tachometer for checking the
speed, etc.
Why Dividing Work into Short Elements is essential?
For the purpose of time study, the task is normally broken into short elements and each
element is timed separately for the following reasons:
To separate unproductive part of task from the productive one.
To improve accuracy in rating. The worker may not work at the same speed
throughout the cycle. He may perform some elements faster and some slower.
Breaking of task into short elements permits rating of each element separately
which is more realistic than just rating once for the complete cycle.
To identify elements causing high fatigue. Breaking of task into short elements
permits giving appropriate rest allowances to different elements.
To have detailed job specifications. This helps in detection of any variation in
the method that may occur after the time standard is established.
To prepare standard data for repeatedly occurring elements.
The following guidelines should be kept in mind while dividing a task into elements.
a. The elements should be of as short duration as can be accurately timed.(This in
turn, depends on the skill of the time study man, method of timing and
recording, and many other factors. Generally, with the stop watch, elements of

Functional Management – II MS University - DDCE
95
duration less than 0.03 to 0.05 minute are difficult to time accurately. The
elements should not normally be longer than 0.40 min.).
b. Manually performed elements should be separated from machine paced
elements.(Time for machine paced elements can be determined by
calculation). Machine elements are not rated against a normal. This rule also
helps in recognition of delays.
c. Constant elements should be separated from variable elements.
d. The beginnings and endings of elements should be easily distinguishable.
These should preferably be associated with some kind of sound.
e. Irregular elements, those not repeated in every cycle, should be separated from
regular elements. For example, if the jig is cleaned off after every ten parts
produced, "cleaning" is an irregular element, and its time should be spread
over ten cycles.
f. Unnecessary motions and activities should be separated from those considered
essential.
g. Foreign or accidental elements should be listed separately. Such elements are
generally of non-repetitive type.
Number of cycles to be timed.: The following general principles govern the number of
cycles to get the representative average cycle time.
a. Greater the accuracy desired in the results, larger should be the number of cycles
observed.
b. The study should be continued through sufficient number of cycles so that
occasional elements such as setting-up machine, cleaning of machine or
sharpening of tool are observed for a good number of times.
c. Where more than one operator is doing the same job, short study (say 10 to 15
cycles) should be conducted on each of the several operators than one long
study on a single operator.
It is important that enough cycles are timed so that reliable average is obtained.
Following techniques are used to determine the number of cycles to be timed.
(i) Use of Tables: On the consideration of the cost of obtaining the data and the
desired accuracy in results, most companies have prepared their own tables for the use
of time study, which indicate the number of cycles to be timed as a function of the
cycle time and the frequency of occurrence of the job in the company.

Functional Management – II MS University - DDCE
96
(ii) Statistical methods: On the basis of the requirements of the particular situation
involved, accuracy and confidence level are decided (An accuracy of a confidence
level of 95% is considered reasonable in most cases). A preliminary study is conducted
in which some (say N) cycles are timed. Standard deviation o of these (N) observations
is calculated as
Performance Rating: It is a process of comparing the performance rate of a worker against
standard performance. The standard performance is different for different jobs. Te rating
factor is used to convert the observed time into normal time.
Normal time = Observed time × Performance level of worker
Standard performance level
Allowances: Allowances are added to normal time in order to arrive at standard time. The
various allowances are:
1. Process allowance: This is an allowance provided to compensate for enforced
idleness during a process. This includes loss of time due to (i) no work (ii)
power failure (iii) faculty material (iv) faculty tool or equipment.
2. Personal and Rest allowance: This is allowed to compensate for the time
spent by worker in meeting the physical needs, for instance a periodic break in
the production routine. The amount of personal time required by operator
varies with the individual more than with the kind of work, though it is seen
that workers need more personal time when the work is heavy and done under
unfavorable conditions. The amount of this allowance can be determined by
making all-day time study or work sampling. Mostly, a 5 % allowance for
personal time (nearly 24 minutes in 8 hours) is considered appropriate.

Functional Management – II MS University - DDCE
97
Rest allowance is a relaxation allowance to a worker to overcome fatigue
incurred during working. Excessive fatigue badly affects the performance of
worker. This rest/relaxation may vary from 12% to 20% of normal time from
light to heavy.
3. Special Allowances: These allowances are given under certain special
circumstances. Some of these allowances and the conditions under which they
are given are:
Policy Allowance: Some companies, as a policy, give an allowance to provide
a satisfactory level of earnings for a specified level of performance under
exceptional circumstance. This may be allowed to new employees, handicap
employees, workers on night shift, etc. The value of the allowance is typically
decided by management.
Small Lot Allowance: This allowance is given when the actual production
period is too short to allow the worker to come out of the initial learning
period. When an operator completes several small-lot jobs on different setups
during the day, an allowance as high as 15 percent may be given to allow the
operator to make normal earnings.
Training Allowance: This allowance is provided when work is done by trainee
to allow him to make reasonable earnings. It may be a sliding allowance, which
progressively decreases to zero over certain length of time. If the effect of
learning on the job is known, the rate of decrease of the training allowance can
be set accordingly.
Rework Allowance: This allowance is provided on certain operation when it is
known that some percent of parts made are spoiled due to factors beyond the
operator's control. The time in which these spoiled parts may be reworked is
converted into allowance.
4. Policy allowance: It depends on the policy of an organization controlled by
workers union.
Problem 1: In a welding shop, a direct time study was done on a welding operation.
One inexperienced industrial engineer and one experienced industrial engineer
conducted the study simultaneously. They agreed precisely on cycle time but their
opinion on rating the worker differed. The experienced engineer rated the worker
100% and the other engineer rated the worker 120%. They used a 10% allowance.

Functional Management – II MS University - DDCE
98
Cycle time (in minutes) Number of times observed
20 2
24 1
29 1
32 1
From the above statement,
(a) Determine the standard time using the experienced industrial engineer‘s worker
rating.
(b) Find the standard time using the worker rating of inexperienced industrial
engineer.
Solution:
(a) Rating of worker at 100% by the experienced industrial engineer Cycle time (CT) =
(20×2+24×1+29×1+32×1)/5 = 25 min Normal time (NT) = CT×PR = 25×100% = 25
min
Standard time (ST) = NT/(1-%A) = 25/(1-0.10) = 27.78 min
(b) Rating of worker at 120% by the inexperienced industrial engineer Cycle
time (CT) = (20×2+24×1+29×1+32×1)/5 = 25 min
Normal time (NT) = CT×PR = 25×120% = 30 min Standard time (ST) = NT/(1-%A) =
30/(1-0.10) = 33.33 min.