Embed Size (px)
DESCRIPTION
D.Kiktev, E.Astakhova, A.Muravyev, M.Tsyrulnikov. Perfomance of the WWRP project FROST-2014 forecasting systems: Preliminary assessments (FROST = Forecast and Research in the Olympic Sochi Testbed). WWOSC-2014, 16-21 August 2 014. Goals of WMO WWRP RDP/FDP FROST-2014:. - PowerPoint PPT Presentation
Citation preview

Perfomance of the WWRP project FROST-2014 forecasting systems: Preliminary assessments
(FROST = Forecast and Research in the Olympic Sochi Testbed)
D.Kiktev, E.Astakhova, A.Muravyev, M.Tsyrulnikov
WWOSC-2014, 16-21 August 2014
Goals of WMO WWRP RDP/FDP FROST-2014:
• To improve and exploit:– high-resolution deterministic mesoscale forecasts of meteorological conditions in winter complex terrain environment;
– regional meso-scale ensemble forecast products in winter complex terrain environment;
– nowcast systems of high impact weather phenomena (wind, precipitation type and intensity, visibility, etc.) in complex terrain.
• To improve the understanding of physics of high impact weather phenomena in the region;
• To deliver deterministic and probabilistic forecasts in real time to Olympic weather forecasters and decision makers.
• To assess benefits of forecast improvement (verification and societal impacts)
• To develop a comprehensive information resource of alpine winter weather observations;

3rd meeting of the project participants (10-12 April 2013)
International participants of the FROST-2014 project
• COSMO, • EC, • FMI, • HIRLAM, • KMA, • NOAA, • ZAMG
under supervision of the WWRP WGs on Nowcasting, Mesoscale Forecasting, Verification Research

Observational network
- About 50 AMS; - C-band Doppler Radar WRM200; - Temperature/Humidity profiler – HATPRO; - Wind – Scintec-3000 Radar Wind Profiler;- Two Micro Rain vertically pointing Radars (MRR-2);- 4 times/day upper air hi-vertical-res. sounding on site
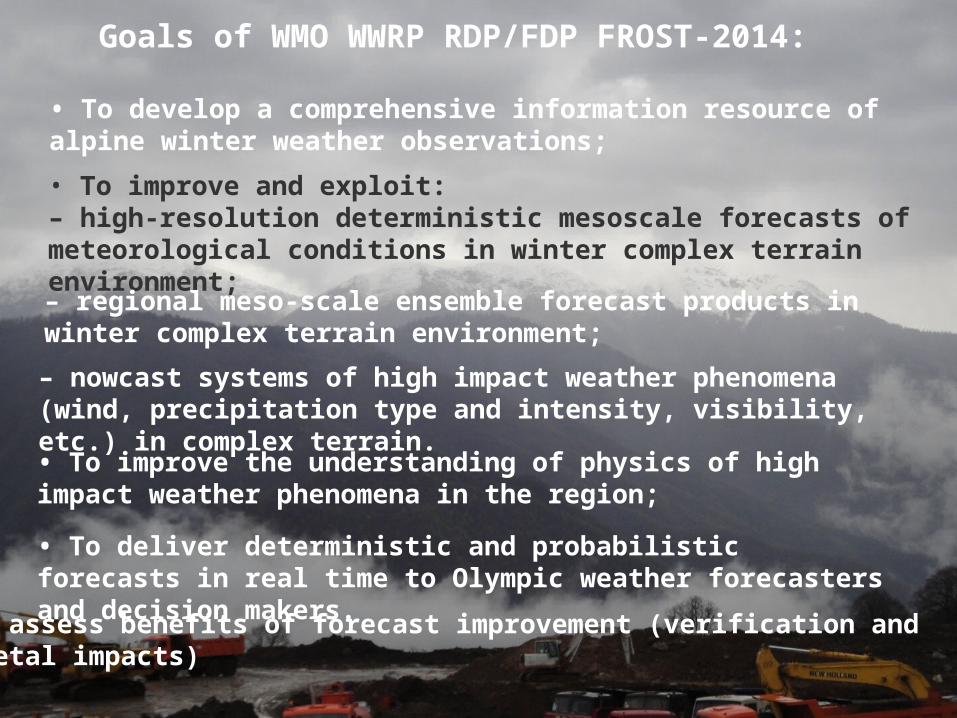
Forecasting systems participating in RDP/FDP FROST-2014
Nowcasting: ABOM, CARDS, INCA, INTW, MeteoExpert, Joint (Multi-system forecast integration)
Deterministic NWP: COSMO-RU with grid spacing 1km, 2.2 km, 7km; GEM with grid spacing 2.5 km, 1 km, 0.25 km; NMMB – 1 km; HARMONIE – 1 km; INCA – 1 km
Ensemble NWP: COSMO-S14-EPS (7km), Aladin LAEF (11km), GLAMEPS (11km), NNMB-EPS (7km ), COSMO-RU2-EPS (2.2km), HARMON-EPS (2.5km)

FROST-2014 Online Monitoring of Forecast Quality: Role of resolution - GEM-2.5 km vs GEM-1 km vs GEM-250 mForecast mean absolute errors as a function of forecast lead time.
Location: Mountain skiing finish (Roza-Khutor-7 station).
Period: 15 Jan – 15 March
Effect is not straightforward. It depends on meteorological variable, location, lead time etc.
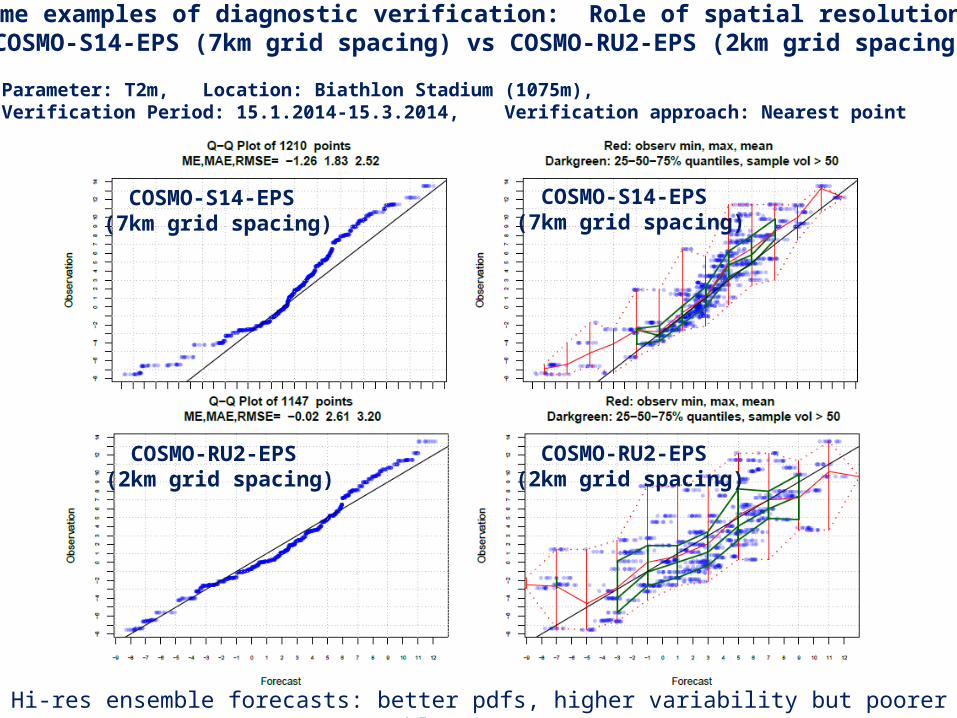
Some examples of diagnostic verification: Role of spatial resolution. COSMO-S14-EPS (7km grid spacing) vs COSMO-RU2-EPS (2km grid spacing)
Parameter: T2m, Location: Biathlon Stadium (1075m), Verification Period: 15.1.2014-15.3.2014, Verification approach: Nearest point
COSMO-S14-EPS (7km grid spacing)
COSMO-S14-EPS (7km grid spacing)
COSMO-RU2-EPS (2km grid spacing)
COSMO-RU2-EPS (2km grid spacing)
Hi-res ensemble forecasts: better pdfs, higher variability but poorer ensemble mean scores.

Role of spatial resolution for ensemble forecasts – continuedCOSMO-S14-EPS (7km grid spacing) vs COSMO-RU2-EPS (2km grid spacing)
Station BIAS (for 6/12/18hr lead time) Mean Absolute Error (for 6/12/18hr lead time)
COSMO-S14-EPS COSMO-RU2-EPS COSMO-S14-EPS COSMO-RU2-EPS
Sledge(~700m)
-1.3 / -2.0/ -1.4 0.2 / -1.9 / -0.1 1.6 / 2.2 / 1.6 1.4 / 3.5 / 1.7
Freestyle(~1000m)
-2.0 / -1.8 / -1.9 0.3 / -0.7 / 0.0 2.1 / 2.0 / 2.1 1.6 / 2.4 / 1.7
Biathlon Stadium(~1500m)
-1.4 / -1.3 / -1.4 0.9 / 0.0 / 0.5 2.0 / 1.8 / 2.1 2.1 / 2.6 / 2.3
Mountain Skiing(start)(~2000m)
1.6 / 2.2 / 1.6 0.6 / 0.2 / 0.1 2.8 / 3.1 / 2.8 2.1 / 2.2 / 2.6
• T2m: Some positive effect of downscaling from 7 to 2 km resolution.
== Wind Speed: No positive effect of dynamical downscaling was found.
Verifications for T2m ensemble meanVerification Period: 15.1.2014-15.3.2014

17.02.2014 . Camera shots from Gornaya Carousel-1500
FROST-2014 experience demonstrates that direct forecast of visibility is a serious challenge. However, some results were encouraging.
Example: 17 February 2014, 11:00-12:00 UTC (Biathlon venue) – Forecast of time slot for competitions during the 3-days period with low visibility.
Forecast of wind direction and relative humidity (as proxy of visibility)by COSMO-Ru1 (1km grid spacing)
Wind and RH at 850 hPa. Forecast from 12 UTC 16.02.2014
Biathlon Stadium
11:00 UTC 11:30 UTC 12:00 UTC
11:00 UTC 13:00 UTC12:00 UTC
RH at 2m:Forecast and observations
Biathlon Stadium Biathlon Stadium

How was the window of good visibility on 17 February predicted by various systems?

ROCA
BSS
BS
COSMO-S14-EPS – redCOSMO-RU2-EPS – orangeLAEF-EPS – brownNMMB-EPS – blackHARMON-EPS – blueGLAMEPS – green
Verification approach: 13 stations in the area of Krasnaya Polyana were clustered for matching to forecasts.
Some ensemble verifications:
ROC Area, Brier Skill Score, and Brier Score for Precip > 0.01 mm/3h
COSMO-S14-EPS, NMMB-EPS and COSMO-RU2-EPS look most informative.
Lead time

ROCA, BSS, and BS scores for Precip > 5 mm/3h
For higher Precip threshold (w.r.t. the lower threshold):= COSMO-S14-EPS, NMMB, and HARMON-EPS become worse. = In contrast, LAEF and GLAMEPS become better.
BSS
ROCA
BS
COSMO-S14-EPS – redCOSMO-RU2-EPS – orangeLAEF-EPS – brownNMMB-EPS – blackHARMON-EPS – blueGLAMEPS – green

N
iiii tbtfttOttF ))()(()())(1()()(
It was not simple for forecasters to deal with such an amount of information under the operational time
constraints => Integrated Forecast
F(t) – integrated forecast (t – forecast time);O – last available observation; fi(t) – forecast of i-th participating forecasting system;α(t), βi(t) - weights;bi(t) - bias for i-th forecasting system
• F. Woodcock and C. Engel: Operational Consensus Forecasts, Weather and Forecasting, 2005;
• L.X. Huang and G.A. Isaac: Integrating NWP Forecasts and Observation Data to Improve Nowcasting Accuracy, Weather and Forecasting, 2012

FROST-2014 weather data feed for the Olympic information system
Integrated objective multi-model forecasts served as a first guess for preparation of the “official forecasts” for the Olympic information system.
Web-editor was developed for forecasters for correction of objective forecasts.
ATOS Requrements: - 1-hour update frequency;- Temporal resolution:
for a current day – 1 hour;for subsequent days – 3 hours;
- Forecast outlooks for a current day and next 5 days;- Alert Warnings

Subjective Evaluation of forecast technologies by Sochi forecasters: survey(3 best models are shown in red)
ModelGrid mesh
size
Overall usefulne
ss
Forecast accuracy: Visualization (appearance)
Timeliness and
reliability
Comments
T Precip
Wind
Gusts
Vis
COSMO-Ru77 km
2.4 1.9 2.3 2.3 2.1 2.9 2.9 The basic model for the forecasters. Reasonable precip fact. Overestimated precip intensity. Tmin, Tmax poor. Wind poor. dT/dt OK.
COSMO-Ru2
2.2 km
2.7 2.3 2.3 2.3 2.1 2.9 2.7 The basic model for the forecasters. In general better than Cosmo-Ru7.
COSMO-Ru1
1.1 km
2.3 1.5 2.0 2.0 2.3 2.8 2.4 Comments are contradictory. The majority of forecasters considered COSMO-Ru2 to be more useful than COSMO-Ru1. Some forecasters preferred Cosmo-Ru1 (helpful wind, humidity). Overestimates precip intensity.
COSMO-S14-EPS
7 km
2.1 2.0 2.0 2.0 2.0 2.7 2.7 Precip reasonable. Good tendencies. Wind poor. Was available well before the Olympics that was helpful to get used to this information.
NMMB1 km
2.0 2.0 2.0 1.3 1.3 2.0 2.3 2.3 Good in T and Precip. Informative visibility
NMMB-EPS 7 km
2.1 2.0 2.0 1.3 2.0 1.7 2.2 2.7 Nice. Informative visibility. Precip reasonable. Tmin, Tmax poor
GEM-2.52.5 km
2.3 2.0 1.9 1.7 1.6 1.6 2.2 2.4 Good precip, humidity.
GEM-11 km
2.2 2.0 2.0 1.7 1.5 1.5 2.2 2.3 Good precip, humidity.
GEM-250250 m
2.4 2.2 2.2 2.0 2.0 1.8 2.3 2.3 Good precip, humidity. Very detailed maps.

Subjective Evaluation of forecast technologies by Sochi forecasters: survey
(3 best models are shown in red) - continued
ModelGrid mesh
size
Overall
usefulness
Forecast accuracy: Visualizati
on (appearanc
e)
Timeliness and reliability
CommentsT Preci
pWin
dGust
sVis
GLAMEPS11 km
1.5 1.8 1.8 1.8 2.0 2.3 2.7 Informative tendencies. Issues with absolute values.
GLAMEPS calibr.,frequen
t update11 km
2.0 2.0 2.0 2.0 2.0 2.2 2.7 Interesting and helpful.
HarmonEPS2.5 km
1.3 1.5 1.3 1.3 1.3 2.2 1.8 In general good in T and Precip, but there were problems with T in anticyclones and Foehn.
Harmonie1 km
2.3 2.3 2.3 2.0 2.0 2.3 2.3 Good T, Precip.
ALADIN LAEF11 km
2.0 1.8 1.8 2.0 2.0 2.5 2.7 Good Wind, including Vmax. Nice plots
WRF600 m
2.1 2.0 2.3 2.1 2.2 2.5 2.1 1.6 Useful but late
COSMO-Ru2-EPS
2.2 km
1.7 1.3 1.7 1.7 2 2.3 2.3 Experimental

Model Overall usefulness
Forecast accuracy: Visualization (appearance)
Timeliness and reliability
Comments
T Prec
Wind
Gusts
Vis
“Joint” (an aggregate of obs., INCA, COSMO, etc.)
2.6 2.8 2.8 2.8 2.4 2.8 Good T, including Tmin, Tmax. OK on average.
ABOM 1.6 1.8 1.3 1.2 2 Graphics was not convenient.
CARDS 2.8 2.7 2.8 2.6 Very good, but with some drop-offs (precip trapped in the mountains). Surprisingly informative graphics.
INTW 1.8 2.0 1.5 1.3 1.0 1.2 1.8 Informative, but graphics was not convenient.
INCA 1.5 1.5 1.5 1.5 2.2 1.5 10-minutes Precip became available in mid-January 2014 and were not presented at the project site.
Meteo-expert 0.8 0.8 0.5 0.5 0.7 1.8 0.8 Too few locations with nowcasts, but Meteo-Expert site was useful
Subjective Evaluation: Nowcasting technologies: (two best systems in each column marked by red)

= A lot of forecasts available: helpful but too much info in the operational
situation.
= Models performed more or less in a similar way: temperature, precip
(tendencies, onset/end of precip) – more useful, wind, gusts, visibility - poor.
= Synoptic-scale forecasts very useful (despite the presence of mesoscale
forecasts): NCEP/GFS, UKMO/UM, ECMWF/IFS.
= Nowcasts helpful, especially for precipitation. Visibility nowcasts had useful
skill, but there were serious failures.
The forecasters are very grateful indeed to all the FROST forecast/nowcast
providers!
Some forecasters’ comments

Further steps
• Enhanced quality control of the project observations archive. • Additional diagnostic tools and export facilities (inclu. TIGGE-style archiving) on the project web-site http://frost2014. • Open access for international research community.• Validation and intercomparison of the participating forecasting systems, case studies and numerical experiments, assessments of predictability of various weather elements• Continuation of developed technologies and transfer of positive experience into operational practice.

Project Social and Economic Impacts
Socially significant project application areas:
• Education
• Transfer of technologies
• Practical forecasting – first guess for operational official
forecasts.
• Informal exchange of ideas, experience etc. Meetings,
Blog... Spirit of the project..

http://frost2014.meteoinfo.ru
Thank you!
Gratitude to all the participants !

Along with traditional verification measures some new scores were implemented.
EDI - Extremal Dependence Index
NOTES: - Pictures will refer to thresholds 0.01 and 3, and the last threshold at which any of the three EDI curves remains not interrupted in the 0-36h interval- The base rate has the following approximate values: P(0.01mm/3h)=0.3; P(1mm/3h)=0.2; P(2mm/3h)=0.15; P(3mm/3h)=0.1; P(4mm/3h)=0.055;P(5mm/3h)=0.05
EDI = (logF – logH) / (logF+logH)
EDI is especially recommended for low base-rate thresholds, but it will give a good comparative estimate of accuracy for all thresholds (“Suggested methods for the verification of precipitation forecasts against high resolution limited area observations” by the JWGFVR (Laurie Wilson, Beth Ebert et al.)
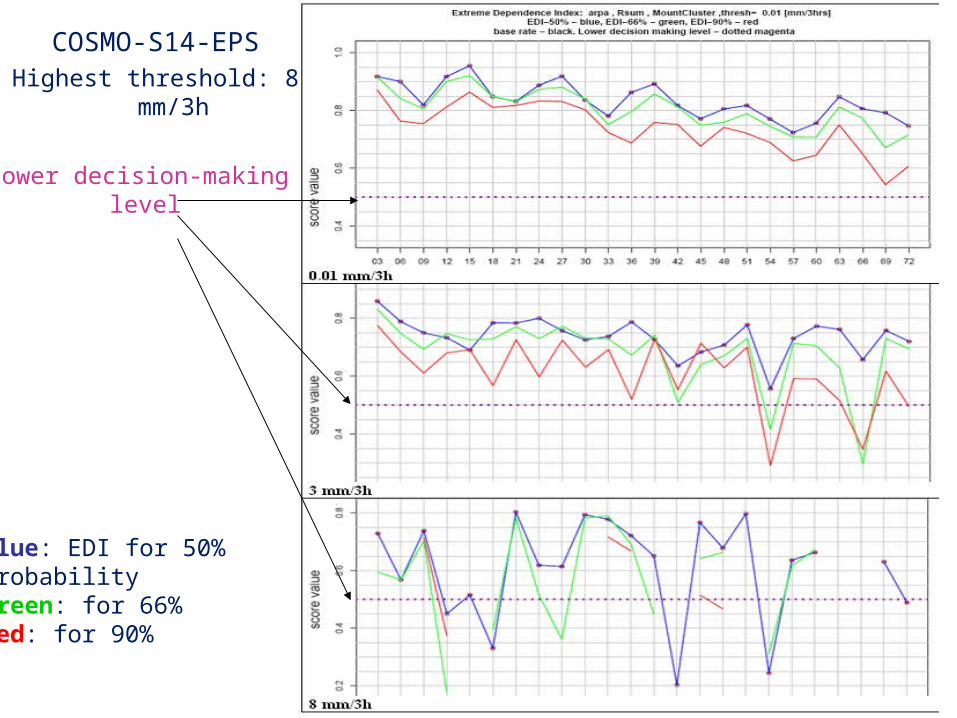
COSMO-S14-EPSHighest threshold: 8 mm/3h
Lower decision-making level
Blue: EDI for 50% probability thresholdGreen: for 66%Red: for 90%

Conclusions, EDI
• Extremal Dependence Index, EDI, can be used for decision making, especially for rare events when other scores, such as PSS, approach zero. Constructing EDI for different probability decision levels (50, 66, and 90%) showed that the participated EPSs demonstrate skill for all these levels up to the following precipitation thresholds:
COSMO-S14-EPS and NMMB-EPS – informative up to 8mm/3h;
COSMO-RU2-EPS, Harmon-EPS, ALADIN LAEF - informative up to 6mm/3h;
GLAMEPS – informative up to 4mm/3h.
• Sampling effects are evident for all the models, especially for higher thresholds of variables.
• It is not possible to single out “the best ensemble producing system”, but still some conclusions can be drawn.