Embed Size (px)
Citation preview
northern territory government Department of Land Resource Management | Annual Report 2012-1340
The Financial Statement Overview
This section of the report provides an analysis of the financial outcome of the Department of Land Resource Management for the year ended 30 June 2013.
The Department was formed in September 2012 following a government restructure in which the former Department of Natural Resources, Environment, The Arts and Sport was split into the following new Agencies:-
• Department of Land Resource Management;
• Department of Sport and Recreation;
• Department of Arts and Museums;
• Parks and Wildlife Commission of the Northern Territory; and
• Department of Lands, Planning and the Environment (Environment added).
The comparative data in the financial section is that of the former Department of Natural Resources, Environment, the Arts and Sport however, as the Department was significantly restructured to form the new Department of Land Resource Management only the current year results have been compared to the budget.
Financial Performance
In 2012-13, the Department made a net profit of $1.1 million against a budgeted loss of $1.1 million.
Major factors contributing to the budget savings of $2.2 million include:-
• $0.8 million due to project timing resulting in the budget not being fully utilised in 2012-13. These projects are predominately funded by external grants and the unutilised funding will be spent in 2013-14;
• $1.4 million saving in employee expenses due to the Department having vacant positions and the establishment of a new staffing structure, aligned to output deliverables, in preparation for the required employee budget saving from 1 July 2013; and
• $0.2 million under-spend in the repairs and maintenance program managed by the Department of Infrastructure (DOI). This was due to reporting issues associated with the new asset management system and DOI staff vacancies.
department of land resource managementfinancial report For the year ended 30 June 2013

northern territory government Department of Land Resource Management | Annual Report 2012-13 41
Income – Where the dollars came from
The Department received income of $56.2 million in 2012-13, an increase of $2.1 million compared to budget.
This increase is predominately due to notional non cash revenue for corporate services provided by the Department of Corporate and Information Services (DCIS).
The Department is funded primarily through Northern Territory Parliamentary appropriation. The next major income source is Australian Government grants and appropriation, and grants from other external funding bodies. Charges for our goods and services also generate income for the Department. Notional revenue for corporate services provided by DCIS is also recognised.
Output Revenue
In 2012-13 output revenue of $35.5 million was received as budgeted. This included new additional funding for wildfire suppression of $1 million and $0.5 million for rangelands monitoring and operation of the Pastoral Land Board.
Output revenue funds the following Department outputs:-
• Flora and Fauna;
• Rangelands;
• Water Resources;
• Bushfires; and
• Multi-Agency services.
Grants and Commonwealth Appropriation
The Department attracts 16.7 percent of its revenue from external sources. In 2012-13, $9.3 million was received compared to a budget of $9 million, including $5.4 million from the Australian Government. There are a number of externally funded projects with the top five being:-
• Caring for our Country $4.1 million;
• West Arnhem Fire Management $1.5 million;
• Community water-wise grant rebates $0.8 million;
• Long Term Ecological Research Network project $0.5 million; and
• Protection Ecosystem Daly Catchment $0.5 million.
Sale of Goods and Services
In 2012-13, income from the sale of goods and services totalled $6.6 million in accordance with budget. The most significant income streams are for the provision of corporate services to three other departments and a Government Business Division totalling $4.1 million, and the provision of drilling and water services valued at $1 million.
Goods and Services Received Free of Charge
In 2012-13, notional goods and services received free of charge from DCIS totalled $4.6 million, $1.7 million higher than budget.
This income is offset by a matching notional expense item to allow the Department to bring to account the full cost of corporate services it requires to operate so does not affect the net loss.
Output Revenue $35 540Grant & Commonwealth Appropriation $9 320Sale of Goods and Services $6 626Goods Received Free of Charge $4 641Other Revenue $74
2012-13 Income by Source $000’s

northern territory government Department of Land Resource Management | Annual Report 2012-1342
Expenses – Where the dollars were spent
The Department incurred $55.3 million in expenses during 2012-13 in the delivery of its programs and services. This was $0.2 million less than budget.
Payments to employees and purchase of goods and services account for 74 percent of the Department’s outlays. Payments of grants and subsidies and repairs and maintenance are the other major Departmental expenses, with depreciation and corporate charges levied by DCIS representing non-cash transactions.
Employee Expenses
Staffing costs represent 46.2 percent or $25.5 million of total expenditure.
In 2012-13 the Department established a new staffing structure in preparation for the employee budget savings required for the new financial year. This restructure, and delays in filling vacant positions, resulted in a budget saving of $1.4 million.
Goods and Services Expenses
Actual spend on the purchase of goods and services in 2012-13 was $15 million. The saving of $1 million compared to budget was primarily as a result of timing delays experienced on external funded and specific projects where the costs will now be incurred in 2013-14.
Grants and Subsidies
In 2012-13 the Department distributed $8.1 million in grants and subsidies against a $7.4 million budget.
The increase was mainly due to externally funded grant payments of $0.4 million relating to additional grant revenue received in 2012-13 and $0.2 million of contributions to national eradication programs for weeds.
Grant payments of $8.1 million relate to externally funded projects $5.6 million, grants to support bushfire volunteer brigades $1.1 million, community water-wise rebates $0.9 million and $0.5 million to support natural resource management outcomes.
Repairs and Maintenance
Actual repairs and maintenance expenditure was $1 million against
a budget of $1.2 million. The underspend of $0.2 million relates to implementation problems associated with the introduction of a new asset management system.
Goods and Services Received Free of Charge (Notional)
In 2012-13, notional goods and services received free of charge totalled $4.6 million, an increase of $1.7 million compared with budget.
Employee Expenses $25 483Purchase of Goods and Services $15 023Repairs and Maintenance $1 017Grants and Subsidies $8 107Depreciation and Amortisation $795Other including DCIS Services received Free of Charge $4 652
2012-13 Expenses by Source $000’s
northern territory government Department of Land Resource Management | Annual Report 2012-13 43
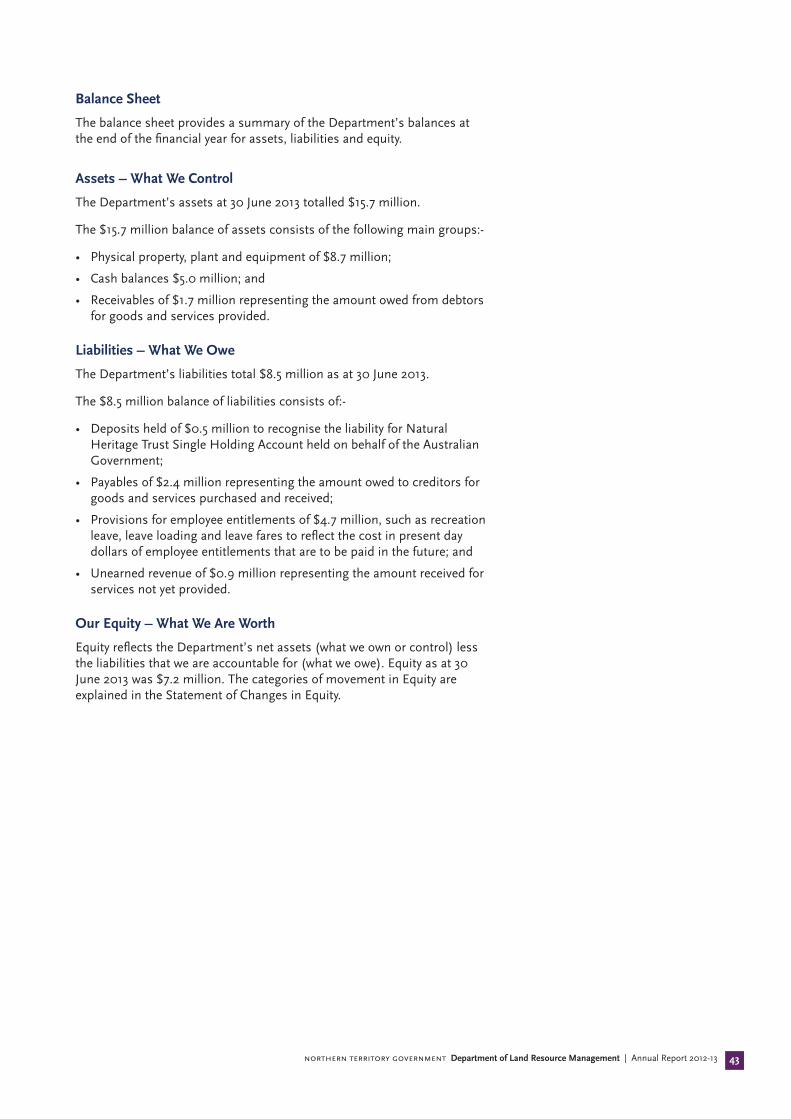
Balance Sheet
The balance sheet provides a summary of the Department’s balances at the end of the financial year for assets, liabilities and equity.
Assets – What We Control
The Department’s assets at 30 June 2013 totalled $15.7 million.
The $15.7 million balance of assets consists of the following main groups:-
• Physical property, plant and equipment of $8.7 million;
• Cash balances $5.0 million; and
• Receivables of $1.7 million representing the amount owed from debtors for goods and services provided.
Liabilities – What We Owe
The Department’s liabilities total $8.5 million as at 30 June 2013.
The $8.5 million balance of liabilities consists of:-
• Deposits held of $0.5 million to recognise the liability for Natural Heritage Trust Single Holding Account held on behalf of the Australian Government;
• Payables of $2.4 million representing the amount owed to creditors for goods and services purchased and received;
• Provisions for employee entitlements of $4.7 million, such as recreation leave, leave loading and leave fares to reflect the cost in present day dollars of employee entitlements that are to be paid in the future; and
• Unearned revenue of $0.9 million representing the amount received for services not yet provided.
Our Equity – What We Are Worth
Equity reflects the Department’s net assets (what we own or control) less the liabilities that we are accountable for (what we owe). Equity as at 30 June 2013 was $7.2 million. The categories of movement in Equity are explained in the Statement of Changes in Equity.

northern territory government Department of Land Resource Management | Annual Report 2012-1344
Statement of Changes in Equity
This statement expands on the equity movements in the categories of capital, reserves and accumulated funds.
Movements in capital of $257.3 million relate to:-
• $259 million from the transfer out of the Department of assets and liabilities relating to the Government restructure.
Offset by:-
• $0.3 million for capital works;
• $0.9 million cash equity injection to replenish cash balances; and
• $ 0.5 million from the transfer in of completed work in progress property, plant and equipment.
The Department’s revaluation reserves total $1.9 million at 30 June 2013. The reduction of $142.6 million is a result of the transfer out of the Department of re-valued land, buildings and infrastructure following the government restructure.
Accumulated funds move each year by the profit or loss of the Department. In 2012-13 accumulated funds increased by $1.1 million representing the 2012-13 reported profit.
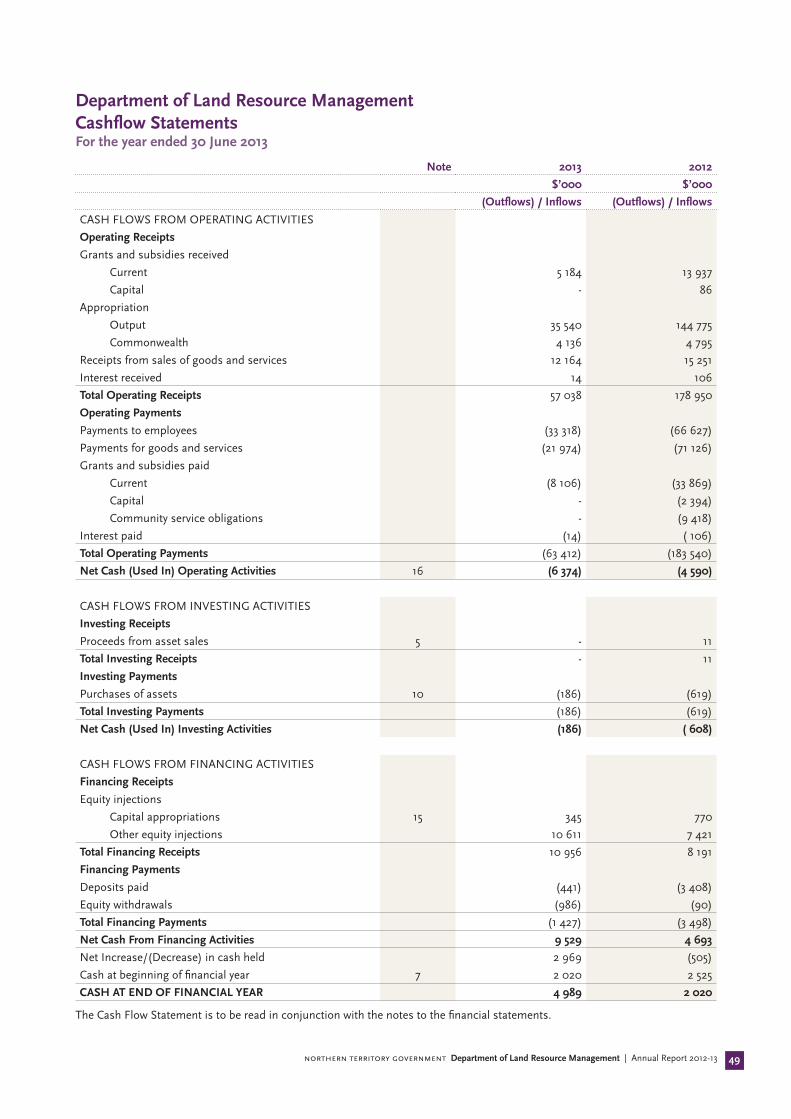
Cash Flow Statement
The cash flow statement provides information on how cash was received and spent during the year.
The Department’s cash balances were $5 million at 30 June 2013.
The cash flows are summarised as follows:
2013
$’000
Cash received 67 994
Less Cash spent (65 025)
Net increase in Cash Held 2 969
Cash at Beginning of Financial Year 2 020
Cash at End of Financial Year 4 989

northern territory government Department of Land Resource Management | Annual Report 2012-13 45
Certification of the financial statements
We certify that the attached financial statements for the Department of Land Resource Management have been prepared from proper accounts and records in accordance with the prescribed format, the Financial Management Act and Treasurer’s Directions.
We further state that the information set out in the Comprehensive Operating Statement, Balance Sheet, Statement of Changes in Equity, Cash Flow Statement, and notes to and forming part of the financial statements, presents fairly the financial performance and cash flows for the year ended 30 June 2013 and the financial position on that date.
At the time of signing, we are not aware of any circumstances that would render the particulars included in the financial statements misleading or inaccurate.
Rod Applegate Joanna Frankenfeld Chief Executive Officer Chief Financial Officer
30 August 2013 30 August 2013
northern territory government Department of Land Resource Management | Annual Report 2012-1346
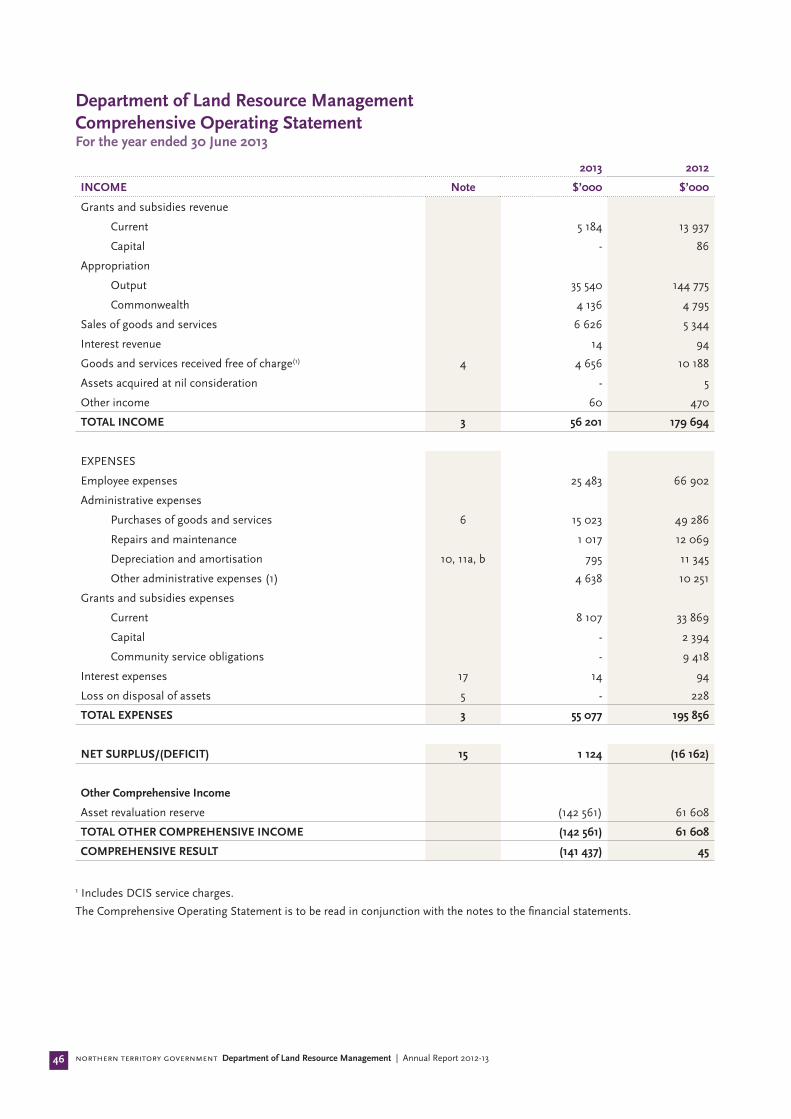
Department of Land Resource Management Comprehensive Operating Statement For the year ended 30 June 2013
2013 2012
INCOME Note $’000 $’000
Grants and subsidies revenue
Current 5 184 13 937
Capital - 86
Appropriation
Output 35 540 144 775
Commonwealth 4 136 4 795
Sales of goods and services 6 626 5 344
Interest revenue 14 94
Goods and services received free of charge(1) 4 4 656 10 188
Assets acquired at nil consideration - 5
Other income 60 470
TOTAL INCOME 3 56 201 179 694
EXPENSES
Employee expenses 25 483 66 902
Administrative expenses
Purchases of goods and services 6 15 023 49 286
Repairs and maintenance 1 017 12 069
Depreciation and amortisation 10, 11a, b 795 11 345
Other administrative expenses (1) 4 638 10 251
Grants and subsidies expenses
Current 8 107 33 869
Capital - 2 394
Community service obligations - 9 418
Interest expenses 17 14 94
Loss on disposal of assets 5 - 228
TOTAL EXPENSES 3 55 077 195 856
NET SURPLUS/(DEFICIT) 15 1 124 (16 162)
Other Comprehensive Income
Asset revaluation reserve (142 561) 61 608
TOTAL OTHER COMPREHENSIVE INCOME (142 561) 61 608
COMPREHENSIVE RESULT (141 437) 45
1 Includes DCIS service charges.
The Comprehensive Operating Statement is to be read in conjunction with the notes to the financial statements.
northern territory government Department of Land Resource Management | Annual Report 2012-13 47
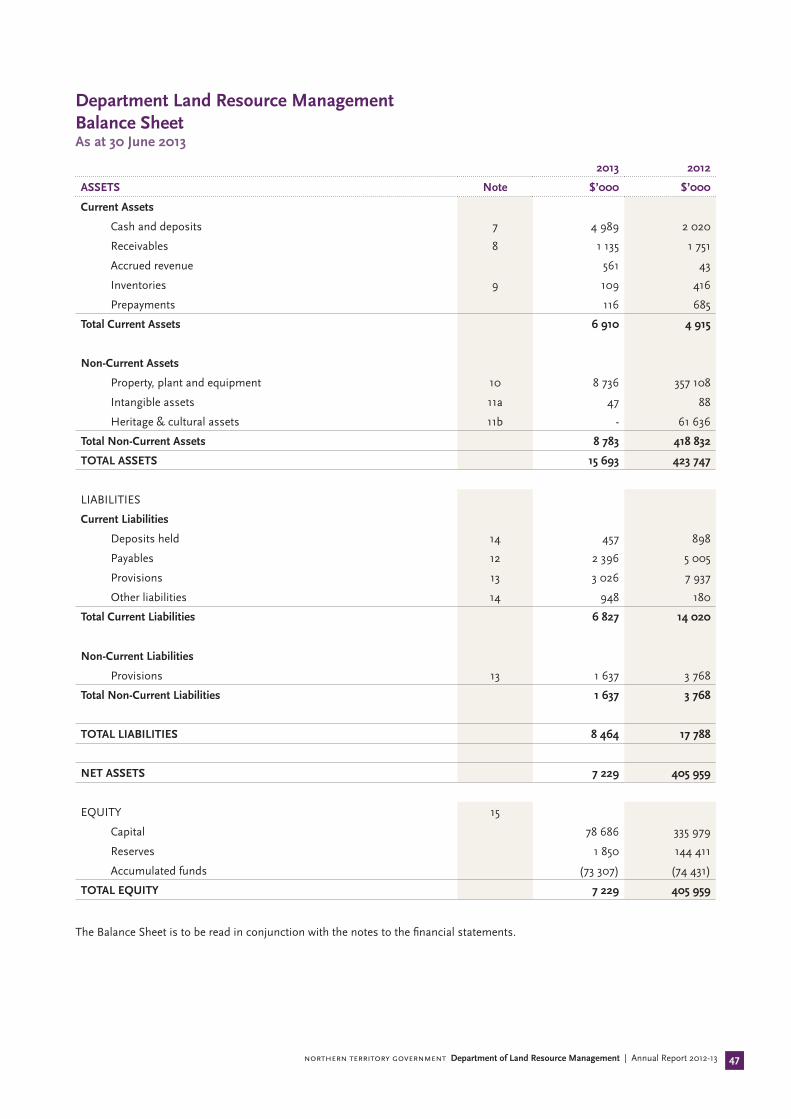
Department Land Resource Management Balance Sheet As at 30 June 2013
2013 2012
ASSETS Note $’000 $’000
Current Assets
Cash and deposits 7 4 989 2 020
Receivables 8 1 135 1 751
Accrued revenue 561 43
Inventories 9 109 416
Prepayments 116 685
Total Current Assets 6 910 4 915
Non-Current Assets
Property, plant and equipment 10 8 736 357 108
Intangible assets 11a 47 88
Heritage & cultural assets 11b - 61 636
Total Non-Current Assets 8 783 418 832
TOTAL ASSETS 15 693 423 747
LIABILITIES
Current Liabilities
Deposits held 14 457 898
Payables 12 2 396 5 005
Provisions 13 3 026 7 937
Other liabilities 14 948 180
Total Current Liabilities 6 827 14 020
Non-Current Liabilities
Provisions 13 1 637 3 768
Total Non-Current Liabilities 1 637 3 768
TOTAL LIABILITIES 8 464 17 788
NET ASSETS 7 229 405 959
EQUITY 15
Capital 78 686 335 979
Reserves 1 850 144 411
Accumulated funds (73 307) (74 431)
TOTAL EQUITY 7 229 405 959
The Balance Sheet is to be read in conjunction with the notes to the financial statements.

northern territory government Department of Land Resource Management | Annual Report 2012-1348
Department of Land Resource Management Statement Of Changes In Equity For the year ended 30 June 2013
2012-13 Equity at 1 July Comprehensive Result
Transactions with owners in their
capacity as owners
Equity at 30 June
Note $’000 $’000 $’000 $’000
Accumulated Funds (74 431) 1 124 - (73 307)
Reserves
Asset Revaluation Reserve 15 144 411 (142 561) - 1 850
Capital –Transactions with Owners 335 979 - - 335 979
Equity Injections
Capital Appropriation
Capital Appropriation - - 345 345
Equity Transfers In - - 464 464
Other equity injections - - 10 611 10 611
Equity Withdrawals
Equity Transfer Out - - (268 713) (268 713)
335 979 - (257 293) 78 686
TOTAL EQUITY AT 30 JUNE 405 959 (141 437) (257 293) 7 229
2011-12 Equity at 1 July Comprehensive Result
Transactions with owners in their
capacity as owners
Equity at 30 June
Note $’000 $’000 $’000 $’000
Accumulated Funds (58 269) (16 162) - (74 431)
Reserves
Asset Revaluation Reserve 15 82 803 61 608 - 144 411
Capital –Transactions with Owners 261 449 - - 261 449
Equity Injections
Capital Appropriation
Capital Appropriation - - 770 770
Equity Transfers In - - 66 437 66 437
Other equity injections - - 7 421 7 421
Equity Withdrawals
Equity Transfer Out - - (98) (98)
261 449 - 74 530 335 979
TOTAL EQUITY AT 30 JUNE 285 983 45 446 74 530 405 959
northern territory government Department of Land Resource Management | Annual Report 2012-13 49
Department of Land Resource Management Cashflow Statements For the year ended 30 June 2013
Note 2013 2012
$’000 $’000
(Outflows) / Inflows (Outflows) / Inflows
CASH FLOWS FROM OPERATING ACTIVITIES
Operating Receipts
Grants and subsidies received
Current 5 184 13 937
Capital - 86
Appropriation
Output 35 540 144 775
Commonwealth 4 136 4 795
Receipts from sales of goods and services 12 164 15 251
Interest received 14 106
Total Operating Receipts 57 038 178 950
Operating Payments
Payments to employees (33 318) (66 627)
Payments for goods and services (21 974) (71 126)
Grants and subsidies paid
Current (8 106) (33 869)
Capital - (2 394)
Community service obligations - (9 418)
Interest paid (14) ( 106)
Total Operating Payments (63 412) (183 540)
Net Cash (Used In) Operating Activities 16 (6 374) (4 590)
CASH FLOWS FROM INVESTING ACTIVITIES
Investing Receipts
Proceeds from asset sales 5 - 11
Total Investing Receipts - 11
Investing Payments
Purchases of assets 10 (186) (619)
Total Investing Payments (186) (619)
Net Cash (Used In) Investing Activities (186) ( 608)
CASH FLOWS FROM FINANCING ACTIVITIES
Financing Receipts
Equity injections
Capital appropriations 15 345 770
Other equity injections 10 611 7 421
Total Financing Receipts 10 956 8 191
Financing Payments
Deposits paid (441) (3 408)
Equity withdrawals (986) (90)
Total Financing Payments (1 427) (3 498)
Net Cash From Financing Activities 9 529 4 693
Net Increase/(Decrease) in cash held 2 969 (505)
Cash at beginning of financial year 7 2 020 2 525
CASH AT END OF FINANCIAL YEAR 4 989 2 020
The Cash Flow Statement is to be read in conjunction with the notes to the financial statements.

northern territory government Department of Land Resource Management | Annual Report 2012-1350
Department of Land Resource Management Notes to the Financial Statements For the year ended 30 June 2013
Index of notes to the Financial Statements
1. Objectives and Funding
2. Statement of Significant Accounting Policies
3. Comprehensive Operating Statement by Output Group
INCOME
4. Goods and Services Received Free of Charge
5. Loss on Disposal of Assets
EXPENSES
6. Purchases of Goods and Services
ASSETS
7. Cash and Deposits
8. Receivables
9. Inventories
10. Property, Plant and Equipment
11a. Intangibles
11b. Heritage and Cultural Assets
LIABILITIES
12. Payables
13. Provisions
14. Other Liabilities
EQUITY
15. Equity
OTHER DISCLOSURES
16. Notes to the Cash Flow Statement
17. Financial Instruments
18. Commitments
19. Contingent Liabilities and Contingent Assets
20. Events Subsequent to Balance Sheet Date
21. Accountable Officer’s Trust Account
22. Write-offs, Postponements, Waivers, Gifts and Ex Gratia Payments
23. Schedule of Territory Items

northern territory government Department of Land Resource Management | Annual Report 2012-13 51
1. Objectives and Funding
The Department of Land Resource Management’s purpose is to provide advice and support for the sustainable development of the Northern Territory’s land and water, and conservation of its unique native flora and fauna. The Department of Land Resource Management’s goals are as follows:-
1. The capacity and capability of the Northern Territory’s natural resource assets are assessed, and outcomes of use and management, monitored.
2. Enable economic growth through the allocation of natural resource assets for best and sustainable use.
3. Threats to natural resources and regional communities are managed through shared responsibilities and partnerships.
4. An organisation with the capacity and capability to deliver effective services.
Additional information in relation to the Department and its principal activities may be found in section one and two of the Annual Report.
The Department is predominantly funded by, and dependent on, the receipt of Parliamentary appropriation. The financial statements encompass all funds through which the Department controls resources to carry on its functions and deliver outputs. For reporting purposes, outputs delivered by the Department are summarised into five Output Groups as follows:
• Flora and Fauna
• Rangelands
• Water Resources
• Bushfires
• Multi Agency Services
Note 3 provides summary financial information in the form of a Comprehensive Operating Statement by Output Group.
2. Statement of Significant Accounting Policies
(a) Basis of Accounting
The financial statements have been prepared in accordance with the requirements of the Financial Management Act and related Treasurer’s Directions. The Financial Management Act requires the Department of Land Resource Management to prepare financial statements for the year ended 30 June based on the form determined by the Treasurer. The Department financial statements are to include:
(i) a Certification of the Financial Statements;
(ii) a Comprehensive Operating Statement;
(iii) a Balance Sheet;
(iv) a Statement of Changes in Equity;
(v) a Cash Flow Statement; and
(vi) applicable explanatory notes to the financial statements.
The financial statements have been prepared using the accrual basis of accounting, which recognises the effect of financial transactions and events when they occur, rather than when cash is paid out or received. As part of the preparation of the financial statements, all intra Department transactions and balances have been eliminated.
Except where stated, the financial statements have also been prepared in accordance with the historical cost convention.
The form of the Department financial statements is also consistent with the requirements of Australian Accounting Standards. The effects of all relevant new and revised Standards and Interpretations issued by the Australian Accounting Standards Board (AASB) that are effective for the current annual reporting period have been evaluated.
(b) Australian Accounting Standards and Interpretations Issued but not yet Effective
At the date of authorisation of the financial statements, the Standards and Interpretations listed below were in issue but not yet effective.
AASB 9 Financial Instruments (Dec 2010), AASB 2010-7 Amendments to Australian Accounting Standards arising from AASB 9 (Dec 2010) [AASB 1, 3, 4, 5, 7, 101, 102, 108, 112, 118, 120, 121, 127, 128, 131, 132, 136, 137, 139, 1023 & 1038 and Interpretations 2, 5, 10, 12, 19 & 127] AASB 2012-16 Amendments to Australian Accounting Standards- Mandatory Effective Date of AASB 9 and Transition Disclosures [AASB 9, 2009-11, 2010-7, 2011-7 & 2011-8]
AASB 9 incorporates revised requirements for the classification and measurement of financial instruments resulting from the IASB’s project to replace IAS 39 Financial Instruments: Recognition and Measurement (AASB 139 Financial Instruments: Recognition and Measurement). Effective for annual reporting periods beginning on or after 1 Jan 2015.
northern territory government Department of Land Resource Management | Annual Report 2012-1352
AASB 13 Fair Value Measurement, AASB 2011-8 Amendments to Australian Accounting Standards arising from AASB 13 [AASB 1, 2, 3, 4, 5, 7, 9, 2009-11, 2010 7, 101, 102, 108, 110, 116, 117, 118, 119, 120, 121, 128, 131, 132, 133, 134, 136, 138, 139, 140, 141, 1004, 1023 & 1038 and Interpretations 2, 4, 12, 13, 14, 17, 19, 131 & 132]
Replaces the guidance on fair value measurement in existing AASB accounting literature with a single standard. The Standard defines fair value, provides guidance on how to determine fair value and requires disclosures about fair value measurements. Effective for annual reporting periods beginning on or after 1 Jan 2013.
AASB 119 Employee Benefits (2011), AASB 2011-10 Amendments to Australian Accounting Standards arising from AASB 119 (2011) [AASB 1, 8, 101, 124, 134, 1049 & 2011-8 and Interpretation 14].
Changes the definition of short-term employee benefits and the measurement and recognition of defined benefit superannuation obligations. Effective for annual reporting periods beginning on or after 1 Jan 2013.
AASB 2012-5 Amendments to Australian Accounting Standards arising from Annual Improvements 2009-2011 Cycle [AASB 1, 101, 116, 132 & 134 and Interpretation 2]
Amends a number of pronouncements as a result of the 2009-2011 annual improvements cycle. Amendments include clarification of the requirements for comparative information in AASB 101 Presentation of Financial Statements and clarification of servicing equipment in AASB 116 Property, Plant and Equipment. Effective for annual reporting periods beginning on or after 1 Jan 2013.
The Standards will not have a financial impact on the financial statements but will require a number of changes in disclosures.
(c) Department and Territory Items
The financial statements of the Department of Land Resource Management include income, expenses, assets, liabilities and equity over which the Department has control (Department items). Certain items, while managed by the Department, are controlled and recorded by the Territory rather than the Department (Territory items). Territory items are recognised and recorded by the Central Holding Authority as discussed below.
Central Holding Authority
The Central Holding Authority is the ‘parent body’ that represents the Government’s ownership interest in Government-controlled entities.
The Central Holding Authority also records all Territory items, such as income, expenses, assets and liabilities controlled by the Government and managed by agencies
on behalf of the Government. The main Territory item is Territory income, which includes taxation and royalty revenue, Commonwealth general purpose funding (such as GST revenue), fines, and statutory fees and charges.
The Central Holding Authority also holds certain Territory assets not assigned to agencies as well as certain Territory liabilities that are not practical or effective to assign to individual agencies such as unfunded superannuation and long service leave.
The Central Holding Authority recognises and records all Territory items, and as such, these items are not included in the Department’s financial statements. However, as the Department is accountable for certain Territory items managed on behalf of Government, these items have been separately disclosed in Note 23 – Schedule of Territory Items.
(d) Comparatives
Where necessary, comparative information for the 2011-12 financial year has been reclassified to provide consistency with current year disclosures. The comparatives are that of the former agency; Natural Resources, Environment, the Arts, and Sport.
(e) Presentation and Rounding of Amounts
Amounts in the financial statements and notes to the financial statements are presented in Australian dollars and have been rounded to the nearest thousand dollars, with amounts of $500 or less being rounded down to zero.
(f ) Changes in Accounting Policies
There have been no changes to accounting policies adopted in 2012-13 as a result of management decisions.
(g) Accounting Judgements and Estimates
The preparation of the financial report requires the making of judgements and estimates that affect the recognised amounts of assets, liabilities, revenues and expenses and the disclosure of contingent liabilities. The estimates and associated assumptions are based on historical experience and various other factors that are believed to be reasonable under the circumstances, the results of which form the basis of making the judgements about the carrying values of assets and liabilities that are not readily apparent from other sources. Actual results may differ from these estimates.
The estimates and underlying assumptions are reviewed on an ongoing basis. Revisions to accounting estimates are recognised in the period in which the estimate is revised if the revision affects only that period, or in the period of the revision and future periods if the revision affects both current and future periods.
Judgements and estimates that have significant effects on the financial statements are disclosed in the relevant

northern territory government Department of Land Resource Management | Annual Report 2012-13 53
notes to the financial statements. Notes that include significant judgements and estimates are:
• Employee Benefits – Note 2(t) and Note 13: Non-current liabilities in respect of employee benefits are measured as the present value of estimated future cash outflows based on the appropriate Government bond rate, estimates of future salary and wage levels and employee periods of service.
• Contingent Liabilities – Note 19: The present value of material quantifiable contingent liabilities are calculated using a discount rate based on the published 10-year Government bond rate.
• Doubtful Debts – Note 2(o) & Note 8: Receivables; and
• Depreciation and Amortisation – Note 2(k), Note 10: Property, Plant and Equipment and Note 11(a) and 11(b).
(h) Goods and Services Tax
Income, expenses and assets are recognised net of the amount of Goods and Services Tax (GST), except where the amount of GST incurred on a purchase of goods and services is not recoverable from the Australian Tax Office (ATO). In these circumstances the GST is recognised as part of the cost of acquisition of the asset or as part of the expense.
Receivables and payables are stated with the amount of GST included. The net amount of GST recoverable from, or payable to, the ATO is included as part of receivables or payables in the Balance Sheet.
Cash flows are included in the Cash Flow Statement on a gross basis. The GST components of cash flows arising from investing and financing activities, which are recoverable from, or payable to, the ATO are classified as operating cash flows. Commitments and contingencies are disclosed net of the amount of GST recoverable or payable unless otherwise specified.
(i) Income Recognition
Income encompasses both revenue and gains.
Income is recognised at the fair value of the consideration received, exclusive of the amount of GST . Exchanges of goods or services of the same nature and value without any cash consideration being exchanged are not recognised as income.
Grants and Other Contributions
Grants, donations, gifts and other non-reciprocal contributions are recognised as revenue when the Department obtains control over the assets comprising the contributions. Control is normally obtained upon receipt.
Contributions are recognised at their fair value. Contributions of services are only recognised when a fair
value can be reliably determined and the services would be purchased if not donated.
Appropriation
Output Appropriation is the operating payment to each agency for the outputs they provide and is calculated as the net cost of agency outputs after taking into account funding from agency income. It does not include any allowance for major non-cash costs such as depreciation.
Commonwealth appropriation follows from the Intergovernmental Agreement on Federal Financial Relations, resulting in Special Purpose Payments (SPPs) and National Partnership (NP) payments being made by the Commonwealth Treasury to state treasuries, in a manner similar to arrangements for GST payments. These payments are received by Treasury on behalf of the Central Holding Authority and then on passed to the relevant agencies as Commonwealth appropriation.
Revenue in respect of appropriations is recognised in the period in which the Department gains control of the funds.
Sale of Goods
Revenue from the sale of goods is recognised (net of returns, discounts and allowances) when:
• the significant risks and rewards of ownership of the goods have transferred to the buyer;
• the Department retains neither continuing managerial involvement to the degree usually associated with ownership nor effective control over the goods sold;
• the amount of revenue can be reliably measured;
• it is probable that the economic benefits associated with the transaction will flow to the Department; and
• the costs incurred or to be incurred in respect of the transaction can be measured reliably.
Rendering of Services
Revenue from rendering services is recognised by reference to the stage of completion of the contract. The revenue is recognised when:
• the amount of revenue, stage of completion and transaction costs incurred can be reliably measured; and
• it is probable that the economic benefits associated with the transaction will flow to the entity.
Interest Revenue
Interest revenue is recognised as it accrues, taking into account the effective yield on the financial asset.
northern territory government Department of Land Resource Management | Annual Report 2012-1354
Goods and Services Received Free of Charge
Goods and services received free of charge are recognised as revenue when a fair value can be reliably determined and the resource would have been purchased if it had not been donated. Use of the resource is recognised as an expense.
Disposal of Assets
A gain or loss on disposal of assets is included as a gain or loss on the date control of the asset passes to the buyer, usually when an unconditional contract of sale is signed. The gain or loss on disposal is calculated as the difference between the carrying amount of the asset at the time of disposal and the net proceeds on disposal. Refer also to Note 5.
Contributions of Assets
Contributions of assets and contributions to assist in the acquisition of assets, being non-reciprocal transfers, are recognised, unless otherwise determined by Government, as gains when the Department obtains control of the asset or contribution. Contributions are recognised at the fair value received or receivable.
(j) Repairs and Maintenance Expense
Funding is received for repairs and maintenance works associated with Department assets as part of output revenue. Costs associated with repairs and maintenance works on Department assets are expensed as incurred.
(k) Depreciation and Amortisation Expense
Items of property, plant and equipment, including buildings but excluding land, have limited useful lives and are depreciated or amortised using the straight-line method over their estimated useful lives.
Amortisation applies in relation to intangible non-current assets with limited useful lives and is calculated and accounted for in a similar manner to depreciation.
The estimated useful lives for each class of asset are in accordance with the Treasurer’s Directions and are determined as follows:
2013 2012
Buildings 50 Years 50 Years
Infrastructure Assets 8-50 Years 8-50 Years
Plant and Equipment 10 Years 10 Years
Leased Plant and Equipment
3-5 Years 3-5 Years
Transport Equipment 10 Years 10 Years
Computer Hardware 3-6 Years 3-6 Years
Heritage and Cultural Assets
100 Years 100 Years
Intangibles – Computer Software
3-6 Years 3-6 Years
Assets are depreciated or amortised from the date of acquisition or from the time an asset is completed and held ready for use.
(l) Interest Expense
Interest expenses include interest and finance lease charges. Interest expenses are expensed in the period in which they are incurred.
(m) Cash and Deposits
For the purposes of the Balance Sheet and the Cash Flow Statement, cash includes cash on hand, cash at bank and cash equivalents. Cash equivalents are highly liquid short-term investments that are readily convertible to cash. Cash at bank includes monies held in the Accountable Officer’s Trust Account that are ultimately payable to the beneficial owner – refer also to Note 21.
(n) Inventories
Inventories include assets held either for sale (general inventories) or for distribution at no or nominal consideration in the ordinary course of business operations.
General inventories are valued at the lower of cost and net realisable value, while those held for distribution are carried at the lower of cost and current replacement cost. Cost of inventories include all costs associated with bringing the inventories to their present location and condition. When inventories are acquired at no or nominal consideration, the cost will be the current replacement cost at date of acquisition.
The cost of inventories are assigned using a mixture of first-in, first out or weighted average cost formula or using specific identification of their individual costs.
Inventory held for distribution are regularly assessed for obsolescence and loss.
(o) Receivables
Receivables include accounts receivable and other receivables and are recognised at fair value less any allowance for impairment losses.
The allowance for impairment losses represents the amount of receivables the Department estimates are likely to be uncollectible and are considered doubtful. Analysis of the age of the receivables that are past due as at the reporting date are disclosed in an aging schedule under credit risk in Note 17 Financial Instruments. Reconciliation of changes in the allowance accounts is also presented.
Accounts receivable are generally settled within 30 days.

northern territory government Department of Land Resource Management | Annual Report 2012-13 55
(p) Property, Plant and Equipment Acquisitions
All items of property, plant and equipment with a cost, or other value, equal to or greater than $10 000 are recognised in the year of acquisition and depreciated as outlined below. Items of property, plant and equipment below the $10 000 threshold are expensed in the year of acquisition.
The construction cost of property, plant and equipment includes the cost of materials and direct labour, and an appropriate proportion of fixed and variable overheads.
Complex Assets
Major items of plant and equipment comprising a number of components that have different useful lives, are accounted for as separate assets. The components may be replaced during the useful life of the complex asset.
Subsequent Additional Costs
Costs incurred on property, plant and equipment subsequent to initial acquisition are capitalised when it is probable that future economic benefits in excess of the originally assessed performance of the asset will flow to the Department in future years. Where these costs represent separate components of a complex asset they are accounted for as separate assets and are separately depreciated over their expected useful lives.
Construction (Work in Progress)
As part of the financial management framework, the Department of Infrastructure is responsible for managing general government capital works projects on a whole of Government basis. Therefore appropriation for the Department’s capital works is provided directly to the Department of Infrastructure and the cost of construction work in progress is recognised as an asset of that Department. Once completed, capital works assets are transferred to this Department.
(q) Revaluations and Impairment
Revaluation of Assets
Subsequent to initial recognition, assets belonging to the following classes of non-current assets are revalued with sufficient regularity to ensure that the carrying amount of these assets does not differ materially from their fair value at reporting date:
• land;
• buildings;
• infrastructure assets;
• heritage and cultural assets; and
• intangibles.
Fair value is the amount for which an asset could be exchanged, or liability settled, between knowledgeable,
willing parties in an arms-length transaction.
Plant and equipment are stated at historical cost less depreciation, which is deemed to equate to fair value.
The unique nature of some of the heritage and cultural assets may preclude reliable measurement.
Impairment of Assets
An asset is said to be impaired when the asset’s carrying amount exceeds its recoverable amount.
Non-current physical and intangible Department assets are assessed for indicators of impairment on an annual basis. If an indicator of impairment exists, the Department determines the asset’s recoverable amount. The asset’s recoverable amount is determined as the higher of the asset’s depreciated replacement cost and fair value less costs to sell. Any amount by which the asset’s carrying amount exceeds the recoverable amount is recorded as an impairment loss.
Impairment losses are recognised in the Comprehensive Operating Statement unless the asset is carried at a revalued amount. Where the asset is measured at a revalued amount, the impairment loss is offset against the Asset Revaluation Reserve for that class of asset to the extent that an available balance exists in the Asset Revaluation Reserve.
In certain situations, an impairment loss may subsequently be reversed. Where an impairment loss is subsequently reversed, the carrying amount of the asset is increased to the revised estimate of its recoverable amount. A reversal of an impairment loss is recognised in the Comprehensive Operating Statement as income, unless the asset is carried at a revalued amount, in which case the impairment reversal results in an increase in the asset revaluation reserve. Note 15 provides additional information in relation to the asset revaluation reserve.
(r) Leased Assets
Leases under which the Department assumes substantially all the risks and rewards of ownership of an asset are classified as finance leases. Other leases are classified as operating leases.
Finance Leases
Finance leases are capitalised. A leased asset and a lease liability equal to the present value of the minimum lease payments are recognised at the inception of the lease.
Lease payments are allocated between the principal component of the lease liability and the interest expense.

northern territory government Department of Land Resource Management | Annual Report 2012-1356
Operating Leases
Operating lease payments made at regular intervals throughout the term are expensed when the payments are due, except where an alternative basis is more representative of the pattern of benefits to be derived from the leased property. Lease incentives under an operating lease of a building or office space is recognised as an integral part of the consideration for the use of the leased asset. Lease incentives are to be recognised as a deduction of the lease expenses over the term of the lease.
(s) Payables
Liabilities for accounts payable and other amounts payable are carried at cost, which is the fair value of the consideration to be paid in the future for goods and services received, whether or not billed to the Department. Accounts payable are normally settled within 30 days.
(t) Employee Benefits
Provision is made for employee benefits accumulated as a result of employees rendering services up to the reporting date. These benefits include wages and salaries and recreation leave. Liabilities arising in respect of wages and salaries, recreation leave and other employee benefit liabilities that fall due within twelve months of reporting date are classified as current liabilities and are measured at amounts expected to be paid. Non-current employee benefit liabilities that fall due after twelve months of the reporting date are measured at present value, calculated using the Government long term bond rate.
No provision is made for sick leave, which is non-vesting, as the anticipated pattern of future sick leave to be taken is less than the entitlement accruing in each reporting period.
Employee benefit expenses are recognised on a net basis in respect of the following categories:
1. wages and salaries, non-monetary benefits, recreation leave, sick leave and other leave entitlements; and
2. other types of employee benefits.
As part of the financial management framework, the Central Holding Authority assumes the long service leave liabilities of Government agencies, including the Department of Land Resource Management, and as such no long service leave liability is recognised in the Department financial statements.
(u) Superannuation
Employees’ superannuation entitlements are provided through the:
• Northern Territory Government and Public Authorities Superannuation Scheme (NTGPASS);
• Commonwealth Superannuation Scheme (CSS); or
• non-government employee nominated schemes for those employees commencing on or after 10 August 1999.
The Department makes superannuation contributions on behalf of its employees to the Central Holding Authority or non-government employee nominated schemes. Superannuation liabilities related to government superannuation schemes are held by the Central Holding Authority and as such are not recognised in Department financial statements.
(v) Contributions by and Distributions to Government
The Department may receive contributions from Government where the Government is acting as owner of the Department. Conversely, the Department may make distributions to Government. In accordance with the Financial Management Act and Treasurer’s Directions, certain types of contributions and distributions, including those relating to administrative restructures, have been designated as contributions by, and distributions to, Government. These designated contributions and distributions are treated by the Department as adjustments to equity.
The Statement of Changes in Equity provide additional information in relation to contributions by, and distributions to, Government.
(w) Commitments
Disclosures in relation to capital and other commitments, including lease commitments are shown at Note 18.
Commitments are those contracted as at 30 June where the amount of the future commitment can be reliably measured.

northern territory government Department of Land Resource Management | Annual Report 2012-13 57
3. Comprehensive Operating Statement by Output Group 2013 only
Flora and Fauna
Rangelands Water Resources
Bushfires Multi Agency
Services
Total
2013 2013 2013 2013 2013 2013
$’000 $’000 $’000 $’000 $’000 $’000
Income
Grants and Subsidies Revenue
Current 1 044 685 1 362 2 093 - 5 184
Appropriation
Output 6 900 8 959 10 839 6 139 2 703 35 540
Commonwealth - - 4 136 - - 4 136
Sales of Goods and Services 144 105 1 212 1 102 4 063 6 626
Interest Revenue - - 14 - - 14
Goods & Services Received Free of Charge
835 975 2 135 696 - 4 641
Other Income - - 1 - 59 60
Total Income 8 923 10 724 19 699 10 030 6 825 56 201
Expenses
Employee Expenses 4 028 4 967 8 665 3 034 4 789 25 483
Administration Expenses
Purchase of Goods and Services 3 718 2 160 4 389 3 469 1 287 15 023
Repairs and Maintenance 63 359 280 315 - 1 017
Depreciation and Amortisation 47 43 476 168 61 795
Other Administration Expenses 835 975 2 132 696 - 4 638
Grants and Subsidies Expenses
Current 80 755 4 701 2 571 - 8 107
Interest Expense - - 14 - - 14
Total Expenses 8 771 9 259 20 657 10 253 6 137 55 077
Net Surplus/(Deficit) 152 1 465 (958) (223) 688 1 124
2013 2012
$’000 $’000
4. Goods and services received free of charge
Corporate and information services 4 656 10 188
5. Loss on disposal of assets
Net proceeds from the disposal of non-current assets - 11
Less: Carrying value of non-current assets disposed - 239
(Loss) on the disposal of non-current assets - (228)
6. Purchases of goods and services
The net surplus/(deficit) has been arrived at after charging the following expenses:
Goods and services expenses:
Consultants (1) 261 2 353
Advertising (2) 128 1 055
Marketing and promotion (3) 99 1 463
Legal expenses (4) 96 528

northern territory government Department of Land Resource Management | Annual Report 2012-1358
2013 2012
$’000 $’000
Recruitment (5) 64 186
Training and study 297 1 026
Official duty fares 1 913 2 656
Travelling allowance 375 884
(1) Includes marketing, promotion and IT consultants.
(2) Does not include recruitment advertising
(3) excludes advertising for marketing and promotion and marketing and promotion consultants’ expenses, which are incorporated in the consultants’ category.
(4) Includes legal fees, claim and settlement costs.
(5) Includes recruitment related advertising costs.
7. Cash and deposits
Cash on hand 4 19
Cash at bank 4 985 2 001
4 989 2 020
8. Receivables
Current
Accounts receivable 839 557
Less: Allowance for impairment losses (3) ( 37)
836 520
Interest receivables 1 1
GST receivables 298 1 230
Total Receivables 1 135 1 751
9. Inventories
General Inventories
At cost 109 416
Total Inventories 109 416
10. Property, plant and equipment
2013 2012
$’000 $’000
Land
At Fair Value 2 045 44 097
Buildings
At Fair Value 8 009 503 059
Less: Accumulated Depreciation (3 656) (209 196)
4 353 293 863
Infrastructure
At Fair Value 169 30 375
Less: Accumulated Depreciation (20) (15 891)
149 14 484
Plant and Equipment
At Fair Value 9 727 13 766
Less: Accumulated Depreciation (8 193) (10 408)
1 534 3 358
Leased Plant and Equipment

northern territory government Department of Land Resource Management | Annual Report 2012-13 59
2013 2012
$’000 $’000
At capitalised cost 8 30
Less: Accumulated Depreciation (8) ( 30)
- -
Computer Equipment
At Fair Value 548 819
Less: Accumulated Depreciation (481) ( 737)
67 82
Transport Equipment Assets
At Fair Value 1 769 3 009
Less: Accumulated Depreciation (1 181) (1 785)
588 1 224
Total Property, Plant and Equipment 8 736 357 108
Property, Plant and Equipment Valuations
The latest revaluation was undertaken by the Australian Valuation Office in June 2011. The revaluation included land and buildings as part of the Northern Territory Government three year rolling program.
Impairment of Property, Plant and Equipment
Department property, plant and equipment assets were assessed for impairment as at 30 June 2013. No impairment adjustments were required as a result of this review.
Property, Plant and Equipment Reconciliations
A reconciliation of the carrying amount of property, plant and equipment at the beginning and end of 2012-13 and 2011-12 is set out below:
2012-13 Land Buildings Infrastructure Plant & Equipment
Transport Equipment
Computer Equipment
Total
$’000 $’000 $’000 $’000 $’000 $’000 $’000
Carrying Amount as at 1 July 2012
44 097 293 863 14 484 3 358 1 224 82 357 108
Additions - - - 143 15 28 186
Depreciation and amortisation
-
(227) (4) (405) (108) (32) (776)
Additions/(Disposals) from asset transfers
(42 052) (289 283) (14 331) (1 562) (543) (11) (347 782)
Carrying Amount as at 30 June 2013
2 045 4 353 149 1 534 588 67 8 736

northern territory government Department of Land Resource Management | Annual Report 2012-1360
2011-12 Land Buildings Infrastructure Plant & Equipment
Transport Equipment
Computer Equipment
Total
$’000 $’000 $’000 $’000 $’000 $’000 $’000
Carrying Amount as at 1 July 2011
43 007 238 414 15 108 4 238 1 123 102 301 992
Additions - - - 137 459 23 619
Disposals - - - ( 12) ( 227) - ( 239)
Depreciation and amortisation
-
(9 780) ( 624) ( 633) ( 218) ( 43) (11 298)
Additions/(Disposals) from asset transfers
1 090 65 229 - ( 372) 162 - 66 109
Revaluation increments
- - - - - - 0
Gifts - - - - ( 75) - ( 75)
Carrying Amount as at 30 June 2012
44 097 293 863 14 484 3 358 1 224 82 357 108
2013 2012
$’000 $’000
11a. Intangibles
Carrying Amounts
Intangibles with a finite useful life
Intangibles – Computer Software
At Valuation 150 254
Less: Accumulated Amortisation (103) ( 166)
Written down value – 30 June 47 88
Total Intangibles
Department intangible assets were assessed for impairment as at 30 June 2013. No impairment adjustments were required as a result of this review.
Reconciliation of movements
Intangibles with a finite useful life
Carrying Amount at 1 July 88 134
Asset Transfer (22) -
Depreciation and Amortisation (19) (46)
Carrying Amount as at 30 June 47 88
11b. Heritage and cultural assets
Carrying Amount
At Valuation - 39
Less: Accumulated Depreciation - ( 11)
Written down value – 30 June - 28
Intangibles with an infinite useful life
Other intangibles
Other intangibles - 61 608
Total Intangibles - 61 636
Impairment of Intangibles
Department heritage and cultural assets were assessed for impairment as at 30 June 2013. No impairment adjustments were required as a result of this review.
northern territory government Department of Land Resource Management | Annual Report 2012-13 61
2013 2012
$’000 $’000
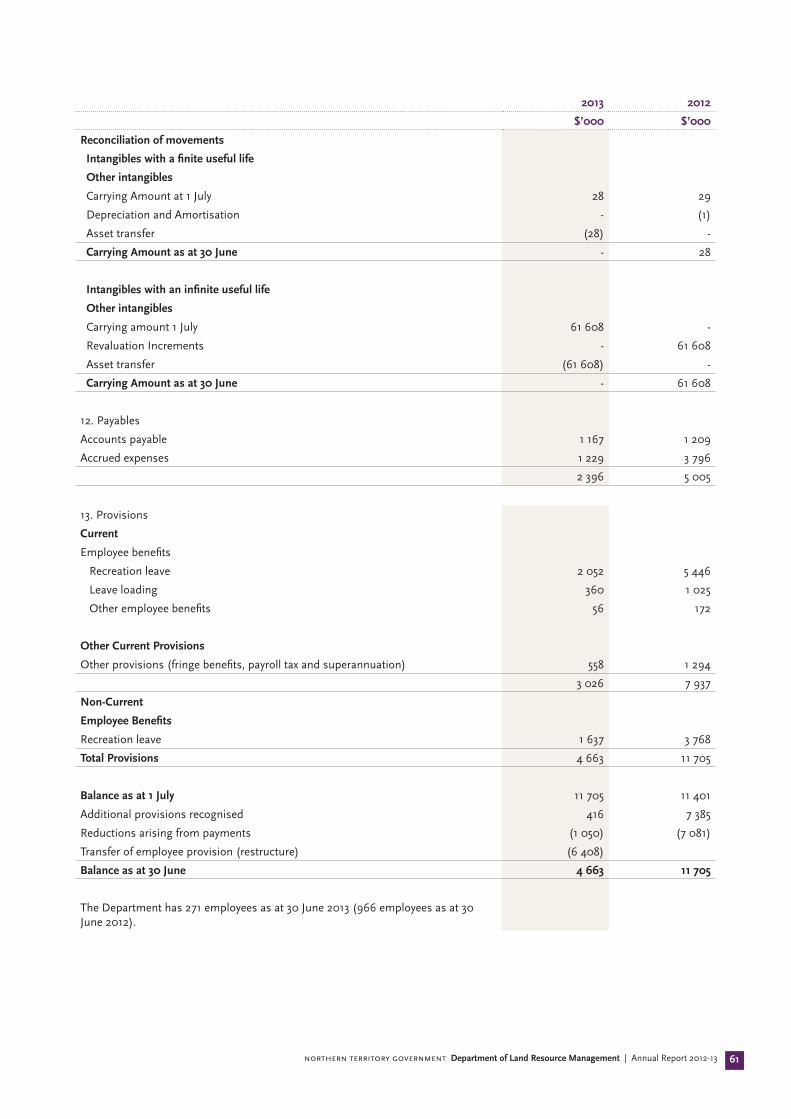
Reconciliation of movements
Intangibles with a finite useful life
Other intangibles
Carrying Amount at 1 July 28 29
Depreciation and Amortisation - (1)
Asset transfer (28) -
Carrying Amount as at 30 June - 28
Intangibles with an infinite useful life
Other intangibles
Carrying amount 1 July 61 608 -
Revaluation Increments - 61 608
Asset transfer (61 608) -
Carrying Amount as at 30 June - 61 608
12. Payables
Accounts payable 1 167 1 209
Accrued expenses 1 229 3 796
2 396 5 005
13. Provisions
Current
Employee benefits
Recreation leave 2 052 5 446
Leave loading 360 1 025
Other employee benefits 56 172
Other Current Provisions
Other provisions (fringe benefits, payroll tax and superannuation) 558 1 294
3 026 7 937
Non-Current
Employee Benefits
Recreation leave 1 637 3 768
Total Provisions 4 663 11 705
Balance as at 1 July 11 705 11 401
Additional provisions recognised 416 7 385
Reductions arising from payments (1 050) (7 081)
Transfer of employee provision (restructure) (6 408)
Balance as at 30 June 4 663 11 705
The Department has 271 employees as at 30 June 2013 (966 employees as at 30 June 2012).

northern territory government Department of Land Resource Management | Annual Report 2012-1362
2013 2012
$’000 $’000
14. Other liabilities
Current
Deposits held for natural heritage trust 456 522
Other liabilities – accountable officers trust account and clearing accounts 1 376
Unearned revenue 948 180
Total Other Liabilities 1 405 1 078
15. Equity
Equity represents the residual interest in the net assets of the Department. The Government’s ownership interest in Department is held in the Central Holding Authority as described in note 2(b).
Capital
Balance as at 1 July 335 979 261 449
Capital Appropriation 345 770
Equity Transfer In – completed assets 464 66 437
Equity Injection 1 025 -
Equity Withdrawal (150) (98)
Equity Transfer out – Agency Restructure (258 977) 7 421
Balance as at 30 June 78 686 335 979
Reserves
Asset Revaluation Reserve - Land
The asset revaluation reserve includes the net revaluation increments and decrements arising from the revaluation of non-current assets. Impairment adjustments may also be recognised in the Asset Revaluation Reserve.
Balance as at 1 July 144 411 82 803
Decrement – land asset transfer (58 169) -
Decrement - buildings asset transfer (22 784) -
Decrement - heritage and cultural assets asset transfer (61 608) 61 608
Balance as at 30 June 1 850 144 411
Accumulated Funds
Balance as at 1 July (74 431) (58 269)
Surplus/(Deficit) for the period 1 124 (16 162)
Balance as at 30 June (73 307) (74 431)
16. Notes to the cash flow statement
Reconciliation of Cash
The total of Department Cash and Deposits of $4.99 million recorded in the Balance Sheet is consistent with that recorded as ‘cash’ in the Cash Flow Statement.
Reconciliation of Net (Deficit) to Net Cash From Operating Activities
Net Surplus/(Deficit) 1 124 (16 162)
Non-Cash Items:
Depreciation and amortisation 795 11 345
Asset write-offs/write-downs - 1
Repairs & maintenance non cash 8 321
Loss on disposal of assets - 228
Assets acquired at nil value - (5)
Assets donations/gifts - 79
northern territory government Department of Land Resource Management | Annual Report 2012-13 63
2013 2012
$’000 $’000
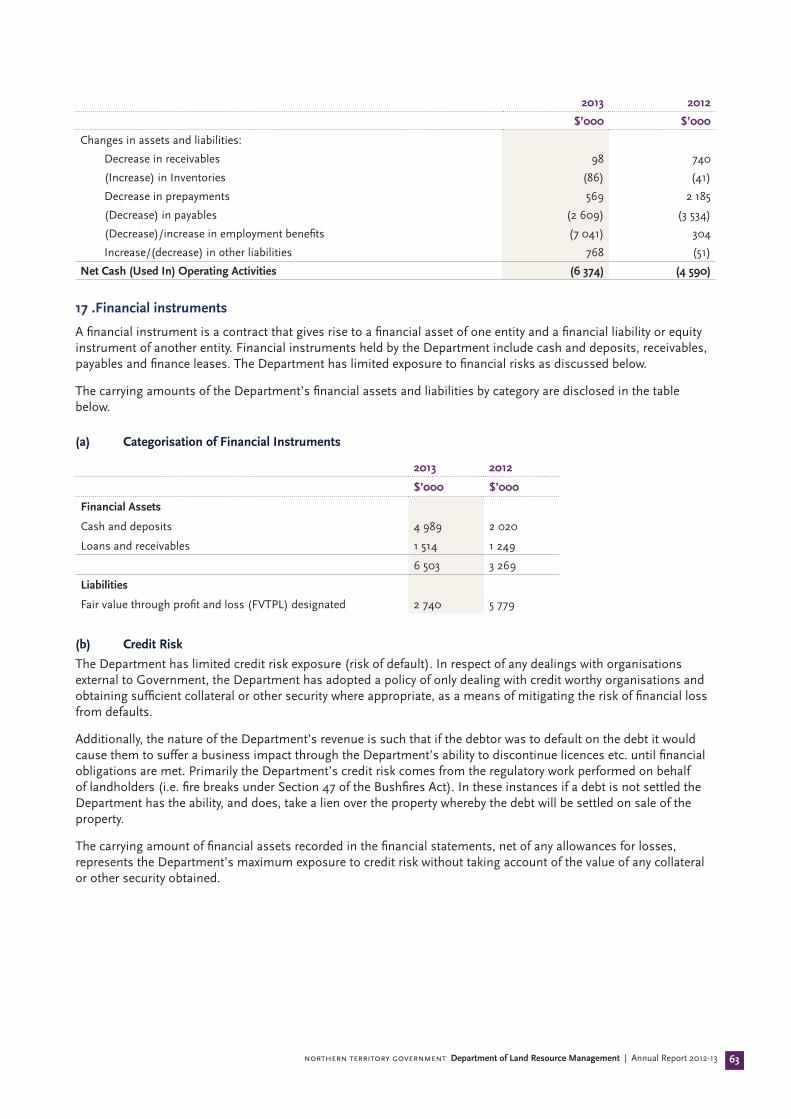
Changes in assets and liabilities:
Decrease in receivables 98 740
(Increase) in Inventories (86) (41)
Decrease in prepayments 569 2 185
(Decrease) in payables (2 609) (3 534)
(Decrease)/increase in employment benefits (7 041) 304
Increase/(decrease) in other liabilities 768 (51)
Net Cash (Used In) Operating Activities (6 374) (4 590)
17 .Financial instruments
A financial instrument is a contract that gives rise to a financial asset of one entity and a financial liability or equity instrument of another entity. Financial instruments held by the Department include cash and deposits, receivables, payables and finance leases. The Department has limited exposure to financial risks as discussed below.
The carrying amounts of the Department’s financial assets and liabilities by category are disclosed in the table below.
(a) Categorisation of Financial Instruments
2013 2012
$’000 $’000
Financial Assets
Cash and deposits 4 989 2 020
Loans and receivables 1 514 1 249
6 503 3 269
Liabilities
Fair value through profit and loss (FVTPL) designated 2 740 5 779
(b) Credit Risk
The Department has limited credit risk exposure (risk of default). In respect of any dealings with organisations external to Government, the Department has adopted a policy of only dealing with credit worthy organisations and obtaining sufficient collateral or other security where appropriate, as a means of mitigating the risk of financial loss from defaults.
Additionally, the nature of the Department’s revenue is such that if the debtor was to default on the debt it would cause them to suffer a business impact through the Department’s ability to discontinue licences etc. until financial obligations are met. Primarily the Department’s credit risk comes from the regulatory work performed on behalf of landholders (i.e. fire breaks under Section 47 of the Bushfires Act). In these instances if a debt is not settled the Department has the ability, and does, take a lien over the property whereby the debt will be settled on sale of the property.
The carrying amount of financial assets recorded in the financial statements, net of any allowances for losses, represents the Department’s maximum exposure to credit risk without taking account of the value of any collateral or other security obtained.

northern territory government Department of Land Resource Management | Annual Report 2012-1364
Receivables
Receivable balances are monitored on an ongoing basis to ensure that exposure to bad debts is not significant. A reconciliation and ageing analysis of receivables is presented below.
2013 2012
$’000 $’000
Internal Receivables
Ageing of Receivables
Not Overdue 115 31
Overdue for less than 30 Days - -
Overdue for 30 to 60 Days - -
Overdue for more than 60 Days (includes S47 Firebreaks) - -
Total Gross Receivables 115 31
Ageing of Impaired Receivables
Impaired Receivables for more than 60 Days - -
Total Impaired Receivables - -
Reconciliation of the Allowance for Impairment Losses
Allowance for Impairment Losses at the Beginning of the Reporting Period - -
Transfer due to Agency Restructure - -
(Decrease)/Increase in allowance recognised in profit or loss - -
Allowance for Impairment Losses at the End of the Reporting Period - -
External Receivables
Ageing of Receivables
Not Overdue 937 1 481
Overdue for less than 30 Days 23 102
Overdue for 30 to 60 Days - 10
Overdue for more than 60 Days (includes S47 Firebreaks) 63 164
Total Gross Receivables 1 023 1 759
Ageing of Impaired Receivables
Impaired Receivables for more than 60 Days (3) ( 37)
Total Impaired Receivables (3) ( 37)
Reconciliation of the Allowance for Impairment Losses
Allowance for Impairment Losses at the Beginning of the Reporting Period 37 68
Transfer due to Agency Restructure (31) -
(Decrease) in allowance recognised in profit or loss (3) (31)
Allowance for Impairment Losses at the End of the Reporting Period 3 37

northern territory government Department of Land Resource Management | Annual Report 2012-13 65
(c) Liquidity RiskLiquidity risk is the risk that the entity will not be able to meet its financial obligations as they fall due.
The Department’s liquidity risk includes credit cards with a potential monthly exposure of $0.857 million representing 19 days of administrative expenditure capacity. This risk is managed by tight control on issuing credit cards and maintenance of credit cards through regular review and reporting.
The following tables detail the undiscounted cash flows payable by the Department by remaining contractual maturity for its financial liabilities. It should be noted that as these are undiscounted and totals may not reconcile to carrying amounts presented in the Balance Sheet.
Maturity analysis for financial assets and liabilities
Variable Interest Non Interest Bearing
2013 1 Year 2 Year Carrying Amount
$’000 $’000 $’000 $’000
Assets
Cash and deposits 456 4 533 - 4 989
Receivables - 1 135 - 1 135
Total Financial Assets 456 5 668 - 6 124
Liabilities
Deposits Held (National Heritage Trust) 456 - - 456
Payables - 1 167 - 1 167
Provisions - 3 026 1 637 4 663
Other Liabilities - 948 - 948
Total Financial Liabilities: 456 5 141 1 637 7 234
2012
Assets
Cash and deposits 522 1 498 - 2 020
Receivables - 1 751 - 1 751
Total Financial Assets 522 3 249 - 3 771
Liabilities
Deposits Held (National Heritage Trust) 522 - - 522
Payables - 1 209 - 1 209
Provisions - 7 937 3 768 11 705
Other Liabilities - 180 - 180
Total Financial Liabilities: 522 9 326 3 768 13 616
northern territory government Department of Land Resource Management | Annual Report 2012-1366
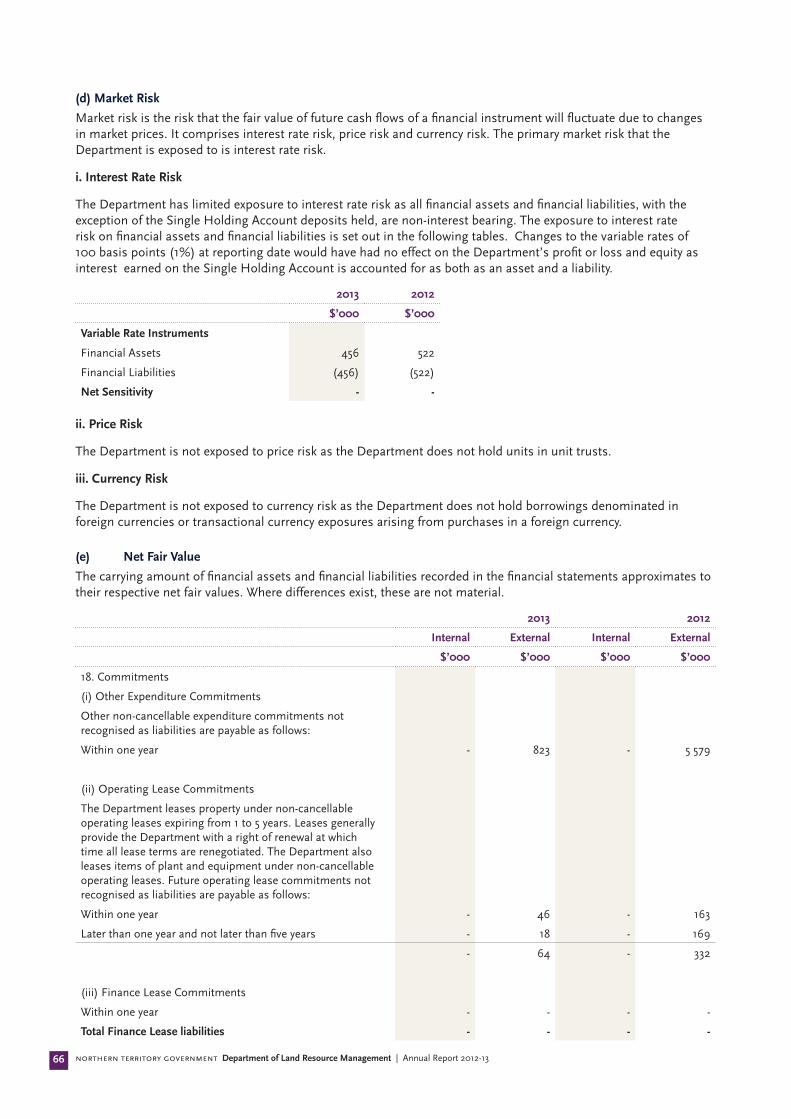
(d) Market Risk
Market risk is the risk that the fair value of future cash flows of a financial instrument will fluctuate due to changes in market prices. It comprises interest rate risk, price risk and currency risk. The primary market risk that the Department is exposed to is interest rate risk.
i. Interest Rate Risk
The Department has limited exposure to interest rate risk as all financial assets and financial liabilities, with the exception of the Single Holding Account deposits held, are non-interest bearing. The exposure to interest rate risk on financial assets and financial liabilities is set out in the following tables. Changes to the variable rates of 100 basis points (1%) at reporting date would have had no effect on the Department’s profit or loss and equity as interest earned on the Single Holding Account is accounted for as both as an asset and a liability.
2013 2012
$’000 $’000
Variable Rate Instruments
Financial Assets 456 522
Financial Liabilities (456) (522)
Net Sensitivity - -
ii. Price Risk
The Department is not exposed to price risk as the Department does not hold units in unit trusts.
iii. Currency Risk
The Department is not exposed to currency risk as the Department does not hold borrowings denominated in foreign currencies or transactional currency exposures arising from purchases in a foreign currency.
(e) Net Fair Value
The carrying amount of financial assets and financial liabilities recorded in the financial statements approximates to their respective net fair values. Where differences exist, these are not material.
2013 2012
Internal External Internal External
$’000 $’000 $’000 $’000
18. Commitments
(i) Other Expenditure Commitments
Other non-cancellable expenditure commitments not recognised as liabilities are payable as follows:
Within one year - 823 - 5 579
(ii) Operating Lease Commitments
The Department leases property under non-cancellable operating leases expiring from 1 to 5 years. Leases generally provide the Department with a right of renewal at which time all lease terms are renegotiated. The Department also leases items of plant and equipment under non-cancellable operating leases. Future operating lease commitments not recognised as liabilities are payable as follows:
Within one year - 46 - 163
Later than one year and not later than five years - 18 - 169
- 64 - 332
(iii) Finance Lease Commitments
Within one year - - - -
Total Finance Lease liabilities - - - -

northern territory government Department of Land Resource Management | Annual Report 2012-13 67
19. Contingent liabilities and contingent assets
a) Contingent liabilities
The Department is currently involved in two claims but due to the uncertainty of any potential liability no value can be attributed to these claims.
b) Contingent assets
The Department had no contingent assets as at 30 June 2013 or 30 June 2012.
20. Events subsequent to balance sheet date
No events have arisen between the end of the financial year and the date of this report that require adjustment to, or disclosure in these financial statements.
21. Accountable officer’s trust account
In accordance with section 7 of the Financial Management Act, an Accountable Officer’s Trust Account has been established for the receipt of money to be held in trust. A summary of activity is shown below:
Nature of Trust Money Opening Balance 1 July 2012
Transfers on Restructure
Closing Balance 30 June 2013
Bond money 7 7 -
Security deposits 56 56 -
Other Money 51 61 -
124 124 -

northern territory government Department of Land Resource Management | Annual Report 2012-1368
22. Write-offs, postponement, waivers gifts and ex gratia payments
Department / Group Department /Group Territory Items Territory Items
2013 $’000
No. of Trans.
2012 $’000
No. of Trans.
2013 $’000
No. of Trans.
2012 $’000
No. of Trans.
Write-offs, Postponements and Waivers Under the Financial Management Act
Represented by:
Amounts written off, waived and postponed by Delegates
Irrecoverable amounts payable to the Territory or an Agency written off
- - 4 5 - - - -
Losses or deficiencies of money written off
- - - - - - - -
Public property written off - 3 - 167 - - - -
Total written off, waived and postponed by Delegates
- 3 4 172 - - - -
Amounts written off, waived and postponed by the Treasurer
Irrecoverable amounts payable to the Territory or a Department written off
- - 10 1 - - - -
Wavier or postponement of right to receive or recover money or property
- - - - - - 822 260
Total written off, waived and postponed by the Treasurer
- - 10 1 - - 822 260
Gifts Under the Financial Management Act
- - 79 2 - - - -
Ex Gratia Payments Under the Financial Management Act
- - 379 2 - - - -

northern territory government Department of Land Resource Management | Annual Report 2012-13 69
23. Schedule of territory items
The following Territory items are managed by the Department on behalf of the Government and are recorded in the Central Holding Authority (refer note 2(b)).
2013 2012
$’000 $’000
TERRITORY INCOME AND EXPENSES
Income
Grants and subsidies revenue
Capital - 100
Fees from regulatory services 30 47
Royalties and rents 3 702 3 008
Fines - 4
Total Income 3 732 3 159
Expenses
Central Holding Authority income transferred 3 732 3 159
Total Expenses 3 732 3 159
Territory Income less Expenses - -
TERRITORY ASSETS AND LIABILITIES
Assets
Royalties and rent receivable 1 260 839
Total Assets 1 260 839
Liabilities
Central Holding Authority income payable 1 260 839
Total Liabilities 1 260 839
Net Assets - -

RangelandsAlice Springs ph: 8951 9248Katherine ph: 8973 8842Darwin ph: 8999 4478Email: [email protected]
Weed Management BranchAlice Springs ph: 8951 9210Katherine ph: 8973 8857Darwin ph: 8999 4414Email: [email protected]
Soil ConservationAlice Springs ph: 8951 9208Katherine ph: 8973 8838Darwin ph: 8999 4443Email: [email protected]
Pastoral Lease AdminPh: 8999 4474Email: [email protected]
Water ResourcesPh: 8999 4455Email: [email protected]
Flora and FaunaPh: 8995 5001
Bushfires NTPh: 8922 0844
Website: www.lrm.nt.gov.au