Embed Size (px)
Citation preview
7/29/2019 DMPS Student Achievement Monitoring Report - present 9 17 13
http://slidepdf.com/reader/full/dmps-student-achievement-monitoring-report-present-9-17-13 1/15
Attachment #13-060
Student Achievement MonitoringReport: Part 1 (NCLB)
Student expectation: Students demonstrate proficiency
and understanding of a rigorous core curriculum
Context
The goal of No Child Left Behind (NCLB) was to create the best educational environment for children and toensure that they have every opportunity to succeed. Legislation started in 1965 with authorization of the
Elementary and Secondary Education Act. It was re-authorized by Congress in 1994 and referred to as
“Improving America’s Schools” Act. Re-authorization occurred again January 8, 2002 as No Child Left
Behind (NCLB) Act. Currently Congress is in the process of re-authorizing the act again.
Federal Perspective: The goals of No Child Left Behind :
• All students will be proficient in mathematics and reading.
• All students will come to school (95 percent average daily attendance).
• All students will graduate from high school.
• All students will be educated in learning environments that are safe, drug-free, and conducive tolearning.
• All students will be taught by highly qualified teachers.
The law requires each state to determine ways to measure student achievement and to determine the
measurement that is considered 'proficient.’ All students enrolled in a school district must be tested. Allschools and districts are accountable for reaching the Adequate Yearly Progress (AYP) goals established
by the state formula and sanctions may be applied for those not meeting them.
The Iowa PerspectiveThe Iowa Department of Education has set the following guidelines for every school in the state:
• The Iowa Assessments is the standardized test used to measure academic achievement.
• All students in grades 3-8 and 11 must participate in testing in reading, mathematics, and science.
• In previous years individual proficiency was defined as an individual scoring at or above the 41st
percentile rank on the reading or mathematics tests. With the new Iowa Assessments in the 2011-12
school year, a standard score for each grade and content area is used to determine proficiency.
o With this change in assessments in the 2011-12 school year, the state only has two years of
comparative data.
• Adequate Yearly Progress (AYP) is defined as a group, school, or district meeting goals set by the IowaDepartment of Education for percent of students proficient in reading and mathematics for the specified
year.
7/29/2019 DMPS Student Achievement Monitoring Report - present 9 17 13
http://slidepdf.com/reader/full/dmps-student-achievement-monitoring-report-present-9-17-13 2/15
Student Achievement Monitoring
Report: Part 1 (NCLB)
2
AYP goals are set for each grade and content area of reading and mathematics as follows:
DE Target Goals for the Years 2013 and 2014
Reading – Target Goals of Percent Proficient
Gr. 3 Gr. 4 Gr. 5 Gr. 6 Gr. 7 Gr. 8 Gr. 11
2013 93.5 94.0 94.1 92.4 92.9 93.3 94.8
2014 100.0 100.0 100.0 100.0 100.0 100.0 100.0
Mathematics – Target Goals of Percent Proficient
Gr. 3 Gr. 4 Gr. 5 Gr. 6 Gr.7 Gr. 8 Gr. 11
2013 93.5 93.7 94.2 93.2 93.0 93.0 94.8
2014 100.0 100.0 100.0 100.0 100.0 100.0 100.0
• Full academic year (FAY) students are those who have attended the district or the school continuouslysince the previous year’s district testing date. Only scores of FAY students are used to calculate the
percent proficient of a group, school, or district.
• NCLB requires proficiency percentages be calculated for all groups of 30 or more students of thefollowing groups:
o English language learnerso Students receiving special education services
o Students who meet low income guidelines of free/reduced price lunch
o Students in each of these racial/ethnic groups: African American, Asian, Hispanic/Latino, Native
American, White, Pacific Islander, and Multi-racial
School and District AYP Status
If the percent of students who are proficient in all viable subgroups meets or exceeds the target Adequate YearlyTarget (AYP) goals, that school has met AYP. If the percent does not meet the target goal, then additional steps
are taken to see if the school has met AYP.
The additional steps reviewed are:1. Safe Harbor: The percent proficient is compared against the previous year to see if the number of non-
proficient has been reduced by 10 percent. If so, AYP is met.
2. Biennium check: Two years are averaged together. If the goal is met, AYP is met.3. Triennium check: Three years are averaged together. If the goal is met, AYP is met.
4. Elementary and Middle Schools Growth Model –Standard scores of students in grades 4-8 which are
below proficiency are divided into three levels. If a student has increased a level from the precedingyear, then the student is deemed to be proficient by growth model and added to the percent proficient forthe group. If the subgroup then meets the target goal, AYP is met.
7/29/2019 DMPS Student Achievement Monitoring Report - present 9 17 13
http://slidepdf.com/reader/full/dmps-student-achievement-monitoring-report-present-9-17-13 3/15
Student Achievement Monitoring
Report: Part 1 (NCLB)
3
Identification of a School in Need of Assistance (SINA) If a school fails to meet the following it will be identified as a school in need of assistance (SINA):
• Proficient targets for two consecutive years in the same content area.
• 95 percent participation in testing for two consecutive years in the same content area.
Other academic indicators which must be met are:• Graduation Goal: 87.0 percent or 2 percent increase from previous year for high schools.
• Attendance Goal: State average (typically 96.0 percent) or increase from previous year for
elementary and middle schools.If a school meets Adequate Yearly Progress (AYP) while on the SINA list, they will be classified as Delaystatus for one year. If AYP is met again the next year, the school is removed from the list. Otherwise, SINA
status resumes at the next level.
Students demonstrate proficiency in reading, writing, speaking and listening
READING
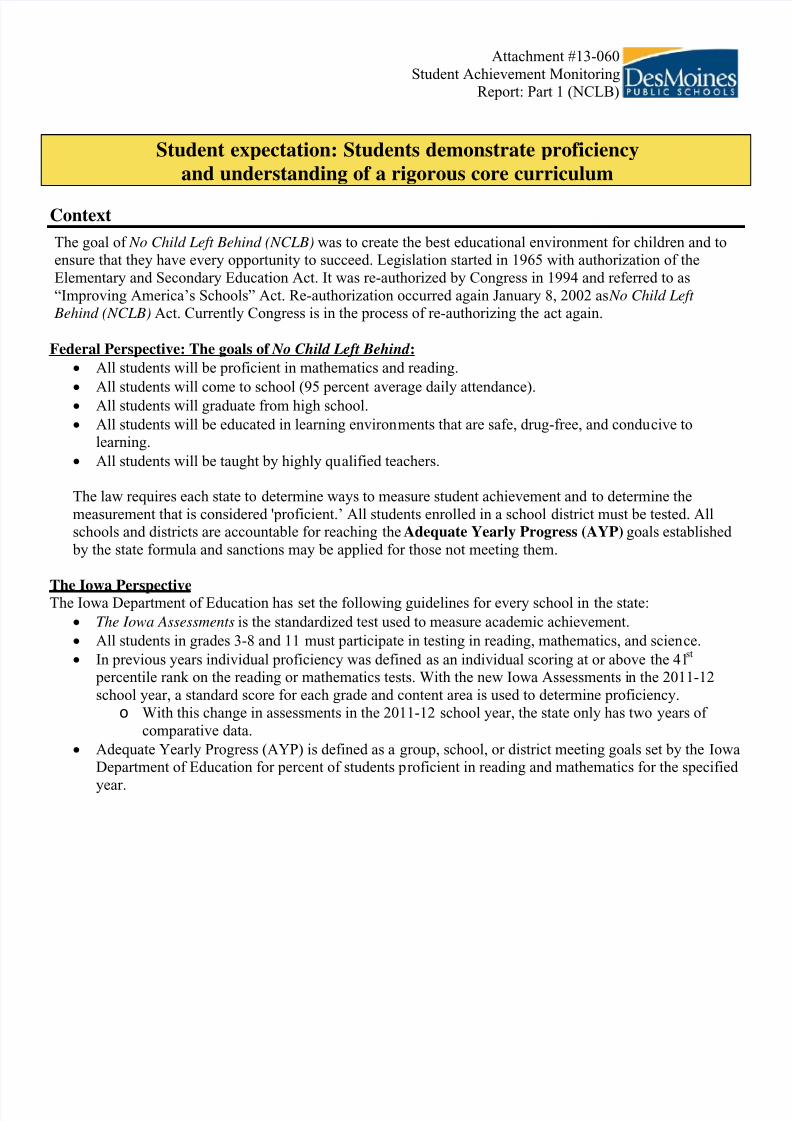
Des Moines Public Schools Full Academic Year (FAY) Percent Proficient: 2012 and 2013
Data includes students taking the alternate assessment and students making growth
Elementary grade levels experienced an overall 2.4 percent increase in reading proficiency rate from
spring 2012 to spring 2013. All subgroups, with the exception of Asian, increased in elementary
reading proficiency. Multi-racial students demonstrated the largest increase, increasing by 7.9
percent.
All
StudentsLow SES
Students
w/
Disabilities
ELLAfrican
AmericanAsian Hispanic White Multi-racial
2012 63.1 55.4 31.0 48.2 47.7 64.4 53.9 72.9 61.9
2013 65.5 58.9 34.1 50.0 50.3 62.1 57.2 74.7 69.8
0.0
10.020.030.0
40.050.0
60.070.080.0
90.0100.0
P e r c e n t P r o f i c i e n t
Reading: Grades 3-5
7/29/2019 DMPS Student Achievement Monitoring Report - present 9 17 13
http://slidepdf.com/reader/full/dmps-student-achievement-monitoring-report-present-9-17-13 4/15
Student Achievement Monitoring
Report: Part 1 (NCLB)
4
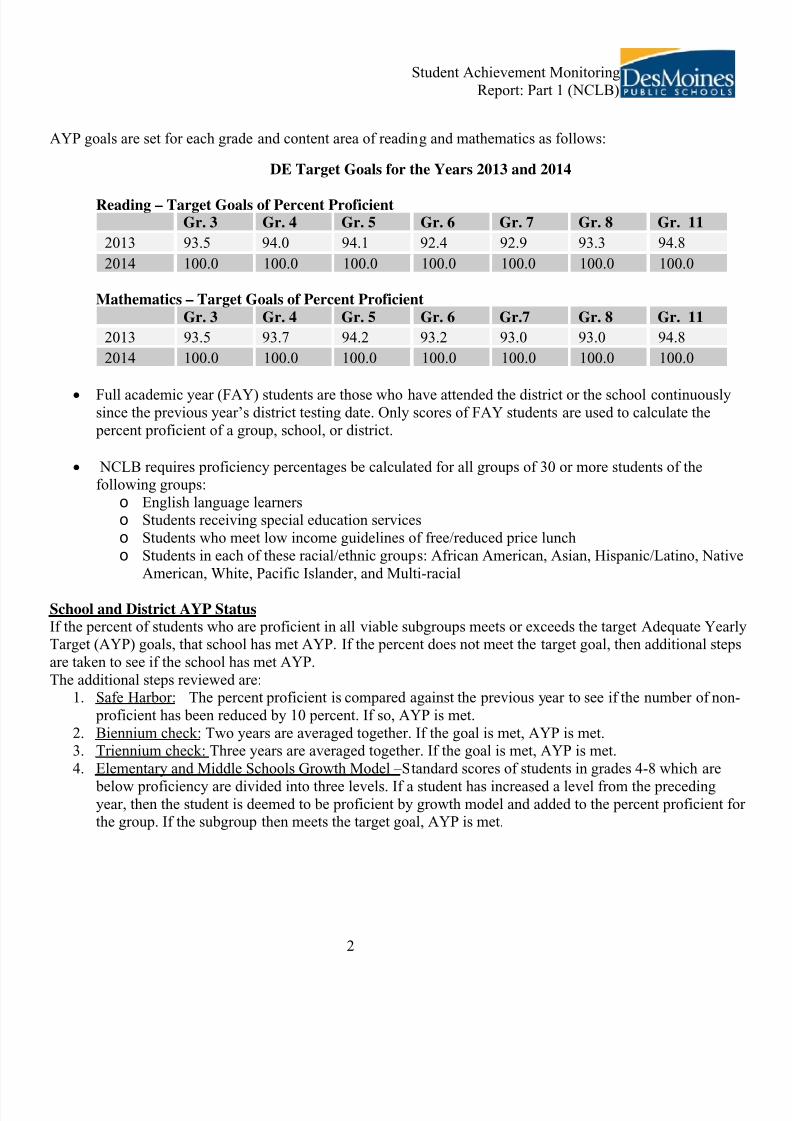
Data includes students taking the alternate assessment and students making growth
Middle school grade levels experienced an overall 1.2 percent increase in reading proficiency rate
from spring 2012 to spring 2013. All subgroups increased in middle school reading proficiency.
English language learners demonstrated the largest increase, increasing by 3.0 percent.
Data includes students taking the alternate assessment and students making growth
Eleventh grade experienced an overall 4.5 percent increase in reading proficiency rate from spring
2012 to spring 2013. All subgroups increased in 11th
grade reading proficiency. Asian students
demonstrated the largest increase, increasing by 7.8 percent.
All
StudentsLow SES
Students
w/
Disabilities
ELLAfrican
AmericanAsian Hispanic White Multi-racial
2012 49.9 39.9 17.2 13.8 32.0 47.7 38.6 62.1 48.9
2013 51.1 41.9 18.5 17.8 34.0 49.8 39.2 63.0 53.3
0.010.020.030.040.050.060.0
70.080.090.0
100.0
P e r c e n t P r o f i c i e n t
Reading: Grades 6-8
All
StudentsLow SES
Students
w/
Disabilities
ELLAfrican
AmericanAsian Hispanic White Multi-racial
2012 67.2 56.5 30.2 11.6 51.7 51.1 61.2 76.2 70.9
2013 71.7 61.1 32.1 17.7 53.9 58.9 62.1 82.2 72.7
0.010.020.030.040.050.060.070.0
80.090.0
100.0
P e r c e n t P r o f i c i e
n t
Reading: Grade 11
7/29/2019 DMPS Student Achievement Monitoring Report - present 9 17 13
http://slidepdf.com/reader/full/dmps-student-achievement-monitoring-report-present-9-17-13 5/15
Student Achievement Monitoring
Report: Part 1 (NCLB)
5
2013 Proficiency Targets and District Performance
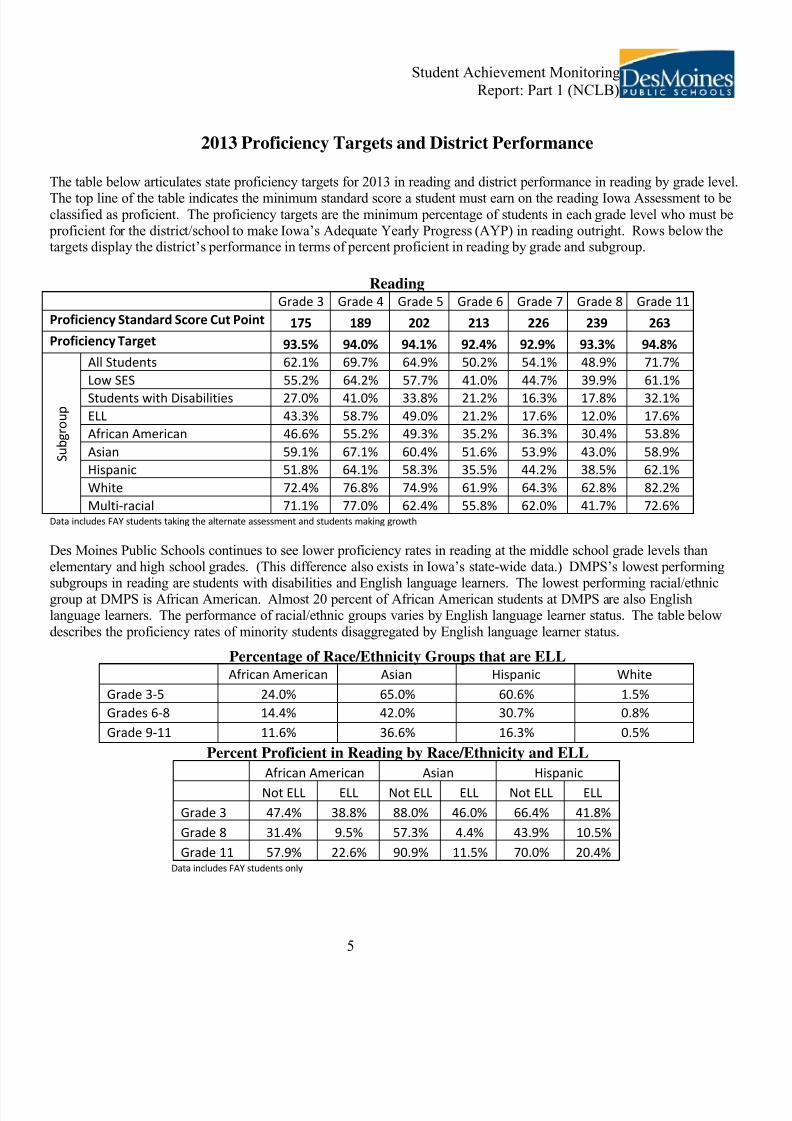
The table below articulates state proficiency targets for 2013 in reading and district performance in reading by grade level.
The top line of the table indicates the minimum standard score a student must earn on the reading Iowa Assessment to beclassified as proficient. The proficiency targets are the minimum percentage of students in each grade level who must be
proficient for the district/school to make Iowa’s Adequate Yearly Progress (AYP) in reading outright. Rows below thetargets display the district’s performance in terms of percent proficient in reading by grade and subgroup.
ReadingGrade 3 Grade 4 Grade 5 Grade 6 Grade 7 Grade 8 Grade 11
Proficiency Standard Score Cut Point 175 189 202 213 226 239 263
Proficiency Target 93.5% 94.0% 94.1% 92.4% 92.9% 93.3% 94.8%
S u b g r o u p
All Students 62.1% 69.7% 64.9% 50.2% 54.1% 48.9% 71.7%
Low SES 55.2% 64.2% 57.7% 41.0% 44.7% 39.9% 61.1%
Students with Disabilities 27.0% 41.0% 33.8% 21.2% 16.3% 17.8% 32.1%
ELL 43.3% 58.7% 49.0% 21.2% 17.6% 12.0% 17.6%
African American 46.6% 55.2% 49.3% 35.2% 36.3% 30.4% 53.8%
Asian 59.1% 67.1% 60.4% 51.6% 53.9% 43.0% 58.9%
Hispanic 51.8% 64.1% 58.3% 35.5% 44.2% 38.5% 62.1%
White 72.4% 76.8% 74.9% 61.9% 64.3% 62.8% 82.2%
Multi-racial 71.1% 77.0% 62.4% 55.8% 62.0% 41.7% 72.6%Data includes FAY students taking the alternate assessment and students making growth
Des Moines Public Schools continues to see lower proficiency rates in reading at the middle school grade levels thanelementary and high school grades. (This difference also exists in Iowa’s state-wide data.) DMPS’s lowest performing
subgroups in reading are students with disabilities and English language learners. The lowest performing racial/ethnicgroup at DMPS is African American. Almost 20 percent of African American students at DMPS are also Englishlanguage learners. The performance of racial/ethnic groups varies by English language learner status. The table below
describes the proficiency rates of minority students disaggregated by English language learner status.
Percentage of Race/Ethnicity Groups that are ELLAfrican American Asian Hispanic White
Grade 3-5 24.0% 65.0% 60.6% 1.5%
Grades 6-8 14.4% 42.0% 30.7% 0.8%
Grade 9-11 11.6% 36.6% 16.3% 0.5%
Percent Proficient in Reading by Race/Ethnicity and ELL
African American Asian Hispanic
Not ELL ELL Not ELL ELL Not ELL ELL
Grade 3 47.4% 38.8% 88.0% 46.0% 66.4% 41.8%
Grade 8 31.4% 9.5% 57.3% 4.4% 43.9% 10.5%
Grade 11 57.9% 22.6% 90.9% 11.5% 70.0% 20.4%Data includes FAY students only
7/29/2019 DMPS Student Achievement Monitoring Report - present 9 17 13
http://slidepdf.com/reader/full/dmps-student-achievement-monitoring-report-present-9-17-13 6/15
Student Achievement Monitoring
Report: Part 1 (NCLB)
6
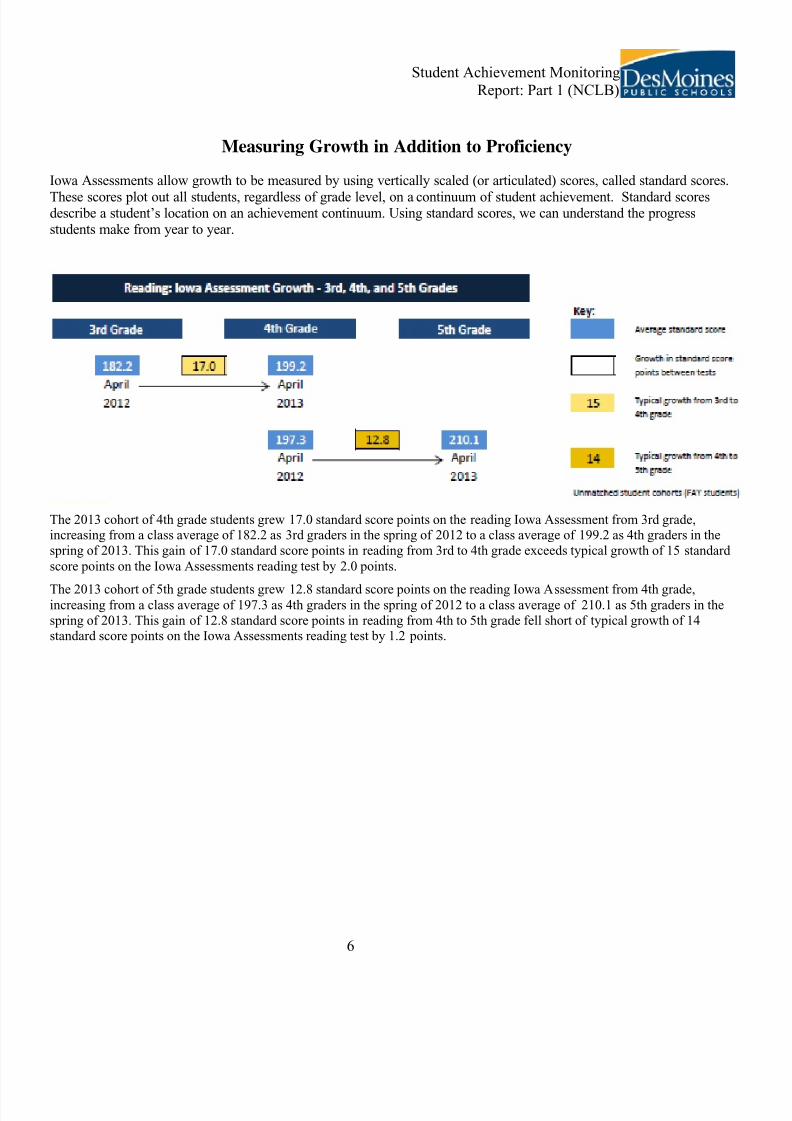
Measuring Growth in Addition to Proficiency
Iowa Assessments allow growth to be measured by using vertically scaled (or articulated) scores, called standard scores.
These scores plot out all students, regardless of grade level, on a continuum of student achievement. Standard scoresdescribe a student’s location on an achievement continuum. Using standard scores, we can understand the progressstudents make from year to year.
The 2013 cohort of 4th grade students grew 17.0 standard score points on the reading Iowa Assessment from 3rd grade,increasing from a class average of 182.2 as 3rd graders in the spring of 2012 to a class average of 199.2 as 4th graders in the
spring of 2013. This gain of 17.0 standard score points in reading from 3rd to 4th grade exceeds typical growth of 15 standard
score points on the Iowa Assessments reading test by 2.0 points.
The 2013 cohort of 5th grade students grew 12.8 standard score points on the reading Iowa Assessment from 4th grade,increasing from a class average of 197.3 as 4th graders in the spring of 2012 to a class average of 210.1 as 5th graders in the
spring of 2013. This gain of 12.8 standard score points in reading from 4th to 5th grade fell short of typical growth of 14standard score points on the Iowa Assessments reading test by 1.2 points.
7/29/2019 DMPS Student Achievement Monitoring Report - present 9 17 13
http://slidepdf.com/reader/full/dmps-student-achievement-monitoring-report-present-9-17-13 7/15
Student Achievement Monitoring
Report: Part 1 (NCLB)
7
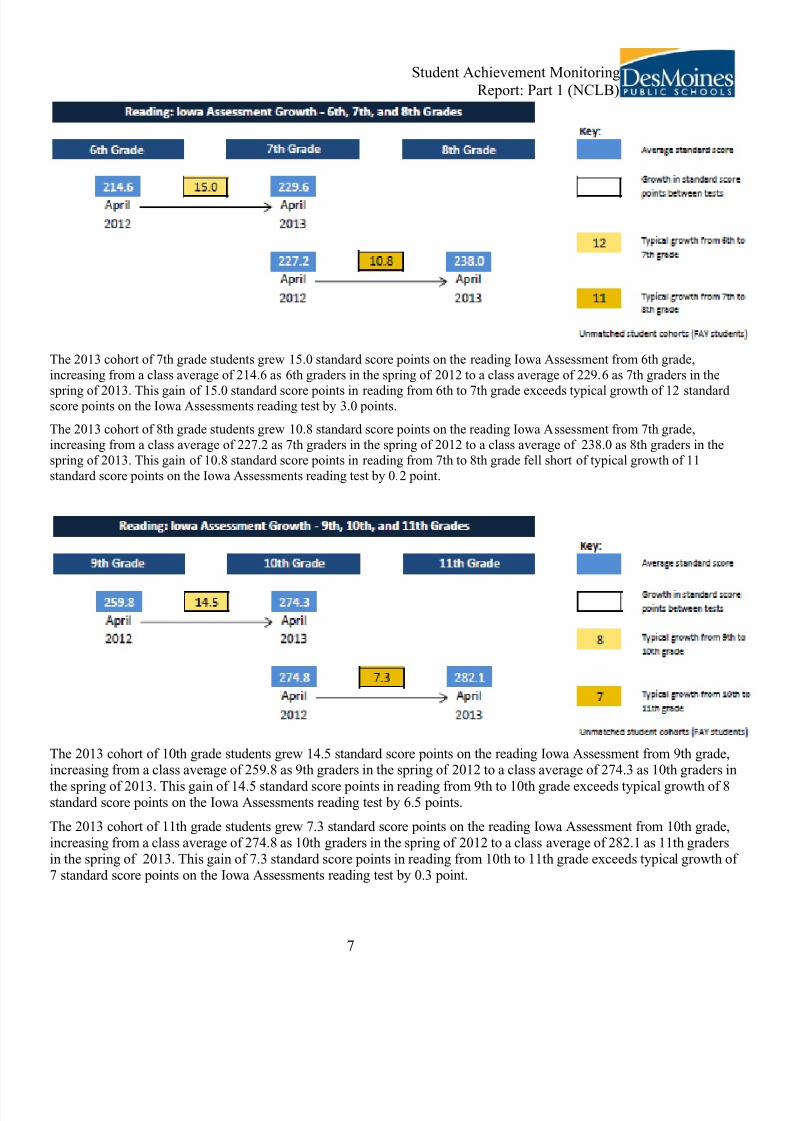
The 2013 cohort of 7th grade students grew 15.0 standard score points on the reading Iowa Assessment from 6th grade,
increasing from a class average of 214.6 as 6th graders in the spring of 2012 to a class average of 229.6 as 7th graders in the
spring of 2013. This gain of 15.0 standard score points in reading from 6th to 7th grade exceeds typical growth of 12 standard score points on the Iowa Assessments reading test by 3.0 points.
The 2013 cohort of 8th grade students grew 10.8 standard score points on the reading Iowa Assessment from 7th grade,
increasing from a class average of 227.2 as 7th graders in the spring of 2012 to a class average of 238.0 as 8th graders in the
spring of 2013. This gain of 10.8 standard score points in reading from 7th to 8th grade fell short of typical growth of 11
standard score points on the Iowa Assessments reading test by 0.2 point.
The 2013 cohort of 10th grade students grew 14.5 standard score points on the reading Iowa Assessment from 9th grade,increasing from a class average of 259.8 as 9th graders in the spring of 2012 to a class average of 274.3 as 10th graders in
the spring of 2013. This gain of 14.5 standard score points in reading from 9th to 10th grade exceeds typical growth of 8standard score points on the Iowa Assessments reading test by 6.5 points.
The 2013 cohort of 11th grade students grew 7.3 standard score points on the reading Iowa Assessment from 10th grade,increasing from a class average of 274.8 as 10th graders in the spring of 2012 to a class average of 282.1 as 11th gradersin the spring of 2013. This gain of 7.3 standard score points in reading from 10th to 11th grade exceeds typical growth of 7 standard score points on the Iowa Assessments reading test by 0.3 point.
7/29/2019 DMPS Student Achievement Monitoring Report - present 9 17 13
http://slidepdf.com/reader/full/dmps-student-achievement-monitoring-report-present-9-17-13 8/15
Student Achievement Monitoring
Report: Part 1 (NCLB)
8
Graduates demonstrate proficiency in mathematics, including Algebra and
Geometry
MATHEMATICS
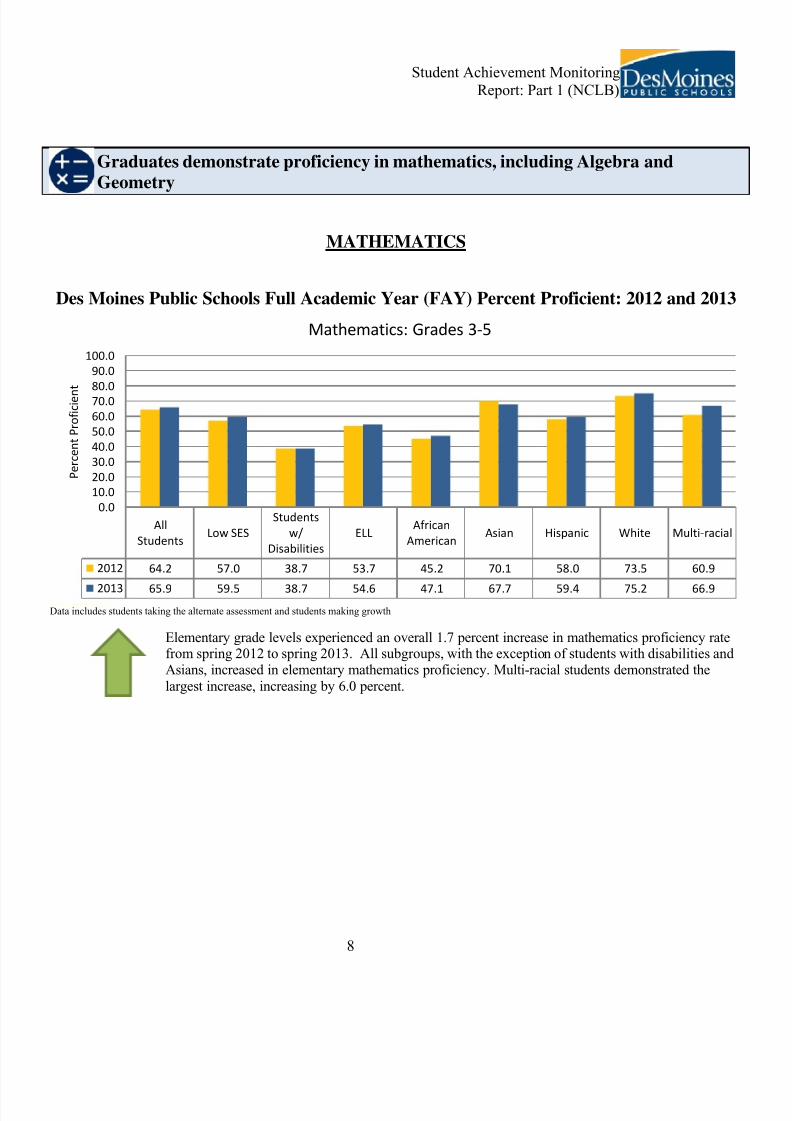
Des Moines Public Schools Full Academic Year (FAY) Percent Proficient: 2012 and 2013
Data includes students taking the alternate assessment and students making growth
Elementary grade levels experienced an overall 1.7 percent increase in mathematics proficiency ratefrom spring 2012 to spring 2013. All subgroups, with the exception of students with disabilities and Asians, increased in elementary mathematics proficiency. Multi-racial students demonstrated the
largest increase, increasing by 6.0 percent.
All
StudentsLow SES
Students
w/
Disabilities
ELLAfrican
AmericanAsian Hispanic White Multi-racial
2012 64.2 57.0 38.7 53.7 45.2 70.1 58.0 73.5 60.9
2013 65.9 59.5 38.7 54.6 47.1 67.7 59.4 75.2 66.9
0.0
10.0
20.0
30.0
40.0
50.0
60.0
70.0
80.0
90.0
100.0
P e r c e n t P r o f i c i e n
t
Mathematics: Grades 3-5
7/29/2019 DMPS Student Achievement Monitoring Report - present 9 17 13
http://slidepdf.com/reader/full/dmps-student-achievement-monitoring-report-present-9-17-13 9/15
Student Achievement Monitoring
Report: Part 1 (NCLB)
9
Data includes students taking the alternate assessment and students making growth
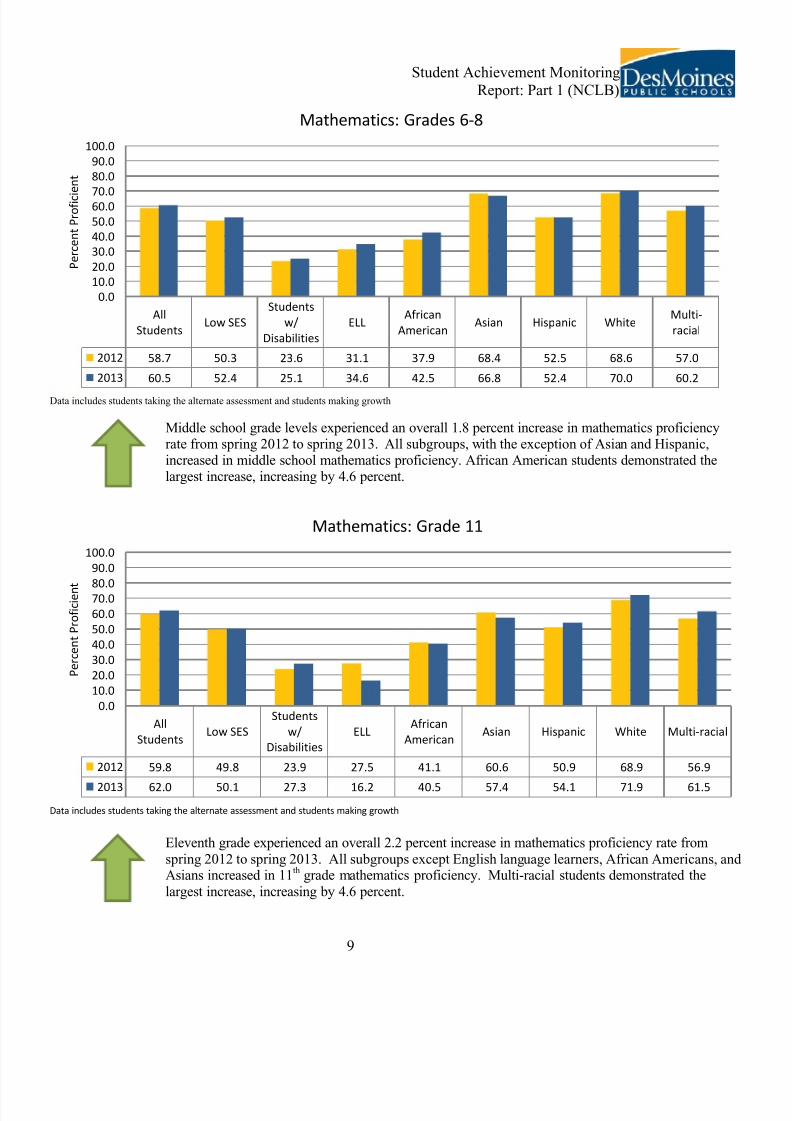
Middle school grade levels experienced an overall 1.8 percent increase in mathematics proficiencyrate from spring 2012 to spring 2013. All subgroups, with the exception of Asian and Hispanic,increased in middle school mathematics proficiency. African American students demonstrated thelargest increase, increasing by 4.6 percent.
Data includes students taking the alternate assessment and students making growth
Eleventh grade experienced an overall 2.2 percent increase in mathematics proficiency rate from
spring 2012 to spring 2013. All subgroups except English language learners, African Americans, andAsians increased in 11th grade mathematics proficiency. Multi-racial students demonstrated the
largest increase, increasing by 4.6 percent.
All
StudentsLow SES
Students
w/
Disabilities
ELLAfrican
AmericanAsian Hispanic White
Multi-
racial
2012 58.7 50.3 23.6 31.1 37.9 68.4 52.5 68.6 57.0
2013 60.5 52.4 25.1 34.6 42.5 66.8 52.4 70.0 60.2
0.0
10.0
20.0
30.0
40.0
50.0
60.070.0
80.0
90.0
100.0
P e r c e n t P r o f i c i e n t
Mathematics: Grades 6-8
All
StudentsLow SES
Students
w/
Disabilities
ELLAfrican
AmericanAsian Hispanic White Multi-racial
2012 59.8 49.8 23.9 27.5 41.1 60.6 50.9 68.9 56.9
2013 62.0 50.1 27.3 16.2 40.5 57.4 54.1 71.9 61.5
0.0
10.0
20.0
30.0
40.0
50.0
60.0
70.080.0
90.0
100.0
P e r c e n t P r o f i c i e n
t
Mathematics: Grade 11
7/29/2019 DMPS Student Achievement Monitoring Report - present 9 17 13
http://slidepdf.com/reader/full/dmps-student-achievement-monitoring-report-present-9-17-13 10/15
Student Achievement Monitoring
Report: Part 1 (NCLB)
10
2013 Proficiency Targets and District Performance
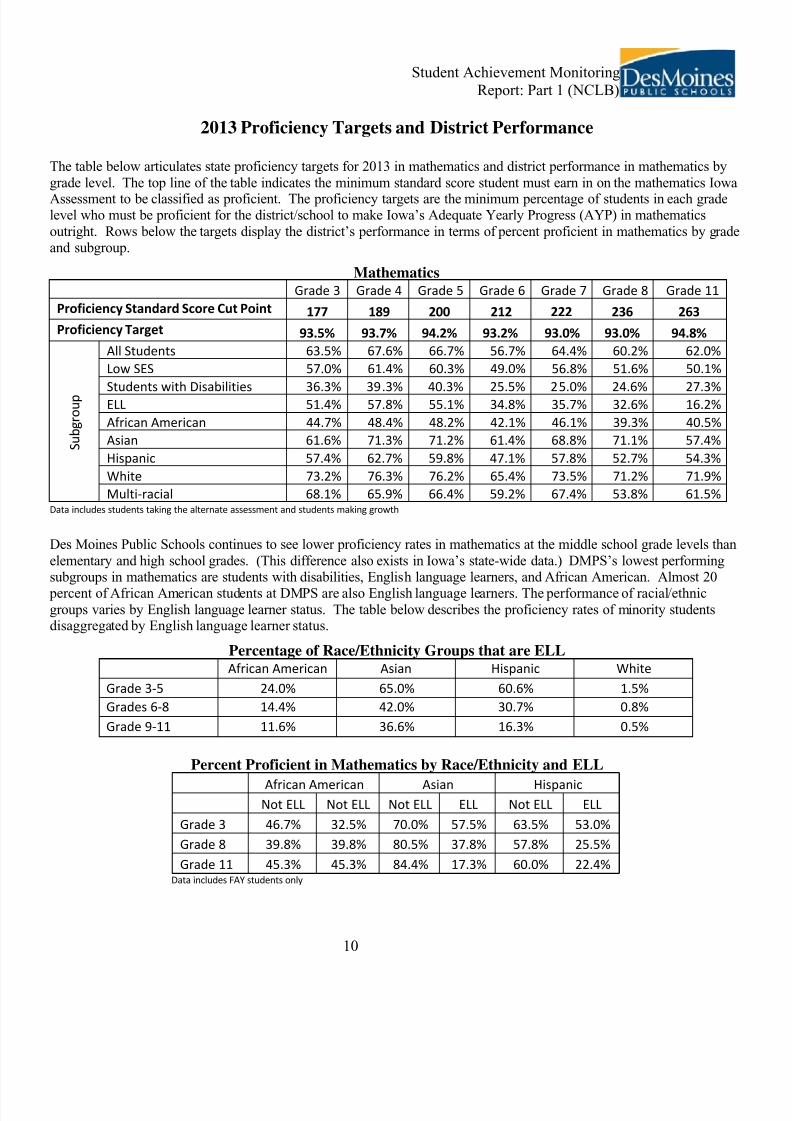
The table below articulates state proficiency targets for 2013 in mathematics and district performance in mathematics by
grade level. The top line of the table indicates the minimum standard score student must earn in on the mathematics Iowa
Assessment to be classified as proficient. The proficiency targets are the minimum percentage of students in each gradelevel who must be proficient for the district/school to make Iowa’s Adequate Yearly Progress (AYP) in mathematics
outright. Rows below the targets display the district’s performance in terms of percent proficient in mathematics by gradeand subgroup.
MathematicsGrade 3 Grade 4 Grade 5 Grade 6 Grade 7 Grade 8 Grade 11
Proficiency Standard Score Cut Point 177 189 200 212 222 236 263
Proficiency Target 93.5% 93.7% 94.2% 93.2% 93.0% 93.0% 94.8%
S u b g r o u p
All Students 63.5% 67.6% 66.7% 56.7% 64.4% 60.2% 62.0%
Low SES 57.0% 61.4% 60.3% 49.0% 56.8% 51.6% 50.1%
Students with Disabilities 36.3% 39.3% 40.3% 25.5% 25.0% 24.6% 27.3%ELL 51.4% 57.8% 55.1% 34.8% 35.7% 32.6% 16.2%
African American 44.7% 48.4% 48.2% 42.1% 46.1% 39.3% 40.5%
Asian 61.6% 71.3% 71.2% 61.4% 68.8% 71.1% 57.4%
Hispanic 57.4% 62.7% 59.8% 47.1% 57.8% 52.7% 54.3%
White 73.2% 76.3% 76.2% 65.4% 73.5% 71.2% 71.9%
Multi-racial 68.1% 65.9% 66.4% 59.2% 67.4% 53.8% 61.5%Data includes students taking the alternate assessment and students making growth
Des Moines Public Schools continues to see lower proficiency rates in mathematics at the middle school grade levels than
elementary and high school grades. (This difference also exists in Iowa’s state-wide data.) DMPS’s lowest performingsubgroups in mathematics are students with disabilities, English language learners, and African American. Almost 20
percent of African American students at DMPS are also English language learners. The performance of racial/ethnicgroups varies by English language learner status. The table below describes the proficiency rates of minority studentsdisaggregated by English language learner status.
Percentage of Race/Ethnicity Groups that are ELLAfrican American Asian Hispanic White
Grade 3-5 24.0% 65.0% 60.6% 1.5%
Grades 6-8 14.4% 42.0% 30.7% 0.8%
Grade 9-11 11.6% 36.6% 16.3% 0.5%
Percent Proficient in Mathematics by Race/Ethnicity and ELL
African American Asian HispanicNot ELL Not ELL Not ELL ELL Not ELL ELL
Grade 3 46.7% 32.5% 70.0% 57.5% 63.5% 53.0%
Grade 8 39.8% 39.8% 80.5% 37.8% 57.8% 25.5%
Grade 11 45.3% 45.3% 84.4% 17.3% 60.0% 22.4%Data includes FAY students only
7/29/2019 DMPS Student Achievement Monitoring Report - present 9 17 13
http://slidepdf.com/reader/full/dmps-student-achievement-monitoring-report-present-9-17-13 11/15
Student Achievement Monitoring
Report: Part 1 (NCLB)
11
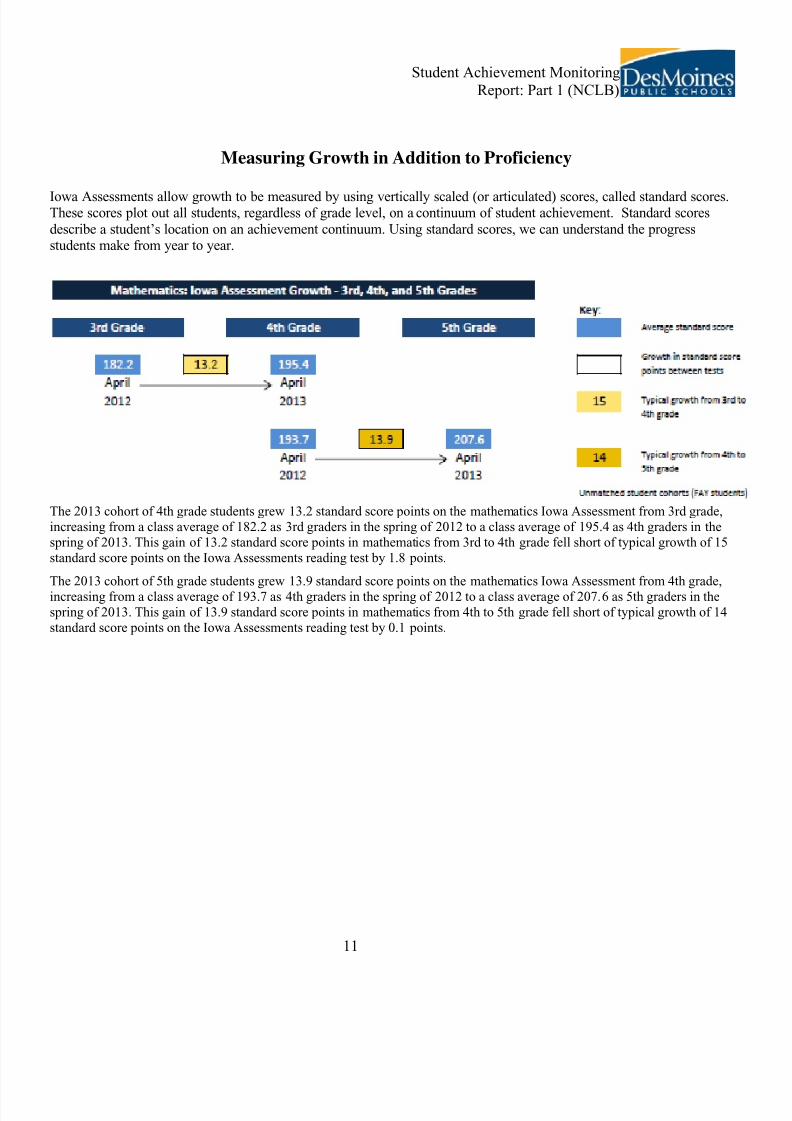
Measuring Growth in Addition to Proficiency
Iowa Assessments allow growth to be measured by using vertically scaled (or articulated) scores, called standard scores.These scores plot out all students, regardless of grade level, on a continuum of student achievement. Standard scores
describe a student’s location on an achievement continuum. Using standard scores, we can understand the progressstudents make from year to year.
The 2013 cohort of 4th grade students grew 13.2 standard score points on the mathematics Iowa Assessment from 3rd grade,
increasing from a class average of 182.2 as 3rd graders in the spring of 2012 to a class average of 195.4 as 4th graders in the
spring of 2013. This gain of 13.2 standard score points in mathematics from 3rd to 4th grade fell short of typical growth of 15
standard score points on the Iowa Assessments reading test by 1.8 points.
The 2013 cohort of 5th grade students grew 13.9 standard score points on the mathematics Iowa Assessment from 4th grade,
increasing from a class average of 193.7 as 4th graders in the spring of 2012 to a class average of 207.6 as 5th graders in the
spring of 2013. This gain of 13.9 standard score points in mathematics from 4th to 5th grade fell short of typical growth of 14
standard score points on the Iowa Assessments reading test by 0.1 points.
7/29/2019 DMPS Student Achievement Monitoring Report - present 9 17 13
http://slidepdf.com/reader/full/dmps-student-achievement-monitoring-report-present-9-17-13 12/15
Student Achievement Monitoring
Report: Part 1 (NCLB)
12
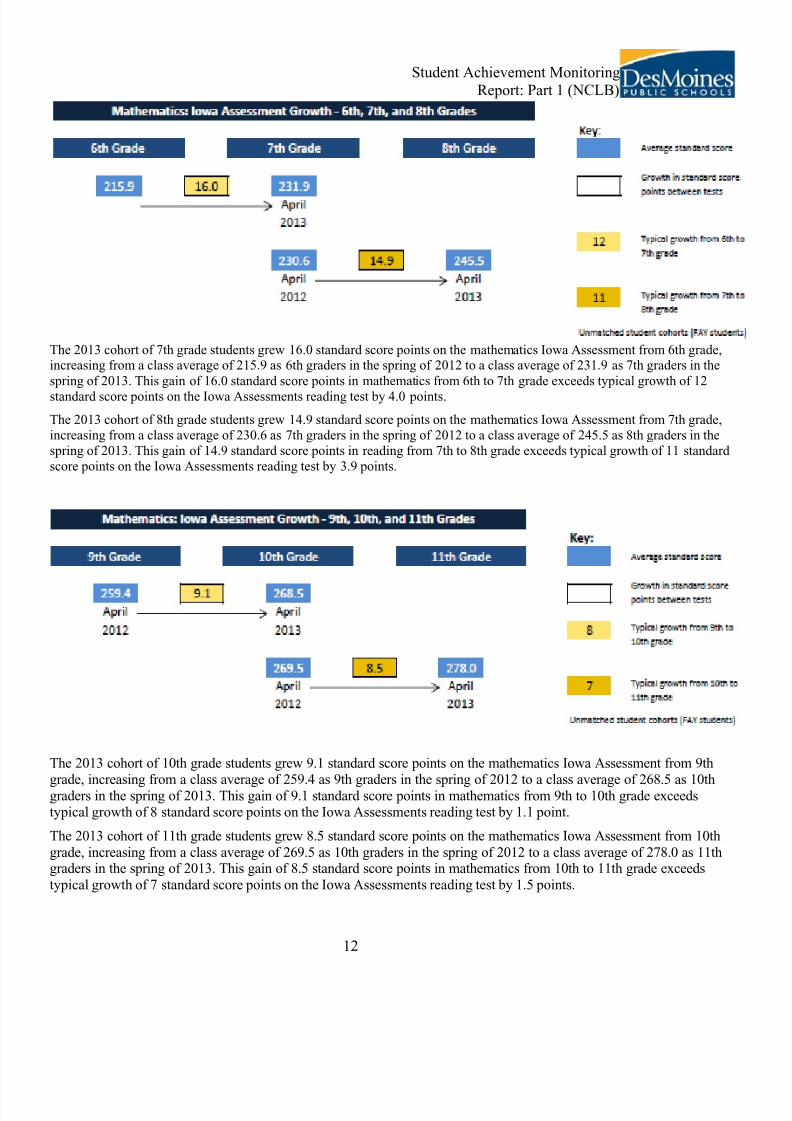
The 2013 cohort of 7th grade students grew 16.0 standard score points on the mathematics Iowa Assessment from 6th grade,increasing from a class average of 215.9 as 6th graders in the spring of 2012 to a class average of 231.9 as 7th graders in the
spring of 2013. This gain of 16.0 standard score points in mathematics from 6th to 7th grade exceeds typical growth of 12
standard score points on the Iowa Assessments reading test by 4.0 points.
The 2013 cohort of 8th grade students grew 14.9 standard score points on the mathematics Iowa Assessment from 7th grade,
increasing from a class average of 230.6 as 7th graders in the spring of 2012 to a class average of 245.5 as 8th graders in the
spring of 2013. This gain of 14.9 standard score points in reading from 7th to 8th grade exceeds typical growth of 11 standard
score points on the Iowa Assessments reading test by 3.9 points.
The 2013 cohort of 10th grade students grew 9.1 standard score points on the mathematics Iowa Assessment from 9th
grade, increasing from a class average of 259.4 as 9th graders in the spring of 2012 to a class average of 268.5 as 10thgraders in the spring of 2013. This gain of 9.1 standard score points in mathematics from 9th to 10th grade exceedstypical growth of 8 standard score points on the Iowa Assessments reading test by 1.1 point.
The 2013 cohort of 11th grade students grew 8.5 standard score points on the mathematics Iowa Assessment from 10th
grade, increasing from a class average of 269.5 as 10th graders in the spring of 2012 to a class average of 278.0 as 11thgraders in the spring of 2013. This gain of 8.5 standard score points in mathematics from 10th to 11th grade exceeds
typical growth of 7 standard score points on the Iowa Assessments reading test by 1.5 points.
7/29/2019 DMPS Student Achievement Monitoring Report - present 9 17 13
http://slidepdf.com/reader/full/dmps-student-achievement-monitoring-report-present-9-17-13 13/15
Student Achievement Monitoring
Report: Part 1 (NCLB)
13
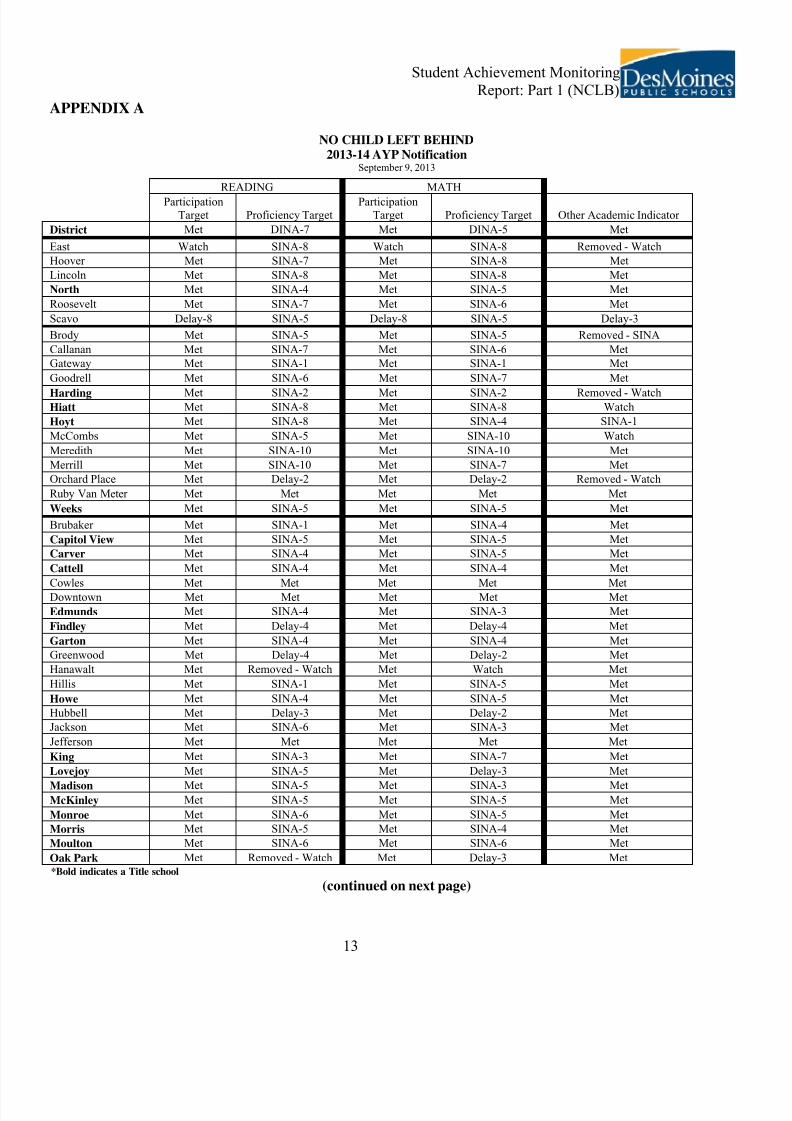
APPENDIX A
NO CHILD LEFT BEHIND
2013-14 AYP NotificationSeptember 9, 2013
READING MATH
ParticipationTarget Proficiency Target
ParticipationTarget Proficiency Target Other Academic Indicator
District Met DINA-7 Met DINA-5 Met
East Watch SINA-8 Watch SINA-8 Removed - Watch
Hoover Met SINA-7 Met SINA-8 Met
Lincoln Met SINA-8 Met SINA-8 Met
North Met SINA-4 Met SINA-5 Met
Roosevelt Met SINA-7 Met SINA-6 Met
Scavo Delay-8 SINA-5 Delay-8 SINA-5 Delay-3
Brody Met SINA-5 Met SINA-5 Removed - SINA
Callanan Met SINA-7 Met SINA-6 Met
Gateway Met SINA-1 Met SINA-1 Met
Goodrell Met SINA-6 Met SINA-7 Met
Harding Met SINA-2 Met SINA-2 Removed - WatchHiatt Met SINA-8 Met SINA-8 Watch
Hoyt Met SINA-8 Met SINA-4 SINA-1
McCombs Met SINA-5 Met SINA-10 Watch
Meredith Met SINA-10 Met SINA-10 Met
Merrill Met SINA-10 Met SINA-7 Met
Orchard Place Met Delay-2 Met Delay-2 Removed - Watch
Ruby Van Meter Met Met Met Met Met
Weeks Met SINA-5 Met SINA-5 Met
Brubaker Met SINA-1 Met SINA-4 Met
Capitol View Met SINA-5 Met SINA-5 Met
Carver Met SINA-4 Met SINA-5 Met
Cattell Met SINA-4 Met SINA-4 Met
Cowles Met Met Met Met Met
Downtown Met Met Met Met Met
Edmunds Met SINA-4 Met SINA-3 Met
Findley Met Delay-4 Met Delay-4 Met
Garton Met SINA-4 Met SINA-4 Met
Greenwood Met Delay-4 Met Delay-2 Met
Hanawalt Met Removed - Watch Met Watch Met
Hillis Met SINA-1 Met SINA-5 Met
Howe Met SINA-4 Met SINA-5 Met
Hubbell Met Delay-3 Met Delay-2 Met
Jackson Met SINA-6 Met SINA-3 Met
Jefferson Met Met Met Met Met
King Met SINA-3 Met SINA-7 Met
Lovejoy Met SINA-5 Met Delay-3 Met
Madison Met SINA-5 Met SINA-3 MetMcKinley Met SINA-5 Met SINA-5 Met
Monroe Met SINA-6 Met SINA-5 Met
Morris Met SINA-5 Met SINA-4 Met
Moulton Met SINA-6 Met SINA-6 Met
Oak Park Met Removed - Watch Met Delay-3 Met
*Bold indicates a Title school
(continued on next page)
7/29/2019 DMPS Student Achievement Monitoring Report - present 9 17 13
http://slidepdf.com/reader/full/dmps-student-achievement-monitoring-report-present-9-17-13 14/15
Student Achievement Monitoring
Report: Part 1 (NCLB)
14
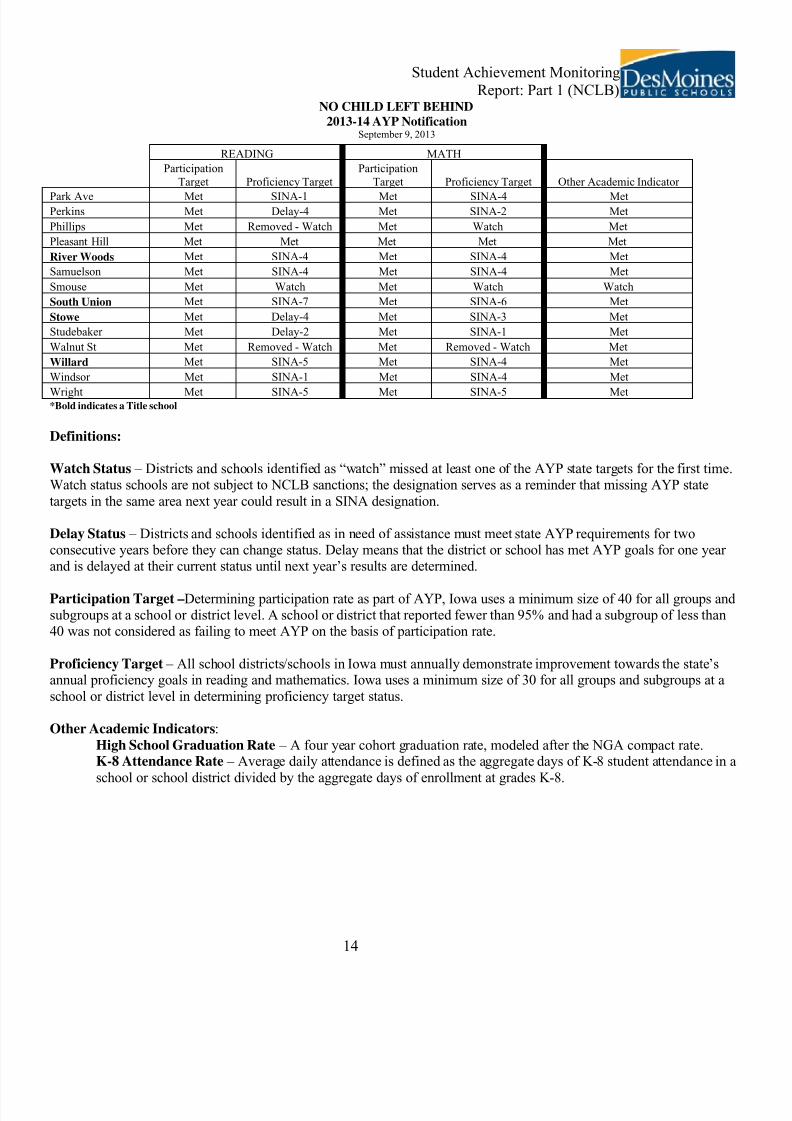
NO CHILD LEFT BEHIND
2013-14 AYP NotificationSeptember 9, 2013
READING MATH
Participation
Target Proficiency Target
Participation
Target Proficiency Target Other Academic Indicator
Park Ave Met SINA-1 Met SINA-4 MetPerkins Met Delay-4 Met SINA-2 Met
Phillips Met Removed - Watch Met Watch Met
Pleasant Hill Met Met Met Met Met
River Woods Met SINA-4 Met SINA-4 Met
Samuelson Met SINA-4 Met SINA-4 Met
Smouse Met Watch Met Watch Watch
South Union Met SINA-7 Met SINA-6 Met
Stowe Met Delay-4 Met SINA-3 Met
Studebaker Met Delay-2 Met SINA-1 Met
Walnut St Met Removed - Watch Met Removed - Watch Met
Willard Met SINA-5 Met SINA-4 Met
Windsor Met SINA-1 Met SINA-4 Met
Wright Met SINA-5 Met SINA-5 Met*Bold indicates a Title school
Definitions:
Watch Status – Districts and schools identified as “watch” missed at least one of the AYP state targets for the first time.Watch status schools are not subject to NCLB sanctions; the designation serves as a reminder that missing AYP state
targets in the same area next year could result in a SINA designation.
Delay Status – Districts and schools identified as in need of assistance must meet state AYP requirements for twoconsecutive years before they can change status. Delay means that the district or school has met AYP goals for one year and is delayed at their current status until next year’s results are determined.
Participation Target –Determining participation rate as part of AYP, Iowa uses a minimum size of 40 for all groups and subgroups at a school or district level. A school or district that reported fewer than 95% and had a subgroup of less than40 was not considered as failing to meet AYP on the basis of participation rate.
Proficiency Target – All school districts/schools in Iowa must annually demonstrate improvement towards the state’sannual proficiency goals in reading and mathematics. Iowa uses a minimum size of 30 for all groups and subgroups at a
school or district level in determining proficiency target status.
Other Academic Indicators:
High School Graduation Rate – A four year cohort graduation rate, modeled after the NGA compact rate.K-8 Attendance Rate – Average daily attendance is defined as the aggregate days of K-8 student attendance in a
school or school district divided by the aggregate days of enrollment at grades K-8.
7/29/2019 DMPS Student Achievement Monitoring Report - present 9 17 13
http://slidepdf.com/reader/full/dmps-student-achievement-monitoring-report-present-9-17-13 15/15
Student Achievement Monitoring
Report: Part 1 (NCLB)
15
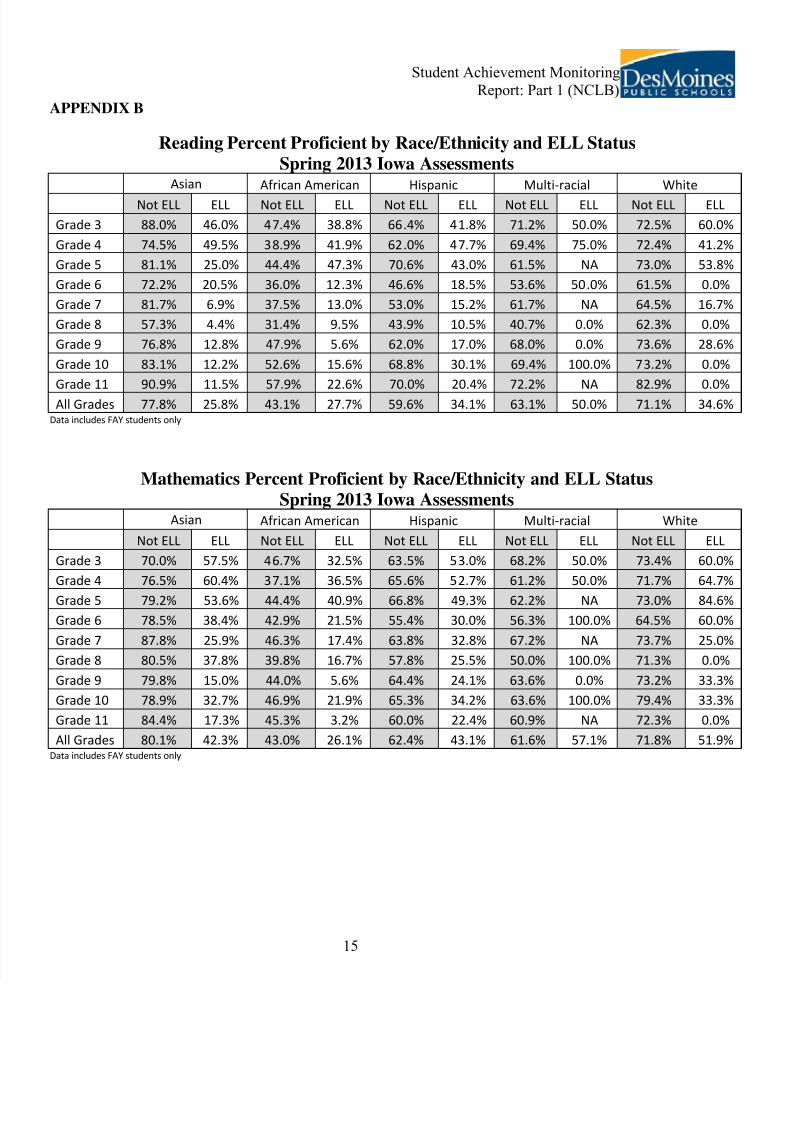
APPENDIX B
Reading Percent Proficient by Race/Ethnicity and ELL Status
Spring 2013 Iowa AssessmentsAsian African American Hispanic Multi-racial White
Not ELL ELL Not ELL ELL Not ELL ELL Not ELL ELL Not ELL ELL
Grade 3 88.0% 46.0% 47.4% 38.8% 66.4% 41.8% 71.2% 50.0% 72.5% 60.0%
Grade 4 74.5% 49.5% 38.9% 41.9% 62.0% 47.7% 69.4% 75.0% 72.4% 41.2%
Grade 5 81.1% 25.0% 44.4% 47.3% 70.6% 43.0% 61.5% NA 73.0% 53.8%
Grade 6 72.2% 20.5% 36.0% 12.3% 46.6% 18.5% 53.6% 50.0% 61.5% 0.0%
Grade 7 81.7% 6.9% 37.5% 13.0% 53.0% 15.2% 61.7% NA 64.5% 16.7%
Grade 8 57.3% 4.4% 31.4% 9.5% 43.9% 10.5% 40.7% 0.0% 62.3% 0.0%
Grade 9 76.8% 12.8% 47.9% 5.6% 62.0% 17.0% 68.0% 0.0% 73.6% 28.6%
Grade 10 83.1% 12.2% 52.6% 15.6% 68.8% 30.1% 69.4% 100.0% 73.2% 0.0%
Grade 11 90.9% 11.5% 57.9% 22.6% 70.0% 20.4% 72.2% NA 82.9% 0.0%
All Grades 77.8% 25.8% 43.1% 27.7% 59.6% 34.1% 63.1% 50.0% 71.1% 34.6%Data includes FAY students only
Mathematics Percent Proficient by Race/Ethnicity and ELL Status
Spring 2013 Iowa AssessmentsAsian African American Hispanic Multi-racial White
Not ELL ELL Not ELL ELL Not ELL ELL Not ELL ELL Not ELL ELL
Grade 3 70.0% 57.5% 46.7% 32.5% 63.5% 53.0% 68.2% 50.0% 73.4% 60.0%
Grade 4 76.5% 60.4% 37.1% 36.5% 65.6% 52.7% 61.2% 50.0% 71.7% 64.7%
Grade 5 79.2% 53.6% 44.4% 40.9% 66.8% 49.3% 62.2% NA 73.0% 84.6%
Grade 6 78.5% 38.4% 42.9% 21.5% 55.4% 30.0% 56.3% 100.0% 64.5% 60.0%
Grade 7 87.8% 25.9% 46.3% 17.4% 63.8% 32.8% 67.2% NA 73.7% 25.0%
Grade 8 80.5% 37.8% 39.8% 16.7% 57.8% 25.5% 50.0% 100.0% 71.3% 0.0%
Grade 9 79.8% 15.0% 44.0% 5.6% 64.4% 24.1% 63.6% 0.0% 73.2% 33.3%
Grade 10 78.9% 32.7% 46.9% 21.9% 65.3% 34.2% 63.6% 100.0% 79.4% 33.3%
Grade 11 84.4% 17.3% 45.3% 3.2% 60.0% 22.4% 60.9% NA 72.3% 0.0%
All Grades 80.1% 42.3% 43.0% 26.1% 62.4% 43.1% 61.6% 57.1% 71.8% 51.9%Data includes FAY students only