Embed Size (px)
Citation preview

DNA DOUBLE-STRAND BREAK REPAIR BY THE
MRE11/RAD50 COMPLEX IN T4 PHAGE
PRIYA JAYARAMAN
NATIONAL UNIVERSITY OF SINGAPORE
2011
DNA DOUBLE-STRAND BREAK REPAIR BY THE
MRE11-RAD50 COMPLEX IN T4 PHAGE
PRIYA JAYARAMAN
(B.Tech, Vellore Institute of Technology, India)
A THESIS SUBMITTED FOR THE DEGREE OF
DOCTOR OF PHILOSOPHY
DEPARTMENT OF BIOLOGICAL SCIENCES
NATIONAL UNIVERSITY OF SINGAPORE
2011
I
ACKNOWLEDGEMENTS
This research work would not have been feasible without the training, support and
guidance provided by my supervisor, Dr. Kim Chu-Young. I am extremely grateful to
him for giving me the opportunity to be a part of his research group. His constant
encouragement during the challenging parts of the project instilled in me a sense of
confidence and determination.
I am thankful to National University of Singapore for granting me a research scholarship
and providing me with the facilities to carry out this research project.
To Dr. Kinya Hotta, I am thankful for his guidance on cloning and protein expression
techniques. I am grateful to Dr. Ganesh S. Anand and his labmembers-Moorthy, Suguna,
Srinath and Jeremy- for their invaluable input during deuterium exchange experiments
and data analysis. I am grateful to Michelle Mok and Lim Teck Kwang from the Protein
and Proteomics Center for their assistance in carrying out the mass spectrometry
experiments. I would also like to thank Dr. Yan Jie from single molecule biophysics lab,
department of physics, NUS, for carrying out the AFM experiments.
I am extremely fortunate to have a family, which has constantly supported my decisions
and encouraged me to pursue research, especially my parents and brother. Special thanks
to my uncle and aunt (Babu mama and Lalitha mammi) here in Singapore, who ensured
that I did not miss home and were always ready to have me over, even if it meant odd
timings after experiments.
Grad school has been one of the steepest learning phases of my life. This learning
experience could not have been as exciting and enjoyable without my labmates and
friends. I thank my labmates Chen Xi, Raymond, Satya, Roopsha, Soumya and Minyi for
the scientific discussions, moral support and fun times in lab. I would also like to thank
my friends Anusha, Ayshwarya, Ashish, Karthik, Madhuvika, Rika and Shaveta who
made my grad school years memorable.

II
TABLE OF CONTENTS
Title Page No
ACKNOWLEDGEMENT I
TABLE OF CONTENTS II
ABSTRACT V
LIST OF FIGURES VI
LIST OF TABLES XIII
ABBREVIATIONS XIV
Chapter1: INTRODUCTION
1.1 DNA damage 2
1.2 Single Strand DNA Repair 4
1.3 Double Strand DNA repair 7
1.4 Cell Cycle Checkpoint Response control by ATM and ATR during DSB 8
1.5 DNA damage and diseases 10
1.6 Mre11/Rad50/Nbs1 complex (MRN) 14
1.7 Scope of the project and AIM 23
1.8 T4 Bacteriophage 25
1.9 Hydrogen/Deuterium Exchange Followed by Mass spectrometry 29

III
Chapter 2: MATERIALS AND METHODS 34
2.1 Cloning, protein expression and purification 35
2.2 Circular Dichroism 35
2.3 Nuclease Assay 35
2.4 Isothermal Titration Calorimetry (ITC) 36
2.5 Atomic Force Microscopy 39
2.6 Hydrogen/Deuterium Exchange followed by Mass Spectrometry 40
Chapter 3: RESULTS AND DISCUSSION
3.1 Protein Expression and Purification 42
3.2 C-terminal domain of T4Mre11 is essential for its nuclease activity 46
3.3 Solution behavior of T4MR complex using HDXMS 48
3.3.1 Formation of the T4MR complex — A conformationally 52
stable state
3.3.2 AMP-PNP captures the complex in an open transition state 52
3.3.3 Conformational changes across lobe II of T4Rad50 54
and T4Mre11 capping domain
3.3.4 Conformational changes across the His loop 57
of T4Rad50 and nuclease motif of T4Mre11
3.3.5 Flexibility of Rad50 coiled-coil segment 59
undergoes changes upon AMP-PNP binding
IV
3.3.6 Effect of AMP-PNP on the distal coiled-coil segments 62
3.4 Hydrolysis of ATP is essential for substrate processing 63
by T4Mre11 dsDNA
Chapter 4: CONCLUSION 65
REFERENCES 71
APPENDIX A: Sequence of T4Rad50 and T4Mre11 80
APPENDIX B: Analytical Ultracentrifugation of the proteins 81
APPENDIX C: Peptide list for Rad50 82
APPENDIX D: Peptide list for Rad50 85
APPENDIX E: Peptide list for Mre11 86
V
ABSTRACT
The T4 phage proteins Mre11 and Rad50, also known as gp46 and gp47, are responsible
for the detection of DNA double-strand break and initiation of its repair. Mre11 carries
out the nuclease and strand annealing activities at the site of damage while Rad50, an
ATPase, regulates the nuclease activity of Mre11. Mutation in either protein can lead to
the loss of DNA repair function and, in humans, this leads to various forms of cancer,
neurological disorders, and immunological deficiencies. Although crystal structures of
Mre11-Rad50 complex have been reported, the precise mechanism of communication
between the two partner proteins in executing the DNA repair remains poorly understood.
We carried out in vitro biophysical characterization of the solution behavior of the T4
Mre11/Rad50 proteins using hydrogen-deuterium exchange followed by mass
spectrometry. Based on our study, we propose a new model for domain arrangement of
T4Mre11/Rad50 proteins in the complex. Our model is found to differ from the models
proposed so far.

VI
LIST OF FIGURES
Figure Page No
1.1 DNA damage response pathway in mammalian cells. Based on the
nature of damage, either of these pathways could function
independently or in combination with one another
3
1.2 DNA damage can be broadly classified into three: single strand breaks
(SSB), bulky lesions and double strand breaks (DSB). A. Single-strand
damage involves breaks in one of the DNA strands or chemical
modification of a single base (red hexagon). Such damages follow the
single-strand repair or base excision repair pathway (section 1.2) B.
Lesions (cyan sphere) that involve chemical modification of the
backbone leads to disruption of the helix backbone and these damages
are repaired by nucleotide-excision repair pathway (section 1.2). C.
DSBs: Bifunctional reagents that lead to interstrand cross-links (grey
dumbbell) or external agents like radical oxygen species lead to break
of both the strands and the damage is subsequently repaired by non-
homologous or homologous recombination pathway based on the
development stage of the cell (section 1.3).(Source: McKinnon PJ, 2009
(3)).
3
1.3 Base excision repair. SSBs arising due to DNA glycosylase action or
direct damage lead to recruitment of poly ADP-ribose polymerase 1
(PARP1) at the damage site, which subsequently activates scaffolding
protein XRCC1, DNA polymerase (Polβ), DNA ligase (LIG3) and
apurinic/apyrimidinic endonuclease 1 (APE1). Based on the length of
nucleotides that is to be excised the protein machinery involved differs.
Repair of longer stretches is carried out by LIG1 and PCNA. Also, in
5

VII
some cases based on the nature of damage at the SSB, tyrosyl DNA
phosphodiesterase 1(TDP1) or aprataxin (APTX) is recruited. TDP1
acts on 3′ modified ends or topoisomerase I DNA adducts while APTX
acts on 5′ ends resulting from abortive ligation events. (Source:
McKinnon PJ, 2009 (3))
1.4 Nucleotide Excision Repair pathway. The primary steps involved in
NER are recognition of the damage, excision and repair synthesis. Two
different pathways within NER differ in recognition step. When the
damage is recognized during transcription and involves transcription
factors (TFIIH) it is termed as transcription coupled repair (TCR). Else,
it is referred to as global genomic repair. Post recognition, the repair
steps followed in both the pathways is similar. The colored blocks on
the right highlight the disorders resulting from dysfunctional proteins of
the NER pathway. (Source: McKinnon PJ, 2009 (3) )
6
1.5 Double strand break repair pathway. Homologous recombination occurs
in proliferating cells. The replication protein A (RPA) and recombinase
Rad51 coat the broken double strand ends and initiates repair by
formation of the holliday junction with the help of the sister chromatid,
which serves a template ensuring a error-free repair. NHEJ occurs in
differentiated cells that lacks a reference template. It involves key
proteins like KU70 and KU80, which modify the damaged end and
prepare it for ligation. Ligation is further carried out by ligase IV
(LIG4), XRCC4, and other proteins. (Source: McKinnon PJ, 2009 (3).
7
1.6 Cell cycle checkpoint activation by ATM and ATR. ATM and ATR
activate check point kinases (CHK) and cell cycle proteins, which arrest
the cell in different stages of cell cycle. Once the repair is completed
successfully, the cell cycle proceeds by activation of cyclin dependent
kinases (CDK). Or else, the cell is directed towards proteasomal
9

VIII
degradation (Source: Branzei D et al. 2008 (9) )
1.7 Role of MRN in DNA repair and cell cycle control. Mre11 leads to
activation of several downstream pathways depending on the nature of
damage. It has been found to play an important role in homologous
recombination (HR), non-homologous end joining (NHEJ) and
activation of apoptotic pathway. This figure emphasizes key role of
MRN complex in maintaining cellular stability. (Source: Stracker. TH.
et al. 2011 (31))
14
1.8 Domain arrangement of Mre11 proteins: (a) The three domains are
highlighted in box form and the flexible linker as the dotted line. The
green segments within the nuclease domain box indicate the
phophodiesterase motifs. (b) Structural presentation of the domains in
Mre11 (Pink). The nuclease motifs harboring the active site are
highlighted in green which occur at the loop segments.
16
1.9 Domain arrangement of Rad50 proteins: (a) Domain arrangement of
Rad50. (b) Structural presentation of the domains in Mre11 (Pink).
Motifs and domains are highlighted in the respective colors shown in
the block diagram (a). (c) MR with truncated Mre11 bound to AMP-
PNP from Pyrococcus furiosus(PDB id: 3QKU). (d)Overlap of free
PfRad50 and AMP-PNP bound PfRad50, highlighting the rotation of
the subdomains (PDB id: 3QKT and 3QKU).
17
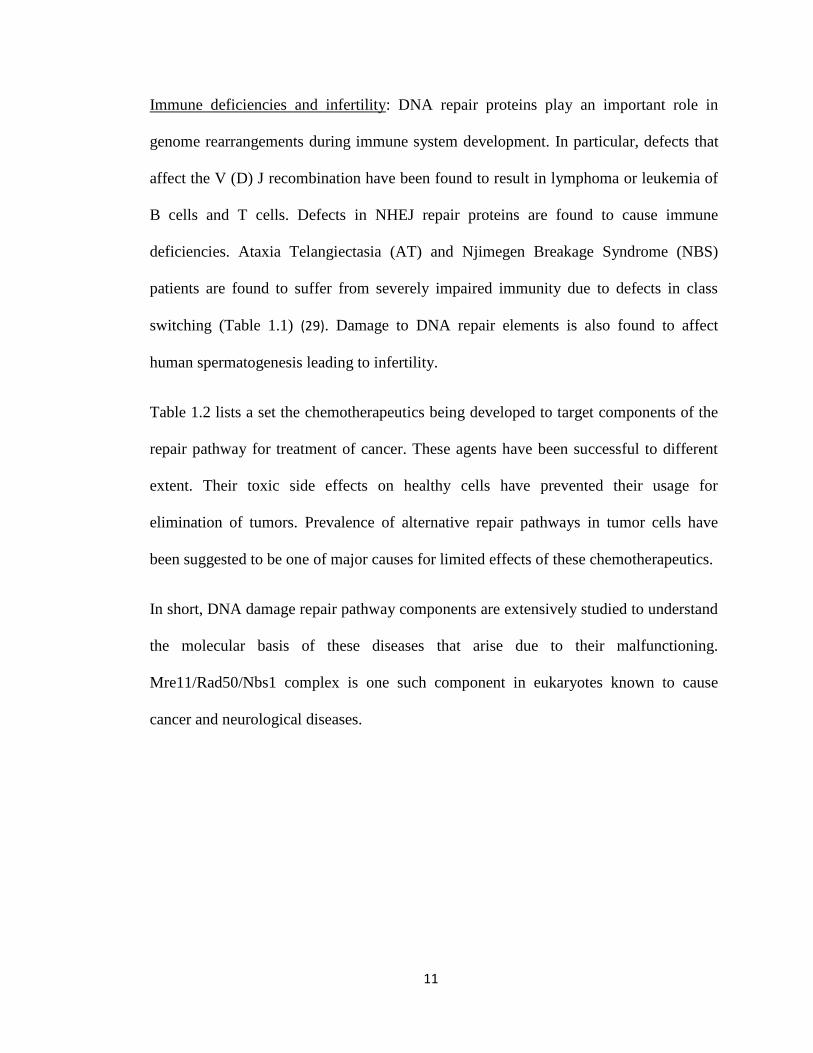
1.10 A. Molecular arrangement of MRN complex, a. Assembly of
Mre11/Rad50/Nbs on the DNA substrate. Rad50 functions as a dimer
and hence harbors two Mre11 interaction sites. The N and C domains of
Rad50 are arranged in an antiparallel fashion b. AFM image of MR
complex in DNA free and bound state. The images highlight the
different orientations of the coiled-coil segment (Source: Stracker. TH.
et al. 2011 (31)) B. Comparison of length of coiled-coil segment in
19

IX
different species. (courtesy: Scott Nelson)
1.11 Crystal structures of MR reported: (a) MR complex from Thermotoga
maritima(PDB id: 3QG5).(b) ATPγS bound Methanococcus jannaschii
(PDB id: 3AV0).
21
1.12 Proposed models of MR complex from different species. The models
highlight the orientation of the different domains in the free complex
(left) and AMP-PNP bound complex (right).
22
1.13 T4 Phage structural organization (53). 25
1.14 Exchangeable hydrogens in a protein. Red: Amide hydrogens with slow
exchange rate, Green: covalently attached hydrogens, which do not
exchange, Blue: side chain hydrogens, which have high exchange rate
and hence, are undetectable. (Source: www.hxms.com)
29
1.15 Workflow for HDMS (Adapted from Busenlehner LS et al. (58)). 31
1.16 Deuterium incorporation quantification. i. Steps involved in the HDX-
MS experiments. ii. Detailed picture of centroid calculation. As shown
in the table, centroid of the mass peak is noted at different time points
(A). The centroid values are used to calculate the relative increase in
deuteration levels (B). The deuterium levels are then plotted vs time (C)
(Adapted from Zheng X et al., 2008 (60) )
31
1.17 A. Linderstrøm-Lang model for deuterium exchange for proteins at
neutral pH subjected to fluctuations. kex –experimental rate constant for
exchange, ki- intrinsic amide exchange rate in the fully unfolded state,
ko -rate of opening and kc -rate of closing. B. The mass spectra profile
for EX1 and EX2 kinetics(Adapted from Zheng X et al., 2008 (60)).
33

X
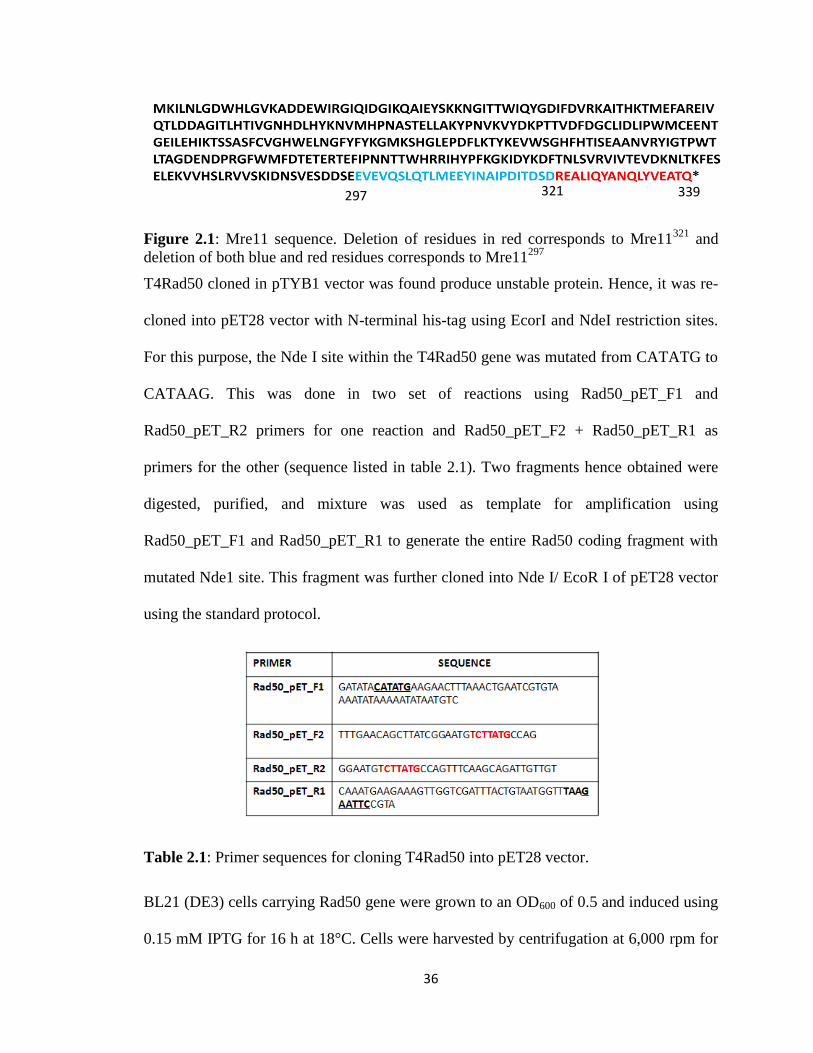
2.1 Mre11 sequence. Deletion of residues in red corresponds to Mre11321
and deletion of both blue and red residues corresponds to Mre11297
37
3.1 T4Mre11WT
Intein tag purification 1: lysate; 2, 3: flow through; 4, 5:
cleavage buffer through the column; 6, 7: the first two chitin column
beads; 8: the second chitin column beads (to remove fusion protein and
intein); 9, 10: elutions; 11, 12: the second elution sample. Molecular
weight of T4Mre11:39kDa.
44
3.2 T4Mre11WT
Purification profiles. A. Anion exchange profile for
T4Mre11WT
B. Gel filtration profile T4Mre11WT
C. SDS-PAGE for
fractions of the gel filtration peak of T4Mre11WT
45
3.3 T4Rad50 purification: A: Gel filtration profile and B: the corresponding
peak fraction purity check using SDS-PAGE. T4Rad50 molecular
weight: 63.3kDa.
45
3.4 T4MR complex purification profile. A: Gel filtration peak of the
complex and B: SDS-gel. The complex gel filtration revealed three
peaks: peak1 and 2 were found to contain the complex; peak3
corresponds to the excess Mre11 protein.
46
3.5 Nuclease assay for testing the activity of T4 Mre11(WT), Mre11(321),
Mre11(297) truncation constructs . dsDNA (30mer) incubated with
Mre11 and activity was arrested at different time points. The samples
were loaded onto TBE gel and stained using gel green for visualization.
DNA substrate incubated with T4 Mre11(WT) for 0min , 10min ,
30min, 8h, 23h (Lanes 1-5), T4 Mre11(321) 0min, 10min, 30min, 8h,
23h (Lanes 6-10)
T4Mre11(297) 0min, 10min, 30min, 8h, 23h (Lanes 11-15).
47

XI
3.6 A. Circular Dichroism spectra of the Mre11 truncated proteins. 48
3.7 Binding isotherms for Mre11 proteins and Rad50. (a) T4Mre11WT (b)
T4Mre11(297) (c) T4Mre11(321). For all the constructs, 65 μM of
Mre11 was titrated against 6 μM of Rad50. The truncation proteins
failed to interact with Rad50. The Mre11 WT was found to show strong
binding to Rad50with a KD=10nM±0.17.
48
3.8a Heat Map of T4Mre11. The three bar represent the exchange
profile for the peptide in Free Mre11, MR complex and MR
Complex with AMP-PNP. Individual bars contain 5 time points
0, 0.5, 1, 2, 5 and 10 mins.
50
3.8b Heat Map of T4Rad50. The three bar represent the exchange
profile for the peptide in Free Rad50, MR complex and MR complex
with AMP-PNP. Individual bars contain 5 time points 0, 0.5, 1, 2, 5 and
10 mins
51
3.9. Amide exchange pattern for the MR complex. The structure of the
T4MR heterotetramer was generated based on MjMR complex bound to
ATPγS (PDB ID: 3AV0) as template using MODELLER.(a) Overall
amide exchange pattern of the Mre11 and Rad50 segments after
complex formation in comparison to the apo proteins. BLUE: represents
peptide segments showing decrease in amide exchange RED: Increase
in amide exchange. (b) Amide exchange pattern of MR-AMP-PNP
complex when compared to the MR complex. (c) Binding of AMP-
PNP at Rad50 dimer interface. The nucleotide binding motifs of Rad50
(RED) and nuclease motifs Mre11 (BLUE) show increase and decrease
in amide exchange, respectively.
52

XII
3.10. Proposed models of MR complex from different species. The models
highlight the orientation of the different domains in the free complex
(left panel) and AMP-PNP bound form (right panel).
54
3.11 Allosteric relay at lobe II of T4Rad50 and capping domain of T4Mre11.
(a) Cross sectional view of the lobe II loop of T4Rad50 and T4Mre11
capping domain interaction segment. The lobe II loop lies adjacent to
the signature motif (green) bound to the ATP-γS.(b) Closer view of
residues speculated to be involved in electrostatic interaction. R460
from T4Rad50 lies adjacent to the T268 and K286 from
T4Mre11.(c)Time course of amide HDX (0.5-10mins) for peptide
fragments 262-272 of Mre11 (m/z = 547.3, z = +2), (d) 282-298(m/z =
954.45, z = +3) and e. Rad50 fragment 454-468 (m/z= 851.4).
57
3.12 Allostery across the T4Rad50 His loop and T4Mre11 nuclease motif.
(a) Cross sectional view of T4Rad50 His-loop and Mre11 nuclease
motif II (51-63) and III (79-97) interaction. The Walker A motif
(Green) which binds to ATP occurs adjacent to the His-loop (Red). (b)
Closer view of the interaction and the residues that could be involve in
the electrostatic interaction.(c) Time course of amide exchange for
Mre11peptide fragment 51-63 (m/z = 525.95, z = +3), (d) Rad50
fragment 532-548 (in complex-AMP_PNP) but 533-548 in others
(e)Mre11 fragment 79-97 (m/z = 550.02, z= +4).
59
3.13 Conformational changes at the T4Mre11-Rad50 interface II. (a) Time
series (0-10mins) spectra of T4Rad50 peptide fragment 168-188 in apo
T4Rad50 protein showing bimodal distribution indicating presence of
more than one conformation. (b) Comparison of amide exchange at
10min time point (168-188) in free protein, after complex formation
and post AMP-PNP binding. The spectra shows absence of biomodal
62
XIII
distribution after complex formation and an increase in amide exchange
rate post AMP-PNP binding when compared to complex. (c) Mapping
of the segments which show changes in amide exchange profile post
AMP-PNP binding in the C-terminal domain of Mre11 and coiled-coil
segment of Rad50 at the interaction interface. These segments undergo
conformational changes which are otherwise not visible in the crystal
structure. (d) Time series of amide exchange of T4Rad50 C-terminal
coiled-coil segment 385-399 (m/z = 591.35, z = +3), e. 400-409 (m/z =
623.34, z = +2) (f) Mre11 C-terminal fragment 310-326 (m/z = 969.7,
z= +2).
3.14 Atomic Force Microscope analysis of T4Mre11 and Rad50 and DNA
binding interaction. (a) The linear PhiX174 DNA that was used in
binding interactions. (b and c) Reaction mixtures of linear PhiX174
DNA incubated with purified MR complex at DNA/protein ratios of
1:100(b) and 1:1000(c), respectively. No obvious binding activity was
observed in both conditions. (d) Reaction mixtures of linear PhiX174
DNA incubated with purified MR complex at DNA/protein ratio of
1:100 in the presence of 1 mM ATPγS. Dots on backbone of DNA
fragments may indicate MR complex bound to DNA. (e and f)
Reactions with linear PhiX174 DNA, incubated with purified MR
complex at DNA/protein ratios either of 1:30(e), or 1:100(f) in the
presence of 1 mM ATP. Flower structure composed of multiple inner
loops within one DNA molecule was observed at DNA/protein ratio of
1:30. Bundle formation was observed at DNA/protein ratio of 1:100.
Arrows indicate the protein bound to DNA. The scale bars are 500 nm.
65
4.1 Model for T4MR complex (a) Complex in free form, is prevented from
binding to DNA substrate as the Rad50 dimers are closer. (b) Complex
bound to AMP-PNP which locks the complex in an open conformation
similar to what has been observed in PfMR complex.
69

XIV
LIST OF TABLES
1.1 Disease caused by defective DNA repair proteins. The table highlights
the disease state, the corresponding phenotype or physiological effect
and the defective proteins responsible for the disease. (Source: Jackson
SP et al., 2009 (2)).
12
1.2 Chemotherapeutics available so far for treatment of cancer which
potentially target the cell cycle proteins (Source: Bolderson E et
al.(30)).
13
1.3 T4 gene segments homologous to eukaryotes and bacteria. (Source:
Bernstein H et al. (55))
28
2.1 Primer sequences for cloning T4Rad50 into pET28 vector. 36

XV
LIST OF ABBREVIATIONS
ABC- ATP Binding Cassette
AFM- Atomic Force Microscopy
AMP-PNP- Adenylyl-imidodiphosphate
AT-Ataxia Telangiectasia
ATM- Ataxia Telangiectasia Mutated
ATP- Adenosine triphosphate
ATR- Ataxia Telangiectasia and Rad3-related protein
AUC- Analytical Ultracentrifugation
BER- Base excision repair
CDK-Cyclin dependent kinases
CHK2- Checkpoint kinases-2
CD- Capping domain of Mre11
DNA- Deoxyribonucleic acid
dsDNA- double strand DNA
DSB- Double strand break

XVI
DTT- Dithiothreitol
EDTA- Ethylenediaminetetraacetic acid
ITC- Isothermal Titration Calorimetry
MR- Mre11/Rad50 complex
MRN- Mre11/Rad50/Nbs1complex
MjMR- Methanococcus Jannaschii MR complex
NBS- Njimegen Breakage Syndrome
NER- Nucleotide Excision Repair
NHEJ- Non-homologous end joining
ND- Nuclease domain of Mre11
PARP- Poly (ADP-ribose) polymerase
PfMR- Pyrococcus furiosus MR complex
RBD- Rad50 binding domain
SDS-PAGE- Sodium dodecyl sulphate- polyacrylamide gel electrophoresis
ssDNA- single strand DNA
SSB- Single strand break
TmMR- Thermotoga maritima MR complex

1
CHAPTER 1
INTRODUCTION

2
1.1 DNA Damage and Repair
Genomic stability, which is essential for maintenance of homeostasis in cells, is
constantly put at risk by DNA damage. Such damage can result from endogenous agents
such as reactive oxygen species generated during cellular processes or from exogenous
agents such as UV radiation or chemotherapeutics (1-4). DNA damage can be broadly
categorized into single-strand breaks, double-strand breaks, base modifications, and
bulky lesions (5). Deletion, mismatch of bases, and translocation of fragments are some
of the most frequently occurring DNA damages. Repair of such damages is essential to
prevent production of aberrant gene products and transmission of miscoded genetic
information to progeny, which leads to developmental abnormalities or cancer,
neurological , and immunological disorders (2, 6-8). Extensive studies have been carried
out to decipher the molecular events occurring during the repair process and to identify
constituent proteins involved in the signaling events (5, 8, 9). The repair pathways differ,
based on the kind of damage and the developmental stage of the affected cell (10). If the
damage is extensive and irreversible, cells are directed to the apoptotic pathway for
elimination from the system (6). Figures 1.1 and 1.2 depict the four major responses to
DNA damage in mammalian cells and the repair pathways followed depending on the
severity of the damage.

3
Figure 1.1: DNA damage response pathway in mammalian cells. Based on the nature of
damage, either of these pathways could function independently or in combination with
one another.
Figure 1.2: DNA damage can be broadly classified into three: single strand breaks
(SSB), bulky lesions and double strand breaks (DSB). A. Single-strand damage involves
breaks in one of the DNA strands or chemical modification of a single base (red
hexagon). Such damages follow the single-strand repair or base excision repair pathway
(section 1.2) B. Lesions (cyan sphere) that involve chemical modification of the
backbone leads to disruption of the helix backbone and these damages are repaired by
nucleotide-excision repair pathway (section 1.2). C. DSBs: Bifunctional reagents that
lead to interstrand cross-links (grey dumbbell) or external agents like radical oxygen
species lead to break of both the strands and the damage is subsequently repaired by non-
homologous or homologous recombination pathway based on the development stage of
the cell (section 1.3).(Source: McKinnon PJ, 2009 (3))
A B C

4
1.2 Single-Strand DNA Repair
Single-strand DNA (ssDNA) repair involves excising either small number of nucleotides
(when the damage is restricted to a single base) through the base excision repair (BER)
pathway or a long stretch of DNA through the nucleotide excision repair (NER) pathway,
respectively.
BER: This involves a lesion-specific DNA glycosylase and an endonuclease that excises
the base followed by recruitment of other enzymes such as APE1 endonuclease,
scaffolding protein XRCC1 (X-ray repair complementing defective repair in Chinese
hamster cells 1) and poly ADP-ribose polymerase (PARP). These proteins along with
DNA polymerase, fill in the gap. The strands are then ligated by ligase III/I based on the
length of the patch (Figure 1.3) (11, 12).
NER: There are of two kinds. When the repair occurs during transcription and involves
Transcription factor II H (TFIIH), transcription and repair complex, it is referred to as
transcription-coupled repair (TCR). In other cases, the repair is termed as global genomic
repair (GGR) (13, 14). These two pathways mainly differ in the proteins involved in the
initial damage recognition process. XPC (xeroderma pigmentosum, complementation
group C)/XPE (also known as DNA binding protein 1) is known to initiate the genomic
repair pathway while CSB (Cockayne Syndrome B) is required to initiate transcription-
coupled repair. Subsequent steps of repair are similar in both the pathways. The damage
verification and DNA unwinding is carried out by TFIIH, XPD, XPG, and XPA proteins,
by formation of a pre-incision complex. The nuclease activity of XPG causes incision to

5
occur, which is followed by gap-filling by DNA polymerase and rejoining by ligase I or
III (Figure 1.4).
Figure 1.3: Base excision repair. SSBs arising due to DNA glycosylase action or direct
damage lead to recruitment of poly ADP-ribose polymerase 1 (PARP1) at the damage
site, which subsequently activates scaffolding protein XRCC1, DNA polymerase (Polβ),
DNA ligase (LIG3) and apurinic/apyrimidinic endonuclease 1 (APE1). Based on the
length of nucleotides that is to be excised the protein machinery involved differs. Repair
of longer stretches is carried out by LIG1 and PCNA. Also, in some cases based on the
nature of damage at the SSB, tyrosyl DNA phosphodiesterase 1(TDP1) or aprataxin
(APTX) is recruited. TDP1 acts on 3′ modified ends or topoisomerase I DNA adducts
while APTX acts on 5′ ends resulting from abortive ligation events. (Source: McKinnon
PJ, 2009 (3))

6
Figure 1.4: Nucleotide Excision Repair pathway. The primary steps involved in NER are
recognition of the damage, excision and repair synthesis. Two different pathways within
NER differ in recognition step. When the damage is recognized during transcription and
involves transcription factors (TFIIH) it is termed as transcription coupled repair (TCR).
Else, it is referred to as global genomic repair. Post recognition, the repair steps followed
in both the pathways is similar. The colored blocks on the right highlight the disorders
resulting from dysfunctional proteins of the NER pathway. (Source: McKinnon PJ, 2009
(3) )
1.3 Double-Strand DNA Repair
Double-strand break (DSB) repair occurs through one of two major pathways,
homologous recombination (HR) or non-homologous end joining (NHEJ). Multiple

7
proteins are involved in sensing the DSB, which help in arresting the cell cycle and
activating the necessary repair pathway.
Figure 1.5: Double strand break repair pathway. Homologous recombination occurs in
proliferating cells. The replication protein A (RPA) and recombinase Rad51 coat the
broken double strand ends and initiates repair by formation of the holliday junction with
the help of the sister chromatid, which serves a template ensuring a error-free repair.
NHEJ occurs in differentiated cells that lacks a reference template. It involves key
proteins like KU70 and KU80, which modify the damaged end and prepare it for
ligation. Ligation is further carried out by ligase IV (LIG4), XRCC4, and other proteins.
(Source: McKinnon PJ, 2009 (3).
HR functions mainly in proliferating cells during the S and G2 phases of the cell cycle.
This repair process involves a sister chromatid which is used as template for correcting

8
the damaged DNA and hence in most cases error-free. The repair is carried out by
Mre11-Rad50-Nbs1 (MRN) protein complex— the protein of our interest. MRN in
association with BRCA1 C-terminal interacting protein (CTIP), generates a 3’ single-
stranded DNA (ssDNA). Replication protein A (RPA) and the recombinase Rad51 coat
the ssDNA generated, initiates formation of a holliday junction intermediate using the
template DNA from the sister chromatid for the repair to proceed (Figure 1.5).
NHEJ is a DSB repair pathway observed in non-replicating or differentiated cells that
lack a reference template. This increases chance of error during the repair process. NHEJ
repair involves modification of the two broken DNA ends so that they are compatible for
direct ligation. The end modification is carried out by DNA protein kinase complex
(DNA-PK), KU70, KU80 (ATP-dependent DNA helicases), and associated end-
processing factors (Figure 1.5). The ligation is catalyzed by DNA ligase IV (LIG4) in
conjunction with XRCC4 and Cernunnos.
1.4 Cell Cycle Checkpoint Response Control by ATM and ATR during DSB
DSB repair is associated with signaling events that prevent cell proliferation until the
repair is completed. This involves activation of specific cell cycle checkpoint kinases
(CHKs) that control the activity of cyclin dependent kinases (CDKs) known to regulate
the cell cycle. Two key DNA damage signaling proteins, ataxia telangiectasia mutated
kinase (ATM) and ataxia telangiectasia and RAD3-related kinase (ATR) phosphorylate
various cell cycle checkpoint effectors (15). ATM and ATR function cooperatively in
response to DSB and studies show that they are non-redundant in their physiological
roles. DNA-PK is another essential kinase involved in NHEJ; however it is found to be
9
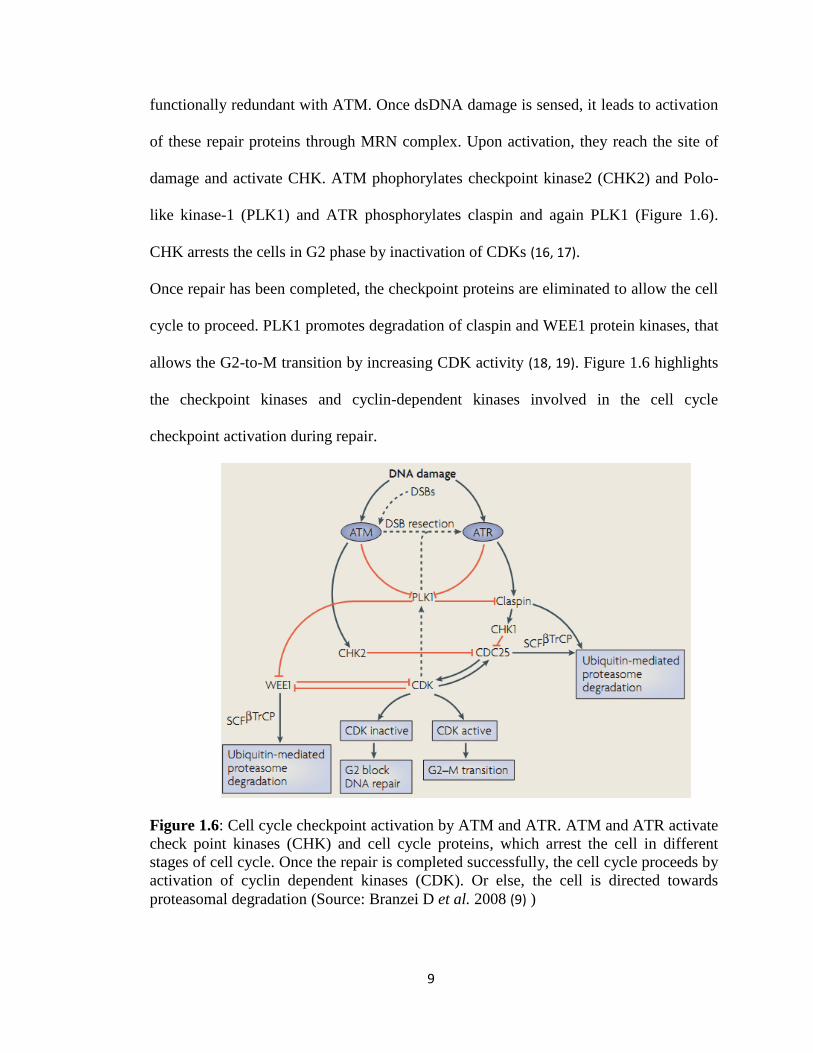
functionally redundant with ATM. Once dsDNA damage is sensed, it leads to activation
of these repair proteins through MRN complex. Upon activation, they reach the site of
damage and activate CHK. ATM phophorylates checkpoint kinase2 (CHK2) and Polo-
like kinase-1 (PLK1) and ATR phosphorylates claspin and again PLK1 (Figure 1.6).
CHK arrests the cells in G2 phase by inactivation of CDKs (16, 17).
Once repair has been completed, the checkpoint proteins are eliminated to allow the cell
cycle to proceed. PLK1 promotes degradation of claspin and WEE1 protein kinases, that
allows the G2-to-M transition by increasing CDK activity (18, 19). Figure 1.6 highlights
the checkpoint kinases and cyclin-dependent kinases involved in the cell cycle
checkpoint activation during repair.
Figure 1.6: Cell cycle checkpoint activation by ATM and ATR. ATM and ATR activate
check point kinases (CHK) and cell cycle proteins, which arrest the cell in different
stages of cell cycle. Once the repair is completed successfully, the cell cycle proceeds by
activation of cyclin dependent kinases (CDK). Or else, the cell is directed towards
proteasomal degradation (Source: Branzei D et al. 2008 (9) )
10
1.5 DNA Damage and Diseases
DNA damage and defective repair proteins are found to be one of the key underlying
causes for various diseases (20-23).
Cancer: Chromosomal translocations arising due to errors in DNA repair pathway result
in the formation of defective gene products, for example, fusion of proto-oncogene loci
to antigen receptors arising from aberrant antigen receptor recombination (24).
Mismatched DNA and mutated bases are found to cause colorectal and endometrial
cancer (25, 26). Carcinogens are found to act by causing mutations, which lead to
uncontrolled cell growth. High cell proliferation rate leads to replication stress and
increased DNA damage, which directs the cells towards the apoptotic pathway.
Mutational or epigenetic inactivation of the proteins involved in the apoptotic pathway
leads to malignancies. Table 1.1 summarizes some of the malignancies caused by
inactivation of repair proteins.
Neurodegenerative diseases: DNA lesions in neuronal cells lead to diseases like ataxia,
Alzheimer’s, Parkinson’s and Huntington’s. High concentration of reactive-oxygen-
species (ROS) in the brain arising due to high mitochondrial respiration, defective repair
genes, and ageing lead to DNA damage in neurons. The damages are usually repaired
through error-prone SSB or NER or NHEJ pathway and improper repair of defective
genes increases the chances of neuronal cell death (23). Terminally differentiated
neurons in adults are more severely affected by such damages due to the lack of
replaceable neuronal cells. Ataxia is one such example where neurodegeneration occurs
due to the defective ATM gene (27),(28)). (Table 1.1 and reference 5 give a detailed note
on DNA damage based neurological disorders.)
11
Immune deficiencies and infertility: DNA repair proteins play an important role in
genome rearrangements during immune system development. In particular, defects that
affect the V (D) J recombination have been found to result in lymphoma or leukemia of
B cells and T cells. Defects in NHEJ repair proteins are found to cause immune
deficiencies. Ataxia Telangiectasia (AT) and Njimegen Breakage Syndrome (NBS)
patients are found to suffer from severely impaired immunity due to defects in class
switching (Table 1.1) (29). Damage to DNA repair elements is also found to affect
human spermatogenesis leading to infertility.
Table 1.2 lists a set the chemotherapeutics being developed to target components of the
repair pathway for treatment of cancer. These agents have been successful to different
extent. Their toxic side effects on healthy cells have prevented their usage for
elimination of tumors. Prevalence of alternative repair pathways in tumor cells have
been suggested to be one of major causes for limited effects of these chemotherapeutics.
In short, DNA damage repair pathway components are extensively studied to understand
the molecular basis of these diseases that arise due to their malfunctioning.
Mre11/Rad50/Nbs1 complex is one such component in eukaryotes known to cause
cancer and neurological diseases.

12
Table 1.1:Disease caused by defective DNA repair proteins. The table highlights the
disease state, the corresponding phenotype or physiological effect and the defective
proteins responsible for the disease. (Source: Jackson SP et al., 2009 (2)).

13
Table 1.2: Chemotherapeutics available so far for treatment of cancer which potentially
target the cell cycle proteins (Source: Bolderson E et al.(30) ).
1.6 Mre11/Rad50/Nbs1 (MRN) Complex
MRN complex is the first responder of the dsDNA damage response pathway. It
activates ATM and ATR kinases which subsequently recruit the cell cycle check point
kinases. Figure 1.7 depicts the role of MRN in multiple DNA repair pathways. MRN
complex is ubiquitous and essential for survival of a cell.

14
Figure 1.7: Role of MRN in DNA repair and cell cycle control. Mre11 leads to
activation of several downstream pathways depending on the nature of damage. It has
been found to play an important role in homologous recombination (HR), non-
homologous end joining (NHEJ) and activation of apoptotic pathway. This figure
emphasizes key role of MRN complex in maintaining cellular stability. (Source:
Stracker. TH. et al. 2011 (31))
Clinical significance of MRN complex: Mutations in Mre11 is found to cause
neurological diseases that phenotypically match ataxia telangiectasia (AT) and is hence
referred to as ataxia telangiectasia like disorder (ATLD) while mutation in Nbs1 causes
Nijmegen breakage syndrome (NBS) (28). AT is characterized by muscle hypotonia,
truncal swaying, abnormality in eye movement, cerebellar dysfunction, inability to sense
vibration, reduction in sensory conduction velocity, and axonal degeneration of
peripheral nerves (28). Mre11 mutation is found to be hypomorphic, which leads to

15
partial loss of function of the MR complex. Patients with this mutation do not have
telangiectasia. However, they develop ataxia-like phenotype with a slower onset of
neuronal degeneration. Mre11 inactivation mutations are also found to cause colorectal
cancer (26, 32). Mutation in NBS gene leads to formation of N-terminal truncated protein.
The N-terminal of Nbs is known to be essential for interaction with Mre11 and Rad50
for subsequent activation of the ATM kinase. This truncation is found to cause
microcephaly with occasional medulloblastoma brain tumors. Mutations in Rad50 gene
have been reported to cause NBS-like disorder with increased radiation sensitivity and
immunodeficiency (33, 34).
Structure and function: MR complex consists of two components: Mre11, a nuclease,
and Rad50, an ATPase which drives the nuclease. Mre11 provides ATP-independent
ssDNA (linear and circular) endonuclease activity and, in the presence of Rad50 and
Mn2+
, it acts as an ATP-dependent 3’ to 5’ dsDNA (linear) exonuclease (35-40). Mre11 is
composed of three domains: nuclease domain (ND), capping domain (CD) and C-
terminal Rad50 binding domain (RBD or CTD) (41-43) (Figure 1.8) . The highly
conserved ND harbors six phophodiesterase motifs while the variable CD determines the
nature of DNA processed by the complex (42, 43). . Dimerization of Mre11 enables DSB
repair to take place by tethering the dimer to two DNA ends and bridging them in a linear
manner (44). (Figure 1.8)

16
A. Mre11 domain arrangement
B. Structural representation
Figure1.8: Domain arrangement of Mre11 proteins: (a) The three domains are
highlighted in box form and the flexible linker as the dotted line. The green segments
within the nuclease domain box indicate the phophodiesterase motifs. (b) Structural
presentation of the domains in Mre11 (Pink). The nuclease motifs harboring the active
site are highlighted in green which occur at the loop segments.
Rad50 belongs to the ABC-ATPase superfamily with DNA binding activity (45). The N-
and C-terminal domains of Rad50 contain the ATP binding Walker motifs; Walker A and
B, respectively. These two nucleotide-binding domains (NBD) are separated by a long,
flexible coiled-coil segment which controls the tethering of DNA strands during repair
(Figure 1.9A) (38, 46). The length of the coiled-coil segment varies from 200-to-700
residues in different species (Figure 1.10B).
Nuclease
domain (ND)
Capping
domain (CD)
Rad50 binding
domain (RBD)

17
A. Rad50 domain arrangement
Figure 1.9: Domain arrangement of Rad50 proteins: (a) Domain arrangement of Rad50.
(b) Structural presentation of the domains in Mre11 (Pink). Motifs and domains are
highlighted in the respective colors shown in the block diagram (a). (c) MR with
truncated Mre11 bound to AMP-PNP from Pyrococcus furiosus(PDB id: 3QKU).
(d)Overlap of free PfRad50 and AMP-PNP bound PfRad50, highlighting the rotation of
the subdomains (PDB id: 3QKT and 3QKU).
C lobe
(NBD)
Coiled-coil
segment
N lobe
(NBD)
B. Structural representation of Rad50 domains C. AMP-PNP-bound PfRad50
D. Overlap of AMP-PNP-bound
and unbound PfRad50
N-Lobe C-Lobe

18
A conserved zinc-finger motif located at the center of this segment mediates dimerization
of two MR complexes during sister chromatid bridging (Figure 1.9A and 1.10A) (46, 47).
The N- and C-domain, also referred to as lobe I and II, house the conserved P, Q, D and
H loops and a characteristic signature motif of the Rad50 family (48) (Figure 1A and
1.9B). Each of these loops aid in conformational changes occurring in the Rad50 dimer
post ATP binding. The coiled-coil domain interacts with Mre11 and allows tethering of
homologous template.
ATP molecules are held by the signature motif of one and the Walker A motif of another
monomer (Figure 1.9C). ATP binding leads to conformational changes across the
ATPase domain and the coiled-coil domain (Figure 1.9D). This conformational change is
linked to unwinding of DNA substrate, which enables Mre11 to process the substrate.
Crystal structures of PfRad50 reveal that ATP binding at the dimer interface leads to ~30º
rotation of coiled coil segment (Figure 1.9D) (41-43).
A
19
Figure 1.10: A. Molecular arrangement of MRN complex, a. Assembly of
Mre11/Rad50/Nbs on the DNA substrate. Rad50 functions as a dimer and hence harbors
two Mre11 interaction sites. The N and C domains of Rad50 are arranged in an
antiparallel fashion b. AFM image of MR complex in DNA free and bound state. The
images highlight the different orientations of the coiled-coil segment (Source: Stracker.
TH. et al. 2011 (31)) B. Comparison of length of coiled-coil segment in different species.
(courtesy: Scott Nelson)
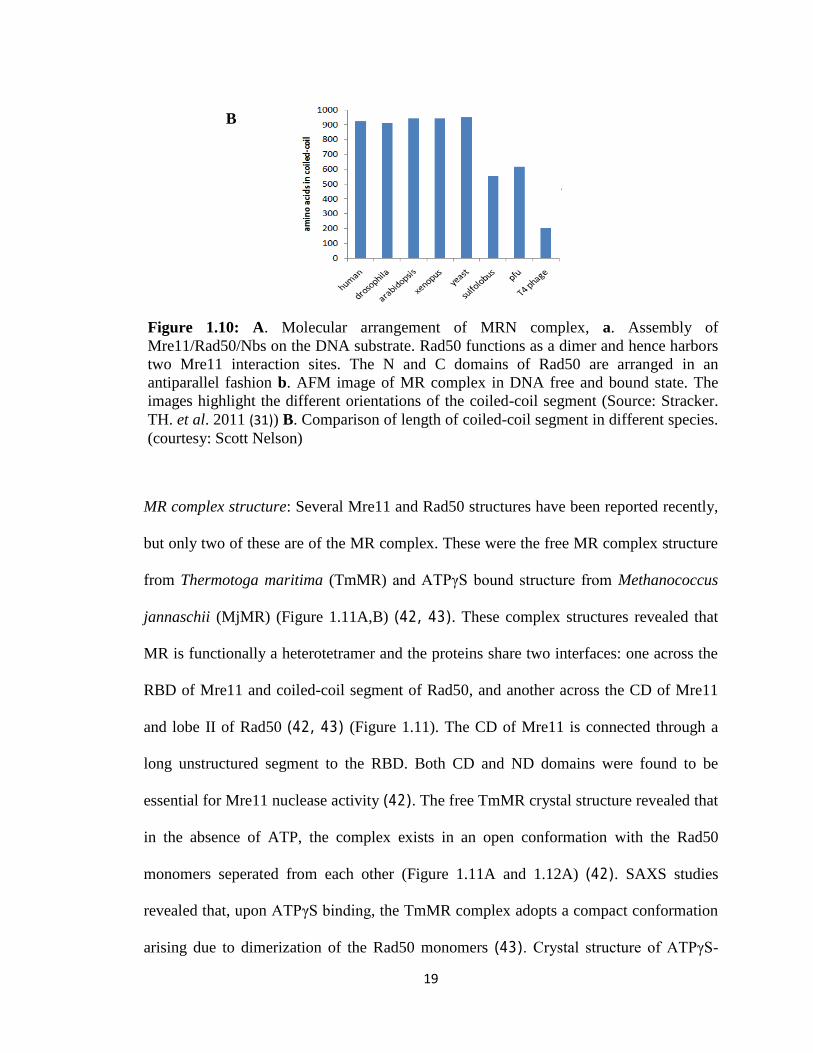
MR complex structure: Several Mre11 and Rad50 structures have been reported recently,
but only two of these are of the MR complex. These were the free MR complex structure
from Thermotoga maritima (TmMR) and ATPγS bound structure from Methanococcus
jannaschii (MjMR) (Figure 1.11A,B) (42, 43). These complex structures revealed that
MR is functionally a heterotetramer and the proteins share two interfaces: one across the
RBD of Mre11 and coiled-coil segment of Rad50, and another across the CD of Mre11
and lobe II of Rad50 (42, 43) (Figure 1.11). The CD of Mre11 is connected through a
long unstructured segment to the RBD. Both CD and ND domains were found to be
essential for Mre11 nuclease activity (42). The free TmMR crystal structure revealed that
in the absence of ATP, the complex exists in an open conformation with the Rad50
monomers seperated from each other (Figure 1.11A and 1.12A) (42). SAXS studies
revealed that, upon ATPγS binding, the TmMR complex adopts a compact conformation
arising due to dimerization of the Rad50 monomers (43). Crystal structure of ATPγS-
B

20
bound MjMR and AMP-PNP-bound Pyrococcus furiosus MR complex (PfMR)
supported this observation (Figure 1.11B, 1.9C) (43, 49).
Based on the structural and biochemical data on MR from different species, multiple
models of DNA repair by the complex have been proposed (Figure 1.12). These models
corroborate the effect of ATP on MR complex. In the absence of ATP, the complex
remains in the open loading form or the substrate accessible form where the separation of
Rad50 monomers opens up the Mre11 nuclease site accessible. This is referred to as the
open clamp mode (Figure 1.12). Binding of ATP leads to dimerization of the Rad50
NBDs which decreases the accessibility to the Mre11 nuclease site. This state is referred
to as the closed clamp mode.
However, the models proposed to date differ in the proposed orientation of Rad50 NBDs
with respect to the Mre11 domains. In the PfMR model constructed based on SAXS data,
Mre11 ND and CD were proposed to be away from the nucleotide-binding region of
Rad50 (50). On the other hand, the TmMR and MjMR structures show the presence of an
interface between CD and NBD of Rad50 and hence in these models the NBDs of Rad50
are oriented in an opposite fashion when compared to PfMR model (Figure 1.12B) (42,
43, 49).
Further, MjMR crystal structure and mutational studies indicated two possible
orientations of Rad50 NBD with respect to Mre11 ND in the non-ATP-bound form which
is highlighted in Figure 1.12C (43).

21
a. TmMR (Free form)
b. MjMR (ATPγS bound form)
Figure 1.11 Crystal structures of MR reported: (a) MR complex from Thermotoga
maritima(PDB id: 3QG5).(b) ATPγS bound Methanococcus jannaschii (PDB id: 3AV0).
Interface I
Interface II
Interface II
Interface I

22
a. TmMR model
b. PfMR model
c. MjMR model
I
II
Figure 1.12: Proposed models of MR complex from different species. Pink: Mre11
domains. Blue: Rad50 domains. Mre11 nuclease domain ( ), capping domain ( ),
linker region ( ), RBD ( ), n-terminal domain ( ), c-terminal domain ( ), coiled-
coil segment ( , ). ATP/AMP-PNP/ATPγS( ). (a) TmMR model (ref) (b) PfMR
model (ref) (c) Two models of MjMR model (ref). The models highlight the orientation
of the different domains in the free complex (left) and AMP-PNP bound complex (right).
Mre11-Rad50 /DNA binding mode Mre11-Rad50-AMP-PNP

23
1.7 SCOPE OF THIS STUDY
Several structural models have been put forth to describe how the MR proteins function,
yet ambiguity in the orchestration of DNA repair by the MR complex remains. Presence
of multiple models for functioning of MR proteins underscores the dynamic nature of
these proteins in solution. This emphasized the need to study the time-course behavior of
MR proteins. Therefore, we chose to conduct a detailed in vitro biophysical
characterization of the solution behavior of the MR proteins in free and complex form
under different conditions over time. For our study, we used the MR complex from
bacteriophage T4 also known as gp46/47 which was recently characterized (51). The
reasons for choosing T4 proteins have been highlighted in section 1.8. We explored the
behavior of T4MR proteins using a heavy isotope labeling technique — amide deuterium
exchange followed by mass spectrometry (HDXMS) (52). A detailed description about
this technique is highlighted in section 1.9. HDXMS serves as an ideal technique to
capture the short time-scale conformational changes occurring in the order of minutes
within the system which are critical for the allosteric regulation of Mre11 nuclease
activity. Using the available database of crystal structures of the MR proteins, we studied
the deuteration pattern of proteins in the unassociated form, in complex form, and AMP-
PNP-bound form. This study enabled us to identify the most probable orientation of the
T4Rad50 and T4Mre11 domains and the allosteric regulation sites in T4Mre11 and
T4Rad50. Some of these sites have been shown to affect the nuclease activity of Mre11
in other species.

24
AIM
In vitro biophysical characterization of the solution behavior of the T4
Mre11-Rad50 complex and propose a model for DNA repair by the
same

25
1.8 T4 Bacteriophage MR complex
T4 is an obligate parasite of Escherichia Coli and one of the key model organisms
studied for over 60 years to understand fundamental processes in molecular biology. It is
composed of an icosahedral-shaped head harboring the genetic material required for its
replication, followed by a neck segment with collar and a hollow tail segment surrounded
by a contractile sheath, which allows it to attach to host cell for transfer of the genetic
material.
Figure 1.13: T4 Phage structural organization (53).
The T4 genome is composed of 168.9 kbp long linear double-stranded DNA, which
codes for over 300 gene products. The DNA sequence was found to be redundant at the
termini, leading to increase in length to about 172 kb, which is known to be a replication
strategy to protect DNA during replication (54). It is also the first virus found to contain

26
introns in its genome, which was one of the key indicators of its ancestral relationship to
eukaryotes.
T4 and T2 phage were among the first model organisms used to demonstrate existence of
DNA as a genetic material, triplet genetic code, discovery of mRNA, importance of
recombination in DNA replication, DNA repair mechanisms, restriction and modification
of DNA, splicing of introns, and many more fundamental biological concepts. Analysis
of the T4 nucleotide-synthesizing complex, the replisome, and recombination complexes
has given us insights into macromolecular interactions and how biological “molecular
machines” function (53).
Ease of production and isolation of T4 proteins in the 1970s allowed study of duplex
DNA replication mechanisms and the proteins involved. Later studies on eukaryotic and
bacterial replication systems were found to correspond highly with what was known from
the T4 phage system. Berstein et al. carried out an extensive genetic homology study of
the T4 genes with the bacterial and eukaryotic counterparts and showed that they share
equal ancestry with eukaryotes and bacteria. Table 1.3 lists some of the T4 genes
homologous to bacterial and eukaryotic genes (55). Our study focuses on the gene
products 46 and 47 (highlighted in Table 1.3), which are homologues of human Rad50
and Mre11 proteins, respectively. T4Rad50 and Mre11 share 38% and 28% sequence
identity with corresponding human homologues. gp46 and 47 are among 130
uncharacterized genes from T4 phage genome. All the recombination-dependent DNA
replication enzymes and proteins in T4 phage have been characterized, except gp46/gp47
complex. In this thesis, gp47 and gp46 are referred to as T4Mre11 and T4Rad50,
respectively.

27
As highlighted in earlier sections, extensive biochemical and structural studies have been
carried out on archae and bacterial counterparts of Mre11 and Rad50 proteins. Crystal
structures of MR complexes from Pyrococcus furiosus (thermophilic archae),
Thermotoga maritima (thermophilic bacteria) and Methanococcus jannaschii
(hyperthermophilic archae) have been published (41-43). Biochemical characterization of
the T4MR proteins revealed that it behaves in a similar fashion as other MR proteins (53).
However, there have been no structural or biophysical studies carried out yet on the
T4MR proteins
Ease of production: T4Rad50 coiled-coil segment is composed of only 200 residues as
compared to the humanRad50, which is composed of 900 residues. Thus, functional
heterotetrameric T4MR complex, with a molecular weight of 200kDa, is one of the
smallest across the three kingdoms (Figure 1.10B). T4Mre11 and Rad50 protein yields
are much higher (10-25mgs from 1l of E.Coli culture) when compared to yeast and
human MR complex where the yield typically ranges in microgram quantities (51, 56, 57).
Human Rad50, which is co-expressed with Mre11 in insect cell lines, is found to be
difficult to express due to the length and flexibility of the coiled-coil segment. However,
T4Rad50 owing to a smaller size is found to be comparatively more stable and easier to
handle in laboratory conditions.

28
Table 1.3: T4 gene segments homologous to eukaryotes and bacteria. (Source: Bernstein
H et al. (55))

29
1.9 Hydrogen/Deuterium Exchange followed by Mass Spectrometry (H/DX-MS)
Figure 1.14: Exchangeable hydrogens in a protein. Red: Amide hydrogens with slow
exchange rate, Green: covalently attached hydrogens, which do not exchange, Blue: side
chain hydrogens, which have high exchange rate and hence, are undetectable. (Source:
www.hxms.com)
Amide hydrogen/deuterium exchange mass spectrometry is a sensitive technique used to
study protein-protein, protein-ligand interactions, protein folding and denaturation in
solution (52, 58, 59). Proteins constantly undergo exchange of hydrogens with the
solvent. There are two different kinds of hydrogen atoms available for exchange in a
polypeptide chain – main chain amide hydrogens and side chain hydrogens. The main
chain hydrogens, which are covalently linked to carbon atoms do not exchange while
side chain hydrogens have a high back exchange rate and hence are not monitored
during experiments (Figure1.14).

30
The exchange kinetics of a protein is a function of its structure, pH of the solution, and
the adjacent side chain groups of an exchangeable amide. The exchange kinetics is
monitored by diluting concentrated protein solution in D2O, which leads to replacement
of amide hydrogen during solvent exchange by deuterium, a heavier isotope. The proton
abstraction can be catalyzed by D3O+
(acid), OD−
(base), D2O or buffer ions. At
physiological pH, at which the proteins function, it is catalyzed by OD (59).
A-H + OD− A
− + H-OD
A−
+ D3O+
A-D + D2O
This exchange reaction is quenched by lowering the pH to 2.5 and temperature to 4ºC.
The deuterated sample is further subjected to digestion by pepsin (which functions at low
pH). The pepsin-generated peptide fragments are resolved using reversed-phase HPLC
and further analyzed using ESI-MS (electrospray ionization mass spectrometry).
The number of deuterium incorporated is calculated by the given equation (58):
Where D is the deuterons incorporated after correcting for those lost during the digestion
and separation, N is the number of exchangeable amides (total no. of amides minus N
terminal and prolines if any), m0%, m100% and m refer to average of the molecular masses
(centroid of the MS peak) of the non-deuterated, completely-deuterated control samples
and sample at time point t, respectively (58). The corrected deuterons number is then
plotted versus time using first-order reaction parameters (Figure 1.16).

31
Figure 1.15: Workflow for HDMS (Adapted from Busenlehner LS et al. (58) ).
Figure 1.16: Deuterium incorporation quantification. i. Steps involved in the HDX-MS
experiments. ii. Detailed picture of centroid calculation. As shown in the table, centroid
of the mass peak is noted at different time points (A). The centroid values are used to
i ii

32
calculate the relative increase in deuteration levels (B). The deuterium levels are then
plotted vs time (C) (Adapted from Zheng X et al., 2008 (60) ).
The solvent accessibility of different segments of a protein differs according to its tertiary
structure. Residues occurring in the compactly folded hydrophobic core would be less
solvent accessible compared to those present on the surface, which gives rise to different
exchange patterns in peptide spanning the two regions. This difference in exchange rate
serves as a tool to monitor conformational changes in a protein when its environment
changes (58, 59).
Regional unfolding and refolding events in solution contribute to the intrinsic exchange
rate of an amide. Figure 1.17 shows the Linderstrøm-Lang model for deuterium exchange
kinetics in solution. There are two kinds of kinetics described by the model: EX1 and
EX2. In EX1 kinetics, the rate of local folding (kc) is faster than rate of intrinsic amide
exchange rate (ki), hence rate of exchange (kex) depends on intrinsic exchange rate and
equilibrium constant between open and closed state (ko/kc). In EX2 kinetics, rate of
intrinsic exchange is faster than rate of folding and hence rate of exchange (kex) is
determined by rate of opening (ko) (refer to equation in Figure 1.17). EX2 is characterized
by random distribution of amides while peptides showing EX1 are characterized by
regions, which either get completely or not at all deuterated, thus generating a bimodal
isotopic pattern in the mass spectra (58, 60).
Hydrogen bonding, solvent accessibility, and backbone flexibility affect the kinetics of
hydrogen exchange. Comparison of the exchange profiles of protein fragments in native
state and the ligand-bound state provides insight into local and global conformational
changes occurring within the protein.

33
Figure 1.17: A. Linderstrøm-Lang model for deuterium exchange for proteins at neutral
pH subjected to fluctuations (58). kex –experimental rate constant for exchange, ki-
intrinsic amide exchange rate in the fully unfolded state, ko -rate of opening and kc -rate of
closing. B. The mass spectra profile for EX1 and EX2 kinetics (Adapted from Zheng X et
al., 2008 (60)).
Our study focuses on identifying the conformational changes occurring in Mre11 and
Rad50 once the MR complex formation occurs and after AMP-PNP binds to the complex.
The hydrogen exchange profiles of the free proteins, the complex, and AMP-PNP-bound
complex were compared to identify the regions undergoing changes deuteration pattern.
A B

34
CHAPTER 2
MATERIALS AND METHODS

35
2.1 Cloning, protein expression and purification
T4Mre11 cloned into pTYB1 plasmid for intein-assisted tag-free protein production
(New England Biolabs, Ipswich, MA, U.S.A.) was obtained from Scott Nelson’s
laboratory (51). C-terminal truncated T4Mre11: Mre11297
(1-297), Mre11321
(1-321), were
prepared by amplifying and inserting respective sequences into pTYB1 (Figure 2.1).
These truncations are designed based on the available PfMre11 crystal structure (PDB id:
1ii7) and secondary structure prediction tools- SABLE and FASS03 (61, 62). Full length-
T4Mre11WT
, T4Mre11297
, and T4Mre11321
were expressed in BL21 (DE3) (Invitrogen,
Carlsbad, CA, U.S.A.). Cells were grown to an OD600 of 1.0 and expression was induced
using 0.15 mM IPTG for 16 h at 18°C. Cells were harvested by centrifugation at 6,000
rpm for 30 min, frozen at –80°C, and lysed in the Mre11 lysis buffer (20 mM Tris-HCl
pH 7.8 and 1 mM EDTA) with 500 mM NaCl. After centrifugation at 12,000 rpm for 45
min, the cell-free extract was loaded onto a chitin column and washed overnight with the
Mre11 lysis buffer with 1 M NaCl. Following the wash, on-column intein cleavage and
T4 Mre11 release was performed by quickly flushing the column with cleavage buffer
containing 75 mM β-mercaptoethanol and incubating the column at 4°C for 24 h. After
cleavage, T4Mre11 was eluted from the column using the Mre11 lysis buffer. The eluted
proteins were dialyzed into buffer A (20 mM Tris-HCl pH 7.5, 1 mM DTT, 1 mM
EDTA, 10% glycerol) for anion exchange chromatography using Hitrap Q XL (GE
Healthcare, Piscataway, NJ, U.S.A.). Full-length and truncated Mre11 were eluted at 27%
buffer B (buffer A with 1 M NaCl). The eluted Mre11 fractions were further purified by
gel-filtration using Superdex 200 10/300 GL (GE Healthcare) with a running buffer
containing 20 mM sodium phosphate pH 7.5, 0.1 mM EDTA, and 5% glycerol.
36
Figure 2.1: Mre11 sequence. Deletion of residues in red corresponds to Mre11321
and
deletion of both blue and red residues corresponds to Mre11297
T4Rad50 cloned in pTYB1 vector was found produce unstable protein. Hence, it was re-
cloned into pET28 vector with N-terminal his-tag using EcorI and NdeI restriction sites.
For this purpose, the Nde I site within the T4Rad50 gene was mutated from CATATG to
CATAAG. This was done in two set of reactions using Rad50_pET_F1 and
Rad50_pET_R2 primers for one reaction and Rad50_pET_F2 + Rad50_pET_R1 as
primers for the other (sequence listed in table 2.1). Two fragments hence obtained were
digested, purified, and mixture was used as template for amplification using
Rad50_pET_F1 and Rad50_pET_R1 to generate the entire Rad50 coding fragment with
mutated Nde1 site. This fragment was further cloned into Nde I/ EcoR I of pET28 vector
using the standard protocol.
Table 2.1: Primer sequences for cloning T4Rad50 into pET28 vector.
BL21 (DE3) cells carrying Rad50 gene were grown to an OD600 of 0.5 and induced using
0.15 mM IPTG for 16 h at 18°C. Cells were harvested by centrifugation at 6,000 rpm for
297 321 339

37
30min, frozen at –80°C, and lysed in the Rad50 lysis buffer (50 mM sodium phosphate
pH 7.4, 300 mM NaCl) with 10 mM imidazole and 10% glycerol. After centrifugation at
12,000 rpm for 45 min, the cell-free extract was loaded onto a cobalt column (Thermo
Scientific) and washed with the Rad50 lysis buffer. T4Rad50 was eluted using lysis
buffer containing 150 mM imidazole, and further purified by gel-filtration (Superdex 200
10/300 GL) in buffer containing 20 mM Tris-HCl, pH 7.2, 150 mM NaCl, 1 mM EDTA.
For complex preparation, purified Mre11 and Rad50 were mixed at a 2:1 molar ratio, and
the mixture was purified using gel filtration in similar fashion as Rad50. For the complex
with AMP-PNP sample, the protein was gel filtration purified into buffer containing 20
mM Tris-HCl pH 7.2, 5 mM MgCl2, 1 mM MnCl2, 5% glycerol. The protein after
purification was concentrated to desired level and then incubated with 1 mM AMP-PNP
for 30 min before performing the deuterium exchange experiments.
2.2 Circular Dichroism
Full length Mre11 and its truncated versions were concentrated to 100 μM in 20 mM
sodium phosphate pH 7.5, 0.1 mM EDTA. The CD spectrum was measured using a Jasco
J810 spectropolarimeter equipped with a Peltier temperature controller and a quartz cell
of 0.1 cm path length. The spectrum was recorded at a bandwidth of 0.1nm and
acquisition time of 50 nm/sec. Three scans were performed at wavelength ranging from
190 nm to 260 nm at 25° C. The sample spectra were corrected by subtracting the buffer
spectrum. The data is presented in millidegrees.
38
2.3 Nuclease Assay
Mre11 nuclease assay was performed in 20 mM Tris-HCl pH 8.0, 50 mM NaCl, 1 mM
DTT, 5 mM MgCl2, 1 mM MnCl2, 2 mM ATP at 37°C. Mre11, the truncated protein
were incubated with Rad50 and dsDNA substrate (5’CTT ACT GTG TCA TCT CTT
ACT GTG TCA TCT 3’) at a concentration of 0.3 μM in separate tubes. Samples were
collected at 0 min, 10 min, 30 min, 8 h, and 23 h, and loaded onto 20% TBE-PAGE gel
and stained using gel green for analysis.
2.4 Isothermal Titration Calorimetry (ITC)
Microcal VP-ITC (GE Healthcare) was used to estimate the KD and stoichiometry for the
interaction of Rad50 and T4Mre11 variants mentioned above using standard procedure as
described earlier (50, 62-66). Titrations were performed with the Mre11 proteins and
Rad50 at 25°C in 20 mM Tris-HCl pH7.2, 150 mM NaCl, 1mM EDTA at 25ºC. The
proteins were dialyzed into the buffer at 4ºC before titrations to ensure that the heat
change due to buffers is minimized. The proteins were then concentrated using Vivaspin
concentrators (GE Healthcare) and degassed under vacuum by gentle stirring for five
minutes just before use. T4Mre11 proteins (65 µM in the syringe) were titrated in 10 µl
increments against Rad50 (6 µM in the well) with a time interval of 270s. The baseline of
the isotherm was smoothened and baring the first peak, other peaks were integrated to
obtain the heat change. The stoichiometry (N), the dissociation constant (KD) and the
enthalpy ΔH were calculated using ORIGINTM
software package provided by Microcal
(GE Healthcare).

39
2.5 Atomic Force Microscopy
The linear PhiX174 DNA was used for AFM analysis, which was obtained by digesting
PhiX174 plasmid (New England Biolabs Inc., Ipswich, MA, U.S.A) with restriction
enzyme StuI (New England Biolabs Inc., Ipswich, MA, U.S.A). The fragment was
further purified using QIAquick PCR purification kit (QIAGEN, CA, U.S.A). The DNA
sample was prepared in imaging buffer (20 mM Tris-HCl, 10 mM MgCl2, 25 mM NaCl,
pH 8.0) at concentration of 0.1ng/µl. Mre11–Rad50–DNA mixtures of certain
DNA/protein ratios was prepared by incubating 2 ng linear PhiX174 DNA with
corresponding amount of purified T4Mre11 and Rad50 complex in a final volume of 20
µl at 37°C for 20 min. ATP (1 mM) or ATPγS (1 mM ) was added together with DNA
and protein prior to incubation for Mre11–Rad50–DNA mixtures in the presence of ATP
or ATPγS. The mixtures were then diluted 10-fold in imaging buffer, and 50 µl portion
was deposited on freshly cleaved mica. After about 12 min, mica was washed with
deionised water, and dried with a stream of compressed nitrogen gas. Samples were
imaged with a Molecular Imaging atomic force microscope (Agilent Technologies,
Santa Clara, CA, U.S.A) operated in AAC mode in air at room temperature. Silicon
AFM probes, BudgetSensors Tap 300 (Innovative Solutions Bulgaria Ltd., Sofia,
Bulgaria) were used. AFM images were processed only by flattening to remove the
background slop using the Gwyddion software.
2.6 Hydrogen/Deuterium Exchange followed by Mass Spectrometry (H/DX–MS)
Purified T4Mre11, T4Rad50 and complex were concentrated to 35, 25 and 50 µM,
respectively, using VivaspinTM
concentrator (Sartorius, Goettingen, Germany) and

40
concentrations were estimated using UV spectrophotometer (280nm). Four samples were
prepared in respective sample buffers:
a. 35 µM of T4Mre11 in 20 mM Tris-HCl pH 7.5, 0.1 mM EDTA
b. 25 µM of T4Rad50 in 20 mM Tris-HCl pH 7.2, 150 mM NaCl, 1mM EDTA
c. 5 µM T4MR complex without AMP-PNP in 20 mM Tris-HCl pH 7.2, 150 mM NaCl,
1mM EDTA.
d. 50 µM complex with AMP-PNP in 20 mM Tris-HCl pH 7.2, 150 mM NaCl, 1 mM
MnCl2, 5 mM MgCl2. The complex was incubated with 1mM of AMP-PNP for 30mins
before performing the experiment.
Preliminary runs were carried out to determine the optimum concentration required for
each sample. 2 µl of the samples were incubated in 18 µl respective sample buffers
prepared in D2O (final concentration-90%) for various time intervals (0.5, 1, 2, 5 and
10min) at 20ºC. The exchange reaction was quenched using 30 µl of prechilled 0.1%
TFA to lower the pHread to 2.5. 50 µl of the quenched sample was injected into nano-
UPLC sample manager (Waters, Milford, MA, USA) maintained at 4°C, wherein, the
sample was allowed to pass through a pepsin column (Porozyme, ABI, Foster City, CA)
using 0.05% formic acid as solvent at a flow rate of 100 µl/min. The digested peptides
were then trapped in a 2.1 x 5 mm C18 column (ACQUITY BEH C18 VanGuard Pre-
column, 1.7 μm, Waters, Milford, MA), eluted using a gradient of 8-40% acetonitrile
containing 0.1% formic acid at a flow rate of 40 µl/min using nano ACQUITY Binary
Solvent Manager (Waters, Milford, MA). The eluted peptides were further resolved using
a reversed–phase, 1.0 x 100 mm, C18 column (ACQUITY UPLC BEH, Waters, Milford,

41
MA, USA). This was followed by mass spectrometric analysis using SYNAPT HDMS
(Waters, Manchester, UK) in MSE mode (67). Samples were tested for each time point in
duplicates. The instrument was continuously calibrated with Glu-fibrinogen peptide
(GFP) at 100fmol/µl.
Using the MSE
data, a peptide list was generated based on the undeuterated sample using
ProteinLynx Global Server (PLGS 2.4 beta test version, Waters, Milford, MA, USA) (68).
The peptides, which appeared in duplicate sets were selected and further analyzed using
HDX browser (prototype by Waters, Milford). Time point data for each peptide was
collated on HDX browser, extracted into a format compatible for analysis using HX
express program to quantify the deuterons incorporated (69, 70). Each peptide was
manually analyzed to eliminate peaks with poor signal to noise ratio. Control experiments
were carried out to estimate the back exchange rate wherein the sample was incubated in
D2O for 24 hours. Peptides from highly solvent exchangeable region, which underwent
100% exchange at 10 min time point, were chosen. Average of the back exchange rate
seen in these peptides was estimated to be 32.7% (71, 72). This exchange rate was found
to be consistent in multiple rounds of experiments. Hence, all the centroid values for the
peptides were corrected by a multiplication factor of 1.49. The deuteron numbers were
then plotted against time based on one-phase association model using PRISMTM
.(GraphPad Software, Inc., La Jolla, CA, U.S.A. (43, 73) ).

42
CHAPTER 3
RESULTS AND DISCUSSION
43
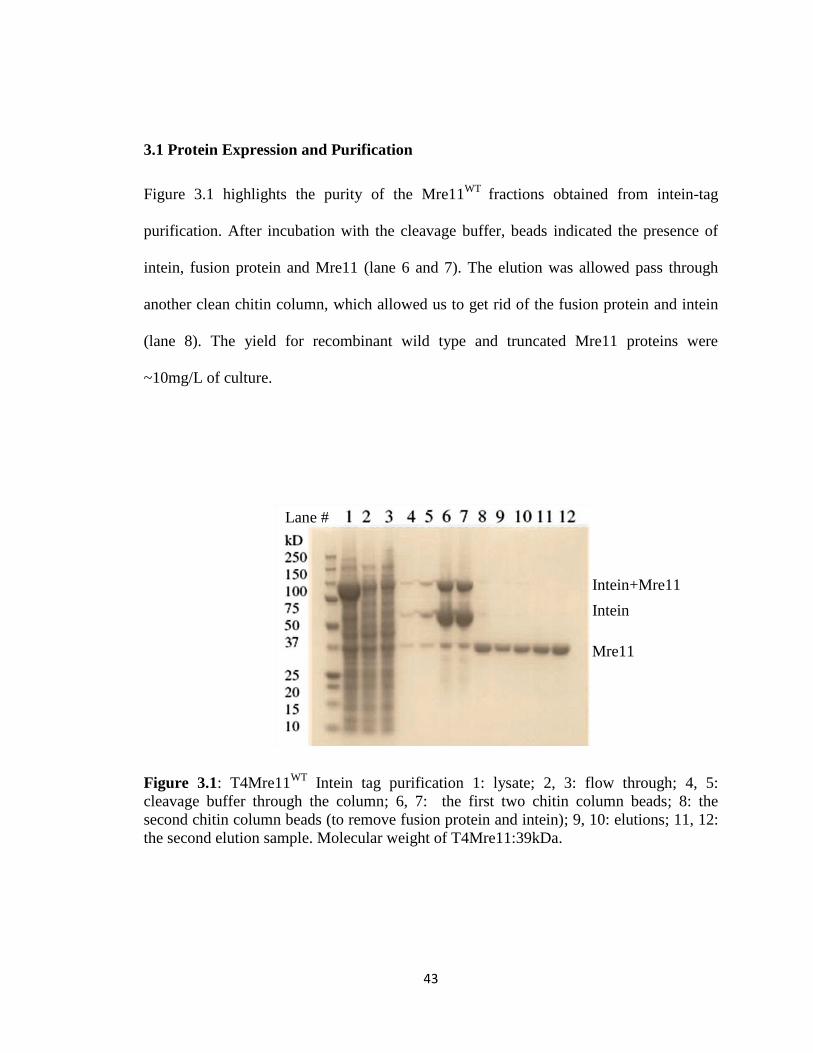
3.1 Protein Expression and Purification
Figure 3.1 highlights the purity of the Mre11WT
fractions obtained from intein-tag
purification. After incubation with the cleavage buffer, beads indicated the presence of
intein, fusion protein and Mre11 (lane 6 and 7). The elution was allowed pass through
another clean chitin column, which allowed us to get rid of the fusion protein and intein
(lane 8). The yield for recombinant wild type and truncated Mre11 proteins were
~10mg/L of culture.
Figure 3.1: T4Mre11WT
Intein tag purification 1: lysate; 2, 3: flow through; 4, 5:
cleavage buffer through the column; 6, 7: the first two chitin column beads; 8: the
second chitin column beads (to remove fusion protein and intein); 9, 10: elutions; 11, 12:
the second elution sample. Molecular weight of T4Mre11:39kDa.
Intein+Mre11
Intein
Mre11
Lane #

44
d
Figure 3.2: T4Mre11WT
Purification profiles. A. Anion exchange profile for T4Mre11WT
B. Gel filtration profile T4Mre11WT
C. SDS-PAGE for fractions of the gel filtration peak
of T4Mre11WT
.
Figure 3.3: T4Rad50 purification: A: Gel filtration profile and B: the corresponding peak
fraction purity check using SDS-PAGE. T4Rad50 molecular weight: 63.3kDa
A B
C
A B

45
Intein-tag T4Rad50, which initially gave us poor yields and unstable protein was found to
give significantly pure protein and higher yields after cloning into pET28 vector with his-
tag. The yield for his-tag T4Rad50 was found to be ~30mg/L of culture.
Figure 3.4: T4MR complex purification profile. A: Gel filtration peak of the complex
and B: SDS-gel. The complex gel filtration revealed three peaks: peak1 and 2 were found
to contain the complex; peak3 corresponds to the excess Mre11 protein.
The gel filtration purification of T4MR complex revealed presence of three peaks. Based
on analysis using SDS-PAGE, peak 1 and 2 were both found to contain the complex and
peak 3 was found to contain excess Mre11 (Figure 3.4). Peak1 and 2 were further
analyzed using analytical ultra centrifugation experiments (AUC) (refer to appendix B).
Peak 2 was found to correspond to a molecular weight of 189kDa indicating a
stoichiometric ratio of 2:2 of the proteins when in complex (Mre11-39kDa, rad50-
62kDa). Peak1 was found to give an anomalous molecular weight and hence eliminated
from further analysis. Addition of ATP to the complex obtained from peak 2 did not
influence the molecular weight (appendix B). Peak2 was hence used for all subsequent
analyses.
1
2
3
37kDa
75kDa
Peak1 Peak2
A B

46
3.2 C-terminal domain of T4Mre11 is essential for its nuclease activity
We sought to first identify the minimal fragment of T4Mre11 required for MR
functioning. Hence the two Mre11 constructs truncated at C-terminal were designed:
T4Mre11321
and T4Mre11297
. The wild type Mre11 (Mre11WT
) is 339 residues long.
These proteins were tested for exonuclease activity on a 30mer dsDNA in the presence of
Rad50, ATP, Mg2+
and Mn2+
. Mre11WT
digested the substrate in ten minutes but the
truncated Mre11s failed to do so even after 8 hours (Figure 3.5). Circular dichroism
results indicated that the lack of activity was not due to loss of structure (Figure 3.7).
Subsequently, binding studies were carried out to test if the truncated proteins were able
to bind T4Rad50 using isothermal titration calorimetry (ITC). The binding isotherms
confirmed that the activity of truncated proteins was lost due to their inability to bind
Rad50 (Figure 3.7). These observations highlighted that the C-terminal of T4Mre11 was
necessary for binding Rad50 and the nuclease activity. This requirement for the Mre11 C-
terminal segment for the MR complex formation was also observed in other MR protein
complexes (42, 50).
Figure 3.5: Nuclease assay for testing the activity of T4 Mre11(WT)
, Mre11(321)
, Mre11(297)
truncation constructs . dsDNA (30mer) incubated with Mre11 and activity was arrested at
different time points. The samples were loaded onto TBE gel and stained using gel green for
visualization. DNA substrate incubated with T4 Mre11(WT)
for 0min , 10min , 30min, 8h, 23h
(Lanes 1-5), T4 Mre11(321)
0min, 10min, 30min, 8h, 23h (Lanes 6-10) T4Mre11(297)
0min,
10min, 30min, 8h, 23h (Lanes 11-15).
A
B
C D
T4Mre11WT T4Mre11
321 T4Mre11297

47
A.
Figure 3.6: Circular Dichroism spectra of the Mre11 truncated proteins. Mre11WT
(♦),Mre11 321
(●) and Mre11
297(▲)
B.
Figure 3.7: Binding isotherms for Mre11 proteins and Rad50. (a) T4Mre11WT
(b)
4Mre11(297)
(c) T4Mre11(321)
. For all the constructs, 65 μM of Mre11 was titrated against
6 μM of Rad50. The truncation proteins failed to interact with Rad50. The Mre11 WT
was
found to show strong binding to Rad50with a KD=10nM±0.17.
a. T4Mre11WT c.T4Mre11321 d.T4Mre11297

48
3.3 Solution behavior of T4MR complex using HDXMS
Overview
Deuterium exchange experiments were carried out on four samples: T4Mre11, T4Rad50,
T4MR complex, AMP-PNP-bound T4MR complex. AMP-PNP was used to study the
ATP induced conformational changes occurring in the MR complex. For T4Mre11, 24
common peptide fragments covering more than 90% of the sequence was analyzed
(Appendix D). 33 common peptide fragments covering 91% of the Rad50 sequences
were analyzed (Appendix E). The exchange percentage was calculated by dividing the
average number of deuterons exchanged at each time point for each peptide with the
number of exchangeable amides for the given peptide (% deuteration = 100* D/N). The
percentage exchange for all the peptides was then tabulated to plot the heat map using the
HXMS online tool (74). The exchange rate for both the proteins are shown using a color
scheme in Figure 3.8. Violet and brown represent the lowest (10%) and the highest
exchange rates (>90%), respectively. Sequence alignment of T4Mre11/Rad50 with
Mre11/Rad50 from other species is shown in Appendix C.The deuterium exchange
profiles of the peptide fragments were mapped onto a model structure which was built
using MODELLER with MjMR (PDB id: 3AV0) as a template (75) (Figure 3.9).The
pattern of exchange of the T4MR complex in comparison to free proteins and the AMP-
PNP-bound T4MR complex as compared to the free complex are shown in Figure 3.9A
and 3.9B, respectively. This section discusses the deuterium exchange profile of the
peptide fragments, which show difference in free, complex, and AMP-PNP bound forms.

49
Figure 3.8 A : Heat Map of T4Mre11. The three bar represent the exchange profile for
the peptide in Free Mre11, MR complex and MR complex with AMP-PNP. Individual
bars contain 5 time points 0, 0.5, 1, 2, 5 and 10 mins.
Mre11
MR
MR-AMP-PNP
MR
30secs
to
10mins
Capping domain
C-terminal domain
Nuclease domain
% Deuteration

50
Figure 3.8 B: Heat Map of T4Rad50. The three bar represent the exchange profile for the
peptide in Free Rad50, MR complex and MR complex with AMP-PNP. Individual bars
contain 5 time points 0, 0.5, 1, 2, 5 and 10 mins.
Rad50
MR
MR- AMP-PNP
N-Terminal
domain
Coiled-coil
domain
C-Terminal
domain
Mre11 interaction site
Mre11 interaction site
% deuteration
%Deuteration

51
Figure 3.9: Amide exchange pattern for the MR complex. The structure of the T4MR
heterotetramer was generated based on MjMR complex bound to ATPγS (PDB ID:
3AV0) as template using MODELLER.(a) Overall amide exchange pattern of the Mre11
and Rad50 segments after complex formation in comparison to the apo proteins. BLUE:
represents peptide segments showing decrease in amide exchange RED: Increase in
amide exchange. (b) Amide exchange pattern of MR-AMP-PNP complex when
compared to the MR complex. (c) Binding of AMP-PNP at Rad50 dimer interface. The
nucleotide binding motifs of Rad50 (RED) and nuclease motifs Mre11 (BLUE) show
increase and decrease in amide exchange, respectively.
c
Rad50 dimer
interface
Mre11 nuclease
motifs
Mre11-Rad50-AMP-PNP
a b

52
3.3.1 Formation of the T4MR complex — A conformationally stable state
The amide exchange levels of the segments of T4Rad50 and T4Mre11 segments forming
the complex interface were found to be lower in comparison to free protein state,
especially, the NBD of T4Rad50 and ND of T4Mre11 (Figure 3.9A). The peptide
fragments encompassing the characteristic Rad50 motifs, including — Walker A (three
deuterons), Q loop (one deuteron), D loop (one deuton) and the H loop (one deuteron),
showed corresponding decreases in deuteron uptake (Figure 3.9A). The decrease of
deuterons in these T4Rad50 segments after MR complex formation suggested it is driven
to a less solvent accessible closed dimer state. In T4Mre11, peptide fragments spanning
the recognition loops harboring the active site residues for nuclease activity showed a
decrease in deuteron uptake after complex formation and a further decrease post AMP-
PNP binding (Figure 3.9C, Appendix D, highlighted in yellow). This decrease suggested
that the T4Rad50 NBDs infact lie close to T4Mre11 ND. These observations were found
to support the open state of MjMR model II wherein the Rad50 dimers occur close to
each other and adjacent to the Mre11 nuclease domains (Figure 3.10, C.II), and not in the
open Rad50 conformation or in the conformation where Mre11s sit away from the Rad50
NBDs as seen other MR models (Figure 3.10) (42, 65).
3.3.2 AMP-PNP captures the complex in an open transition state
Subsequently, we compared the T4Rad50 amide exchange pattern as a free protein
without AMP-PNP to Rad50 in complex and Rad50 in complex bound to AMP-PNP. It
was interesting to observe that AMP-PNP binding increased the deuteron uptake of
T4Rad50 when compared to free protein and complex state.

53
a. TmMR model
b. PfMR model
c. MjMR model
I
II
Figure 3.10: Proposed models of MR complex from different species. Pink: Mre11
domains. Blue: Rad50 domains. Mre11 nuclease domain ( ), capping domain ( ),
linker region ( ), RBD ( ), n-terminal domain ( ), c-terminal domain ( ), coiled-
coil segment ( , ). ATP/AMP-PNP/ATPγS ( ). (a) TmMR model (42) (b) PfMR
model (41) (c) Two models of MjMR model (43). The models highlight the orientation of
the different domains in the free complex (left panel) and AMP-PNP bound form (right
panel).
Mre11-Rad50 /DNA binding mode Mre11-Rad50-AMP-PNP

54
Again, the peptide fragments covering the key motifs at the Rad50 dimer interface –
signature motif (468–482), Walker A (27–46), Walker B (502–511), Q loop (133–148)
and D loop (512–525) showed an average increase of two deuterons in each segment
(Figure 3.9C). The increase, however, was not just restricted to the T4Rad50 dimer
interface but in segments away from the interface, showing that Rad50 becomes
conformationally more flexible (Figure 3.9B). Contrary to the T4Rad50 behavior,
T4Mre11 showed further decrease in deuteration rate post AMP-PNP binding as
compared to in the complex. Especially, peptide fragments covering the nuclease motifs,
motif II (51–63), III (79–97), IV (161–174), V, (178–191), VI(195–217) (Figure 3.9C,
Appendix D). Each of these segments showed at least one deuteron decrease in deuterium
uptake. These deuteration profiles suggested that AMP-PNP held the Rad50 monomers
away from each other in an open transient state but the Mre11 nuclease domains become
less flexible and more solvent inaccessible. These observations were in agreement with
AMP-PNP-bound models of MjMR and PfMR wherein the binding of AMP-PNP leads
to opening of the Rad50 dimer and rotation of the coiled-coil segment. However, the
orientation of Mre11 NDs in PfMR complex (Figure 3.10B) does not support the T4MR
amide exchange data. These deuteration patterns suggested that Mre11 in fact adopts a
more stable conformation for nuclease activity to proceed.
3.3.3 Conformational changes across lobe II of T4Rad50 and T4Mre11 capping
domain
Signature motif of T4Rad50 has been previously implicated in allosteric activation of the
complex (76).The amide exchange profile of lobe II loop (454–467) adjacent to signature
motif showed difference upon AMP-PNP binding. It was interesting to observe that the

55
T4Mre11 capping domain segments (260– 272 and 282– 298) which lies close the Rad50
loop also showed deuteration differences upon complex formation and ATP binding
(Figure 3.11A). T4Rad50 loop (454–464) showed a single deuteron decrease after the
MR complex formation and a deuteron increase after AMP-PNP binding. T4Mre11
capping domain segment 260–272 showed a decrease of two deuterons after complex
formation and an increase of two after AMP-PNP binding, giving a similar pattern to
what was observed with the T4Rad50 loop described earlier (Figure 3.11C). Fragment
282–298, on the other hand, showed an increase of more than two deuterons during the
complex formation and a decrease of three after AMP-PNP binding (Figure 3.11D).
Closer inspection of the amino acid sequence of in these segments (Mre11—260–272,
282–298 and Rad50—454–464) on either proteins showed that the residues were
oppositely charged suggesting a presence of ion-pair interaction similar to what has been
observed in the MjMR complex. We speculate the involvement of the side chain of R460
of T4Rad50 which lies adjacent to the signature motif, and the side chain of T268 and
D288 and the main chain of K286 and I287 in the T4Mre11 capping domain in the
Rad50-Mre11 interaction (Figure 3.11B). Mutation studies in this Mre11-Rad50
interaction interface in the MjMR complex have been shown to affect the nuclease
activity (65). These conformational changes in the capping domain segments of T4Mre11
post AMP-PNP binding suggest that T4Mre11 capping segment could also share an
interaction interface with T4Rad50 similar to how Mre11 and Rad50 are arranged in the
MjMR complex(65).

56
Figure 3.11: Allosteric relay at lobe II of T4Rad50 and capping domain of T4Mre11. (a)
Cross sectional view of the lobe II loop of T4Rad50 and T4Mre11 capping domain
interaction segment. The lobe II loop lies adjacent to the signature motif (green) bound to
the ATP-γS.(b) Closer view of residues speculated to be involved in electrostatic
interaction. R460 from T4Rad50 lies adjacent to the T268 and K286 from
T4Mre11.(c)Time course of amide HDX (0.5-10mins) for peptide fragments 262-272 of
Mre11 (m/z = 547.3, z = +2), (d) 282-298(m/z = 954.45, z = +3) and (e) Rad50 fragment
454-468 (m/z= 851.4). The solid lines on the graphs denote the best fit of the data to a
one-phase association non linear exponential curve fit (GraphPad Prism 5.0(San
Diego,CA).
Mre11 (262-274)
0 2 4 6 8 100
2
4
6
8Mre11
Mre11-Rad50
Mre11-Rad50-AMP-PNP
Time (Min)
Deu
tero
ns
Inco
rpo
rate
d
Mre11 (282-298)
0 2 4 6 8 100
5
10
15Mre11
Mre11-Rad50
Mre11-Rad50-AMP-PNP
Time (Min)
Deu
tero
ns
Inco
rp
orate
d
a b
c d
454-468
282-298
262-270 ATP-γS
Signature
motif
Mre11– 282-298 Mre11– 262-270
e Rad50− 454-468
262-270
Mre11
Rad50
T268
K286
I287
D288
R460
Mre11 /Rad50
Mre11-Rad50 complex
Mre11-Rad50-AMP-PNP

57
3.3.4 Conformational changes across the His loop of T4Rad50 and nuclease motif of
T4Mre11
MjMR complex structure had previously revealed an interaction between the nuclease
domain of Mre11 and the His switch of Rad50 (65). T4MR deuterium exchange study
identified a similar interaction. Binding of AMP-PNP was found to affect the deuteration
pattern of a peptide fragment spanning the His loop (532–548, Figure 3.12A and D) of
T4Rad50. This segment lies close to the Walker A (a T4Rad50 motif highlighted in
green, Figure 3.12A) which along with the signature motif from the adjacent T4Rad50
unit binds the second AMP-PNP molecule (magenta in Figure 3.12A) of the
heterotetramer. Two peptide fragments spanning these two nuclease motifs: 51–63 (II)
and 79–97 (III) showed differential deuteration patterns during the complex formation
and after AMP-PNP binding. Motif II showed a consistent protection while motif III
showed an increase (one deuteron) followed by a decrease in deuteron uptake levels
(three deuterons) (Figure 3.12C and E).The His loop peptide fragment: 532–548, showed
a decrease of close to two deuterons upon complex formation and one deuteron increase
after AMP-PNP binding (Figure 3.12D). The difference in the deuteration pattern
indicates that AMP-PNP binding to T4Rad50 could allosterically affect the nuclease
activity of Mre11 through the His loop interaction. The possible residues involved in
hydrogen bond interaction between the His loop and nuclease motifs are highlighted in
Figure 3.12B.
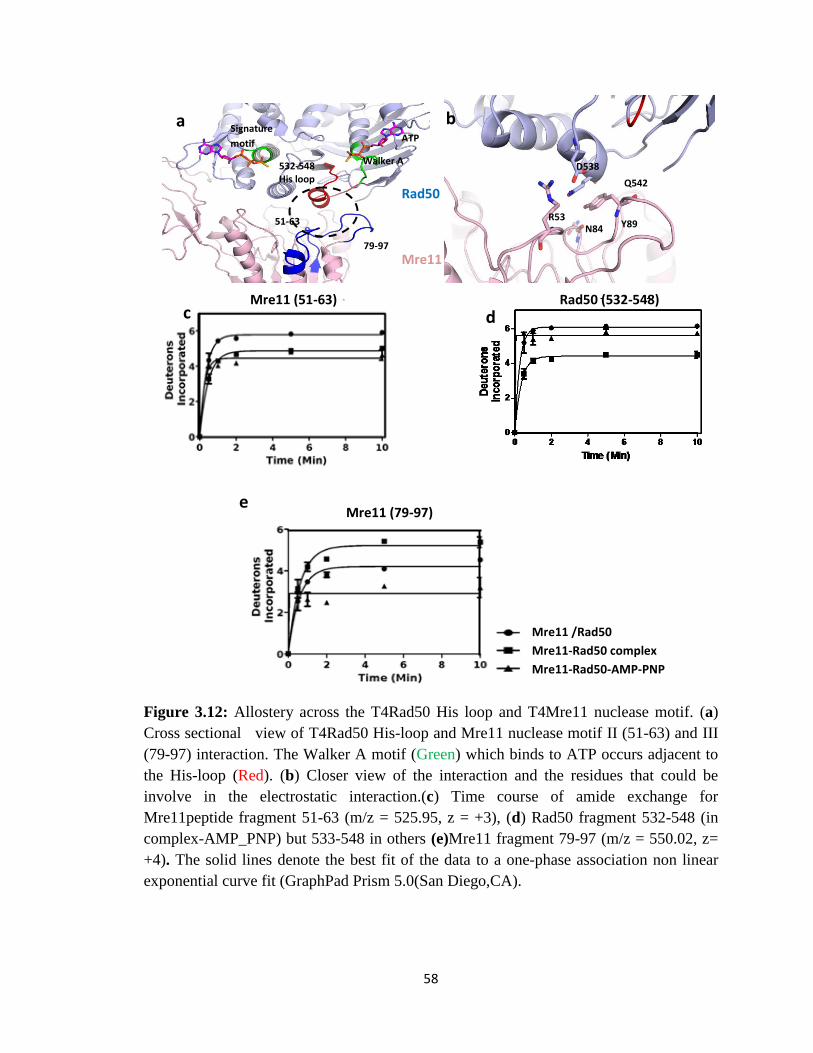
58
Figure 3.12: Allostery across the T4Rad50 His loop and T4Mre11 nuclease motif. (a)
Cross sectional view of T4Rad50 His-loop and Mre11 nuclease motif II (51-63) and III
(79-97) interaction. The Walker A motif (Green) which binds to ATP occurs adjacent to
the His-loop (Red). (b) Closer view of the interaction and the residues that could be
involve in the electrostatic interaction.(c) Time course of amide exchange for
Mre11peptide fragment 51-63 (m/z = 525.95, z = +3), (d) Rad50 fragment 532-548 (in
complex-AMP_PNP) but 533-548 in others (e)Mre11 fragment 79-97 (m/z = 550.02, z=
+4). The solid lines denote the best fit of the data to a one-phase association non linear
exponential curve fit (GraphPad Prism 5.0(San Diego,CA).
79-97
51-63
532-548 His loop
Walker A D538
Q542
R53 Y89 N84
ATP
a b
c d
e
Mre11
Rad50
Mre11 /Rad50
Mre11-Rad50 complex
Mre11-Rad50-AMP-PNP
Signature
motif
Mre11 (51-63) Rad50 (532-548)
Mre11 (79-97)

59
3.3.5 Flexibility of Rad50 coiled-coil segment undergoes changes upon AMP-PNP
binding
The N-terminal (189–198) and C-terminal (385–399 and, 400–409) base of coiled-coil
segment of T4Rad50 and the CTD of T4Mre11 (311–326) showed a 40–50% decrease in
deuteration after the complex formation (Figure 3.8A). This decrease corroborated our
binding studies and showed that the CTD of T4MRe11 forms an interface with the
T4Rad50 coiled-coil domain. It was even more interesting to observe a biomodal
hydrogen-deuterium exchange profiles in the Rad50 N-terminal coiled-coil segment
(168–188) that indicated that this region of Rad50 assumes multiple conformations. The
MR Complex formation was found to select one of the conformations (Figure 3.13A).
Furthermore, the coiled-coil segment is driven to yet another conformation upon AMP-
PNP binding, resulting in a slight increase of deuteration than in the complex but
decrease from the free T4Rad50 deuteration levels (Figure 3.13A and B). A similar
increase in deuteration levels was also observed in the C-terminal coiled-coil fragment
(385–399) post AMP-PNP binding) (Figure 3.13D). AFM studies on the human MR
complex previously showed that binding of AMP-PNP does not affect the flexibility of
the coiled-coil segment (77). Contrary to this, our deuterium exchange data on T4MR
reveals that the coiled-coil segment indeed undergoes small scale conformational changes
that suggest flexibility in the coiled-coil segment. The mutations in this interface in the
TmMR complex have been previously shown to affect the nuclease activity (42).
Although structural studies so far highlight the global translational shift in the position of
the coiled-coil segment, little is known about the internal conformational changes in the
coiled-coil segment. Amide exchange data revealed that there are internal changes

60
occurring within the coiled-coil base segment which when disrupted could affect the
nuclease activity of T4Mre11.
Mre11 CTD in MR Mre11 CTD in MR-
AMP-PNP
Rad50 coiled-coil
segment in MR
Rad50 coiled-coil
segment in MR-AMP-
PNP
a b
c Mre11-Rad50 Interface- Amide exchange pattern
Rad50 (168-188) Rad50 (168-188)

61
Figure 3.13: Conformational changes at the T4Mre11-Rad50 interface II. (a) Time series
(0-10mins) spectra of T4Rad50 peptide fragment 168-188 in apo T4Rad50 protein
showing bimodal distribution indicating presence of more than one conformation. (b)
Comparison of amide exchange at 10min time point (168-188) in free protein, after
complex formation and post AMP-PNP binding. The spectra shows absence of biomodal
distribution after complex formation and an increase in amide exchange rate post AMP-
PNP binding when compared to complex. (c) Mapping of the segments which show
changes in amide exchange profile post AMP-PNP binding in the C-terminal domain of
Mre11 and coiled-coil segment of Rad50 at the interaction interface. These segments
undergo conformational changes which are otherwise not visible in the crystal structure.
(d) Time series of amide exchange of T4Rad50 C-terminal coiled-coil segment 385-399
(m/z = 591.35, z = +3), e. 400-409 (m/z = 623.34, z = +2) (f) Mre11 C-terminal fragment
310-326 (m/z = 969.7, z= +2). The solid lines denote the best fit of the data to a one-
phase association non linear exponential curve fit (GraphPad Prism 5.0(San Diego,CA).
d e
f
Mre11 /Rad50
Mre11-Rad50 complex
Mre11-Rad50-AMP-PNP

62
3.3.6 Effect of AMP-PNP on the distal coiled-coil segments
The coiled-coil segment of Rad50 is known to communicate with the globular NBDs of
Rad50 and play an important role in maintaining the integrity of MR complex (46). In the
structural studies conducted so far, the coiled-coil segment of Rad50 except for the
minimal fragment required for Mre11 binding of Rad50 has been consistently eliminated
to avoid aggregation. However, the low working protein concentrations require for the
deuterium exchange experiments allowed us to retain the full length T4Rad50 to study
the effect of AMP-PNP in the distal regions of the coiled-coil segment. The deuterium
exchange profile of this segment (200–375) (Figure 3.8A) highlights that most of the
peptide fragments, except the fragment 200–216, do not show any change in deuteration
levels upon complex formation ( Appendix E ). Fragment 200–216 which lies adjacent to
the N-terminal base of coiled-coil of the interface II, was found to show close to 40%
decrease in the deuteration level. No change in the deuteron uptake level in the rest of the
segment suggested that there are no significant changes occurring in the distal coiled-coil
segment of Rad50 due to binding of Mre11. However, all of the segments covering the
coiled-coil segment (200–375) showed an increase in the deuteration level post AMP-
PNP binding, suggesting the occurrence of a conformational change along the entire
coiled-coil segment (Appendix E). These changes highlight that the distal coiled-coil
segments could play a role in the functioning of the complex which is supported by a
recent truncation study on the coiled-coil segment (78).

63
3.4 Hydrolysis of ATP is essential for substrate processing by T4Mre11 dsDNA
Furthermore, AFM was employed to examine the DNA-binding activity and structural
organization of the T4MR–DNA complex. The AFM images identified that the T4MR
complex does not bind the DNA substrate in the absence of ATP (Figure 3.14),
suggesting that the lack of T4Mre11 nuclease activity in the absence of ATP is due to the
inability of the MR complex to bind the substrate. Although the quaternary structure of
MR complex was not clearly discernible, we were able to identify that the MR complexes
bound multiple strands of DNA together into a bundle (Figure 3.14E and F). In line with
the biological activity of a MR complex to join together DNA ends for DSB repair, these
MR–DNA complexes were frequently observed at the ends of the DNA substrates
(Figure 3.14E). Interestingly, when ATPγS was used in place of ATP, the MR complex–
DNA bundle formation was not observed despite that the MR complexes were found to
be associated with DNA (Figure 3.14D). These results indicate that T4MR complex
requires ATP to bind to the DNA substrate, but hydrolysis of ATP is required to bring
DNA strands together. Unlike the MjMR complex where ATP-bound Rad50 is found to
downregulate the MjMre11 endonuclease activity, T4MR appears to behave similar to
other MR complexes such as PfMR, and TmMR) which require ATP for the
endonuclease activity.

64
Figure 3.14: Atomic Force Microscope analysis of T4Mre11 and Rad50 and DNA
binding interaction. (a) The linear PhiX174 DNA that was used in binding interactions.
(b and c) Reaction mixtures of linear PhiX174 DNA incubated with purified MR
complex at DNA/protein ratios of 1:100(b) and 1:1000(c), respectively. No obvious
binding activity was observed in both conditions. (d) Reaction mixtures of linear
PhiX174 DNA incubated with purified MR complex at DNA/protein ratio of 1:100 in the
presence of 1 mM ATPγS. Dots on backbone of DNA fragments may indicate MR
complex bound to DNA. (e and f) Reactions with linear PhiX174 DNA, incubated with
purified MR complex at DNA/protein ratios either of 1:30(e), or 1:100(f) in the presence
of 1 mM ATP. Flower structure composed of multiple inner loops within one DNA
molecule was observed at DNA/protein ratio of 1:30. Bundle formation was observed at
DNA/protein ratio of 1:100. Arrows indicate the protein bound to DNA. The scale bars
are 500 nm.
a b
c d
e f

65
CHAPTER 4
CONCLUSION
66
Mre11–Rad50 complex has been extensively studied over the last two decades. The
assembly and coordinated functioning of this robust cellular DNA repair motor has been
unraveled to a great extent. Studies have highlighted both the conserved nature of
domains within the complex and diversity in its organization (79). Although archeal MR
crystal structures have been reported and several biophysical studies on truncated
versions of the complex have been carried out (38, 42, 44, 50, 65, 80), the precise pathway
of communication between the two proteins remains a mystery. More recently, multiple
evidences of a long range allosteric regulation of Mre11 nuclease activity by Rad50 have
been put forth (50, 65, 76). Our study on the T4MR complex highlights the segments of
Mre11 and Rad50 that undergo dynamic rearrangements during the complex formation
and after AMP-PNP binds to the Rad50 dimer interface. Some of these dynamic
segments have been previously shown to play a role in allosteric communication (43, 50).
However, those previous studies were limited by the use of Rad50 mutants lacking the
coiled-coil region to avoid coiled-coil-mediated aggregation at the protein concentration
required for the structural studies. The use of HDXMS technique allowed us to perform
the experiments a low protein concentration, allowing the use an intact protein in our
biochemical assays.
When analyzed at a whole-protein level using amide exchange patterns, both proteins are
conformationally stabilized during the MR complex formation. Furthermore, upon AMP-
PNP binding, the conformational flexibility of Rad50 increased, while Mre11 was
stabilized further. When analyzed at peptide level, the exchange patterns revealed that
small scale conformational changes were occurring at the MR complex interfaces and
distal domains of Rad50 and Mre11. Because structural studies were inherently

67
insensitive to smaller dynamic behaviors of proteins, previous studies failed to detect
those conformational shifts we were able to observe in the MR complex.
AFM studies of T4MR show that ATP is essential for DNA substrate binding, suggesting
that the binding site is not accessible for the substrate in the absence of ATP (Figure
3.14). This speculation was further supported by the lower amide exchange rates
observed at the Rad50 dimer interface which suggest that it exists in a closed
conformation, thereby preventing the substrate to access the nuclease site. ATP
hydrolysis is known to drive the open–close conformation transition of Rad50 (81). It is
interesting to observe that the AFM studies also showed that the T4MR complex still
binds the substrate in the presence of ATPγS in (Figure 3.14d). This could be explained
by the ability of ATPγS to hold the Rad50 dimers in an open conformation in a similar
fashion as AMP-PNP, which would allow the substrate to be seated in the binding pocket.
The closed conformational state (in the absence of ATP) is physiologically relevant as it
would block random substrates from binding the active site. This could prevent
anomalous activity of the MR complex, hence serving as a checkpoint for the T4MR
activity. Based on these observations, we propose a model for the functioning of the
T4MR complex (Figure 4.1). The model highlights the domain orientation of the
constituent proteins within the complex forming a closed conformation (Figure 4.1A) and
the AMP-PNP-bound form assuming an open conformation (Figure 4.1B). Another
interesting observation is the bundling of T4MR complex observed in the presence of
ATP in the AFM studies. This bundling behavior is similar to what has been observed in
human and S. cerevisiae MR complexes which form large multimers (79). This is,

68
however, not seen in prokaryotic MR complexes, suggesting that T4MR may function in
a similar fashion as eukaryotic MR complexes through the formation of oligomers.
Figure 4.1: Model for T4MR complex (a) Complex in free form, is prevented from
binding to DNA substrate as the Rad50 dimers are closer. (b) Complex bound to AMP-
PNP which locks the complex in an open conformation similar to what has been observed
in PfMR complex. This transition allows the substrate recognition to occur. Pink: Mre11
domains, Blue: Rad50 domains. Mre11 nuclease domain ( ), capping domain ( ),
linker region ( ), RBD ( ), N-terminal domain ( ), C-terminal domain ( ), coiled-
coil segment ( , ).
Until now, only a little attention has been paid to the coiled-coil domain in investigating
the function of the MR complex. The length of this domain is variable, and the sequence
is far less conserved compared to the globular domain. However, a high structural
similarity of this domain is observed amongst various eukaryotic and prokaryotic species.
Different orientations of the coiled-coil segment with respect to the globular domain have
been observed during AFM studies (79). These arrangements amongst various species
have been used to explain the diverse cellular activities carried out by MR complex (79).
Until a decade ago, the coiled-coil segment of Rad50 was thought to be a stiff structural
element. Hence, researchers were unable to explain some of the unfavorable orientations
a. T4Mre11-Rad50
AMP-PNP
b. T4Mre11-Rad50-AMP-PNP
DNA binding mode

69
observed in AFM studies (79). However, a study by John et al. revealed that the coiled-
coil segment of Rad50 harbors segments of higher flexibility (lower coiled-coil
probability) which could, for example, explain the occurrence of the ring formation of
coiled-coil segment observed in hRad50 structures (arising out attachment at the Zn motif
and globular domain)(82).Truncation studies of coiled-coil segment is also found to alter
the complex nuclease activities suggesting that this domain is essential. Our amide
exchange data supported John et al.’s observations. We observed an alternating fashion
of deuterium exchange pattern along the coiled-coil segment (Appendix E). In addition to
that, the data also revealed that this flexibility is further affected by the AMP-PNP-
binding event. A consistent increase in deuteron uptake levels all along the segment
suggests that the flexibility of the coiled-coil segment increases upon AMP-PNP-binding
(Figure 3.9B, appendix E). This confirmed that AMP-PNP binding leads to
conformational changes at the distal end of the coiled-coil segment. This increase in the
coiled-coil conformational flexibility explains the formation of some of the otherwise
unfavorable MR arrangements seen in AFM structures. It also explains the ability of MR
complexes to recruit and orient template DNA for repair during homologous
recombination or to orient the N and C lobes of Rad50 to facilitate the entry of the
damaged substrates of various sizes into the active site.
Sufficient evidences has been put forth to establish allosteric regulation of Mre11
nuclease activity by Rad50. And these were obtained using crystal structures and
mutational studies in the fragments which showed visible conformational changes.
However, our study revealed that, apart from the large time-scale conformational
changes, there are other small time-scale changes which play a crucial role in MR

70
allostery. These include the changes highlighted in our study across the interfaces and
coiled-coil segment. Thus, Mre11 activity is found to be controlled through multiple sites
involving the terminals and distal regions of the coiled-coiled domain, the signature motif
and His-switch of Rad50 as well as the Mre11 capping domain, and there could be others
which are not arising due to their non-visible nature (83). These findings suggest that
Rad50 could regulate the Mre11 activity allosterically through multiple pathways as
observed in other systems (84). MR complex is an example of protein machinery where
combination of both protein dynamics and conformational redistribution plays an
important role in allosteric regulation(85, 86).
Recent drug discovery efforts have shifted from targeting the active site to trapping the
protein targets in an inactive conformation (87). These drugs are designed primarily by
targeting allosteric regulation sites within the proteins. Occurrence of more than one
allosteric site increases the number of viable drug targets, hence increasing the chance of
successfully deactivation of the target proteins. Our findings here lay a platform for
designing allosteric drugs against MR complex. These drugs could be used to selectively
sensitize cancer cells by disrupting MR complex and increase the potency of
chemotherapeutic agents or radiotherapy, an approach which has been repeatedly
studied(88, 89).Combination therapy constituting ligands targeting the various allosteric
sites of the MR complex could be used for treatement.
71
References
1. Evans MD, Dizdaroglu M, Cooke MS (2004) Oxidative DNA damage and disease: induction,
repair and significance. Mutation Research/Reviews in Mutation Research .567:1-61.
2. Jackson SP, Bartek J (2009) The DNA-damage response in human biology and disease.
Nature. .461:1071-78.
3. McKinnon PJ (2009) DNA repair deficiency and neurological disease. Nature Reviews
Neuroscience .10
4. Jackson A, Loeb L (2001) The contribution of endogenous sources of DNA damage to the
multiple mutations in cancer. Mutation Research/Fundamental and Molecular Mechanisms of
Mutagenesis .477:7-21.
5. Sancar A, Lindsey-Boltz L, Unsal-Kaçmaz K, Linn S (2004) Molecular mechanisms of
mammalian DNA repair and the DNA damage checkpoints. Annu Rev Biochem. .73:39-85.
6. Zhou B, Elledge S (2000) The DNA damage response: putting checkpoints in perspective.
Nature. .408:433-39.
7. Krutmann J, Grewe M (1995) Involvement of cytokines, DNA damage, and reactive oxygen
intermediates in ultraviolet radiation-induced modulation of intercellular adhesion molecule-1
expression. J Invest Dermatol. .105:67S-70S.
8. Friedberg EC (2003) feature DNA damage and repair. Nature. .421:436-40.
9. Branzei D, Foiani M (2008) Regulation of DNA repair throughout the cell cycle. Nature
Reviews Molecular Cell Biology .9

72
10. Shrivastav M, Haro LPD, Nickoloff JA (2008) Regulation of DNA double-strand break repair
pathway choice. Cell Res .18::134-47.
11. Almeida KH, Sobol RW (2007) A unified view of base excision repair lesion-dependent
protein complexes regulated by post-translational modification. DNA Repair (Amst). .6:695-711.
12. David SS, O'Shea VL, Kundu S (2007) Base-excision repair of oxidative DNA damage.
Nature. .447:941-50.
13. Fousteri M, Mullenders LH (2008) Transcription-coupled nucleotide excision repair in
mammalian cells: molecular mechanisms and biological effects. Cell Res .18::73-84.
14. Lainé J, Egly J (2006) When transcription and repair meet: a complex system. Trends Genet.
.22:430-36.
15. Shiloh Y (2003) ATM and related protein kinases: safeguarding genome integrity. Nature
Reviews Cancer .3
16. Peschiaroli A, Dorrello N, Guardavaccaro D et al. (2006) SCFbetaTrCP-mediated degradation
of Claspin regulates recovery from the DNA replication checkpoint response. Mol Cell. .23:319-
29.
17. Bartek J, Lukas J (2007) DNA damage checkpoints: from initiation to recovery or adaptation.
Curr Opin Cell Biol .19:238-45.
18. Mailand N, Bekker-Jensen S, Bartek J, Lukas J (2006) Destruction of Claspin by
SCFbetaTrCP restrains Chk1 activation and facilitates recovery from genotoxic stress. Mol Cell.
.23:307-18.
19. Mamely I, van V, Smits V et al. (2006) Polo-like kinase-1 controls proteasome-dependent
degradation of Claspin during checkpoint recovery. Curr Biol. .16:1950-55.

73
20. Caldecott KW (2008) Single-strand break repair and genetic disease. Nature Reviews
Genetics .9
21. McKinnon P, Caldecott K (2007) DNA strand break repair and human genetic disease. Annu
Rev Genomics Hum Genet. .8:37-55.
22. Schumacher B, Garinis G, Hoeijmakers J (2008) Age to survive: DNA damage and aging.
Trends Genet. .24:77-85.
23. McMurray C (2008) Hijacking of the mismatch repair system to cause CAG expansion and
cell death in neurodegenerative disease. DNA <b>Repair</b> (Amst). .7:1121-34.
24. Schlissel M, Kaffer C, Curry J (2006) Leukemia and lymphoma: a cost of doing business for
adaptive immunity. Genes Dev. .20:1539-44.
25. Jiricny J (2006) The multifaceted mismatch-repair system. Nat Rev Mol Cell Biol. .7:335-46.
26. Giannini G, Ristori E, Cerignoli F et al. (2002) Human MRE11 is inactivated in mismatch
repair-deficient cancers. EMBO Rep. .3:248-54.
27. Taylor A, Harnden D, Arlett C et al. (1975) Ataxia telangiectasia: a human mutation with
abnormal radiation sensitivity. Nature. .258:427-29.
28. Taylor A, Groom A, Byrd P (2004) Ataxia-telangiectasia-like disorder (ATLD)-its clinical
presentation and molecular basis. DNA Repair (Amst). .3:1219-25.
29. García-Pérez M, Allende L, Corell A et al. (2001) Role of Nijmegen breakage syndrome
protein in specific T-lymphocyte activation pathways. Clin Diagn Lab Immunol. .8:757-61.

74
30. Bolderson E, Richard DJ, Zhou BBS, Khanna KK (2009) Recent advances in cancer therapy
targeting proteins involved in DNA double-strand break repair. Clin Cancer Res .15:6314-20.
31. Stracker T, Petrini J (2011) The MRE11 complex: starting from the ends. Nat Rev Mol Cell
Biol. .12:90-103.
32. Fukuda T, Sumiyoshi T, Takahashi M et al. (2001) Alterations of the double-strand break
repair gene MRE11 in cancer. Cancer Res. .61:23-26.
33. Waltes R, Kalb R, Gatei M et al. (2009) Human RAD50 deficiency in a Nijmegen breakage
syndrome-like disorder. Am J Hum Genet. .84:605-16.
34. Luo G et al. (1999) in Proceedings of the National Academy of Sciences, , pp 7376-7381.
35. Trujillo KM, Sung P (2001) DNA structure-specific nuclease activities in the Saccharomyces
cerevisiae Rad50*Mre11 complex. J. Biol. Chem. .276:35458-64.
36. Usui T, Ohta T, Oshiumi H et al. (1998) Complex formation and functional versatility of
Mre11 of budding yeast in recombination. Cell. .95:705-16.
37. Paull TT, Gellert M (1998) The 3' to 5' exonuclease activity of Mre 11 facilitates repair of
DNA double-strand breaks. Mol. Cell. .1:969-79.
38. Hopfner KP, Karcher A, Craig L et al. (2001) Structural biochemistry and interaction
architecture of the DNA double-strand break repair Mre11 nuclease and Rad50-ATPase. Cell.
.105:473-85.
39. D'Amours D, Jackson SP (2002) The Mre11 complex: at the crossroads of dna repair and
checkpoint signalling. Nat. Rev. Mol. Cell. Biol. .3:317-27.

75
40. Assenmacher N, Hopfner KP (2004) MRE11/RAD50/NBS1: complex activities.
Chromosoma .113:157-66.
41. Williams GJ, Williams RS, Williams JS et al. (2011) ABC ATPase signature helices in
Rad50 link nucleotide state to Mre11 interface for DNA repair. Nature structural & molecular
biology .18:423-31.
42. Lammens K, Bemeleit DJ, Möckel C et al. (2011) The Mre11:Rad50 structure shows an
ATP-dependent molecular clamp in DNA double-strand break repair. Cell. .145:54-66.
43. Lim HS, Kim JS, Park YB et al. (2011) Crystal structure of the Mre11-Rad50 -
ATPgammaS complex: understanding the interplay between Mre11 and Rad50. Genes &
development .25:1091-104.
44. Williams RS, Moncalian G, Williams JS et al. (2008) Mre11 dimers coordinate DNA end
bridging and nuclease processing in double-strand-break repair. (1). Cell. .135:97-109.
45. Hollenstein K, Dawson RJ, Locher KP (2007) Structure and mechanism of ABC transporter
proteins. Curr Opin Struct Biol .17:412-18.
46. Hopfner KP, Craig L, Moncalian G et al. (2002) The Rad50 zinc-hook is a structure joining
Mre11 complexes in DNA recombination and repair. Nature. .418:562-66.
47. Moreno-Herrero F, Jager MD, Dekker NH et al. (2005) Mesoscale conformational changes in
the DNA-repair complex Rad50/Mre11/Nbs1 upon binding DNA. Nature. .437:440-43.
48. Moncalian G, Lengsfeld B, Bhaskara V et al. (2004) The Rad50 Signature Motif: Essential to
ATP Binding and Biological Function. J Mol Biol .335:937-51.
49. Williams GJ, Williams RS, Williams JS et al. (2011) ABC ATPase signature helices in Rad50
link nucleotide state to Mre11 interface for DNA repair. Nat Struct Mol Biol .18:423-31.

76
50. Williams GJ, Williams RS, Williams JS et al. (2011) ABC ATPase signature helices in Rad50
link nucleotide state to Mre11 interface for DNA repair. Nat Struct Mol Biol .18:423-31.
51. Herdendorf T, Albrecht D, Benkovic S, Nelson S (2011) Biochemical characterization of
bacteriophage T4 Mre11-Rad50 complex. J Biol Chem. .286:2382-92.
52. Wales T, Engen J (2006) Hydrogen exchange mass spectrometry for the analysis of protein
dynamics. Mass Spectrom Rev. .25:158-70.
53. Miller ES, Kutter E, Mosig G et al. (2003) Bacteriophage T4 Genome. Microbiol Mol Biol
Rev. .67:86-156.
54. Streisinger G (1966) Terminal redundancy, or all's well that ends well. Phage and the origins
of molecular biology :335-40.
55. Bernstein H, Bernstein C (1989) Bacteriophage T4 genetic homologies with bacteria and
eucaryotes. J. Bacteriol. .171:2265-70.
56. Trujillo K, Yuan S, Lee E, Sung P (1998) Nuclease activities in a complex of human
recombination and DNA repair factors Rad50, Mre11, and p95. J Biol Chem. .273:21447-50.
57. Trujillo K, Sung P (2001) DNA structure-specific nuclease activities in the Saccharomyces
cerevisiae Rad50*Mre11 complex. J Biol Chem. .276:35458-64.
58. Busenlehner LS, Armstrong RN (2005) Insights into enzyme structure and dynamics
elucidated by amide H/D exchange mass spectrometry. Arch Biochem Biophys .433:34-46.
59. Hoofnagle A, Resing K, Ahn N (2003) Protein analysis by hydrogen exchange mass
spectrometry. Annu Rev Biophys Biomol Struct. .32:1-25.

77
60. Zheng X, Wintrode P, Chance M (2008) Complementary structural mass spectrometry
techniques reveal local dynamics in functionally important regions of a metastable serpin.
Structure .16:38-51.
61. Jaroszewski L, Rychlewski L, Li Z et al. (2005) FFAS03 a server for profile--profile
sequence alignments. Nucleic Acids Res. .33:W284-88.
62. Adamczak R, Porollo A, Meller J (2004) Accurate prediction of solvent accessibility
using neural networks - based regression. Proteins. .56:753-67.
63. Wiseman T, Williston S, Brandts JF, Lin LN (1989) Rapid measurement of binding
constants and heats of binding using a new titration calorimeter. Anal. Biochem.
.179:131-37.
64. Cooper A, Johnson CM (1994) Isothermal titration microcalorimetry. Method. Mol. Cell.
Biol. .22:137-50.
65. Lim HS, Kim JS, Park YB et al. (2011) Crystal structure of the Mre11-Rad50-ATP{gamma}S
complex: understanding the interplay between Mre11 and Rad50. Genes Dev. .25:1091-104.
66. Adamczak R, Porollo A, Meller J (2005) Combining prediction of secondary structure
and solvent accessibility in proteins. Proteins. .59:467-75.
67. Bateman R, Carruthers R, Hoyes J et al. (2002) A novel precursor ion discovery method on a
hybrid quadrupole orthogonal acceleration time-of-flight (Q-TOF) mass spectrometer for
studying protein phosphorylation. J Am Soc <span class="highlight" style="background-
color:">Mass</span> Spectrom. .13:792-803.
68. Li G, Vissers J, Silva J et al. (2009) Database searching and accounting of multiplexed
precursor and product ion spectra from the data independent analysis of simple and complex
peptide mixtures. Proteomics. .9:1696-719.

78
69. Weis DD, Engen JR, Kass IUJ (2006) Semi-automated data processing of hydrogen
exchange mass spectra using HX-Express. J. Am. Soc. of Mass spectrom. .17:1700-03.
70. Geromanos S, Vissers J, Silva J et al. (2009) The detection, correlation, and comparison of
peptide precursor and product ions from data independent LC-MS with data dependant LC-
MS/MS. Proteomics. .9:1683-95.
71. Anand G, Krishnamurthy S, Bishnoi T et al. (2010) Cyclic AMP- and (Rp)-cAMPS-induced
conformational changes in a complex of the catalytic and regulatory (RI{alpha}) subunits of
cyclic AMP-dependent protein kinase. Mol Cell Proteomics. .9:2225-37.
72. Badireddy S, Yunfeng G, Ritchie M et al. (2011) Cyclic AMP analog blocks kinase activation
by stabilizing inactive conformation: conformational selection highlights a new concept in
allosteric inhibitor design. Mol Cell Proteomics. .10
73. Mandell JG, Baerga-Ortiz A, Akashi S et al. (2001) Solvent accessibility of the thrombin-
thrombomodulin interface1. J Mol Biol .306:575-89.
74. Kavan D, Man P (2011) MSTools—Web based application for visualization and presentation
of HXMS data. International Journal of Mass Spectrometry .302:53-58.
75. Eswar N, Webb B, Marti-Renom M et al. (2007) Comparative protein structure modeling
using MODELLER. Curr Protoc <span class="highlight" style="background-
color:">Protein</span> Sci. .2
76. Herdendorf TJ, Nelson SW (2011) Functional evaluation of bacteriophage T4 Rad50
signature motif residues. Biochemistry .50:6030-40.
77. Moreno-Herrero F, de Jager M, Dekker NH et al. (2005) Mesoscale conformational changes
in the DNA-repair complex Rad50/Mre11/Nbs1 upon binding DNA. Nature. .437:440-43.

79
78. Hohl M, Kwon Y, Galván SM et al. (2011) The Rad50 coiled-coil domain is indispensable for
Mre11 complex functions. Nat Struct Mol Biol .18:1124-31.
79. de J, Trujillo K, Sung P et al. (2004) Differential arrangements of conserved building blocks
among homologs of the Rad50/Mre11 DNA repair protein complex. J Mol Biol. .339:937-49.
80. Hopfner K, Karcher A, Shin D et al. (2000) Structural biology of Rad50 ATPase: ATP-driven
conformational control in DNA double-strand break repair and the ABC-ATPase superfamily.
Cell. .101:789-800.
81. Majka J, Alford B, Ausio J et al. (2012) ATP hydrolysis by RAD50 protein switches MRE11
enzyme from endonuclease to exonuclease. J. Biol. Chem. .287:2328-41.
82. van N, van D, de J et al. (2003) The coiled-coil of the human Rad50 DNA repair protein
contains specific segments of increased flexibility. Proc Natl Acad Sci U S A. .100:7581-86.
83. Tsai CJ, del Sol A, Nussinov R (2009) Protein allostery, signal transmission and dynamics: a
classification scheme of allosteric mechanisms. Mol Biosyst .5:207-16.
84. del Sol A, Tsai CJ, Ma B, Nussinov R (2009) The origin of allosteric functional modulation:
multiple pre-existing pathways. Structure .17:1042-50.
85. Goodey NM, Benkovic SJ (2008) Allosteric regulation and catalysis emerge via a common
route. Nat Chem Biol .4:474-82.
86. Popovych N, Sun S, Ebright RH, Kalodimos CG (2006) Dynamically driven protein allostery.
Nature Structural & Molecular Biology .13:831-38.
87. Lee GM, Craik CS (2009) Trapping moving targets with small molecules. Science. .324:213-
15.
80
88. Abuzeid W, Jiang X, Shi G et al. (2009) Molecular disruption of RAD50 sensitizes human
tumor cells to cisplatin-based chemotherapy. J Clin Invest. .119:1974-85.
89. Vilar E, Bartnik C, Stenzel S et al. (2011) MRE11 deficiency increases sensitivity to
poly(ADP-ribose) polymerase inhibition in microsatellite unstable colorectal cancers. Cancer
Res. .71:2632-42.
APPENDIX A:
T4Rad50 sequence:
MKNFKLNRVKYKNIMSVGQNGIDIQLDKVQKTLITGRNGGGKSTMLEAITFGLFGKPFRDVKKGQLINSTNKKELLVELWMEYDEKKYYIKRGQKPNVFEITVNGTRLNESASSKDFQAEFEQLIGMSYASFKQIVVLGTAGYIPFMGLSTPARRKLVEDLLEVGTLAEMDKLNKALIRELNSQNQVLDVKKDSIIQQIKIYNDNVERQKKLTGDNLTRLQNMYDDLAKEARTLKSEIEEANERLVNIVLDEDPTDAFNKIGQEAFLIKSKIDSYNKVINMYHEGGLCPTCLSQLSSGDKVVSKIKDKVSECTHSFEQLSTHRDNLKVLVDEYRDNIKTQQSLANDIRNKKQSLIAAVDKAKKVKAAIEKASSEFIDHADEIALLQEELDKIVKTKTNLVMEKYHRGILTDMLKDSGIKGAIIKKYIPLFNKQINHYLKIMEADYVFTLDEEFNETIKSRGREDFSYASFSEGEKARIDIALLFTWRDIASIVSGVSISTLILDEVFDGSFDAEGIKGVANIINSMKNTNVFIISHKDHDPQEYGQHLQMKKVGRFTVMV
T4Mre11 sequence:
MKILNLGDWHLGVKADDEWIRGIQIDGIKQAIEYSKKNGITTWIQYGDIFDVRKA
ITHKTMEFAREIVQTLDDAGITLHTIVGNHDLHYKNVMHPNASTELLAKYPNVK
VYDKPTTVDFDGCLIDLIPWMCEENTGEILEHIKTSSASFCVGHWELNGFYFYKG
MKSHGLEPDFLKTYKEVWSGHFHTISEAANVRYIGTPWTLTAGDENDPRGFWM
FDTETERTEFIPNNTTWHRRIHYPFKGKIDYKDFTNLSVRVIVTEVDKNLTKFESE
LEKVVHSLRVVSKIDNSVESDDSEEVEVQSLQTLMEEYINAIPDITDSDREALIQY
ANQLYVEATQ

81
APPENDIX B:
Analytical Ultracentrifugation data for Mre11 and complex
T4Mre11- 39kDa
T4Mre11- Rad50: 189kDa
T4Mre11- Rad50 – AMP-PNP: 220kDa

APPENDIX C:
Figure 1: Mre11 alignment
Motif I II
T4Mre11 ............MKILNLGDWHLGVKADDEWIRGIQI.DGIKQAIEYSKKNGITTWIQYGDIFDVRKAIT
pfMre11 ............MKFAHLADIHLGYEQFHKPQREEEFAEAFKNALEIAVQENVDFILIAGDLFHSSRPSP
hMre11 MSTADALDDENTFKILVATDIHLGFME.KDAVRGNDTFVTLDEILRLAQENEVDFILLGGDLFHENKPSR
scMRE11 MDYPDP....DTIRILITTDNHVGYNE.NDPITGDDSWKTFHEVMMLAKNNNVDMVVQSGDLFHVNKPSK
MjMre11 MMFVHIADNHLGYRQYNLDDREKDIYDSFKLCIKKILEIKPDVVLHSGDLFNDLRPP-
Motif III
T4Mre11 HKTMEFAREIVQ................................TLDDAGITLHTIVGNHDLHYKNVMHP
pfMre11 GTLKKAIALLQI.................................PKEHSIPVFAIEGNHDRTQRGP..S
hMre11 KTLHTCLELLRKYCMGDRPVQFEILSDQSVNFGFSKFPWVNYQDGNLNISIPVFSIHGNHDDPTGADALC
scMRE11 KSLYQVLKTLRLCCMGDKPCELELLSDPSQVFHYDEFTNVNYEDPNFNISIPVFGISGNHDDASGDSLLC
MjMre11 VKALRIAMQAFK................................KLHENNIKVYIVAGNHEMPRR..LGE
Motif
T4Mre11 NASTELLAKY..PNVKVY................DKPTTVDFDGCLIDLIPWMCEENTGEILEHIKTSSA
pfMre11 VLNLLEDFGLVYVIGMRKEKVENEYLTSERLGNGEYLVKGVYKDLEIHGMKYM....SSAWFEANKEI..
hMre11 ALDILSCAGFVNHFGRSMSVEKIDISPVLLQKGSTKIALYGLGSIPDERLY....RMFVNKKVTML....
scMRE11 PMDILHATGLINHFGKVIESDKIKVVPLLFQKGSTKLALYGLAAVRDERLF....RTFKDGGVTFE....
MjMre11 ESPLALLKDY..VKILDG................KDVINVNGEEIFICGTYYHKKSKREEMLDKLKNFES
Motif IV V
T4Mre11 .SFCVGHWELNGFYFYKGMKSHG...................LEPDFLKTYKEVWSGHFH..........
pfMre11 LKRLFRPTDNAILMLHQGVREVSEARGEDYFEIGLGD.....LPEGYL....YYALGHIH..........
hMre11 RPKEDENSWFNLFVIHQ......NRSKHGSTNFIPEQ.....FLDDFID..LVIW.GHEHECKIA.....
scMRE11 VPTMREGEWFNLMCVHQ......NHTGHTNTAFLPEQ.....FLPDFLD..MVIW.GHEHECIPN.....
MjMre11 ...EAKNYKKKILMLHQGINPYIPLDYE..............LEHFDLPKFSYYALGHIH..........
Motif VI
T4Mre11 ..T.ISEAAN...VRYIGTPWTLTAGDENDPR...............GFWMFDT...ETERTEFIPNNTT
pfMre11 ..KRYETSYSGSPVVYPGSLERWDFGDYEVRYEWDGIKFKERYGVNKGFYIVEDF.......KPRFVEIK
hMre11 PTKNEQ...QLFYISQPGSSVVTSLSPGEA..............VKKHVGLLRIKGRKMNMHKIPLHTV.
scMRE11 LVHNPI...KNFDVLQPGSSVATSLCEAEA..............QPKYVFILDIKGEAPKMTPIPLETI.
MjMre11 ..KRILERFNDGILAYSGSTEIIYRNEYEDYK...........KEGKGFYLVDFSGNDLDISDIEKIDIE
T4Mre11 WHRRIHYPFK...................GKIDYKDFTNLSVR...........VIVTEVD....KNLT
pfMre11 VRPFIDVKIK..............GSEEEIRKAIKRLIPLI.........PKNAYVRLNIGWRKPFDLT
hMre11 .RQFFMEDIVLANHPDIFNPDNPKVTQAIQSFCLEKIEEMLENAER....PEKPLVRLRVD....YSGG
scMre11 .RTFKMKSISLQDVPHL....RPHDKDATSKYLIEQVEEMIRDANE....LPKPLIRLRVD....YSAP
MjMre11 CREFVEVNIK...................DKKSFNEAVNKIERC......KNKPVVFGKIK....REFK

T4Mre11 ...........KFESELEKVVHSLRVVSKIDN...SVESDDSEEVEVQSLQTLMEEYIN........AI
pfMre11 ...........EIKELLN..VEYLKIDTWR.....IKERTDEESGKIGLPSDFFTEFELKI.....IDI
hMre11 ........FEPFSVLRFSQKFVDRVANPKDII---GKLITKPSEGTTLRVEDLVKQYFQTAEKNVQLSL
scMre11 SNTQSPIDYQVENPRRFSNRFVGRVANGNNVV---DVEKLFSESGGELEVQTLVNDLLNKM....QLSL
MjMre11 ...........PWFDTLKDKILINKAIIVDDE...FIDMPDNVDIESLNIKELLVDYANRQ......GI
T4MRE11 P.DITDSDREALIQYAN.........QLYVEATQ 339
PfMre11 LGEKDFDD.FDYIIKLITEGKVEEGPLEEAVKKVSEEKGKT 402
hMre11 LTERGMGEAVQEFVDKEEKD.....AIEELVKYQLEKTQRF 484
ScMre11 LPEVGLNEAVKKFVDKDEKT.....ALKEFISHEISNEVGI 497
MjMre11 DGDLVLSLYKALLNNEN.........WKELLDEYYNTKFRG 366
Figure 2: Rad50 alignment
Motif Walker A (P-loop)
T4Rad50 .MKNFKLNRVKYKNIMSVGQNGIDIQLDKVQ.KTLITGRNGGGKSTMLEAITFGLFGKPFRDVKKGQLIN
pfRad50 ....MKLERVTVKNFRSHSDTVVEFKEG....INLIIGQNGSGKSSLLDAILVGLY...WPLRIKDIKKD
hsRad50 MSRIEKMSILGVRSFGIEDKDKQIITFFSP..LTILVGPNGAGKTTIIECLKYICTGDFPPGTKGNTFVH
scRad50 MSAIYKLSIQGIRSF..DSNDRETIEFGKP..LTLIVGMNGSGKTTIIECLKYATTGDLPP.SKGGVFIH
MjRad50 ..MSMILKEIRMNNFKSHVNSRIKFEKG....IVAIIGENGSGKSSIFEAVFFALFGAGSN..FNYDTII
Motif
T4gp46 S...TNKKELLVELWMEYDE.........KKYYIKRGQKPNVF........EITVNGTRLNESASSKDFQ
pfRad50 EFTKVGARDTYIDLIFEKDG..........TKYRITRRFLKGYSSGEIHAMKRLVGNEWKHVTEPSSKAI
hsRad50 DPKVAQETDVRAQIRLQFRDVNGELIAVQRSMVCTQKSKKTEFKTLEG.VITRTKHGEKVSLSSKCAEID
scRad50 DPKITGEKDIRAQVKLAFTSANGLNMIVTRNIQLLMKKTTTTFKTLEGQLVAINNSGDRSTLSTRSLELD
MjRad50 T...KGKKSVYVELDFEVNG.........NNYKIIREYDSGRG........GAKLYKNGKPYATTISAVN
Motif Q-loop
T4gp46 AEFEQLIGMSYASF......KQIVVLGTAGYTPFMGLSTPARRKLVEDLLEVGTLAEMDKLNKALIRELN
pfRAD50 SAFMEKL.IPYNIFLNAIYIRQGQIDAILE..........SDEAREKVVREVLNLDKFETAYKKLSELKK
hsRad50 REMISSLGVSKAVLNNVIFCHQEDSNWPLS..........EGKALKQKFDEIFSATRYIKALETLRQVRQ
scRad50 AQVPLYLGVPKAILEYVIFCHQEDSLWPLS..........EPSNLKKKFDEIFQAMKFTKALDNLKSIKK
MjRad50 KAVNEILGVDRNMFLNSIYIKQGEIAKFLSL.........KPSEKLETVAKLLGIDEFEKCYQKMGEIVK
Coiled-coil segment
T4Rad50 SQNQVLDVKKDSIIQQIKIYNDNVERQKKLTGDNLTRLQNMYDDLAKEARTLKSEIEEANERLVNIVLDE
pfRad50 TINNRIKEYRDILARTENIEELIKENEQELIKAERELSKAEKNSNVETLKMEVISLQNEKADLDRTLRKL
hsRad50 TQGQKVKEYQMELKYLKQYKEKACEIRDQITSKEAQLTSSKEIVKSYENELDPLKNRLKEIEHNLSKIMK
scRad50 DMSVDIKLLKQSVEHLKLDKDRSKAMKLNIHGYMKDIENYIQDGKDDYKKQKETELNKVIAQLSECEKHK
MjRad50 EYEKRLERIEGELNYKENYEKELKNKMSQLEEKNKKLMEINDKLNKIKKEFEDIEKLFNEWENKKLLYEK

COILED-COIL SEGMENT
T4gp46 LQEELDKIVKTKTNLVMEKYHRGILTDMLKDSGIKGAIIKKYIPLFNKQINHYLKIM.............
pfRAD50 EKENRERVKKEIKDLEKAKDFTEELIEKVKKYKALAREAALSKIGELASEIFAEFTEGKY..........
hsRad50 YREMMIVMRTTELVNKDLDIYYKTLDQAIMKFHSMKMEEINKIIRDLWRSTYRGQDIEYIEIRSDADEN.
scRad50 YHKEWVELQTRSFVTDDIDVYSKALDSAIMKYHGLKMQDINRIIDELWKRTYSGTDIDTIKIRSDE....
MjRad50 RLKEMSNLEKEKEKLTKFVEYLDKVRRIFGRNGFQAYLREKYVPLIQKYLNEAFSEFDLPY.........
Motif Signature motif Walker B
T4gp46 EADYVFTLDEEFNETIKSRGREDFSYASFSEGEKARIDIALLFTWRDIASIVSGVSISTLILDEVF....
pfRAD50 SEVVVRAEENKVRLFVVWEGKE.RPLTFLSGGERIALGLAFRLAMSLYLA....GEISLLILDEP.....
hsRad50 VSASDKRRNYNYRVVMLKGDTALDMRGRCSAGQKVLASLIIRLALAETFC....LNCGIIALDEP.....
scRad50 VSSTVKGKSYNYRVVMYKQDVELDMRGRCSAGQKVLASIIIRLALSETFG....ANCGVIALDEP.....
MjRad50 ....SFVELTKDFEVRVHAPNGVLTIDNLSGGEQIAVALSLRL...AIANALIGNRVECIILDEPT....
Motif D-loop H-loop
T4gp46 DGSFDAEGIKGVA.....NIINSMKNTN..VFIISHKDHDPQE
pfRAD50 TPYLDEERRRKLI.....TIMERYLKKIPQVILVSHDEELKDA
hsRad50 TTNLDRENIESLAHALVEIIKSRSQQRNFQLLVITHDEDFVEL
scRad50 TTNLDEENIESLAKSLHNIINMRRHQKNFQLIVITHDEKFLGH
MjRad50 VYLLDENRRAKLA.....EIFRKVKSIP.QMIIITHHRELED

APPENDIX D: Mre11 peptides
Peptide fragment
Sequence
no
m/z
Z
Exchang-
able Amides
MKILNLGDW 1-9 545.29 2 8 0.9±0.01 1.2±0.06 0.85±0.15
MKILNLGDWHL 1-11 670.36 2 10 1.5±0.02 1.4±0.07 1.1±0.1
MKILNLGDWHLGVKADDE 1-18 685.36 3 17 4.0±0.02 4.0±0.03 3.1±0.3
WIRGIQIDGIKQ 19-30 713.91 2 11 1.1±0.01 0.8±0.1 0.75±0.25
WIRGIQIDGIKQAIE 19-33 580.67 3 14 2.7±0.06 0.7±0.2 0.5±0.3
IQYGDIF 45-50 855.42 1 5 1.2±0.01 1.30±0.01 0.7±0.3
DVRKAITHKTME 51-62 476.92 3 11 5.7±0.06 5.1±0.19 5.5±0.3
DVRKAITHKTMEF (I) 51-63 525.95 3 12 5.9±0 5±0.06 4.6±0.3
HTIVGNHDLHYKNVMHPNA(II) 79-97 550.03 4 17 4.5±0.01 5.3±0.3 3.7±0.1
LAKYPNVKVYDKPTTVDF 102-119 700.05 3 15 4.6±0.01 4.1±0.02 5.22±0.1
CEENTGEILE 131-140 1136.48 1 9 3.5±0.15 4.06±0 3.1±0.2
ENTGEILE 133-140 904.42 1 7 2.6±0.02 3.1±0.05 2.3±0.1
FCVGHWELNGF 149-159 654.80 2 10 3.7±0.03 4.5±0.06 4.3±0.1
CVGHWELNGF 150-159 581.26 2 9 3.8±0.02 4.5±0.02 4.2±0.1
CVGHWELNGFY 150-160 662.79 2 10 4.6±0.1 5±0.02 4.7±0.2
FYKGMKSHGLEPDF (III) 161-174 828.40 2 12 4.2±0.03 5±0.2 4.2±0.1
YKEVWSGHFHTISE (IV) 178-191 860.414 2 13 2.5±0.1 3.8±0.1 1.3±0.1
VRYIGTPWTLTAGDENDPRGF(V) 195-215 789.06 3 18 6.9±0.05 8.2±0.01 6.2±0.1
IHYPFKGKIDYKDFTNL 238-254 700.38 3 15 3.8±0.1 3.7±0.1
PNNTTWHRRIHYPFKGKIDYKDFTNL 229-254 816.181 4 23
8.5±0.1
EVDKNLTKF 262-270 547.30 2 8 5.5±0.1 3.6±0.11 5.5±0.1
RVVSKIDNSVESDDSEE 282-292 954.447 2 16 10.2±0.1 12.61±0.1 10.4±0.2
EYINAIPDITDSDREAL 310-326 967.97 2 15 11.2±0.03 1.5±0.1 2.5±0.2
IQYANQL 327-333 849.44 1 6 5.7±0.02 0.29±0.1
Mre11-Rad50-
AMP-PNP
Mean±S.E
Mre11
Mean±S.E
Mre11-
Rad50
Mean±S.E

aAverage and standard deviations were calculated using measurements from three independent experiments.
Peptides highlighted are those harboring the nuclease motifs of Mre11.
APPENDIX E: Rad50 peptides
Peptide fragment
Sequence no
m/z
Z
Exchange
able
amides
R
R
M
r
e
SVGQNGID 16-23 789.37 1 7 4.0±0 3.5±0.2 3.6±0.3
DKVQKTLITGRNGGGKSTML 27-46 526.79 4 19 12.4±0.2 9.4±0.5 8.11±0.1
EAITFGL 47-53 750.40 1 6 0.3±0 0.3±0 0.34±0.03
ITFGLFGKPFRDVKKGQLINSTNKKELL 50-76 639.18 2 25 10.9±0.2 9.8±0.4 12.52±0
INSTNKKEL 67-75 523.79 3 8 2.4±0.1 1.8±0.1 4.0±0.3
WMEYDEKKYYIKRGQKPNVFE 80-100 551.08 5 20 3.4±0.1 3.1±0.1 4.7± 0.2
NESASSKDFQAEF 109-121 730.32 2 12 7.1±0.1 6.6±0.2 7.9±0.1
KQIVVLGTAGYTPFMG 133-148 841.45 2 15 8.5±0.2 7.6±0.3 9.7±0.1
LSTPARRKLVEDLL 149-161 886.51 2 11 2.5±0.1 1.5±0 2.9±0.1
DVKKDSIIQQ 189-198 587.33 2 9 5.7±0.1 0.6±0.1 1.1±0
KIYNDNVERQKKLTGDNL 200-217 537.79 4 17 11.1±0.3 4.8±0.1 8.69±0.1
LTRLQNM 217-223 438.24 2 6 1.8±0 1.9±0.1 2.7±0.1
YDDLAKEARTLKSEIEEANERLVN 224-247 702.37 4 23 1.3±0 1.3±0.1 2.7±0.1
DEDPTDAFNKIGQEAFL 251-267 955.45 2 15 3.2±0.1 2.7±0 6.3±0.3
FLIKSKIDSYNKVINM 266-281 638.36 3 15 1.0±0 1.0±0.1 3.07±0
YHEGGLCPTCL 282-292 596.76 2 9 1.4±0 1.4±0.1 1.7±0
SSGDKVVSKIKDKVSE 296-311 569.32 3 15 7.1±0 6.6±0.2 7.6±0
LSTHRDN 319-325 421.71 2 6 1.4±0 1.1±0.1 1.2±0.1
YRDNIKTQQSLAND 332-346 833.41 2 14 1.6±0.1 1.5±0.1 5±0.1
QSLANDIRNKK 341-350 643.86 2 9 1.3±0 1.1±0.1 2.2±0.1
Mre11-
Rad50
Mean±S.E
Rad50
Mean±S.E
MR-AMP-PNP
Mean±S.E

aAverage and standard deviations were calculated using measurements from three independent experiments.
Peptides highlighted are those spanning the coiled-coil segment of Rad50.
IAAVDKAKKVKAAIE 354-369 518.99 3 15 1.5±0.1 1.4±0.1 3.8±0.2
LQEELDKIVKTKTNL 385-399 886.51 2 14 6.5±0.1 1.3±0.1 4.2±0.3
VMEKYHRGIL 400-409 623.34 2 9 4.3±0.1 0.8±0.0 0.5±0.1
LKDSGIKGAIIKKYIPLFNKQINHY 413-437 581.15 5 24 6.5±0.2 1.9±0.1 6.7±0.3
TLDEEF 448-453 753.33 1 5 0.9±0.1 0.9±1 1.5±0.2
NETIKSRGREDFS 454-468 769.88 2 12 7.5±0.1 6.7±0.3 8±0.5
ASFSEGEKARIDIAL 468-482 803.93 2 14 2.7±0.08 2.8±0.0 5.3±0.1
FTWRDIAS 484-491 498.25 2 7 0.3±0 0.2±0
FTWRDIASIVSGVS 484-497 760.43 1 13
3.96±0.1
ILDEVFDGSF 502-511 571.26 2 9 1.1±0 1.6±0.1 5.4±0.1
DAEGIKGVANIINS 512-515 700.87 2 13 9.0±0.01 7.8±0.2 10±0.5
IISHKDHDPQEYGQHLQM 533-550 726.02 3 17 7.4±0 5.9±0.1 5.8±0.2