Embed Size (px)
Citation preview
1
DNA microarray and DNA microarray and array data analysisarray data analysis
What is DNA MicroarrayWhat is DNA Microarray DNA microarray is a new technology to DNA microarray is a new technology to
measure the level of the measure the level of the mRNA gene mRNA gene productsproducts of a living cell. of a living cell.
A microarray chip is a rectangular chip on A microarray chip is a rectangular chip on which is imposed a grid of which is imposed a grid of DNA spotsDNA spots. . These spots form a These spots form a two dimensional arraytwo dimensional array. .
Each spot in the array contains millions of Each spot in the array contains millions of copies of some DNA strand, bonded to the copies of some DNA strand, bonded to the chip.chip.
Chips are made tiny so that a small amount of Chips are made tiny so that a small amount of RNA is needed from experimental cells.RNA is needed from experimental cells.
DNA MicroarrayDNA Microarray
Many applications in both basic and clinical Many applications in both basic and clinical research research determining the role a gene plays in a pathway, determining the role a gene plays in a pathway,
disease, diagnostics and pharmacology, …disease, diagnostics and pharmacology, …
There are There are three main platformsthree main platforms for performing for performing microarray analyses. microarray analyses. cDNA arrayscDNA arrays (generic, multiple manufacturers)(generic, multiple manufacturers) Oligonucleotide arraysOligonucleotide arrays ((genechipsgenechips) (Affymetrix)) (Affymetrix) cDNA membranes (radioactive detection)cDNA membranes (radioactive detection)
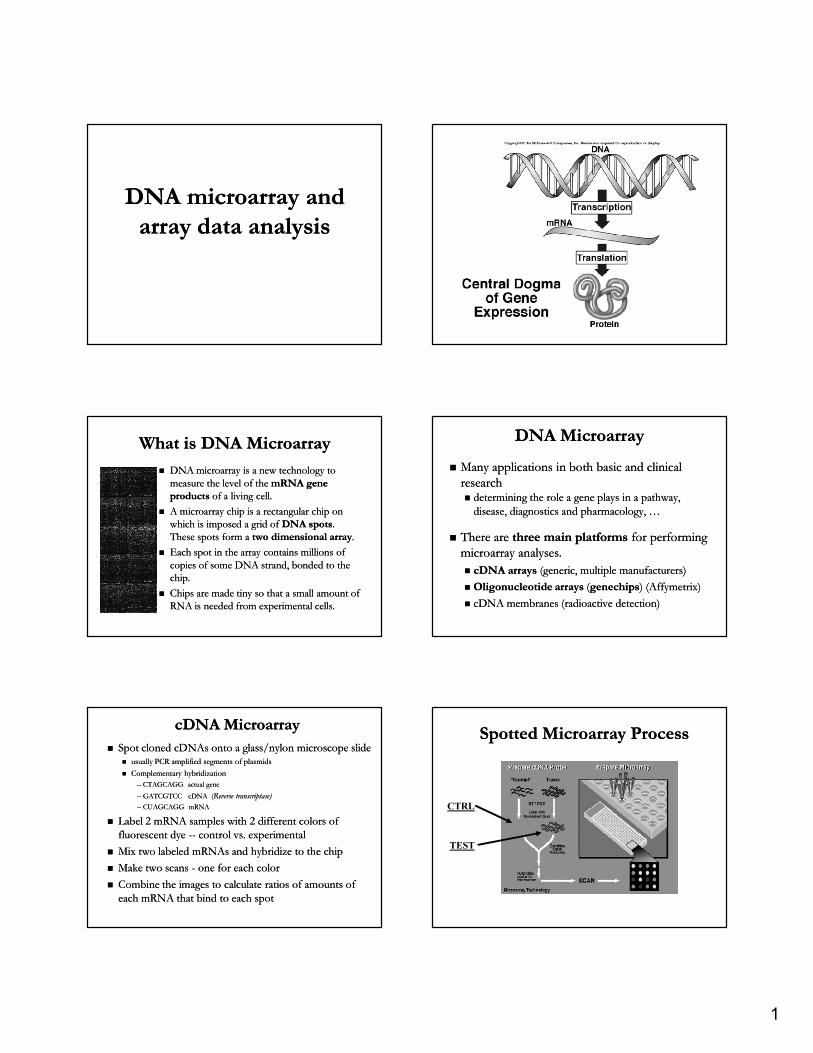
cDNA MicroarraycDNA Microarray Spot cloned cDNAs onto a glass/nylon microscope slideSpot cloned cDNAs onto a glass/nylon microscope slide
usually PCR amplified segments of plasmidsusually PCR amplified segments of plasmids Complementary hybridizationComplementary hybridization
---- CTAGCAGG actual geneCTAGCAGG actual gene---- GATCGTCC cDNA (GATCGTCC cDNA (Reverse transcriptase)Reverse transcriptase)---- CUAGCAGG mRNACUAGCAGG mRNA
Label 2 mRNA samples with 2 different colors of Label 2 mRNA samples with 2 different colors of fluorescent dye fluorescent dye ---- control vs. experimentalcontrol vs. experimental
Mix two labeled mRNAs and hybridize to the chipMix two labeled mRNAs and hybridize to the chip Make two scans Make two scans -- one for each colorone for each color Combine the images to calculate ratios of amounts of Combine the images to calculate ratios of amounts of
each mRNA that bind to each spoteach mRNA that bind to each spot
CTRL
TEST
Spotted Microarray Process Spotted Microarray Process
2
cDNA Array Experiment MoviecDNA Array Experiment Movie
http://www.bio.davidson.edu/courses/genomichttp://www.bio.davidson.edu/courses/genomics/chip/chip.htmls/chip/chip.html
AffymetrixAffymetrix Uses 25 base oligos synthesized in place on a chip (20 Uses 25 base oligos synthesized in place on a chip (20
pairs of oligos for each gene)pairs of oligos for each gene) cRNA labeled and scanned in a single “color”cRNA labeled and scanned in a single “color”
one sample per chipone sample per chip Can have as many as 760,000 probes on a chipCan have as many as 760,000 probes on a chip Arrays get smaller every year (more genes)Arrays get smaller every year (more genes) Chips are expensive (Chips are expensive (Human Genome U133A Plus 2.0 ~$500Human Genome U133A Plus 2.0 ~$500) ) Proprietary system: “black box” software, can only use Proprietary system: “black box” software, can only use
their chipstheir chips
GeneChip® Human Gene 1.0 ST ArrayGeneChip® Human Gene 1.0 ST Array
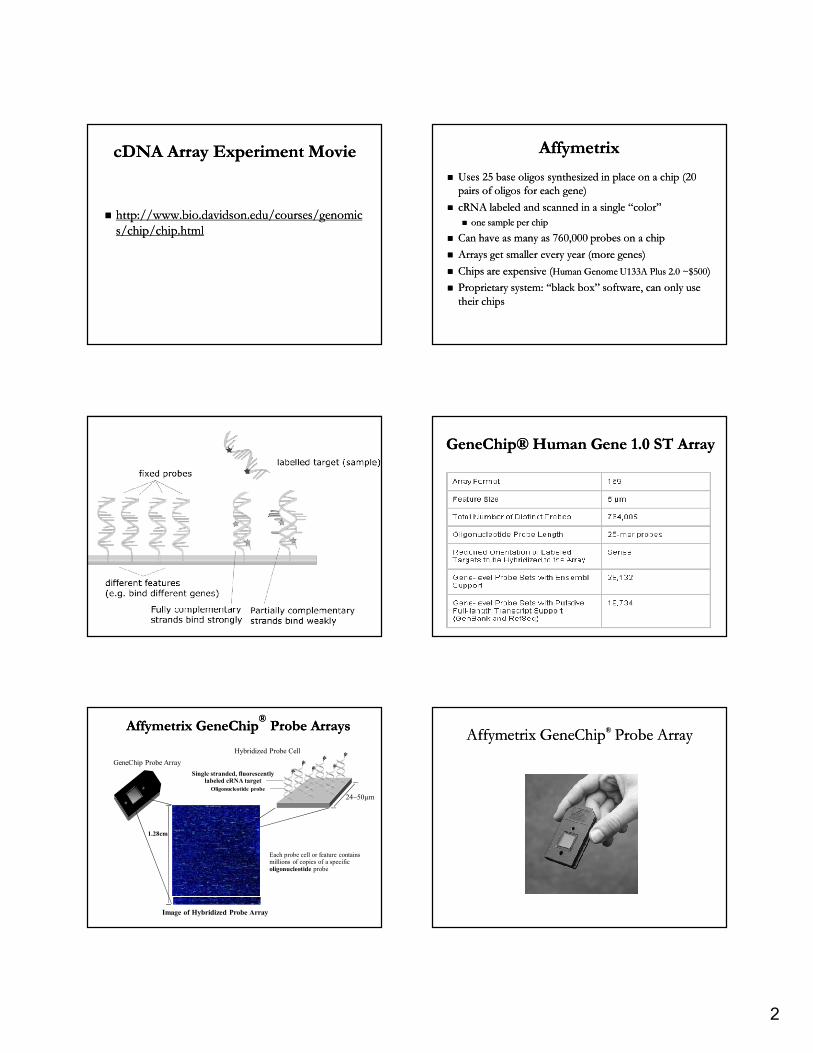
Affymetrix GeneChipAffymetrix GeneChip®® Probe ArraysProbe Arrays
24~50µm
Each probe cell or feature containsmillions of copies of a specificoligonucleotide probe
Image of Hybridized Probe Array
Single stranded, fluorescentlylabeled cRNA target
Oligonucleotide probe
* **
**
1.28cm
GeneChip Probe ArrayHybridized Probe Cell
*
Affymetrix GeneChipAffymetrix GeneChip®® Probe ArrayProbe Array
3
Affymetrix Genome Arrays
Perfect Match
Mismatch
25 mer DNA oligo
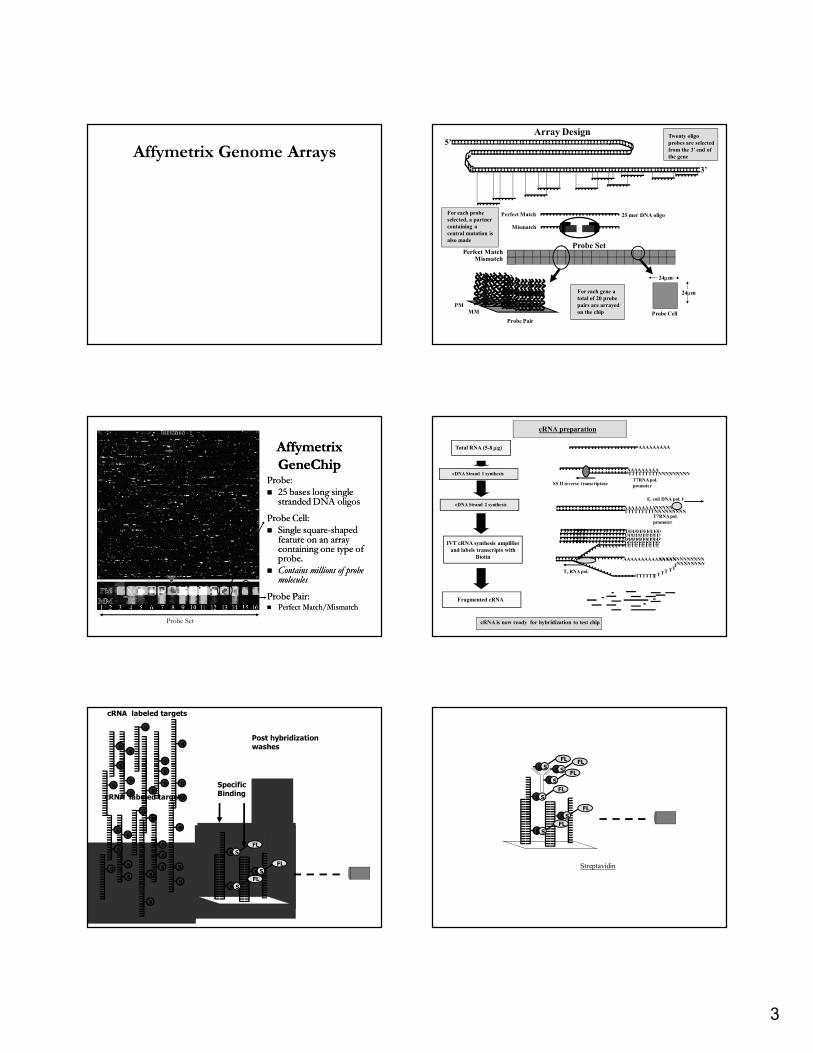
Array Design
3’
5’Twenty oligo probes are selected from the 3’ end of the gene
For each probe selected, a partner containing a central mutation is also made
Perfect MatchMismatch
Probe Set
Probe Pair
PMMM Probe Cell
24µm
24µmFor each gene a total of 20 probe pairs are arrayed on the chip
Affymetrix Affymetrix GeneChipGeneChip
Probe: Probe: 25 bases long single 25 bases long single
stranded DNA oligosstranded DNA oligos
Probe Cell: Probe Cell: Single squareSingle square--shaped shaped
feature on an array feature on an array containing one type of containing one type of probe. probe.
Contains millions of probe Contains millions of probe moleculesmolecules
Probe Pair: Probe Pair: Perfect Match/MismatchPerfect Match/Mismatch
Probe Set
Total RNA (5-8 µg) AAAAAAAAA
cRNA preparation
cRNA is now ready for hybridization to test chip
cDNA Strand 1 synthesis TTTTTTTTTNNNNNNNNNAAAAAAAAA
SS II reverse transcriptaseT7RNA pol. promoter
cDNA Strand 2 synthesisTTTTTTTTTNNNNNNNNNAAAAAAAAANNNNN
E. coli DNA pol. I
T7RNA pol. promoter
NNNNNNNN
IVT cRNA synthesis amplifies and labels transcripts with
Biotin NNNNNNNNNNNNNAAAAAAAAAAAAAAN
TTTTTTTTTT T
UUUUUUUUUU………..UUUUUUUUUU………..UUUUUUUUUU………..UUUUUUUUUU………..UUUUUUUUUU………..……
T7 RNA pol. TT
Fragmented cRNA
cDNA probes
B
B
BB
B
B
B
B
B
B
B
B
BB
B
B
BBB
B
B
cRNA labeled targets
B
B
B
B
B
B
BB
B
B
BBB
B
B
cRNA labeled targetsNon-SpecificBinding
SpecificBinding
Post hybridization washes
SFL
SFL
SFL
B
B
B
SFL
SFL
SFL
B
BB SFL
SFL
SFL
Streptavidin
4
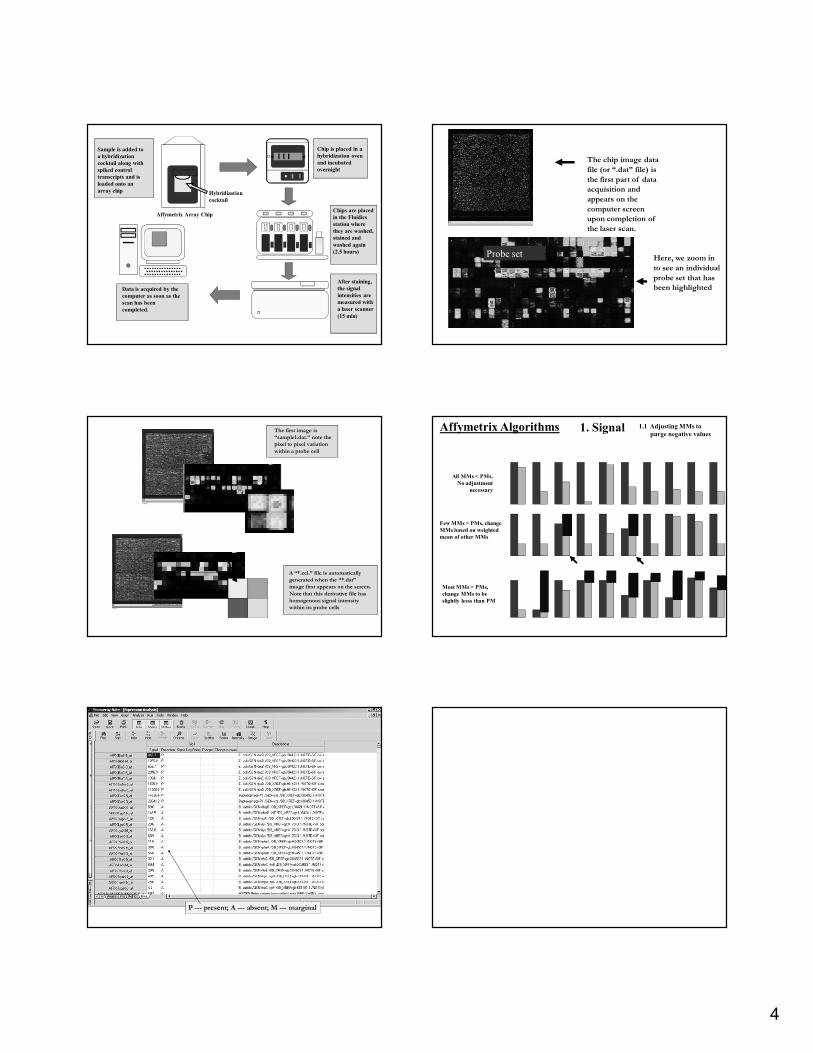
Chips are placed in the Fluidics station where they are washed, stained and washed again (2.5 hours)
Chip is placed in a hybridization oven and incubatedovernight
Hybridization cocktail
Affymetrix Array Chip
Sample is added to a hybridization cocktail along with spiked control transcripts and is loaded onto an array chip
Data is acquired by the computer as soon as the scan has been completed.
After staining, the signal intensities are measured with a laser scanner (15 min)
The chip image data file (or “.dat” file) is the first part of data acquisition and appears on the computer screen upon completion of the laser scan.
Here, we zoom in to see an individual probe set that has been highlighted
Probe set
The first image is “sample1.dat.” note the pixel to pixel variation within a probe cell
A “*.cel.” file is automatically generated when the “*.dat” image first appears on the screen. Note that this derivative file has homogenous signal intensity within its probe cells
Affymetrix Algorithms 1.1 Adjusting MMs topurge negative values
All MMs < PMs,No adjustment
necessary
Few MMs > PMs, change MMs based on weighted mean of other MMs
Most MMs > PMs, change MMs to be slightly lesss than PM
1. Signal
P --- present; A --- absent; M --- marginal
5
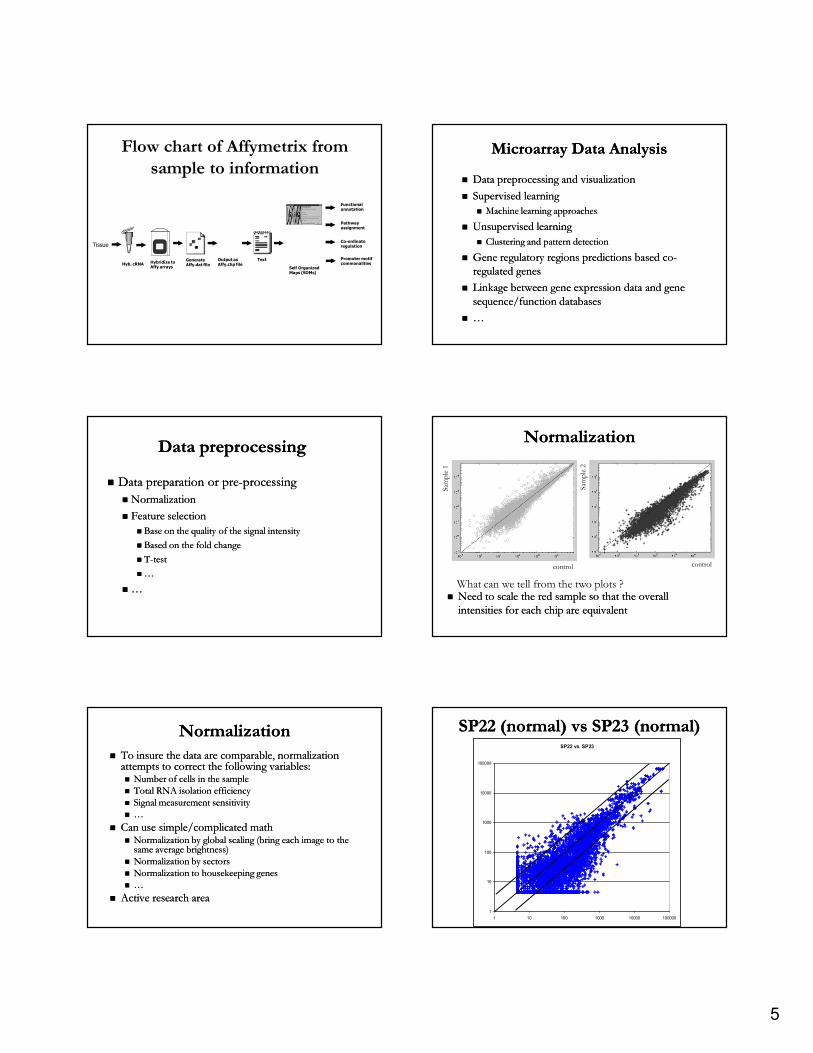
Generate Affy.dat fileHyb. cRNA Hybridize to
Affy arrays
Output as Affy.chp file
Text
Self Organized Maps (SOMs)
Functional annotation
Pathway assignment
Co-ordinate regulation
Promoter motif commonalities
Tissue
Flow chart of Affymetrix from sample to information
Microarray Data AnalysisMicroarray Data Analysis
Data preprocessing and visualization Data preprocessing and visualization Supervised learningSupervised learning
Machine learning approachesMachine learning approaches
Unsupervised learningUnsupervised learning Clustering and pattern detectionClustering and pattern detection
Gene regulatory regions predictions based coGene regulatory regions predictions based co--regulated genesregulated genes
Linkage between gene expression data and gene Linkage between gene expression data and gene sequence/function databasessequence/function databases
……
Data preprocessingData preprocessing
Data preparation or preData preparation or pre--processingprocessing NormalizationNormalization Feature selectionFeature selection
Base on the quality of the signal intensityBase on the quality of the signal intensity Based on the fold changeBased on the fold change TT--testtest ……
……
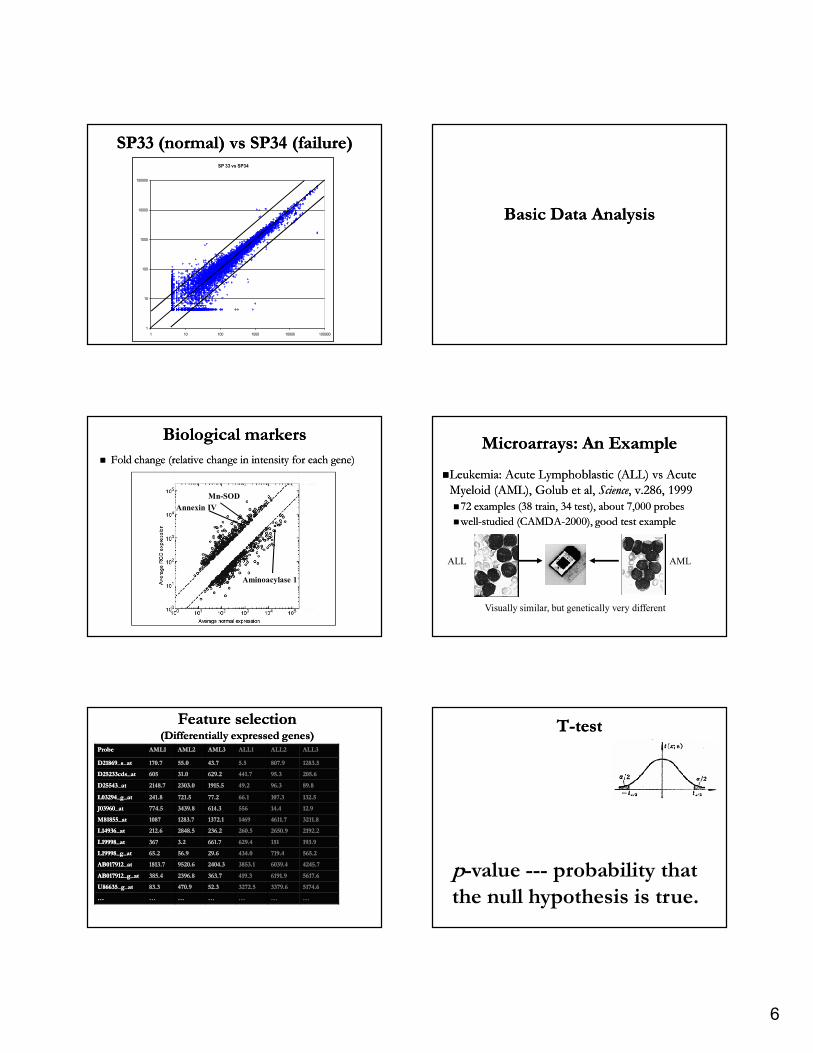
NormalizationNormalization
Need to scale the red sample so that the overall Need to scale the red sample so that the overall intensities for each chip are equivalent intensities for each chip are equivalent
control control
Sam
ple
1
Sam
ple
2What can we tell from the two plots ?
NormalizationNormalization To insure the data are comparable, normalization To insure the data are comparable, normalization
attempts to correct the following variables:attempts to correct the following variables: Number of cells in the sampleNumber of cells in the sample Total RNA isolation efficiencyTotal RNA isolation efficiency Signal measurement sensitivitySignal measurement sensitivity ……
Can use simple/complicated math Can use simple/complicated math Normalization by global scaling (bring each image to the Normalization by global scaling (bring each image to the
same average brightness) same average brightness) Normalization by sectorsNormalization by sectors Normalization to housekeeping genesNormalization to housekeeping genes ……
Active research areaActive research area
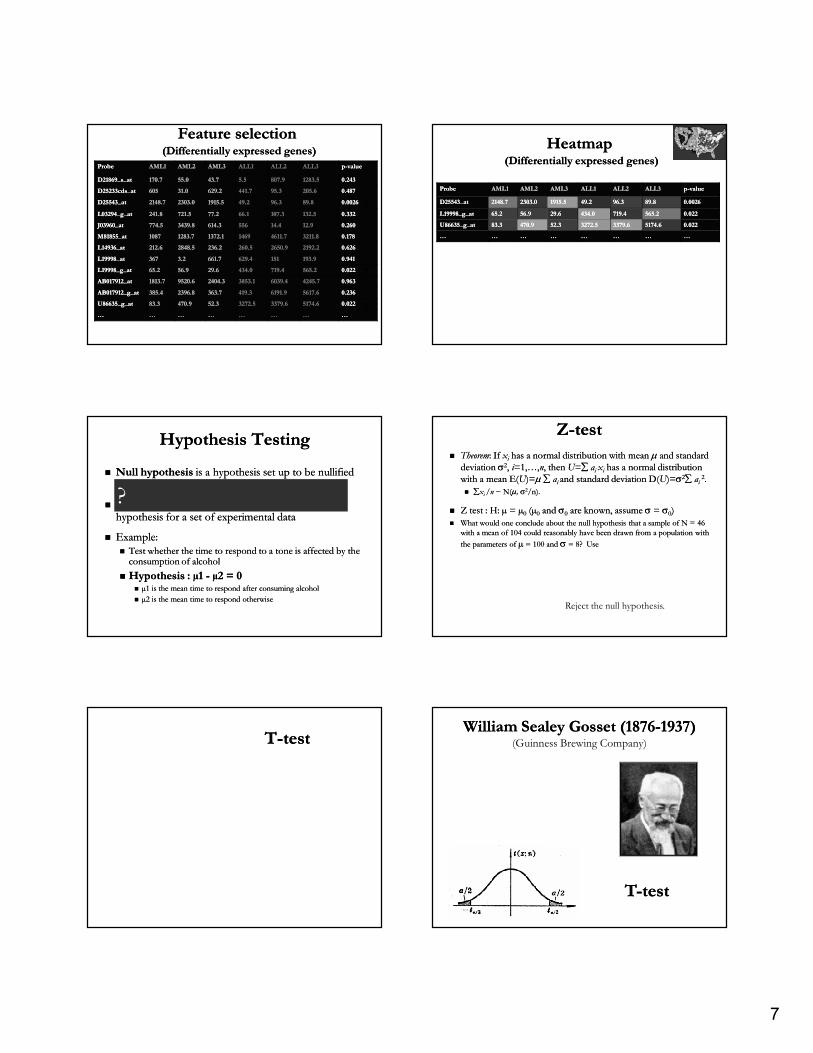
SP22 vs. SP23
1
10
100
1000
10000
100000
1 10 100 1000 10000 100000
SP22 (normal) vs SP23 (normal)SP22 (normal) vs SP23 (normal)
6
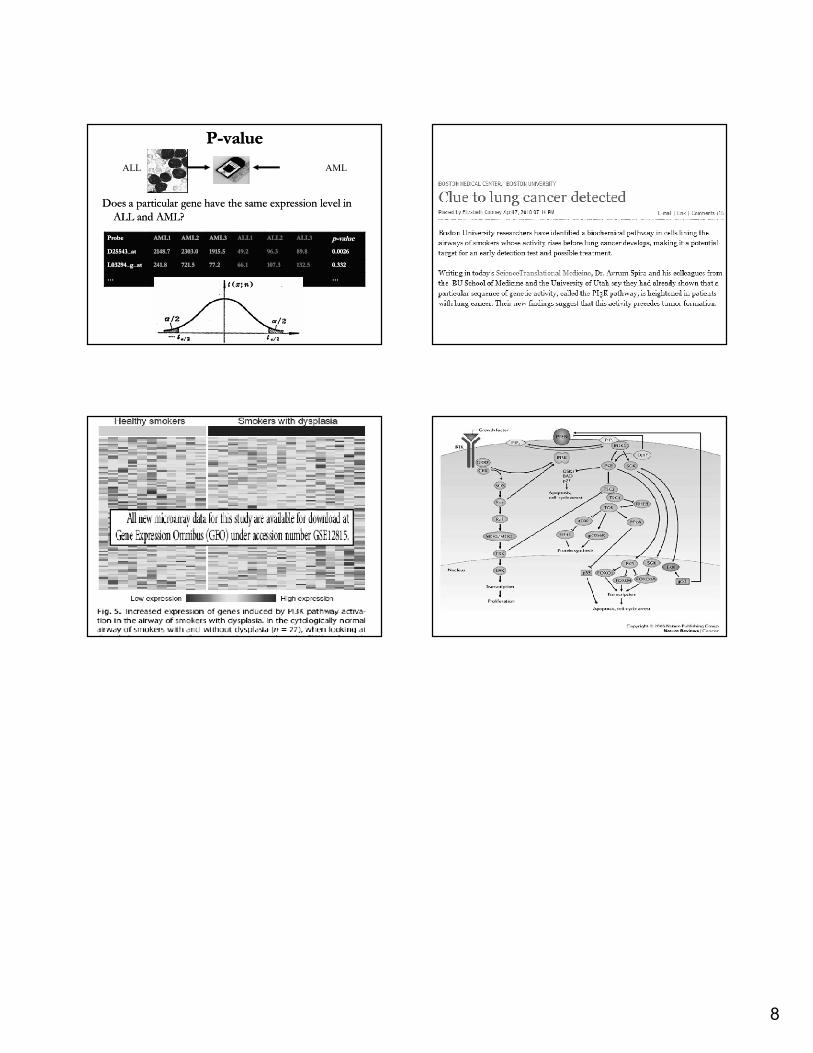
SP 33 vs SP34
1
10
100
1000
10000
100000
1 10 100 1000 10000 100000
SP33 (normal) vs SP34 (failure)SP33 (normal) vs SP34 (failure)
Basic Data AnalysisBasic Data Analysis
Biological markersBiological markers Fold change (relative change in intensity for each gene)Fold change (relative change in intensity for each gene)
Mn-SODAnnexin IV
Aminoacylase 1
Microarrays: An ExampleMicroarrays: An Example
Leukemia: Acute Lymphoblastic (ALL) vs Acute Leukemia: Acute Lymphoblastic (ALL) vs Acute Myeloid (AML), Golub et al, Myeloid (AML), Golub et al, ScienceScience, v.286, 1999, v.286, 199972 examples (38 train, 34 test), about 7,000 probes72 examples (38 train, 34 test), about 7,000 probeswellwell--studied (CAMDAstudied (CAMDA--2000), good test example2000), good test example
ALL AML
Visually similar, but genetically very different
Feature selectionFeature selection(Differentially expressed genes)(Differentially expressed genes)
ProbeProbe AML1AML1 AML2AML2 AML3AML3 ALL1ALL1 ALL2ALL2 ALL3ALL3
D21869_s_atD21869_s_at 170.7170.7 55.055.0 43.743.7 5.55.5 807.9807.9 1283.51283.5
D25233cds_atD25233cds_at 605605 31.031.0 629.2629.2 441.7441.7 95.395.3 205.6205.6
D25543_atD25543_at 2148.72148.7 2303.02303.0 1915.51915.5 49.249.2 96.396.3 89.889.8
L03294_g_atL03294_g_at 241.8241.8 721.5721.5 77.277.2 66.166.1 107.3107.3 132.5132.5
J03960_atJ03960_at 774.5774.5 3439.83439.8 614.3614.3 556556 14.414.4 12.912.9
M81855_atM81855_at 10871087 1283.71283.7 1372.11372.1 14691469 4611.74611.7 3211.83211.8
L14936_atL14936_at 212.6212.6 2848.52848.5 236.2236.2 260.5260.5 2650.92650.9 2192.22192.2
L19998_atL19998_at 367367 3.23.2 661.7661.7 629.4629.4 151151 193.9193.9
L19998_g_atL19998_g_at 65.265.2 56.956.9 29.629.6 434.0434.0 719.4719.4 565.2565.2
AB017912_atAB017912_at 1813.71813.7 9520.69520.6 2404.32404.3 3853.13853.1 6039.46039.4 4245.74245.7
AB017912_g_atAB017912_g_at 385.4385.4 2396.82396.8 363.7363.7 419.3419.3 6191.96191.9 5617.65617.6
U86635_g_atU86635_g_at 83.383.3 470.9470.9 52.352.3 3272.53272.5 3379.63379.6 5174.65174.6
…… …… …… …… …… …… ……
TT--testtest
p-value --- probability that the null hypothesis is true.
7
Feature selectionFeature selection(Differentially expressed genes)(Differentially expressed genes)
ProbeProbe AML1AML1 AML2AML2 AML3AML3 ALL1ALL1 ALL2ALL2 ALL3ALL3 pp--valuevalue
D21869_s_atD21869_s_at 170.7170.7 55.055.0 43.743.7 5.55.5 807.9807.9 1283.51283.5 0.2430.243
D25233cds_atD25233cds_at 605605 31.031.0 629.2629.2 441.7441.7 95.395.3 205.6205.6 0.4870.487
D25543_atD25543_at 2148.72148.7 2303.02303.0 1915.51915.5 49.249.2 96.396.3 89.889.8 0.00260.0026
L03294_g_atL03294_g_at 241.8241.8 721.5721.5 77.277.2 66.166.1 107.3107.3 132.5132.5 0.3320.332
J03960_atJ03960_at 774.5774.5 3439.83439.8 614.3614.3 556556 14.414.4 12.912.9 0.2600.260
M81855_atM81855_at 10871087 1283.71283.7 1372.11372.1 14691469 4611.74611.7 3211.83211.8 0.1780.178
L14936_atL14936_at 212.6212.6 2848.52848.5 236.2236.2 260.5260.5 2650.92650.9 2192.22192.2 0.6260.626
L19998_atL19998_at 367367 3.23.2 661.7661.7 629.4629.4 151151 193.9193.9 0.9410.941
L19998_g_atL19998_g_at 65.265.2 56.956.9 29.629.6 434.0434.0 719.4719.4 565.2565.2 0.0220.022
AB017912_atAB017912_at 1813.71813.7 9520.69520.6 2404.32404.3 3853.13853.1 6039.46039.4 4245.74245.7 0.9630.963
AB017912_g_atAB017912_g_at 385.4385.4 2396.82396.8 363.7363.7 419.3419.3 6191.96191.9 5617.65617.6 0.2360.236
U86635_g_atU86635_g_at 83.383.3 470.9470.9 52.352.3 3272.53272.5 3379.63379.6 5174.65174.6 0.0220.022
…… …… …… …… …… …… …… ……√
√
√
HeatmapHeatmap(Differentially expressed genes)(Differentially expressed genes)
ProbeProbe AML1AML1 AML2AML2 AML3AML3 ALL1ALL1 ALL2ALL2 ALL3ALL3 pp--valuevalue
D25543_atD25543_at 2148.72148.7 2303.02303.0 1915.51915.5 49.249.2 96.396.3 89.889.8 0.00260.0026
L19998_g_atL19998_g_at 65.265.2 56.956.9 29.629.6 434.0434.0 719.4719.4 565.2565.2 0.0220.022
U86635_g_atU86635_g_at 83.383.3 470.9470.9 52.352.3 3272.53272.5 3379.63379.6 5174.65174.6 0.0220.022
…… …… …… …… …… …… …… ……
Hypothesis TestingHypothesis Testing
Null hypothesisNull hypothesis is a hypothesis set up to be nullified is a hypothesis set up to be nullified in order to support an in order to support an alternative hypothesisalternative hypothesis..
Hypothesis testing is to test the viability of the null Hypothesis testing is to test the viability of the null hypothesis for a set of experimental datahypothesis for a set of experimental data
Example:Example: Test whether the time to respond to a tone is affected by the Test whether the time to respond to a tone is affected by the
consumption of alcoholconsumption of alcohol Hypothesis : µ1 Hypothesis : µ1 -- µ2 = 0µ2 = 0
µ1 is the mean time to respond after consuming alcohol µ1 is the mean time to respond after consuming alcohol µ2 is the mean time to respond otherwiseµ2 is the mean time to respond otherwise
?
ZZ--testtest TheoremTheorem: If : If xxii has a normal distribution with mean has a normal distribution with mean µµ and standard and standard
deviation deviation σσ22, , ii=1,…,=1,…,nn, then , then UU==∑∑ aai i xxii has a normal distribution has a normal distribution with a mean E(with a mean E(UU)=)=µµ ∑∑ aai i and standard deviation D(and standard deviation D(UU)=)=σσ22∑∑ aai i
22.. ∑∑xxi i /n /n ~ N(~ N(µµ, , σσ22/n)./n).
Z test : H: µ = µZ test : H: µ = µ00 (µ(µ00 and and σσ00 are known, assume are known, assume σσ = = σσ00)) What would one conclude about the null hypothesis that a sample of N = 46 What would one conclude about the null hypothesis that a sample of N = 46
with a mean of 104 could reasonably have been drawn from a population with with a mean of 104 could reasonably have been drawn from a population with the parameters of the parameters of µµ = 100 and = 100 and σσ = 8? Use = 8? Use
Reject the null hypothesis.
TT--testtestWilliam Sealey Gosset (1876William Sealey Gosset (1876--1937)1937)
(Guinness Brewing Company)
TT--testtest
8
PP--valuevalue
Does a particular gene have the same expression level in Does a particular gene have the same expression level in ALL and AML?ALL and AML?
ProbeProbe AML1AML1 AML2AML2 AML3AML3 ALL1ALL1 ALL2ALL2 ALL3ALL3 pp--valuevalue
D25543_atD25543_at 2148.72148.7 2303.02303.0 1915.51915.5 49.249.2 96.396.3 89.889.8 0.00260.0026
L03294_g_atL03294_g_at 241.8241.8 721.5721.5 77.277.2 66.166.1 107.3107.3 132.5132.5 0.3320.332
…… …… …… …… …… …… …… ……
ALL AML