Embed Size (px)
Citation preview
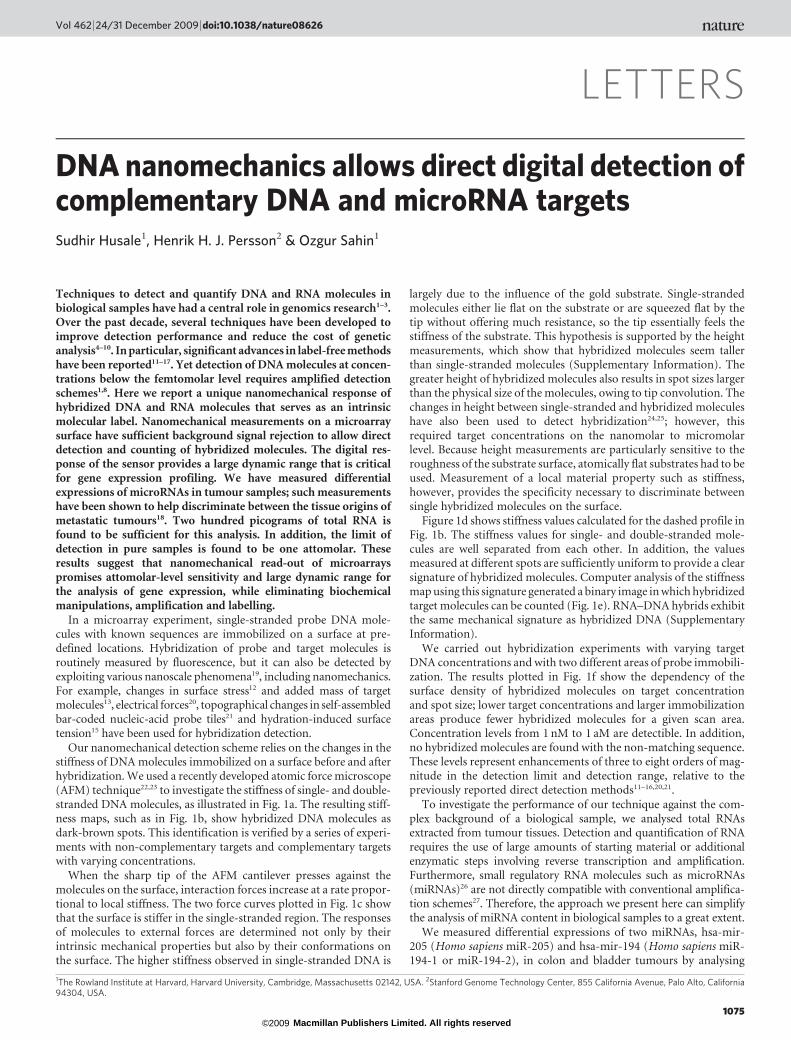
LETTERS
DNA nanomechanics allows direct digital detection ofcomplementary DNA and microRNA targetsSudhir Husale1, Henrik H. J. Persson2 & Ozgur Sahin1
Techniques to detect and quantify DNA and RNA molecules inbiological samples have had a central role in genomics research1–3.Over the past decade, several techniques have been developed toimprove detection performance and reduce the cost of geneticanalysis4–10. In particular, significant advances in label-free methodshave been reported11–17. Yet detection of DNA molecules at concen-trations below the femtomolar level requires amplified detectionschemes1,8. Here we report a unique nanomechanical response ofhybridized DNA and RNA molecules that serves as an intrinsicmolecular label. Nanomechanical measurements on a microarraysurface have sufficient background signal rejection to allow directdetection and counting of hybridized molecules. The digital res-ponse of the sensor provides a large dynamic range that is criticalfor gene expression profiling. We have measured differentialexpressions of microRNAs in tumour samples; such measurementshave been shown to help discriminate between the tissue origins ofmetastatic tumours18. Two hundred picograms of total RNA isfound to be sufficient for this analysis. In addition, the limit ofdetection in pure samples is found to be one attomolar. Theseresults suggest that nanomechanical read-out of microarrayspromises attomolar-level sensitivity and large dynamic range forthe analysis of gene expression, while eliminating biochemicalmanipulations, amplification and labelling.
In a microarray experiment, single-stranded probe DNA mole-cules with known sequences are immobilized on a surface at pre-defined locations. Hybridization of probe and target molecules isroutinely measured by fluorescence, but it can also be detected byexploiting various nanoscale phenomena19, including nanomechanics.For example, changes in surface stress12 and added mass of targetmolecules13, electrical forces20, topographical changes in self-assembledbar-coded nucleic-acid probe tiles21 and hydration-induced surfacetension15 have been used for hybridization detection.
Our nanomechanical detection scheme relies on the changes in thestiffness of DNA molecules immobilized on a surface before and afterhybridization. We used a recently developed atomic force microscope(AFM) technique22,23 to investigate the stiffness of single- and double-stranded DNA molecules, as illustrated in Fig. 1a. The resulting stiff-ness maps, such as in Fig. 1b, show hybridized DNA molecules asdark-brown spots. This identification is verified by a series of experi-ments with non-complementary targets and complementary targetswith varying concentrations.
When the sharp tip of the AFM cantilever presses against themolecules on the surface, interaction forces increase at a rate propor-tional to local stiffness. The two force curves plotted in Fig. 1c showthat the surface is stiffer in the single-stranded region. The responsesof molecules to external forces are determined not only by theirintrinsic mechanical properties but also by their conformations onthe surface. The higher stiffness observed in single-stranded DNA is
largely due to the influence of the gold substrate. Single-strandedmolecules either lie flat on the substrate or are squeezed flat by thetip without offering much resistance, so the tip essentially feels thestiffness of the substrate. This hypothesis is supported by the heightmeasurements, which show that hybridized molecules seem tallerthan single-stranded molecules (Supplementary Information). Thegreater height of hybridized molecules also results in spot sizes largerthan the physical size of the molecules, owing to tip convolution. Thechanges in height between single-stranded and hybridized moleculeshave also been used to detect hybridization24,25; however, thisrequired target concentrations on the nanomolar to micromolarlevel. Because height measurements are particularly sensitive to theroughness of the substrate surface, atomically flat substrates had to beused. Measurement of a local material property such as stiffness,however, provides the specificity necessary to discriminate betweensingle hybridized molecules on the surface.
Figure 1d shows stiffness values calculated for the dashed profile inFig. 1b. The stiffness values for single- and double-stranded mole-cules are well separated from each other. In addition, the valuesmeasured at different spots are sufficiently uniform to provide a clearsignature of hybridized molecules. Computer analysis of the stiffnessmap using this signature generated a binary image in which hybridizedtarget molecules can be counted (Fig. 1e). RNA–DNA hybrids exhibitthe same mechanical signature as hybridized DNA (SupplementaryInformation).
We carried out hybridization experiments with varying targetDNA concentrations and with two different areas of probe immobili-zation. The results plotted in Fig. 1f show the dependency of thesurface density of hybridized molecules on target concentrationand spot size; lower target concentrations and larger immobilizationareas produce fewer hybridized molecules for a given scan area.Concentration levels from 1 nM to 1 aM are detectible. In addition,no hybridized molecules are found with the non-matching sequence.These levels represent enhancements of three to eight orders of mag-nitude in the detection limit and detection range, relative to thepreviously reported direct detection methods11–16,20,21.
To investigate the performance of our technique against the com-plex background of a biological sample, we analysed total RNAsextracted from tumour tissues. Detection and quantification of RNArequires the use of large amounts of starting material or additionalenzymatic steps involving reverse transcription and amplification.Furthermore, small regulatory RNA molecules such as microRNAs(miRNAs)26 are not directly compatible with conventional amplifica-tion schemes27. Therefore, the approach we present here can simplifythe analysis of miRNA content in biological samples to a great extent.
We measured differential expressions of two miRNAs, hsa-mir-205 (Homo sapiens miR-205) and hsa-mir-194 (Homo sapiens miR-194-1 or miR-194-2), in colon and bladder tumours by analysing
1The Rowland Institute at Harvard, Harvard University, Cambridge, Massachusetts 02142, USA. 2Stanford Genome Technology Center, 855 California Avenue, Palo Alto, California94304, USA.
Vol 462 | 24/31 December 2009 | doi:10.1038/nature08626
1075 Macmillan Publishers Limited. All rights reserved©2009

total RNAs extracted from tissue samples. The extraction processincludes disruption of cells and purification of RNAs. Material iso-lated in this way is routinely used for gene expression profiling.miRNAs exhibit expression patterns that can be used to predict thetissue origins of metastatic tumours18, and the particular miRNAs weinvestigate here discriminate between tumours of gastrointestinal(colon) origin and those of non-gastrointestinal epithelial (bladder)origin. The numbers of RNA–DNA hybrids measured are plotted inFig. 2a for hsa-mir-205 and in Fig. 2b for hsa-mir-194. (Numericalvalues from each measurement are provided in SupplementaryInformation.) The chart in Fig. 2c compares average expression levelsnormalized to 10 pg. The data show that hsa-mir-205 is expressedmore in bladder tumour sample than in colon tumour sample, andthat the opposite is true of hsa-mir-194. The observed inversion indifferential expression in these miRNAs is in agreement with the
results of ref. 18. We further verified this result by conventionalmicroarray analysis of the tumour samples (NCode HumanmiRNA Microarray V3, Invitrogen). The average numbers ofmiRNAs are also in broad agreement with the numbers derived fromquantitative PCR experiments27. We note that the inversion in thedifferential expressions of the two miRNAs was detectable atamounts of total RNA as low as 0.2 ng. This represents a significantreduction in the amount of total RNA necessary relative to conven-tional microarray experiments, in which amounts in excess of 1 mgare typically required. These arrays are generally printed on glassslides and use spot sizes of around 100 mm 3 100 mm. Their unprin-ted areas are blocked to eliminate non-specific adsorption.
An important advantage of our nanomechanical detection tech-nique is its compatibility with multiplexed analysis in microarrayplatforms. Multiplexed analysis demands the generation of stiffness
Number of dsDNA molecules, 212
–3 –2 –1 0 1–10
0
10
20
30
40
Forc
e (n
N)
Distance (nm)
ssDNA dsDNA
0.0 0.2 0.4 0.6 0.8 1.0 1.2
2.5
3.0
3.5
4.0
4.5
5.0
5.5
Stif
fnes
s (G
Pa)
Position (μm)
10–20 10–18 10–16 10–14 10–12 10–10 10–8–101
10
102
103
104
105
Cou
nts
Concentration (M)
23
1,106
5,698
36
2,298
39,0006,600
a
b c
d e
f
Gold
ssDNA
dsDNA
HS-(CH2)6-OH
Figure 1 | Nanomechanical detection of DNA hybridization. a, b, Schematicof the experiment (a) and stiffness map (b). After hybridization, the surfaceof the array spot is scanned with the AFM to generate the stiffness map. Scansize, 3mm. Hybridized molecules are measured to be less stiff and appear asdark brown spots. dsDNA, double-stranded DNA; ssDNA, single-strandedDNA. c, Stiffness at each pixel in b is calculated from force–distance curves.d, Effective stiffness values calculated for the dashed profile in
b. e, Binary image computer-generated from stiffness values, in which thehybridized molecules can be counted. f, Numbers of hybridized moleculesfound in 10-mm-wide scan areas, plotted as a function of targetconcentration and for two probe immobilization areas (squares, 50 mm;triangles, 5 mm). Hybridization against a non-matching sequence isindicated by the pink circle.
800
600
400
200
0
hsa-mir-205
hsa-mir-194
Bladder
Colon
a b c
0.0 0.5 1.0 1.5 2.00
100
200
300
400
500
600
BladderColon
Cou
nts
Total RNA (ng)
0.0 0.5 1.0 1.5 2.00
50
100
150
200
250
BladderColon
Cou
nts
Total RNA (ng)
Cou
nts
Figure 2 | Direct detection and quantification of miRNA expression incancer tissues. Total RNAs isolated from bladder and colon tumoursamples are analysed for miRNA content. a, b, Average numbers of targetmolecules found for varying amounts of total RNA are plotted for hsa-mir-205 (a) and hsa-mir-194 (b) (10-mm scan, 200-mm immobilization).
Standard deviations (error bars) are calculated whenever two or moremeasurements are available from experiments carried out in triplicate.c, Comparison of expression levels in each sample, estimated by normalizingthe data to 10 pg, averaging and scaling to entire area of immobilization.
LETTERS NATURE | Vol 462 | 24/31 December 2009
1076 Macmillan Publishers Limited. All rights reserved©2009
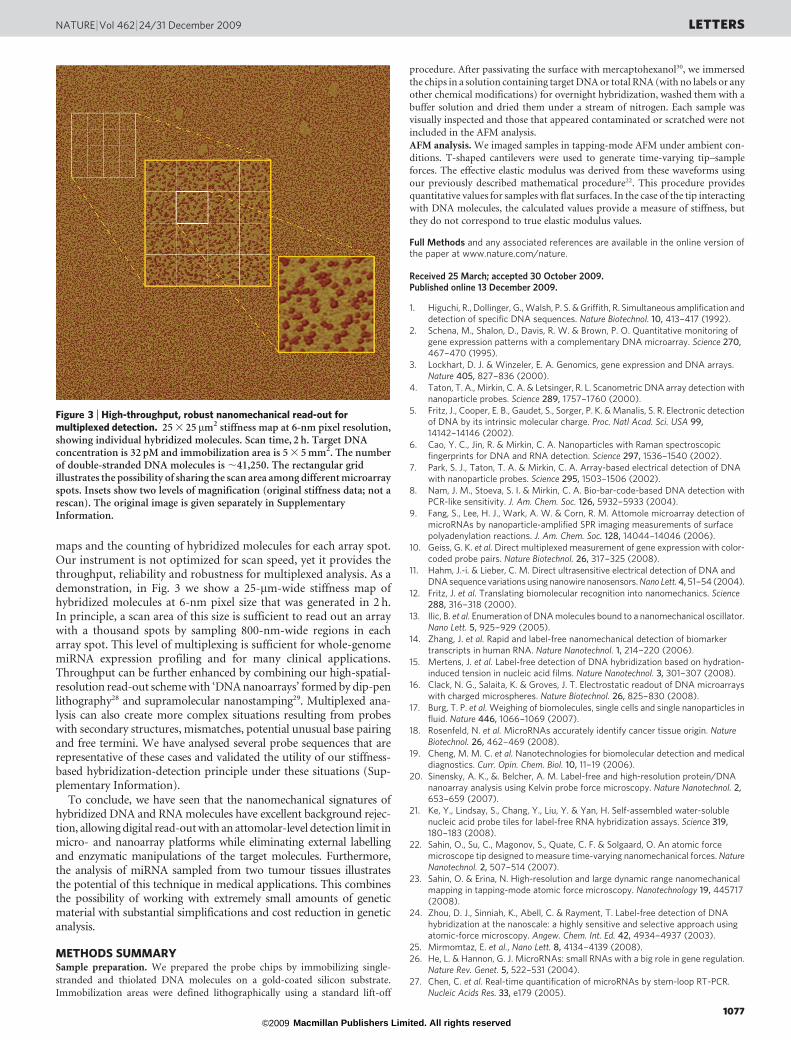
maps and the counting of hybridized molecules for each array spot.Our instrument is not optimized for scan speed, yet it provides thethroughput, reliability and robustness for multiplexed analysis. As ademonstration, in Fig. 3 we show a 25-mm-wide stiffness map ofhybridized molecules at 6-nm pixel size that was generated in 2 h.In principle, a scan area of this size is sufficient to read out an arraywith a thousand spots by sampling 800-nm-wide regions in eacharray spot. This level of multiplexing is sufficient for whole-genomemiRNA expression profiling and for many clinical applications.Throughput can be further enhanced by combining our high-spatial-resolution read-out scheme with ‘DNA nanoarrays’ formed by dip-penlithography28 and supramolecular nanostamping29. Multiplexed ana-lysis can also create more complex situations resulting from probeswith secondary structures, mismatches, potential unusual base pairingand free termini. We have analysed several probe sequences that arerepresentative of these cases and validated the utility of our stiffness-based hybridization-detection principle under these situations (Sup-plementary Information).
To conclude, we have seen that the nanomechanical signatures ofhybridized DNA and RNA molecules have excellent background rejec-tion, allowing digital read-out with an attomolar-level detection limit inmicro- and nanoarray platforms while eliminating external labellingand enzymatic manipulations of the target molecules. Furthermore,the analysis of miRNA sampled from two tumour tissues illustratesthe potential of this technique in medical applications. This combinesthe possibility of working with extremely small amounts of geneticmaterial with substantial simplifications and cost reduction in geneticanalysis.
METHODS SUMMARYSample preparation. We prepared the probe chips by immobilizing single-
stranded and thiolated DNA molecules on a gold-coated silicon substrate.
Immobilization areas were defined lithographically using a standard lift-off
procedure. After passivating the surface with mercaptohexanol30, we immersed
the chips in a solution containing target DNA or total RNA (with no labels or any
other chemical modifications) for overnight hybridization, washed them with a
buffer solution and dried them under a stream of nitrogen. Each sample was
visually inspected and those that appeared contaminated or scratched were not
included in the AFM analysis.
AFM analysis. We imaged samples in tapping-mode AFM under ambient con-
ditions. T-shaped cantilevers were used to generate time-varying tip–sample
forces. The effective elastic modulus was derived from these waveforms using
our previously described mathematical procedure22. This procedure provides
quantitative values for samples with flat surfaces. In the case of the tip interacting
with DNA molecules, the calculated values provide a measure of stiffness, but
they do not correspond to true elastic modulus values.
Full Methods and any associated references are available in the online version ofthe paper at www.nature.com/nature.
Received 25 March; accepted 30 October 2009.Published online 13 December 2009.
1. Higuchi, R., Dollinger, G., Walsh, P. S. & Griffith, R. Simultaneous amplification anddetection of specific DNA sequences. Nature Biotechnol. 10, 413–417 (1992).
2. Schena, M., Shalon, D., Davis, R. W. & Brown, P. O. Quantitative monitoring ofgene expression patterns with a complementary DNA microarray. Science 270,467–470 (1995).
3. Lockhart, D. J. & Winzeler, E. A. Genomics, gene expression and DNA arrays.Nature 405, 827–836 (2000).
4. Taton, T. A., Mirkin, C. A. & Letsinger, R. L. Scanometric DNA array detection withnanoparticle probes. Science 289, 1757–1760 (2000).
5. Fritz, J., Cooper, E. B., Gaudet, S., Sorger, P. K. & Manalis, S. R. Electronic detectionof DNA by its intrinsic molecular charge. Proc. Natl Acad. Sci. USA 99,14142–14146 (2002).
6. Cao, Y. C., Jin, R. & Mirkin, C. A. Nanoparticles with Raman spectroscopicfingerprints for DNA and RNA detection. Science 297, 1536–1540 (2002).
7. Park, S. J., Taton, T. A. & Mirkin, C. A. Array-based electrical detection of DNAwith nanoparticle probes. Science 295, 1503–1506 (2002).
8. Nam, J. M., Stoeva, S. I. & Mirkin, C. A. Bio-bar-code-based DNA detection withPCR-like sensitivity. J. Am. Chem. Soc. 126, 5932–5933 (2004).
9. Fang, S., Lee, H. J., Wark, A. W. & Corn, R. M. Attomole microarray detection ofmicroRNAs by nanoparticle-amplified SPR imaging measurements of surfacepolyadenylation reactions. J. Am. Chem. Soc. 128, 14044–14046 (2006).
10. Geiss, G. K. et al. Direct multiplexed measurement of gene expression with color-coded probe pairs. Nature Biotechnol. 26, 317–325 (2008).
11. Hahm, J.-i. & Lieber, C. M. Direct ultrasensitive electrical detection of DNA andDNA sequence variations using nanowire nanosensors. Nano Lett. 4, 51–54 (2004).
12. Fritz, J. et al. Translating biomolecular recognition into nanomechanics. Science288, 316–318 (2000).
13. Ilic, B. et al. Enumeration of DNA molecules bound to a nanomechanical oscillator.Nano Lett. 5, 925–929 (2005).
14. Zhang, J. et al. Rapid and label-free nanomechanical detection of biomarkertranscripts in human RNA. Nature Nanotechnol. 1, 214–220 (2006).
15. Mertens, J. et al. Label-free detection of DNA hybridization based on hydration-induced tension in nucleic acid films. Nature Nanotechnol. 3, 301–307 (2008).
16. Clack, N. G., Salaita, K. & Groves, J. T. Electrostatic readout of DNA microarrayswith charged microspheres. Nature Biotechnol. 26, 825–830 (2008).
17. Burg, T. P. et al. Weighing of biomolecules, single cells and single nanoparticles influid. Nature 446, 1066–1069 (2007).
18. Rosenfeld, N. et al. MicroRNAs accurately identify cancer tissue origin. NatureBiotechnol. 26, 462–469 (2008).
19. Cheng, M. M. C. et al. Nanotechnologies for biomolecular detection and medicaldiagnostics. Curr. Opin. Chem. Biol. 10, 11–19 (2006).
20. Sinensky, A. K., &. Belcher, A. M. Label-free and high-resolution protein/DNAnanoarray analysis using Kelvin probe force microscopy. Nature Nanotechnol. 2,653–659 (2007).
21. Ke, Y., Lindsay, S., Chang, Y., Liu, Y. & Yan, H. Self-assembled water-solublenucleic acid probe tiles for label-free RNA hybridization assays. Science 319,180–183 (2008).
22. Sahin, O., Su, C., Magonov, S., Quate, C. F. & Solgaard, O. An atomic forcemicroscope tip designed to measure time-varying nanomechanical forces. NatureNanotechnol. 2, 507–514 (2007).
23. Sahin, O. & Erina, N. High-resolution and large dynamic range nanomechanicalmapping in tapping-mode atomic force microscopy. Nanotechnology 19, 445717(2008).
24. Zhou, D. J., Sinniah, K., Abell, C. & Rayment, T. Label-free detection of DNAhybridization at the nanoscale: a highly sensitive and selective approach usingatomic-force microscopy. Angew. Chem. Int. Ed. 42, 4934–4937 (2003).
25. Mirmomtaz, E. et al., Nano Lett. 8, 4134–4139 (2008).26. He, L. & Hannon, G. J. MicroRNAs: small RNAs with a big role in gene regulation.
Nature Rev. Genet. 5, 522–531 (2004).27. Chen, C. et al. Real-time quantification of microRNAs by stem-loop RT-PCR.
Nucleic Acids Res. 33, e179 (2005).
Figure 3 | High-throughput, robust nanomechanical read-out formultiplexed detection. 25 3 25 mm2 stiffness map at 6-nm pixel resolution,showing individual hybridized molecules. Scan time, 2 h. Target DNAconcentration is 32 pM and immobilization area is 5 3 5 mm2. The numberof double-stranded DNA molecules is ,41,250. The rectangular gridillustrates the possibility of sharing the scan area among different microarrayspots. Insets show two levels of magnification (original stiffness data; not arescan). The original image is given separately in SupplementaryInformation.
NATURE | Vol 462 | 24/31 December 2009 LETTERS
1077 Macmillan Publishers Limited. All rights reserved©2009

28. Demers, L. M. et al. Direct patterning of modified oligonucleotides on metals andinsulators by dip-pen nanolithography. Science 296, 1836–1838 (2002).
29. Yu, A. A. et al. Supramolecular nanostamping: using DNA as movable type. NanoLett. 5, 1061–1064 (2005).
30. Herne, T. M. & Tarlov, M. J. Characterization of DNA probes immobilized on goldsurfaces. J. Am. Chem. Soc. 119, 8916–8920 (1997).
Supplementary Information is linked to the online version of the paper atwww.nature.com/nature.
Acknowledgements This research is supported by the Rowland Junior FellowsProgram. H.H.J.P. was supported in part by US National Institutes of Health grantHG000205. We thank R. W. Davis for discussions.
Author Contributions S.H. performed the experiments, prepared gold substratesand developed experimental protocols; H.H.J.P. and O.S. contributed to theexperiments. S.H. and H.H.J.P. designed and performed the surface chemistry, O.S.designed the cantilevers and wrote the stiffness calculation program, and H.H.J.P.and O.S. designed the biological assay. O.S. directed the research and wrote thepaper; all authors discussed the results and commented on the manuscript.
Author Information Reprints and permissions information is available atwww.nature.com/reprints. The authors declare competing financial interests:details accompany the full-text HTML version of the paper at www.nature.com/nature. Correspondence and requests for materials should be addressed to O.S.([email protected]).
LETTERS NATURE | Vol 462 | 24/31 December 2009
1078 Macmillan Publishers Limited. All rights reserved©2009
METHODSSubstrate preparation. We prepared 5 3 5 mm2 gold-coated silicon chips by
sputter coating (Au, 20 nm; Ti, 10 nm; AJA sputtering system, Center for
Nanoscale Systems, Harvard University) on Si wafers (3 inch; Silicon Quest
International). A diamond scribe was used for cutting wafers into 5 3 5 mm2
chips. Substrates with 50 3 50 mm2 and 200 3 200mm2 gold spots were defined
by photolithography followed by a standard lift-off procedure.
Immobilization of single-stranded DNA on the gold surface. We pretreated
gold chips using a UV/Ozone ProCleaner (Bioforce Nanosciences) for ,30 min
and washed them with nanopure water (deionized and filtered using an inorganicmembrane filter with 20-nm pores). Thiolated single-stranded DNA molecules
(concentration, 1mM) were immobilized on the freshly prepared gold surface
through thiol–gold covalent bonding, using high-salt buffer (1 M NaCl, 50 mM
phosphate buffer, pH 7.2). Immobilization was done at room temperature (24 uC)
under constant mixing; incubation time, ,15 h. The immobilized single-
stranded-DNA chip surfaces were passivated by washing with water and sub-
sequent incubation with mercaptohexanol (1 mM in nanopure water) for ,1 h.
Synthetic DNA samples. All oligonucleotides were purchased from MWG
Biotech or from Integrated DNA Technologies and were used within a month.
Thiolated probes were reduced according to manufacturers’ suggested protocols.
DNA hybridization. Before hybridization, immobilized single-stranded-DNA
chips were thoroughly washed with nanopure water. DNA–DNA hybridization
reactions were carried out at room temperature under constant mixing in
13 SSC buffer (150 mM NaCl, 15 mM sodium citrate, pH 7.0). The volume of
the hybridizing solution was 200ml for 5 3 5 mm2 gold chips and 1 ml for 50-mm
gold spots. Finally, hybridized chips were washed with low-salt buffer (25 mM
NaCl, 10 mM Tris-HCl, pH 7.4) and gently dried in a weak stream of nitrogen.
Total RNA hybridization. Total RNAs extracted from human bladder and colontumours were purchased from Stratagene and kept at 270 uC until used. Samples
were diluted with hybridization buffer (33 SSPE with Tween 20, pH 7.4;
Teknova) to their final total RNA concentrations in Fig. 2. Hybridizations were
carried out on a shaker for ,16 h at 42 uC. All microcentrifuge tubes, tweezers
and gold-coated silicon chips were cleaned with RNaseZap (Ambion) before
immobilization of DNA molecules, and washed extensively with DNase- and
RNase-free water (MP Biomedicals).
AFM measurement conditions. Tapping-mode AFM was used for the measure-
ments under ambient conditions. Torsional harmonic cantilevers (HarmoniX
Probes, Veeco Instruments) were used (resonance frequency, ,60 KHz) to generate
time-varying tip–sample forces. The driving amplitude was adjusted so that peak
tapping forces during the scan were approximately 30–50 nN (peak tapping forces
were different for single- and double-stranded molecules). The set-point amplitude
was set to ,60 nm.
Calculation of elastic modulus. The numerical procedure to reconstruct the
tip–sample force waveform from the raw deflection signals involved averaging
vibration waveforms over several consecutive oscillation cycles to reduce noise,
correcting the effect of the torsional frequency response, eliminating the cross-
talk from large vertical signals and fitting the tip–sample force–distance curves to
a contact mechanics model. Details of these steps and data acquisition hardware
are described in ref. 22. Calculations were carried out in LABVIEW. Calibration
of the time-varying force waveform (volts-to-newtons conversion) was per-
formed following ref. 31. The effective elastic moduli of single- and double-
stranded DNAs in Fig. 1 were calculated for a tip radius of 7 nm. Subsequent
images were calibrated by using the single-stranded background in Fig. 1 as a
reference.
31. Sahin, O. Harnessing bifurcations in tapping-mode atomic force microscopy tocalibrate time-varying tip-sample force measurements. Rev. Sci. Instrum. 78,103707 (2007).
doi:10.1038/nature08626
Macmillan Publishers Limited. All rights reserved©2009