Embed Size (px)
Citation preview

DNA sequencing.
• Dideoxy analogs of normal nucleotide triphosphates (ddNTP) cause premature termination of a growing chain of nucleotides.
ACAGTCGATTG
ACAddG
ACAGTCddG
ACAGTCGATTddG
• Fragments are separated according to their sizes in gel electrophoresis. The lengths show the positions of “G” in the original DNA sequence.

Nucleotides and phosphodiester bond.
Phosphodiester bond

Genomic sequencing.
• Individual chromosomes are broken into 100kb random fragments.
• This library of fragments is screened to find overlapping fragments – contigs.
• Unique overlapping clones are chosen for sequencing.
• Put together overlapping sequenced clones using computer programs.
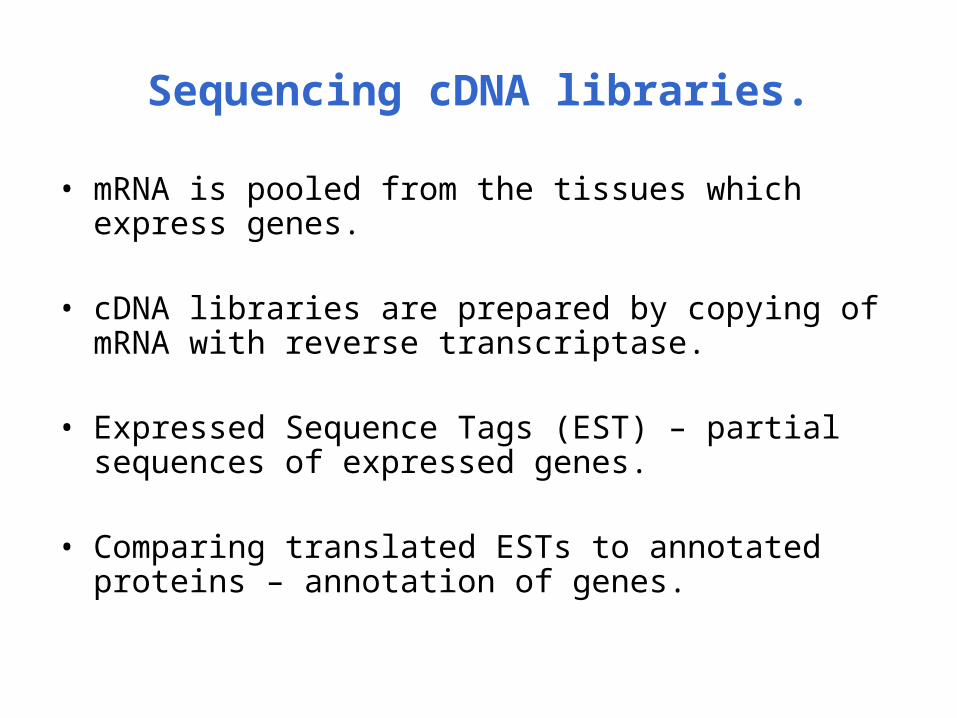
Sequencing cDNA libraries.
• mRNA is pooled from the tissues which express genes.
• cDNA libraries are prepared by copying of mRNA with reverse transcriptase.
• Expressed Sequence Tags (EST) – partial sequences of expressed genes.
• Comparing translated ESTs to annotated proteins – annotation of genes.

Gene prediction.
Gene – DNA sequence encoding protein, rRNA, tRNA …
Gene concept is complicated:- Introns/exons- Alternative splicing- Genes-in-genes- Multisubunit proteins

Gene structure.
ATG TER
-35 -10
Promoter sequences
ATG – start codon; TER (TAA, TAG,TGA) – termination codons
Gene

Codon usage tables.- Each amino acid can be encoded by several codons.
- Each organism has characteristic pattern of codon usage.
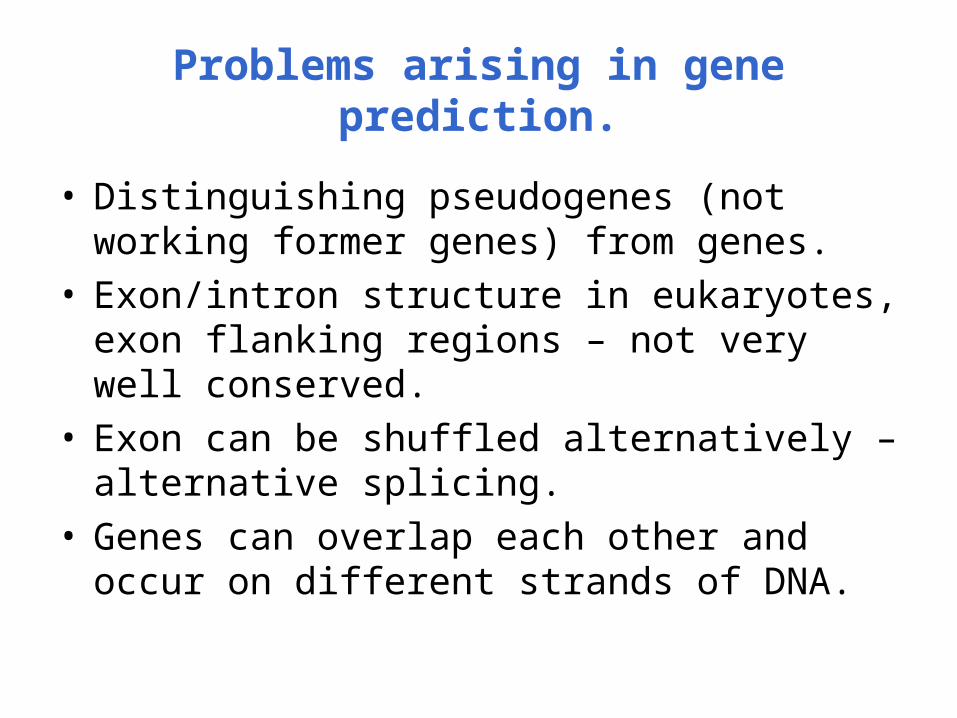
Problems arising in gene prediction.
• Distinguishing pseudogenes (not working former genes) from genes.
• Exon/intron structure in eukaryotes, exon flanking regions – not very well conserved.
• Exon can be shuffled alternatively – alternative splicing.
• Genes can overlap each other and occur on different strands of DNA.
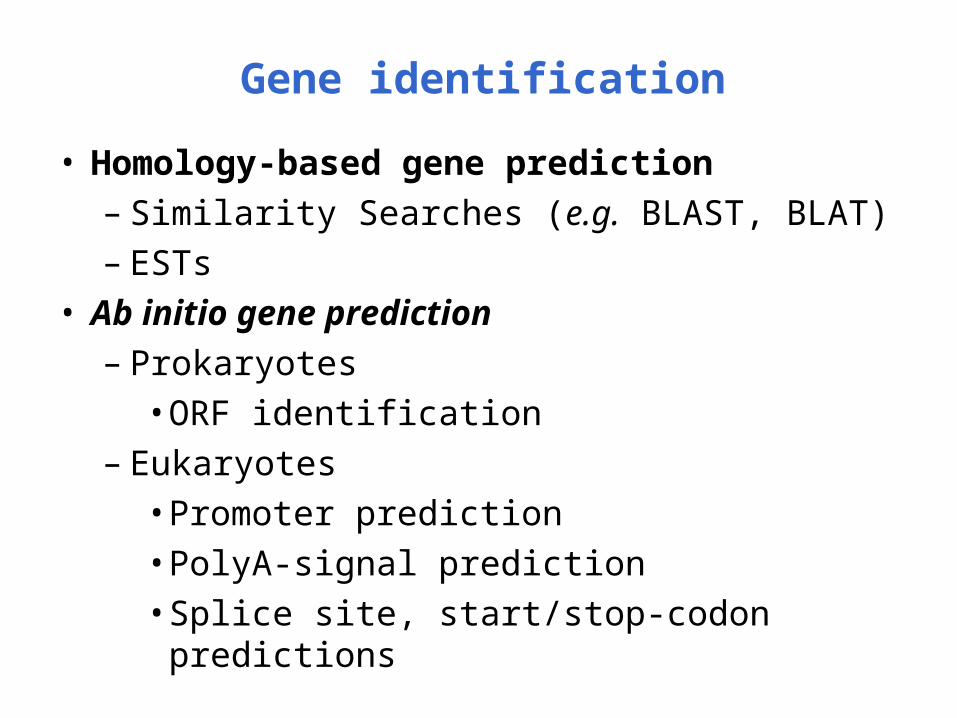
• Homology-based gene prediction– Similarity Searches (e.g. BLAST, BLAT)– ESTs
• Ab initio gene prediction– Prokaryotes
• ORF identification– Eukaryotes
• Promoter prediction• PolyA-signal prediction• Splice site, start/stop-codon predictions
Gene identification

Ab initio gene prediction.Predictions are based on the observation that gene DNA
sequence is not random:
- Gene-coding sequence has start and stop codons.- Each species has a characteristic pattern of synonymous
codon usage.- Non-coding ORFs are very short.- Gene would correspond to the longest ORF.
These methods look for the characteristic features of genes and score them high.

Prokaryotic genes – searching for ORFs.
- Small genomes have high gene density
Haemophilus influenza – 85% genic - No introns- Operons
One transcript, many genes
- Open reading frames (ORF) – contiguous set of codons, start with Met-codon, ends with
stop codon.

Example of ORFs.
There are six possible ORFs in each sequence for both directions of transcription.

Gene preference score – important indicator of coding region.
Observation: frequencies of codons and codon pairs in coding and non-coding regions are different.
Given a sequence of codons:
and assuming independence, the probability of finding coding region:
The probability of finding sequence “C” in non-coding regions:
The gene preference score:
))(
)(log(
0 CP
CPGPS

Classwork I.
Calculate the gene preference score for the following human DNA sequence:
AGTACA

Ab initio gene prediction methods.
• Grail II – predicts exons, promoters, Poly(A) sites. Neural network plus dynamic programming.
• GeneParser – predicts the most likely combination of exons/introns. Dynamic programming.
• GeneMark – mostly for prokaryotes, Hidden Markov Models.
• GeneScan – Fourier transform of DNA sequence to find characteristic patterns.
Confirming gene location using EST libraries.
• Expressed Sequence Tags (ESTs) – sequenced short segments of cDNA. They are organized in the database “UniGene”.
• If region matches ESTs with high statistical significance, then it is a gene or pseudogene.

Gene prediction accuracy.
True positives (TP) – nucleotides, which are correctly predicted to be within the gene.
Actual positives (AP) – nucleotides, which are located within the actual gene.
Predicted positives (PP) – nucleotides, which are predicted in the gene.
Sensitivity = TP / AP
Specificity = TP / PP

Gene prediction accuracy.GenScan Website

Common difficulties
• First and last exons difficult to annotate because they contain UTRs.
• Smaller genes are not statistically significant so they are thrown out.
• Algorithms are trained with sequences from known genes which biases them against genes about which nothing is known.

Gene prediction: classwork II.
• Go to http://www.ncbi.nlm.nih.gov/mapview/ and view all hemoglobin genes of H. sapiens
• Find 6 hemoglobin genes on chromosome 11, view the DNA sequence of this chromosome region
• Submit this sequence to GenScan server at
http://genes.mit.edu/GENSCAN.html

Genome analysis.
Genome – the sum of genes and intergenic sequences of haploid cell.

The value of genome sequences lies in their annotation
• Annotation – Characterizing genomic features using computational and experimental methods
• Genes: levels of annotation– Gene Prediction – Where are genes?– What do they encode?– What proteins/pathways involved in?

From Koonin & Galperin

Accuracy of genome annotation.
• In most genomes functional predictions has been made for majority of genes 54-79%.
• The source of errors in annotation:
- overprediction (those hits which are statistically significant in the database search are not checked)
- multidomain protein (found the similarity to only one domain, although the annotation is extended to the whole protein).
The error of the genome annotation can be as big as 25%.
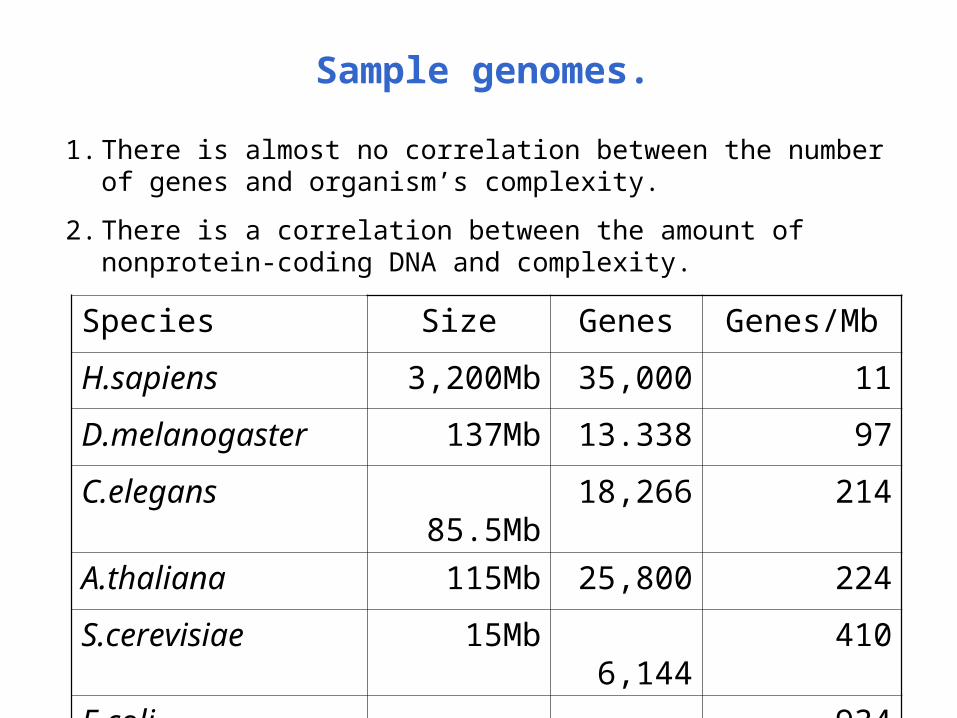
Sample genomes.
Species Size Genes Genes/Mb
H.sapiens 3,200Mb 35,000 11
D.melanogaster 137Mb 13.338 97
C.elegans 85.5Mb 18,266 214
A.thaliana 115Mb 25,800 224
S.cerevisiae 15Mb 6,144 410
E.coli 4.6Mb 4,300 934
1. There is almost no correlation between the number of genes and organism’s complexity.
2. There is a correlation between the amount of nonprotein-coding DNA and complexity.

Human Genome project.

Comparative genomics - comparison of gene number, gene content and gene location in
genomes..
Campbell & Heyer “Genomics”
Analysis of gene order (synteny).
Genes with a related function are frequently clustered on the chromosome.
Ex: E.coli genes responsible for synthesis of Trp are clustered and order is conserved between different bacterial species.
Operon: set of genes transcribed simultaneously with the same direction of transcription

Analysis of gene order (synteny).
Koonin & Galperin “Sequence, Evolution, Function”

Analysis of gene order (synteny).
• The order of genes is not very well conserved if %identity between prokaryotic genomes is < 50%
• The gene neighborhood can be conserved so that the all neighboring genes belong to the same functional class.
• Functional prediction based on gene neighboring.

Classwork III: Comparing microbial genomes.
• Go to http://www.ncbi.nlm.nih.gov/genomes/lproks.cgi
• Select Thermus thermophilus genome• View TaxTable• What gene clusters do you see which are
common with Archaea?