Embed Size (px)
Citation preview

October 2018
DNB Bank
DNB Boligkreditt
Best Euro Deal 2018

2
Content
• DNB – A Brief Overview
• The Norwegian Economy
• Financial Targets, Performance and Capital
• Loan Book and Asset quality
• Funding
• Appendix: • Cover Pool Portfolio Information and LCR eligibility • Digitalization / Vipps • The Norwegian Mortgage Market • Capital and Tier 1 • Additional slides – Financial Performance and Other information • CRO Presentation Capital Markets Day 2017

3
DNB – A Brief Overview
4
DNB - Norway’s Leading Financial Services Group
• Approximately 30 % market share in Norway
• 34 % owned by the Norwegian Government
• Credit Ratings: • Moody's: Aa2 (negative)
• S&P: A+ (positive)
• Sustainability Ratings:
• Sustainalytics: Ranked #3 of 344 financial institutions (Rating 87/100, 96/100 on Environment)
5
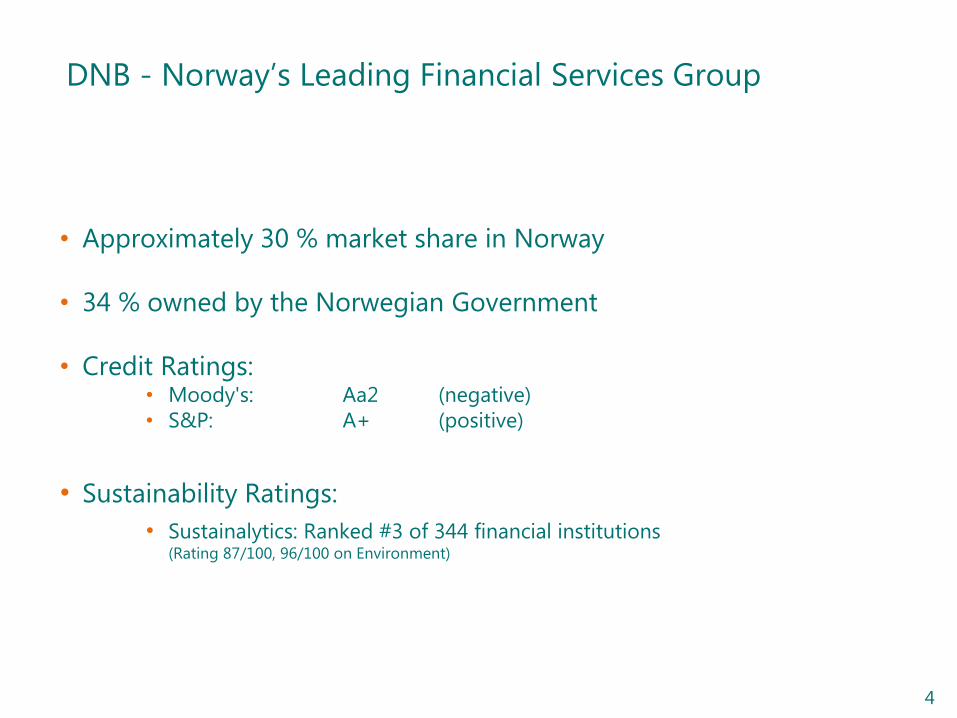
The DNB Group
100% owned by DNB Bank and functionally an integrated part of the parent
Mortgages originated within DNB Bank’s distribution network in accordance with the bank's credit policy
DNB Bank ASA
Aa2 / A+
(Senior/ short term issuance)
DNB Life and
Asset Management
DNB ASA
DNB
Boligkreditt AS
(Covered Bonds: AAA / Aaa)

6
The Norwegian Economy
7
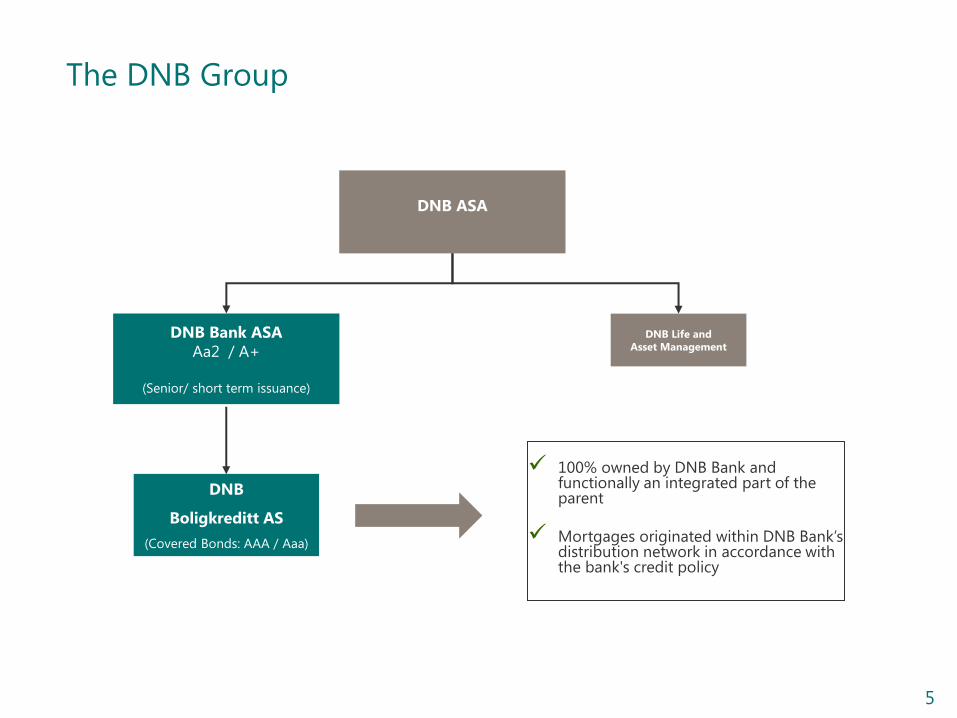
A Solid Norwegian Economy
Source: 1) OECD Economic Outlook No. 102, November 2017
2) Ministry of Finance (National Budget 2018)
3) DNB Markets, Aug 2018
2016 2017 2018
Budget surplus 1) 4.0 % 5.4 % 5.8 %
Oil fund 2) ~ EUR 769 bn ~ EUR 809 bn ~ EUR 843 bn
Unemployment 3) 4.7 % 4.2 % 3.7 %
GDP growth 3) + 1.0 % + 1.9 % + 2.3 %
Central Bank Rate 3) 0.5 % 0.5 % 0.75 %

8
Government Finances are Rock-Solid
Annual budget deficit/surplus forecast for 20181) General government net financial liabilities1)
As per cent of nominal GDP 2018
1) Source: OECD Economic Outlook No. 102, November 2017
-300
-250
-200
-150
-100
-50
0
50
100
150
200

9
0
100
200
300
400
500
600
2006 2008 2010 2012 2014 2016
Annual return, GPFG
Annual net petro cash flow
Annual actual "spending of oil-money"
Government Pension Fund Global 2001 – 2017, NOK billion
Oil income versus spending 2006 – 2017, NOK billion
0
1000
2000
3000
4000
5000
6000
7000
8000
9000
2001 2003 2005 2007 2009 2011 2013 2015 2017
Source: Ministry of Finance (National Budget 2017), DNB Markets, NBIM
The Growth of the Sovereign Wealth Fund Adds Flexibility
10
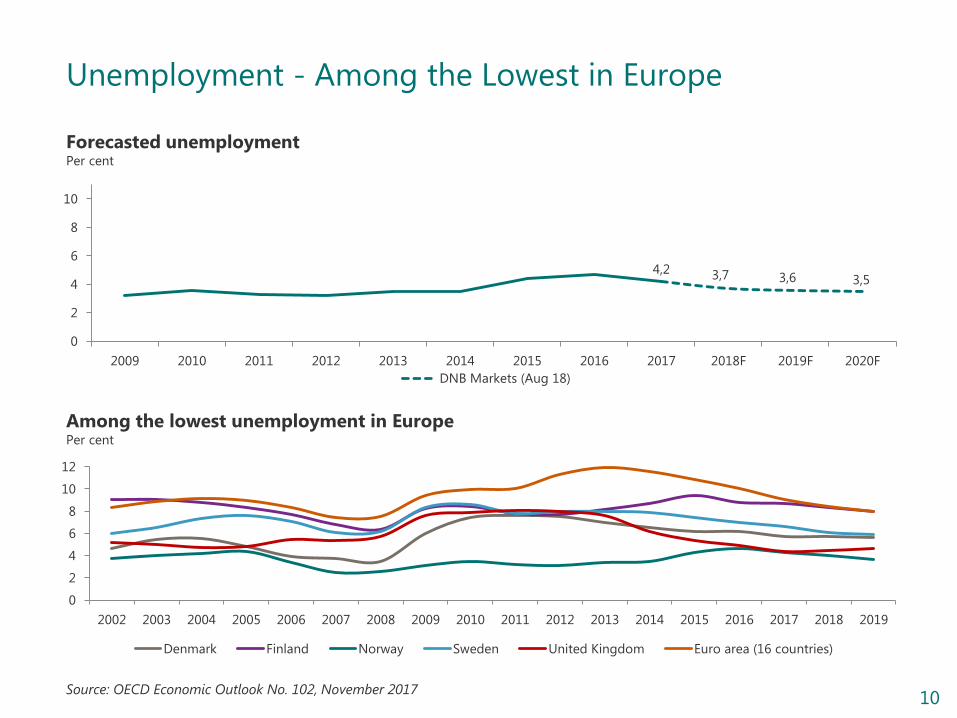
Forecasted unemployment Per cent
4,2 3,7 3,6 3,5
0
2
4
6
8
10
2009 2010 2011 2012 2013 2014 2015 2016 2017 2018F 2019F 2020F
DNB Markets (Aug 18)
Among the lowest unemployment in Europe Per cent
Source: OECD Economic Outlook No. 102, November 2017
Unemployment - Among the Lowest in Europe
0
2
4
6
8
10
12
2002 2003 2004 2005 2006 2007 2008 2009 2010 2011 2012 2013 2014 2015 2016 2017 2018 2019
Denmark Finland Norway Sweden United Kingdom Euro area (16 countries)

11
Economic Growth in Norway is Picking up Again
1,9 % 1,9 %
3,7 %
2,3 % 2,2 %
1,4 % 1,0 %
1,9 % 2,3 %
2,0 % 2,1 %
2,4 % 2,3 % 2,3 %
-1%
0%
1%
2%
3%
4%
5%
6%
2010 2011 2012 2013 2014 2015 2016 2017 2018e 2019e 2020e
DNB Markets (Aug 18) Statistics Norway (Mar 18)
GDP growth Year on year, per cent
GDP growth Per cent
Source: DNB Markets, Economic Outlook August 2018
-2%
-1%
0%
1%
2%
3%
4%
5%
2013 2014 2015 2016 2017 2018 2019 2020
Norway
Sweden
Denmark
Finland
Euro Area

12
0
1
2
3
4
5
6
7
8
9
10
0
50
100
150
200
250
1990
1992
1994
1996
1998
2000
2002
2004
2006
2008
2010
2012
2014
2016
2018
2020
Constant 2015 prices (lha) Share of GDP (rha)
Oil Investments are Stabilising at a High Level – Lower break-even price ensures a competitive continental shelf
Source: Thomson Datastream, DNB Markets Source: Rystad Energy, Statoil, Wall Street Journal
Break-even price: Sanctioned vs April 2017 USD per barrel, Brent Blend
Petroleum investments in Norway NOK billion, share of GDP in per cent
March 2016 September 2016 Sanctioned
Johan Sverdrup Johan Castberg
80
38
52
35
45
3035
25
April 2017

13
Financial Targets, Performance and Capital
14
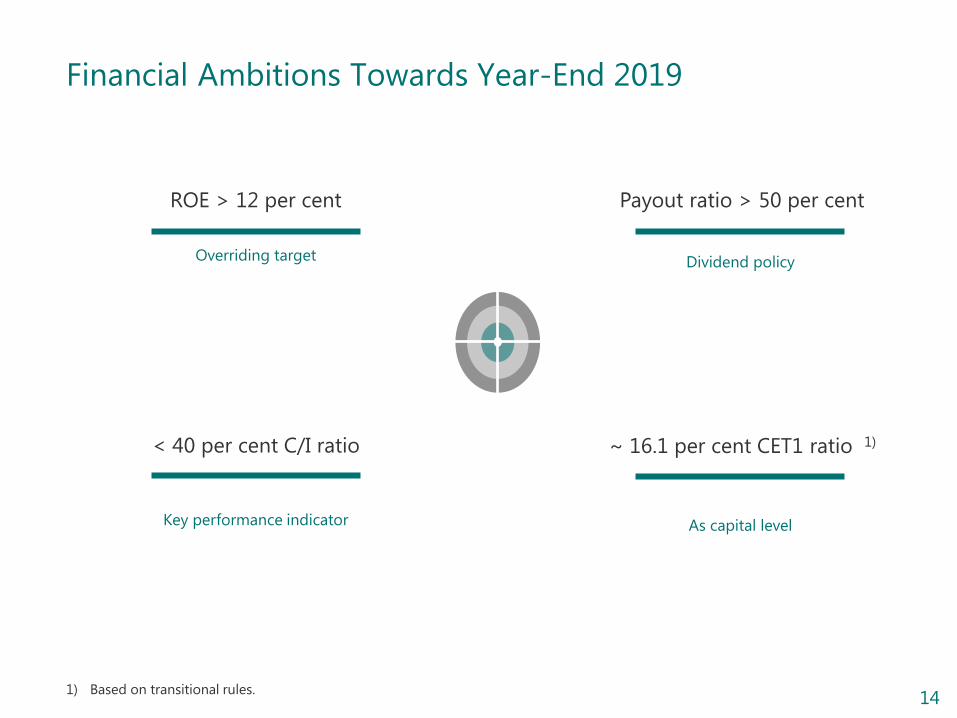
Financial Ambitions Towards Year-End 2019
~ 16.1 per cent CET1 ratio 1)
Key performance indicator As capital level
ROE > 12 per cent
Overriding target
< 40 per cent C/I ratio
Dividend policy
Payout ratio > 50 per cent
1) Based on transitional rules.
15
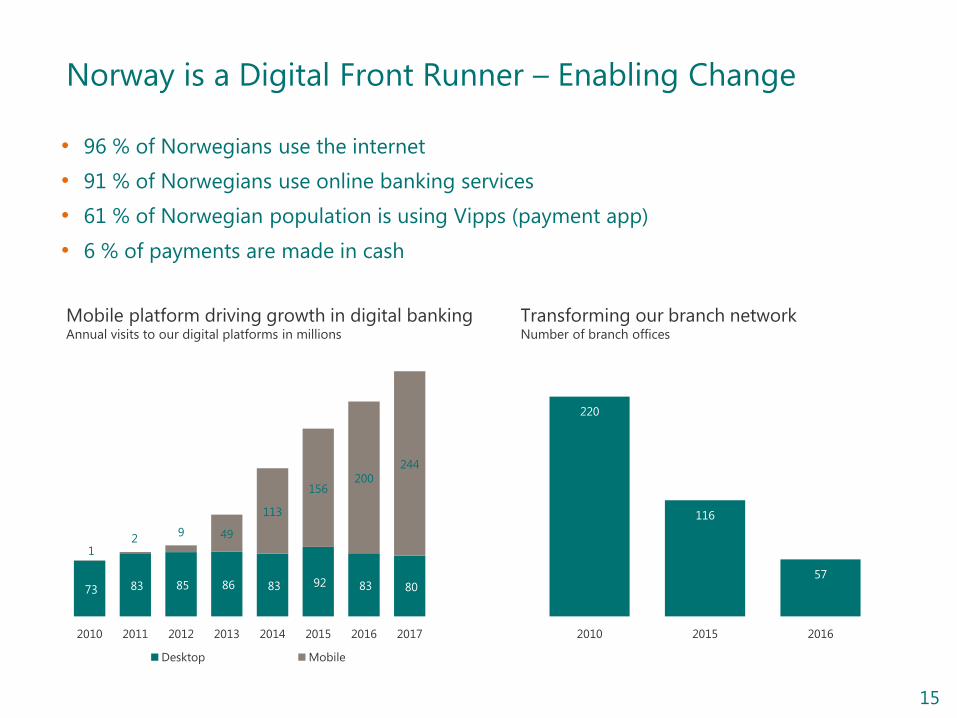
Norway is a Digital Front Runner – Enabling Change
73 83 85 86 83 92 83 80
1 2
9 49
113
156 200
244
2010 2011 2012 2013 2014 2015 2016 2017
Desktop Mobile
Mobile platform driving growth in digital banking Annual visits to our digital platforms in millions
220
116
57
2010 2015 2016
Transforming our branch network Number of branch offices
• 96 % of Norwegians use the internet
• 91 % of Norwegians use online banking services
• 61 % of Norwegian population is using Vipps (payment app)
• 6 % of payments are made in cash

16
DNB Delivers Solid Profit
18,7
28,7
34,1
30,8
28,5
13,8
7,7
1,6 2,3
7,4
2,4
(0,4)
(5)
0
5
10
15
20
25
30
35
2007 2008 2009 2010 2011 2012 2013 2014 2015 2016 2017 H1 18
Pre-tax operating profit before impairment Impairment of loans
Pre-tax operating profit before impairment NOK billion
17
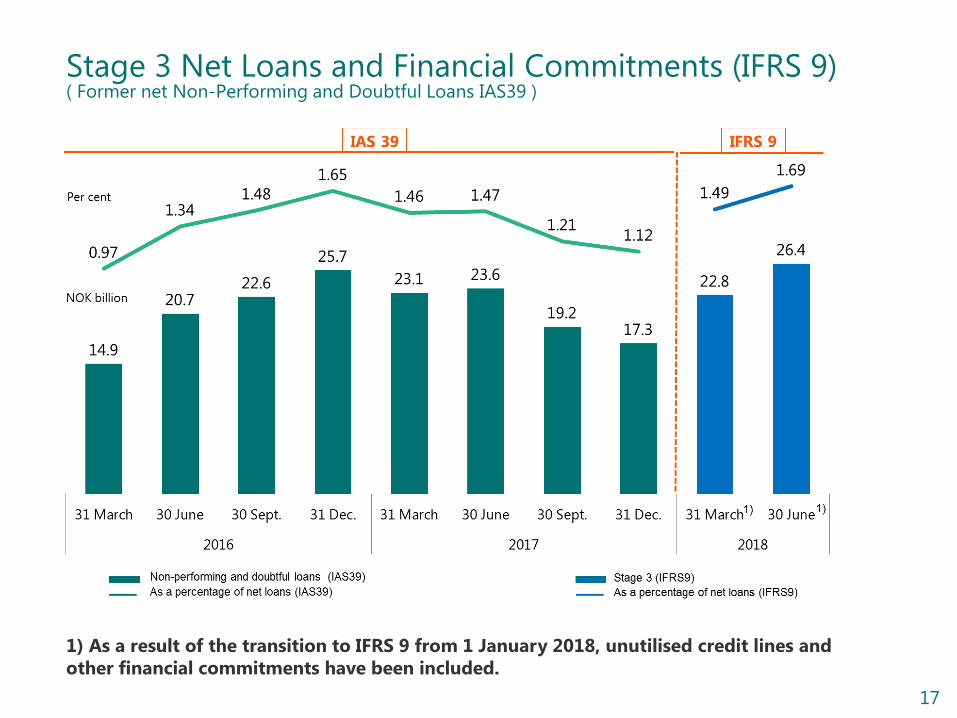
Stage 3 Net Loans and Financial Commitments (IFRS 9) ( Former net Non-Performing and Doubtful Loans IAS39 )
1) As a result of the transition to IFRS 9 from 1 January 2018, unutilised credit lines and
other financial commitments have been included.

18
Key Financial Ratios
H1 18 2017 2016 2015 2014
Return on equity (%) 11.4 10.8 10.1 14.5 13.8
Cost income (%) 43.2 44.2 40.9 36.9 41.9
Comb. weighted total average spread
(%) 1.30 1.30 1.32 1.33 1.31
Write down ratio (%) -0.05 0.15 0.48 0.15 0.12
Common equity tier 1 ratio (%) 16.2 16.4 16.0 14.4 12.7
Total capital ratio (%) 20.2 20.0 19.5 17.8 15.2

19
DNB – A Very Strong Capital Position DNB CET1 Capital Build-Up
CET1 capital ratio – transitional rules
Per cent
8,5 9,2 9,4
10,7
11,8
12,7
14,4
16,0 16,4 16,2
2009 10 11 12 13 14 15 16 17 30.06.18
Equity development NOK bn
118 127
142
159
190
206 217
211

20
6.8
5.0 4.7
4.5 4.2 4.3
DNB Nordea SEB Swedbank SHB Danske Bank
DNB – A Very Strong Capital Position Leverage Ratio and RAC-ratios – DNB versus Nordic Peers
Leverage ratio Per cent, as of 30 June 2018
DNB’s leverage ratio requirement 1)
1) The Norwegian leverage ratio requirement for banks is 5 per cent effective as from 30 June 2017. For systemically important banks, such as DNB,
the minimum requirement is 6 per cent. A potential breach of the leverage ratio requirement will not trigger automatic restrictions on AT1 coupon
payments.
6.0
S&P Risk Adjusted Capital Ratios
(RAC Ratios) Per Cent, 31 Dec 2017
13,5
12,6
11,9
11,4
10,3
9,8
21
138
101 92
175 160
44
32
40 55
65 89
144
170
141 147
240 249
188
2012 2013 2014 2015 2016 2017
Dividends and Buy-backs
CET1 build up
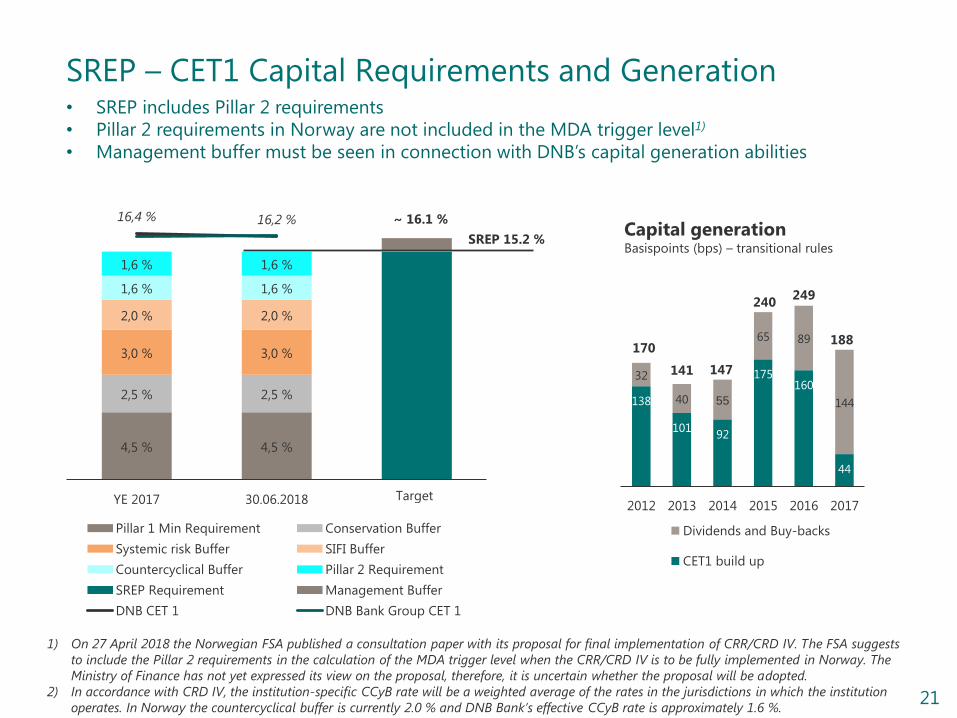
4,5 % 4,5 %
2,5 % 2,5 %
3,0 % 3,0 %
2,0 % 2,0 %
1,6 % 1,6 %
1,6 % 1,6 %
16,4 % 16,2 %
YE 2017 30.06.2018
Pillar 1 Min Requirement Conservation Buffer
Systemic risk Buffer SIFI Buffer
Countercyclical Buffer Pillar 2 Requirement
SREP Requirement Management Buffer
DNB CET 1 DNB Bank Group CET 1
Target
SREP – CET1 Capital Requirements and Generation
1) On 27 April 2018 the Norwegian FSA published a consultation paper with its proposal for final implementation of CRR/CRD IV. The FSA suggests
to include the Pillar 2 requirements in the calculation of the MDA trigger level when the CRR/CRD IV is to be fully implemented in Norway. The
Ministry of Finance has not yet expressed its view on the proposal, therefore, it is uncertain whether the proposal will be adopted.
2) In accordance with CRD IV, the institution-specific CCyB rate will be a weighted average of the rates in the jurisdictions in which the institution
operates. In Norway the countercyclical buffer is currently 2.0 % and DNB Bank’s effective CCyB rate is approximately 1.6 %.
SREP 15.2 %
~ 16.1 %
• SREP includes Pillar 2 requirements
• Pillar 2 requirements in Norway are not included in the MDA trigger level1)
• Management buffer must be seen in connection with DNB’s capital generation abilities
Capital generation Basispoints (bps) – transitional rules

22
MREL – proposal from NFSA 29 June 2018
• Proposed legislation
• Loss absorption requirement to be covered by existing own funds requirement
• Recapitalization requirement to be covered by a any excess capital and tier 3 capital contractually
subordinated to senior debt.
• Timeframe
• It is still uncertain when MREL requirements for Norwegian banks will enter into force.
• Subordination requirement must be fulfilled before 31 December 2022.
• Expected requirement
• The full implications of the proposals still has to be clarified.
• The final MREL requirement will be set on an individual basis.
• DNB’s preliminary calculations indicate a need for approximately NOK 150 billion (~EUR 16 billion) of tier 3
capital.
• Outstanding senior debt as of 1Q18 is approximately NOK 150 billion of which NOK 135 billion will redeem
before 31 December 2022.
• Outstanding senior debt with remaining maturity of more than one year, will count as eligible liabilities in the
transitional period.
• Preliminary conclusion
• During the transitional period until 31 December 2022, DNB will gradually replace maturing senior debt with
tier 3/ senior non-preferred debt.

23
IFRS 9 / Basel IV - DNB is well positioned for future regulatory requirements
• IFRS 9
• IFRS 9 was implemented from 1 January 2018 and reduced the common equity Tier 1 capital ratio by
approximately 28 basis points in Q12018 as a one off effect.
• IFRS 9 is now fully implemented, hence, DNB will not apply for transitional rules.
• Basel IV
• DNB is well positioned due to already high risk weights.
• The implementation of Basel IV is expected to have minimal effects for DNB.

24
MDA – DNB above CET 1 MDA Trigger Level • Pillar 2 requirements in Norway are currently not included in the MDA trigger level
• FSA has proposed to include Pillar 2 in MDA trigger level, but no final decision is taken1)
• MDA buffer must be seen in connection with DNB’s capital generation abilities
1) On 27 April 2018 the Norwegian FSA published a consultation paper with its proposal for final implementation of CRR/CRD IV. The FSA suggests
to include the Pillar 2 requirements in the calculation of the MDA trigger level when the CRR/CRD IV is to be fully implemented in Norway. The
Ministry of Finance has not yet expressed its view on the proposal, therefore, it is uncertain whether the proposal will be adopted.
2) In accordance with CRD IV, the institution-specific CCyB rate will be a weighted average of the rates in the jurisdictions in which the institution
operates. In Norway the countercyclical buffer is currently 2.0 % and DNB Bank’s effective CCyB rate is approximately 1.6 %.
13,2 % 13,6 % 13,6 %
16,0 % 16,4 % 16,2 %
YE 2016 YE 2017 30.06.2018
MDA Trigger Level DNB CET 1 DNB Bank Group CET1
138
101 92
175 160
44
32
40 55
65 89
144
170
141 147
240 249
188
2012 2013 2014 2015 2016 2017
Dividends and Buy-backs
CET1 build up
Capital generation Basispoints (bps) – transitional rules

25
DNB: Significantly Higher RW Density than Nordic Peers
Risk Weighted Assets Per cent of total assets, 30 June 2018
Core Equity Tier 1 30 June 2018
16,2
10,6 12,1
11,0 10,5 9,0
19,3 19,9
15,9
23,6 21,4
DNB SEB Nordea Danske Swedbank SHB
CET1 ratio transitional rules CET1 ratio Basel III
38,9 %
21,2 % 21,1 % 21,3 % 16,6 % 18,4 %
DNB SEB Nordea Danske Swedbank SHB
* Transitional rules for other banks as of 31 December 2017

26
Loan Book and Asset Quality
27
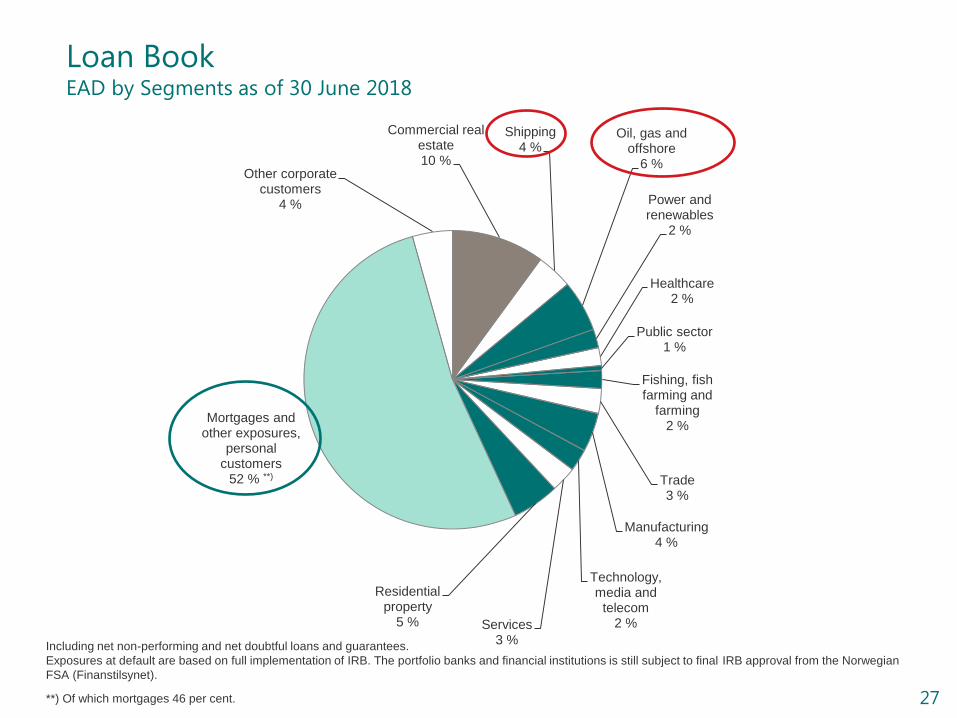
Commercial real estate 10 %
Shipping 4 %
Oil, gas and offshore
6 %
Power and renewables
2 %
Healthcare 2 %
Public sector 1 %
Fishing, fish farming and
farming 2 %
Trade 3 %
Manufacturing 4 %
Technology, media and
telecom 2 % Services
3 %
Residential property
5 %
Mortgages and other exposures,
personal customers
52 % **)
Other corporate customers
4 %
Loan Book EAD by Segments as of 30 June 2018
Including net non-performing and net doubtful loans and guarantees.
Exposures at default are based on full implementation of IRB. The portfolio banks and financial institutions is still subject to final IRB approval from the Norwegian
FSA (Finanstilsynet).
**) Of which mortgages 46 per cent.

28
Aiming to Reduce Volatility and Increase Profitability Through Rebalancing of the Portfolio
Reducing Exposure in Cyclical Industries USD billion
Rebalancing Between Large Corporates
and Personal Customers
21
9
2012 2Q18
Shipping
20
13
2014 2Q18
Oil, gas and offshore
46% 54%
Mortgages and other exposures, personal customers
Corporate loans
52% 48%
2Q 2015 2Q 2018

29
2%
7%
Currentmortgage rate
Mortgage rateincluding stress
test
Mortgage Lending in DNB is Based on Cash Flow
5
%
Willingness to repay the loan
Credit history
Capability of repaying the loan Including 5 per cent interest rate stress
Amortization requirement above 60 % LTV
Max 5x gross income
Collateral LTV max 85 %
Monthly behavior scoring of
borrowers
1.
2.
3.
4.

30
House Prices Fundamental Factors Explaining the Past House Price Increase
Norwegian House Prices
Source: Real Estate Norway, Statistics Norway
Completed housings less
growth in households
Source: Norges Bank, Statistics Norway
Nominal House Prices 2000-2018
Source: Eiendomsverdi AS
(member of the European AVM Alliance)
0
100
200
300
400
500
600
700
800
1985
1988
1991
1994
1997
2000
2003
2006
2009
2012
2015
Nominal prices
CPI-deflated prices
Income per capita-deflated prices
50,00
100,00
150,00
200,00
250,00
300,00
350,00
2000
2002
2004
2006
2008
2010
2012
2014
2016
2018
Norway UK
Sweden Denmark
USA
-18 000
-16 000
-14 000
-12 000
-10 000
-8 000
-6 000
-4 000
-2 000
0
2 000
4 000
2006
2007
2008
2009
2010
2011
2012
2013
2014
2015
2016

31
• Prices are now 5,13 % higher than at the start of 2018 and 2,7 % higher than 12 months ago.
• DNB expects relative flat development in house prices going forward.
House Price Development in Norway and Oslo 1)
House Price Growth As of September 2018 All-time-high = April -17/Mai -18 for Norway,
Feb 2017 for Oslo
Source: Eiendomsverdi AS
(member of the European AVM Alliance)
75
100
125
150
175
200
2007
2008
2009
2010
2011
2012
2013
2014
2015
2016
2017
2018
Norway Oslo
Source: Eiendomsverdi AS
(member of the European AVM Alliance)
House Price Growth 1 Jan 2007 = Index 100
1) The methodology for house price data was revised in January 2018, hence there are some differences in data points from previous versions of this presentation.
-1,3 %
-6,4 %
2,7 %
4,1 %
Since all-time-high Last 12 months
Norway Oslo

32
Mortgage Lending Regulation Tightened Regulation from January 2017 has Impacted House Price Growth
• Max 5x gross income
• Max 85 % LTV
• 60 % for secondary home in Oslo
• Debt servicing capacity
• 5 percentage points interest rate increase
• Amortization requirement above 60 % LTV
• 2.5 % of approved loan or principal payment as for 30 year annuity
• Banks have some flexibility
• Banks can deviate in 10 % of mortgage applications each quarter
• In Oslo this flexibility is limited to 8 % 75
100
125
150
175
200
2014
2015
2016
2017
2018
Norway Oslo
House Price Growth 1 Jan 2007 = Index 100
33
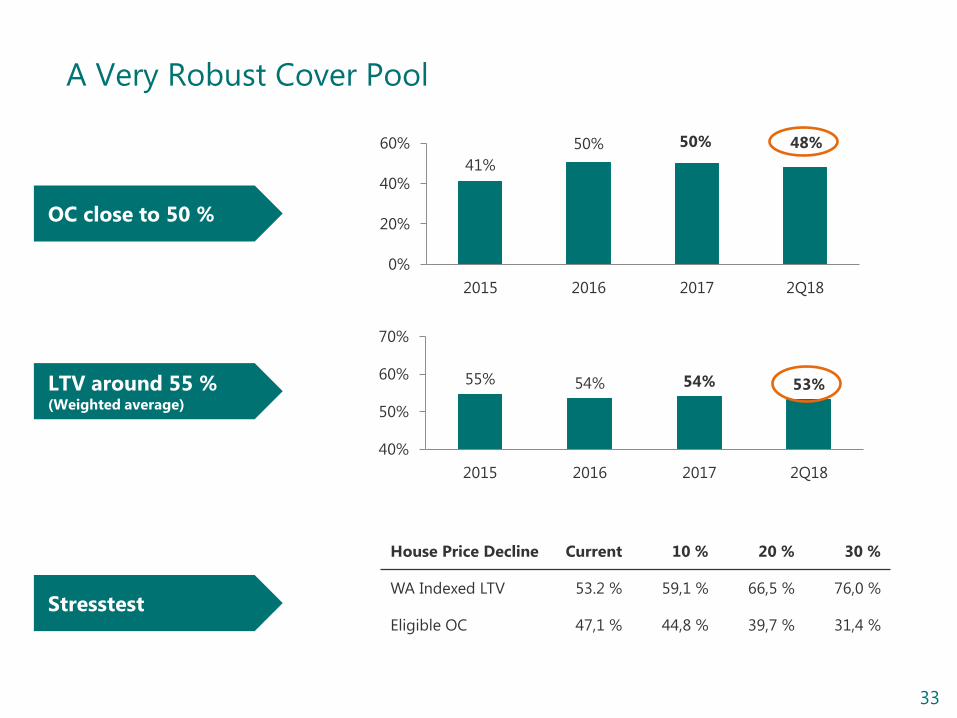
A Very Robust Cover Pool
House Price Decline Current 10 % 20 % 30 %
WA Indexed LTV 53.2 % 59,1 % 66,5 % 76,0 %
Eligible OC 47,1 % 44,8 % 39,7 % 31,4 %
41%
50% 50% 48%
0%
20%
40%
60%
2015 2016 2017 2Q18
OC close to 50 %
LTV around 55 % (Weighted average)
Stresstest
55% 54% 54% 53%
40%
50%
60%
70%
2015 2016 2017 2Q18

34
A Very Robust Residential Loan Portfolio
17%
34%
29%
15%
5%
0-40 40-60 60-75 75-85 >85
Loan-to-Value (LTV) Per Cent of Residential Mortgage Book, 30 June 2018
- Includes mortgages in DNB Bank and DNB Boligkreditt

35
Oil-Related Portfolio represents 5.6 % of Total Customer EaD
6 %
8 %
7 %
11 %
Total loan portfolio – EaD NOK 1 864 billion Per cent, as at 30 June
Oil-related portfolio – EAD NOK 104 billion 5.4 per cent of DNB’s total EaD as at 30 June 2018
3,6 %
1,9 %
2,6 % 1,0 %
1,9 %
• The oil-related portfolio has been reduced significantly
• Down from NOK 167.1bn (8.4 % of total EaD) in September 2015
Oil & Gas
Oilfield services
Offshore
36
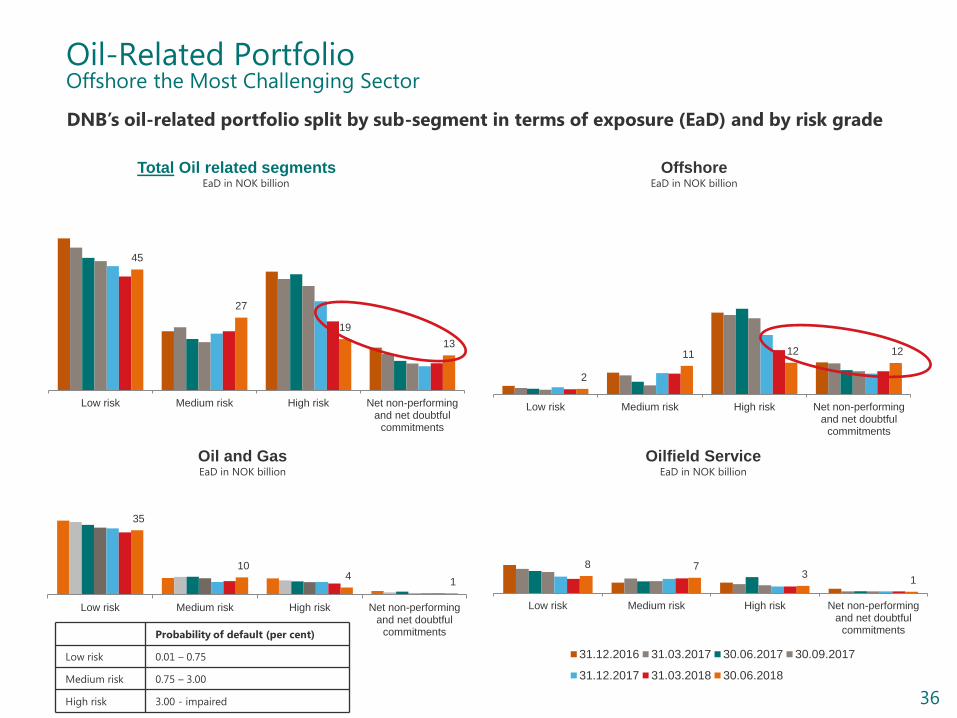
45
27
19
13
Low risk Medium risk High risk Net non-performingand net doubtful
commitments
2
11 12 12
Low risk Medium risk High risk Net non-performingand net doubtful
commitments
Oil-Related Portfolio Offshore the Most Challenging Sector DNB’s oil-related portfolio split by sub-segment in terms of exposure (EaD) and by risk grade
Total Oil related segments EaD in NOK billion
Offshore EaD in NOK billion
Oil and Gas EaD in NOK billion
Oilfield Service EaD in NOK billion
35
10 4
1
Low risk Medium risk High risk Net non-performingand net doubtful
commitments
8 7 3
1
Low risk Medium risk High risk Net non-performingand net doubtful
commitments
31.12.2016 31.03.2017 30.06.2017 30.09.2017
31.12.2017 31.03.2018 30.06.2018
Probability of default (per cent)
Low risk 0.01 – 0.75
Medium risk 0.75 – 3.00
High risk 3.00 - impaired

37
Offshore Exposure is 1,9 % of DNB’s Total Loan Portfolio
Total loan portfolio – EaD NOK 1 911 billion Per cent, as at 30 June 2018
1,9 %
0,9 %
0,6 %
0,3 %
Offshore exposure – EaD NOK 36 billion Per cent of DNB’s portfolio, as at 30 June 2018
Offshore Supply Vessels (OSV)
Other offshore
Rig

38
Shipping Exposure is 3.8 % of DNB’s Total Loan Portfolio The Shipping Portfolio is Well Diversified
6 %
8 %
7 %
11 %
Total loan portfolio – EaD NOK 1 911 billion Per cent, as at 30 June 2018
Shipping portfolio* – EaD NOK 73 billion Per cent of DNB’s total EAD, as at 30 June 2018
3.8 %
0,9 %
0,7 %
0,6 %
0,6 %
0,5 %
0,5 % Crude oil tankers
Dry bulk Gas
Container
Other shipping
Chemical and product tankers
* Excluding offshore portfolio. Offshore is included in oil-related portfolio.
• The shipping portfolio has been reduced significantly
• Down from NOK 138.1bn (6.9 % of total EAD) in September 2015

39
Risk Classification and Migration DNB’s Shipping Book - Excluding Offshore
Shipping* – EaD distribution by PD bracket NOK billion
13
46
11
2
Low risk Medium risk High risk Net non-performing and net doubtful
commitments
31.12.2016 31.03.2017 30.06.2017 30.09.2017 31.12.2017 31.03.2018 30.06.2018
* Numbers for the Shipping Offshore and Logistics Division excluding offshore
portfolio. Offshore is included in oil-related portfolio.

40
Previous Shipping Experience Provides Comfort
Accumulated shipping impairments, 2010-2014 Per cent of lending book
2.4
5.1
8.6
21.5
DNB (shipping) Nordic peer (shipping and offshore) Norwegian banks (shipping and pipe
transportation)*
European peer (Shipping)
*Aggregate numbers for Norwegian banks are from the 2009-2013 period (including DNB)
Source: DNB Markets, company reports. Presented at DNB CMD 2015.

41
Funding

42
DNB Funding Structure
79%
104%
2012 2013 2014 2015 2016 2017 2018
Net Stable Funding Ratio (NSFR)
2,4
4.3
2008 2010 2012 2014 2016 2018
Average Life of Long-term Funding
Senior debt and covered bonds, years
Ratio of Deposits to Net Loans
Per Cent
50 53
55 58
63 65 65
61 62 63 66
2008
2009
2010
2011
2012
2013
2014
2015
2016
2017
2018

43
DNB is a Well Established International Borrower With a Strong Focus on Diversification of Funding Sources
• DNB Bank
• EMTN program of EUR 45 billion
• Samurai Shelf (JPY) JPY 500 billion
• USD 144A program USD 10 billion
• USCP program of USD 18 billion
• Yankee CD program of USD 15 billion
• ECP/CD program of EUR 15 billion
• DNB Boligkreditt (Covered Bonds)
• Covered Bond program of EUR 60 billion
• Covered Bond program of USD 12 billion

44
2018 EURO bill Tenor
Covered Bonds 6,1 7,7
Senior Bonds 0,9 4,9
Sum 7,0 7,3
Tier 1 / Tier 2 1,0
Total 7,9
2017 EURO bill Tenor
Covered Bonds 7,5 8,0
Senior Bonds 1,6 3,0
Sum 9,1 7,1
Tier 1 / Tier 2 1,1
Total 10,2
2016 EURO bill Tenor
Covered Bonds 7,0 7,7
Senior Bonds 2,8 5,7
Sum 9,8 7,1
Tier 1 / Tier 2 0,9
Total 10,7
Issuance of Long Term Debt
45
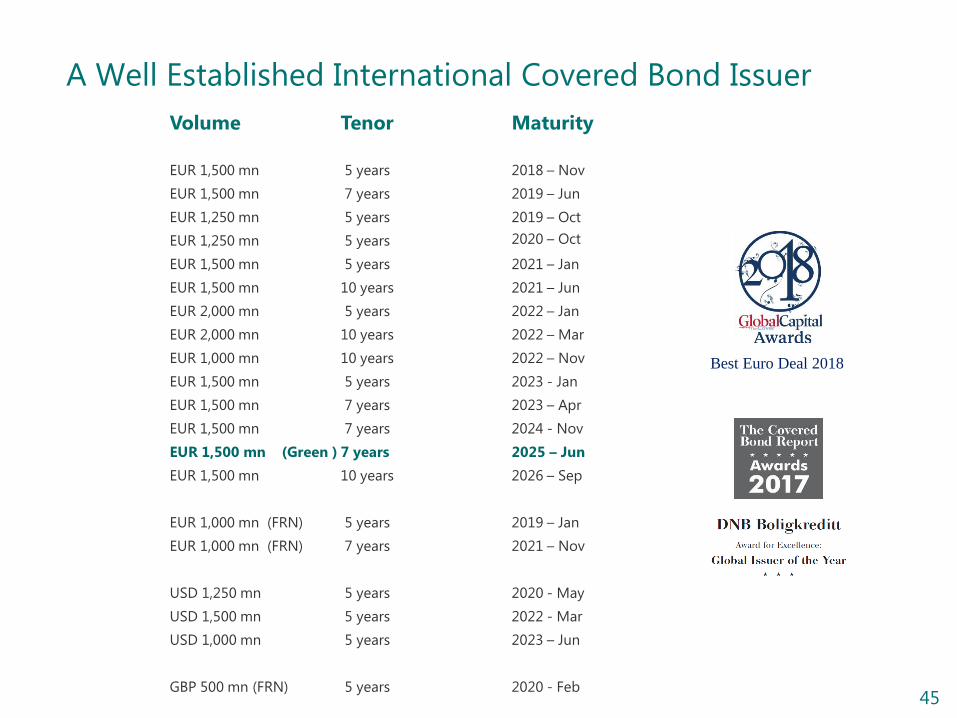
A Well Established International Covered Bond Issuer
Volume
Tenor
Maturity
EUR 1,500 mn 5 years 2018 – Nov
EUR 1,500 mn 7 years 2019 – Jun
EUR 1,250 mn 5 years 2019 – Oct
EUR 1,250 mn 5 years 2020 – Oct
EUR 1,500 mn 5 years 2021 – Jan
EUR 1,500 mn 10 years 2021 – Jun
EUR 2,000 mn 5 years 2022 – Jan
EUR 2,000 mn 10 years 2022 – Mar
EUR 1,000 mn 10 years 2022 – Nov
EUR 1,500 mn 5 years 2023 - Jan
EUR 1,500 mn 7 years 2023 – Apr
EUR 1,500 mn 7 years 2024 - Nov
EUR 1,500 mn (Green ) 7 years 2025 – Jun
EUR 1,500 mn 10 years 2026 – Sep
EUR 1,000 mn (FRN) 5 years 2019 – Jan
EUR 1,000 mn (FRN) 7 years 2021 – Nov
USD 1,250 mn 5 years 2020 - May
USD 1,500 mn 5 years 2022 - Mar
USD 1,000 mn 5 years 2023 – Jun
GBP 500 mn (FRN) 5 years 2020 - Feb
Best Euro Deal 2018

46
DNB Green Covered Bonds
• An aggregated portfolio approach has been used to manage the green assets
• Eligible green assets at all times exceeds all outstanding green liabilities
Eligibility criterion for DNB’s green covered bonds:
• Residential buildings completed in 2012 or later
• (derived from the implementation of the TEK10 and TEK17 building codes)
~NOK 55 bn eligible green assets
(within 15% of the most energy efficient residential buildings in Norway)
For further information, see
https://ir.dnb.no/funding-and-rating/green-covered-bonds

47
DNB Senior Curve
Volume
Tenor
Maturity
EUR 1,000 mn 10 years 2020 – Jun
EUR 2,000 mn 10 years 2021 – Feb
EUR 1,000 mn 10 years 2022 – Jan
EUR 750 mn 7 years 2023 – Mar
EUR 750 mn 5 years 2023 - Sep
EUR 1,000 mn (FRN) 5 years 2019 – Jan
EUR 1,000 mn (FRN) 5 years 2020 – Jan
EUR 650 mn (FRN) 5 years 2020 – Aug
USD 1,250 mn 3 years 2020 – Oct
USD 1,250 mn 5 years 2021 – Jun
USD 500 mn (FRN) 3 years 2020 – Oct
USD 250 mn (FRN) 5 years 2021 – Jun

48
Funding Contacts
Long Term Funding: Short Term Funding:
• Thor Tellefsen
Senior Vice President, Head of Long Term Funding
Phone direct: + 47 24 16 91 22
Mobile: + 47 915 44 385
E-mail: [email protected]
• Lars Ekeland
Senior Vice President, Long Term Funding
Phone direct: + 47 24 16 91 25
Mobile: + 47 916 07 053
E-mail: [email protected]
• Lene Bergwitz-Larsen
Senior Vice President, Long Term Funding
Phone direct: + 47 24 16 91 27
Mobile: + 47 402 20 140
E-mail [email protected]
• Åsmund Midttun
Senior Dealer, Rates, FICC
Phone direct: +47 24 16 90 28
Mobile: +47 901 13 559
E-mail: [email protected] / [email protected]
• Erik Brække
Senior Vice President, Rates, FICC
Phone direct: +47 24 16 90 31
Mobile: +47 930 47 504
E-mail: [email protected] / [email protected]
• Stephen Danna
First Vice President, FX/Rates/Commodities, New York
Phone direct: +1 212 681 2550
Mobile: +1 646 824 0072
E-mail: [email protected] / [email protected]
https://www.ir.dnb.no/funding-and-rating
49
Appendix
Appendix A:
Cover Pool Portfolio Information and LCR
Eligibility

50
Future Updates On Cover Pool Developments
DNB has implemented the common Harmonised Transparency Template of
the European Covered Bond Council which is available on the DNB website.
Information about the cover pool of DNB Boligkreditt may be accessed via
DNB’s web page:
https://www.ir.dnb.no/funding-and-rating/cover-pool-data
Contacts DNB Boligkreditt AS:
- Per Sagbakken, CEO: [email protected] +47 906 61 159
Portfolio information is updated when DNB quarterly results are released

51
Cover Pool
Data
DNB Boligkreditt Covered Bonds – Cover Pool Data
Rating (Moody’s/S&P) Aaa/AAA
Cover Pool Size (million) 622,778
No. of Mortgages in the Cover Pool 403,266
Average Loan Balance (thousands) 1,544
Regulatory Overcollateralisation Requirement 2.0 %
Overcollateralisation 48,0 %
Weighted Average LTV (Indexed) 53,2%
Pool statistics as of 31 March 2018. Cover pool reporting coincides with DNB quarterly financial reporting.
Stresstest
House Price Decline Current 10 % 20 % 30 %
WA Indexed LTV 53.2 % 59,1 % 66,5% 76,0 %
Eligible
Overcollateralisation 47,1 % 44,8 % 39,7 % 31,4 %
Cover Pool Sensitivity Analysis
52
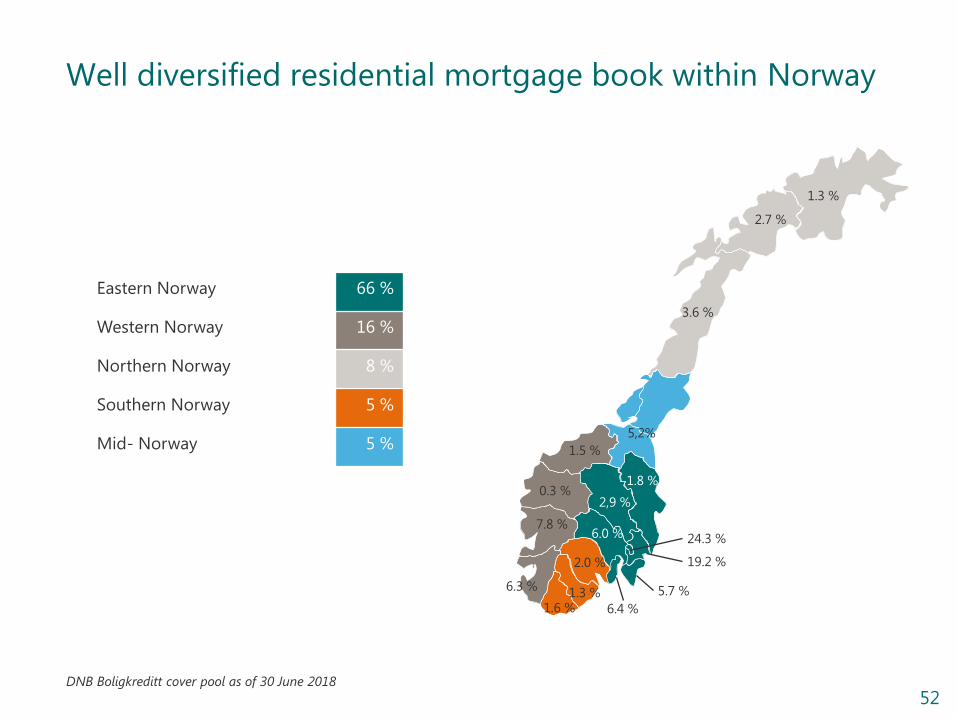
Well diversified residential mortgage book within Norway
DNB Boligkreditt cover pool as of 30 June 2018
Eastern Norway 66 %
Western Norway 16 %
Northern Norway 8 %
Southern Norway 5 %
Mid- Norway 5 %
1.3 %
2.7 %
3.6 %
5,2%
1.5 %
0.3 %
7.8 %
6.3 %
1.6 % 1.3 %
2.0 %
6.0 %
6.4 %
2,9 %
1.8 %
5.7 %
19.2 %
24.3 %

53
Portfolio Characteristics
Report date: 30.06.2018
Report currency: NOK
Key Characteristics Overcollateralisation
Total cover pool, nominal balance* (mill.) 622 778 Cover pool size:
Number of mortgages 403 266 Residential mortgages, loan balance (mill.) 622 778
Number of borrowers 343 919 Covered bonds outstanding (mill.) 420 685
Average loan balance (thousands) 1 544 Overcollateralisation 48,0 %
Outstanding covered bonds, nominal balance (mill.) 420 685
Substitute assets (% of total cover pool) 0,0
WA indexed LTV (%) 53,2
WAL of cover pool (contractual maturity in years) 12,7
WAL of outstanding covered bonds (extended maturity in years) 5,6
* All cover pool assets are denominated in NOK.
** Seasoning indicates the number of months since collateral for the loan was established.
Maturity Structure Cover Pool Maturity Structure Covered Bonds
Contractual maturity (years) Loan balance (mill.) % Extended maturity (years) Loan balance (mill.) %
≥ 0 ≤ 1 21 414 3,4 % ≥ 0 ≤ 1 3 725 0,9 %
1 ≤ 2 22 896 3,7 % 1 ≤ 2 45 560 10,8 %
2 ≤ 3 24 413 3,9 % 2 ≤ 3 55 214 13,1 %
3 ≤ 5 52 789 8,5 % 3 ≤ 5 151 473 36,0 %
5 ≤ 10 126 061 20,2 % 5 ≤ 10 130 042 30,9 %
> 10 375 204 60,2 % > 10 34 671 8,2 %
Total 622 778 100,0 % Total 420 685 100,0 %
Expected maturity (years) Loan balance (mill.) %
≥ 0 ≤ 1 44 637 10,6 %
1 ≤ 2 53 143 12,6 %
2 ≤ 3 76 791 18,3 %
3 ≤ 5 136 560 32,5 %
5 ≤ 10 75 558 18,0 %
> 10 33 997 8,1 %
Total 420 685 100,0 %

54
Portfolio Characteristics cont.
Loan Size Concentration Risk
Private individuals Loan balance (mill.) Number of loans %
≤ 1,000,000 74 272 169 596 10 largest exposures 0,2 %
> 1,000,000 ≤ 2,000,000 180 889 121 773 10 largest exposures excl. housing cooperatives 0,1 %
> 2,000,000 ≤ 3,000,000 157 064 64 365
> 3,000,000 ≤ 4,000,000 89 281 25 942 Property Types
> 4,000,000 ≤ 5,000,000 46 542 10 466 Loan balance (mill.) %
> 5,000,000 56 021 8 482 Residential 622 778 100,0 %
Total 604 070 400 624 Commercial 0 0,0 %
Other 0 0,0 %
Housing Cooperatives Loan balance (mill.) Number of loans Total 622 778 100,0 %
≤ 5,000,000 2 975 1 688
> 5,000,000 ≤ 10,000,000 3 038 426 o/w Housing Cooperatives / Multi-family assets 18 708 3,0 %
> 10,000,000 ≤ 20,000,000 4 494 325 o/w Forest & Agriculture 0 0,0 %
> 20,000,000 ≤ 50,000,000 5 199 166
> 50,000,000 ≤ 100,000,000 1 996 30 Occupancy Type
> 100,000,000 1 006 7 %
Total 18 708 2 642 Owner occupied 78,8%
Second homes / Holiday houses 0,3%
LTV buckets Buy to let / Non owner occupied houses 0,1%
Indexed LTV Loan balance (mill.) % Other 20,7%
≥ 0 ≤ 40 137 629 22,1 % Total 100,0%
40 ≤ 50 96 954 15,6 %
50 ≤ 60 142 550 22,9 % Repayment Type
60 ≤ 70 138 475 22,2 % %
70 ≤ 80 92 475 14,8 % Amortization 75,9 %
80 ≤ 90 9 251 1,5 % Interest only* 24,1 %
90 ≤ 100 2 908 0,5 % Total 100,0 %
>100 2 534 0,4 % *No principal payments for a limited period of time.
Total 622 778 100,0 %

55
Portfolio Characteristics cont. Seasoning Non Performing
% Non performing loans 0,12 %
Up to 12months 17,2 %
≥ 12 - ≤ 24 months 16,5 % Arrears
≥ 24 - ≤ 36 months 12,6 % ≥ 30 - < 60 days 0,09 %
≥ 36 - ≤ 60 months 17,3 % ≥ 60 - < 90 days 0,04 %
≥ 60 months 36,4 % ≥ 90 - < 180 days 0,04 %
Total 100,0 % ≥ 180 days 0,08 %
Interest Rate Type
Fixed Rate 6,1 %
Floating Rate 93,9 %
Geographical Distribution
Loan balance (mill.) % Eastern Norway: 66 %
Østfold 35 731 5,7 % Western Norway: 16 %
Akershus 119 860 19,2 % Northern Norway: 8 %
Oslo 151 400 24,3 % Southern Norway: 5 %
Hedmark 11 161 1,8 % Mid-Norway: 5 %
Oppland 17 917 2,9 %
Buskerud 37 602 6,0 %
Vestfold 39 909 6,4 %
Telemark 12 325 2,0 %
Aust-Agder 8 201 1,3 %
Vest-Agder 9 723 1,6 %
Rogaland 39 179 6,3 %
Hordaland 48 767 7,8 %
Sogn og Fjordane 1 562 0,3 %
Møre og Romsdal 9 609 1,5 %
Trøndelag 32 667 5,2 %
Nordland 22 443 3,6 %
Troms 16 821 2,7 %
Finmark 7 891 1,3 %
Svalbard 9 0,0 %
Total 622 778 100,0 %

56
Cover Pool Sensitivity Analysis and Overcollateralisation History
Cover Pool Overcollateralisation History
Latest overcollateralisation requirement for AAA/Aaa rating:
• S&P: 15.3 %
• Moody’s: 0 %
Stresstest - House price decline
House price decline Current 10 % 20 % 30 %
Total cover pool balance (nominal, NOKbn) 622 778 622 778 622 778 622 778
WA indexed LTV (%) 0,5 0,6 0,7 0,8
Eligible cover pool balance (nominal, NOKbn) 618 679 609 342 587 790 552 766
Total outstanding covered bonds (nominal, NOKbn) 420 685 420 685 420 685 420 685
Eligible overcollateralization 47,1 % 44,8 % 39,7 % 31,4 %

57
Non Performing Loans in DNB Boligkreditt AS 90+ days in arrears
0,00%
0,05%
0,10%
0,15%
0,20%
0,25%
0,30%
0,35%
0,40%
90+ days arrears
12 bp

58
Green Bond Allocation Report June 2018

59
Covered Bonds Issued by DNB Boligkreditt AS Qualifies for Level 1-Assets Pursuant to LCR-regulation (Slide 1 of 2)
Covered bonds issued by DNB Boligkreditt AS fulfil the requirements to qualify as
Level 1-assets pursuant to Commission Delegated Regulation (EU) 2015/61
regarding liquidity coverage requirement for credit institutions (“LCR-regulation”).
With reference to Article 10(1)(f) of the LCR-regulation, DNB Boligkreditt AS
confirms the following:
• Covered bonds issued by DNB Boligkreditt AS meet the requirements to be
eligible for the treatment set out in Article 129(4) of Regulation (EU) No
575/2013 (“CRR”) and the requirements referred to in Article 52(4) of Directive
2009/65/EC, cf. the European Commission’s website:
http://ec.europa.eu/finance/investment/legal_texts/index_en.htm
• The exposures to institutions in the cover pool meet the conditions laid down
in Article 129(1)(c) and in Article 129(1) last subparagraph of CRR

60
Covered Bonds Issued by DNB Boligkreditt AS Qualifies as Level 1-Assets Pursuant to LCR-regulation (Slide 2 of 2)
With reference to Article 10(1)(f) of the LCR-regulation, DNB Boligkreditt AS
confirms the following (cont.):
• DNB Boligkreditt AS gives the information required in Article 129(7) of CRR
to its investors
• Covered bonds issued by DNB Boligkreditt AS are assigned a credit
assessment by a nominated ECAI which is at least credit quality step 1 in
accordance with Article 129(4) of CRR, and the equivalent credit quality step
in the event of short term credit assessment
• The cover pool does at all times meet an asset coverage requirement of at
least 2 % in excess of the amount required to meet the claims attaching to
the covered bonds issued by DNB Boligkreditt AS
61
ECB Eligibility and CRD-Compliance of Covered Bonds Issued by DNB Boligkreditt AS
• All covered bonds issued by DNB Boligkreditt AS fulfil the eligibility criteria for
marketable assets set by the Eurosystem and are thus eligible for Eurosystem monetary
policy operations.
• The Eurosystem set additional criteria for own use of eligible instruments in the
Eurosystem monetary policy operations. In the case of covered bonds, the instruments
must be issued in accordance with the criteria set out in Part 1, points 68 to 70 of Annex
VI to Directive 2006/48/EC. The covered bonds issued by DNB Boligkreditt AS fulfil these
criteria, but the Eurosystem has not checked the fulfilment of these conditions for
Norway, since Norway is not part of the EU. Therefore, covered bonds issued by DNB
Boligkreditt AS are marked with a "N/A" what regards ‘own-use covered bonds’ in ECB's
eligible asset database.
• DNB Boligkreditt AS confirms that the covered bonds it issues are compliant with
the CRD-requirement set forth in the Eurosystem guidelines. In addition, DNB
Boligkreditt AS confirms that it gives the information required in Regulation (EU) No
575/2013 ("CRR") article 129 (7) to its investors, so that the covered bonds issued by DNB
Boligkreditt AS are eligible for the preferential treatment set out in CRR article 129 (4).

62
Appendix
Appendix B:
Digitalization/Vipps
63
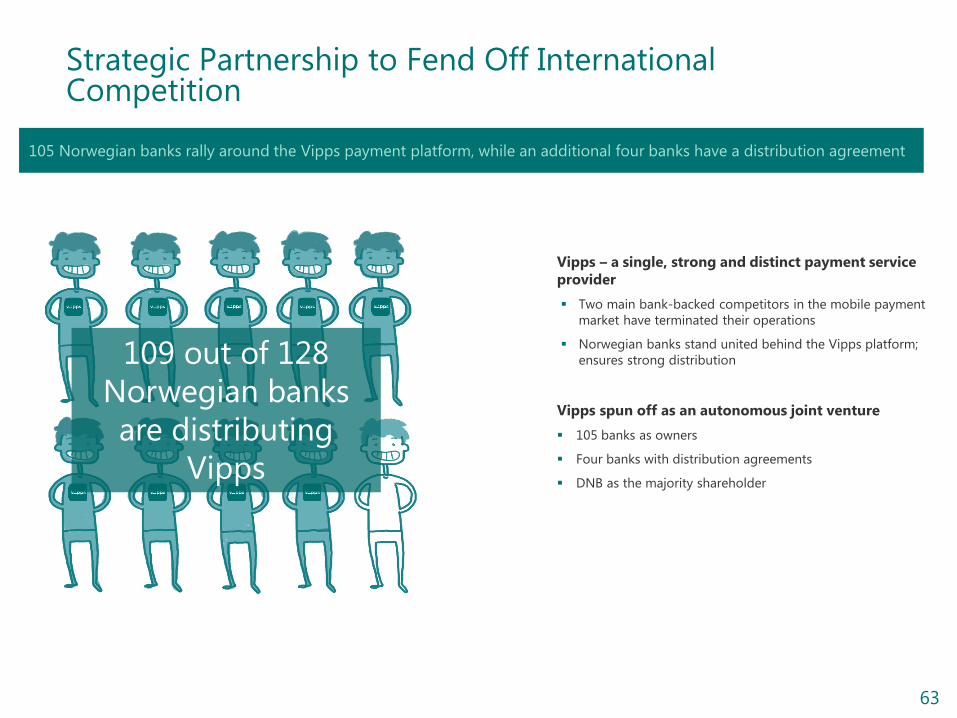
Strategic Partnership to Fend Off International Competition
105 Norwegian banks rally around the Vipps payment platform, while an additional four banks have a distribution agreement
109 out of 128
Norwegian banks
are distributing
Vipps
Vipps – a single, strong and distinct payment service
provider
Two main bank-backed competitors in the mobile payment
market have terminated their operations
Norwegian banks stand united behind the Vipps platform;
ensures strong distribution
Vipps spun off as an autonomous joint venture
105 banks as owners
Four banks with distribution agreements
DNB as the majority shareholder

64
Norway Loves Vipps
95%
The fastest growing brand in Norway
Brand recognition
Growth in user base by age group
Source: Statistics Norway
60+
15-29
40-49
50-59
30-39
Per cent of population Age group
2017 2016
79%
62%
76%
57%
50%
71%
41%
14%
63%
29%

65
Expanding from a P2P service to a leading payment platform
Strong link between P2P customer base and
P2B attractiveness
61 per cent of the Norwegian population (above the age
of 15) is using Vipps P2P
>45 000 businesses, associations and sports clubs accept
payments via Vipps P2B
InStore solution in pilot with McDonalds
22 per cent of transactions are generating fees
Expanding to the Nordics
Ambition to make Vipps the preferred payment partner for
companies operating across the Nordics
Will make our technological platform available across the
Nordics
1.8
1.4
0.6
0.2
2.2
2.6
1.0
P2P users (lhs)
Fee-based transactions, per cent (P2B share of total transactions)
5%
15%
25%
35%
45%
May15 Sept.15 Jan.16 May16 Sept.16 Jan.17 May17 Sept.17
Vipps roadmap
P2P eCom Invoice Spinoff
Leveraging on a strong P2P customer base to increase the number of fee-based transactions
22%
2.6
P2B InStore
Active users, million
Highlights
Settle

66
Appendix
Appendix C:
The Norwegian Mortgage Market
67
The Norwegian Residential Mortgage Market
• Nearly 80% of Norwegians own their home: • Few mortgages are buy-to-let.
• Norway is primarily a floating interest rate market: • The large majority of mortgages originated by DNB are floating rate.
• Rates on floating rate mortgages can be reset at any time and at the bank’s own
discretion, by giving debtors six weeks’ notice.
• Loans are normally underwritten with a term of 15-25 years: • Average size for new mortgages originated by DNB is approximately NOK 1,000,000
(EUR 110,000).
• In Norway, all borrowing costs are deductible from taxable income at
the current rate of 23 %: • Households are therefore better able to withstand an increase in interest rates.
Source: Finance Norway - FNO

68
Appendix
Appendix D:
Capital and Tier 1
69
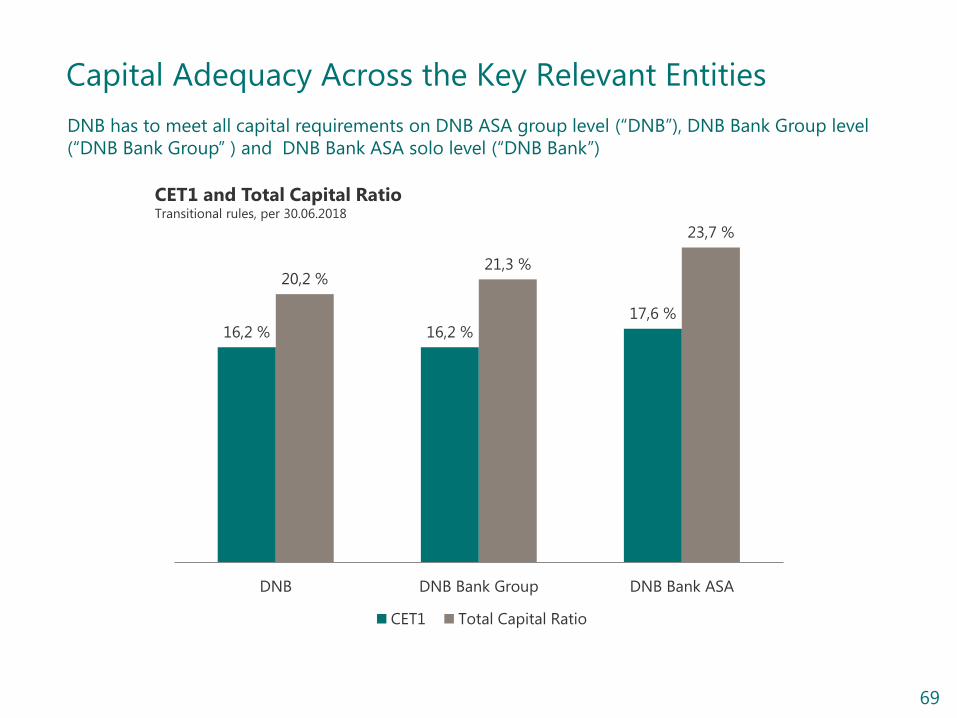
Capital Adequacy Across the Key Relevant Entities
DNB has to meet all capital requirements on DNB ASA group level (“DNB”), DNB Bank Group level
(“DNB Bank Group” ) and DNB Bank ASA solo level (“DNB Bank”)
CET1 and Total Capital Ratio Transitional rules, per 30.06.2018
16,2 % 16,2 % 17,6 %
20,2 % 21,3 %
23,7 %
DNB DNB Bank Group DNB Bank ASA
CET1 Total Capital Ratio

70
Overall Capital Requirements under SREP
• Pillar 1 capital requirements in Norway consist of minimum requirements and
combined buffer requirements
• As a result of the SREP, the supervisors may decide on additional capital add-on (pillar
2), which together with the pillar 1 requirements form the Overall capital
requirement
• If there is a breach of the combined buffer requirements under Pillar 1, there will be
automatic restrictions on dividends etc. (ref. CRD IV article 141)
• However a breach of the Overall capital requirement under SREP will not cause
automatic restrictions:
• The Bank will have to present a plan to the NFSA how to restore the capital ratios
• If the plan is not sufficient, the NFSA will consider other measures.
• The measures will depend on the reasons behind the breach
71
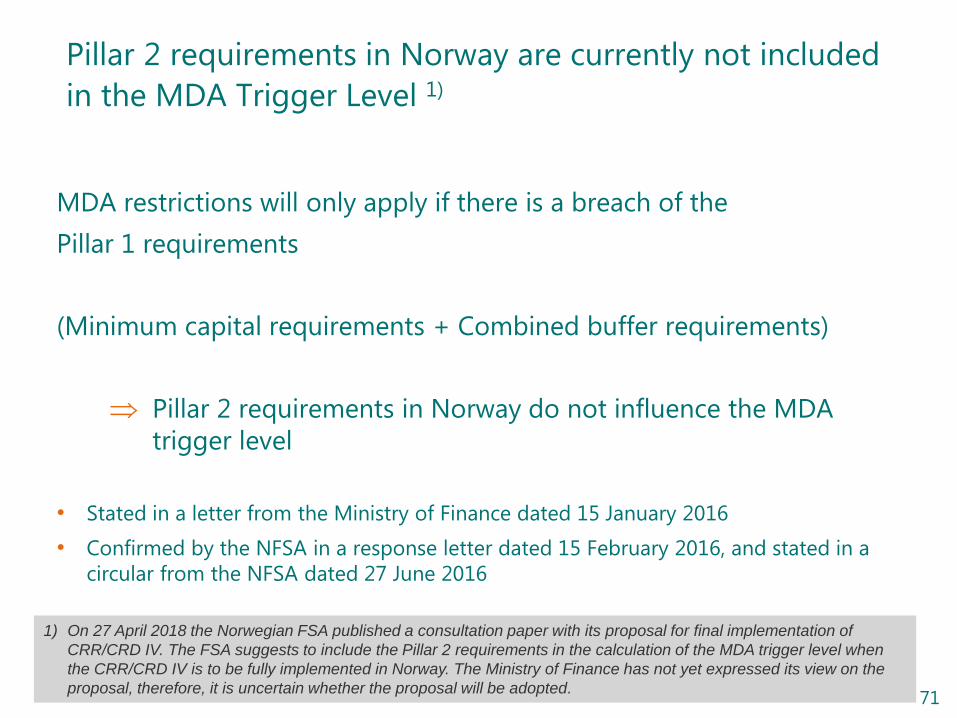
Pillar 2 requirements in Norway are currently not included
in the MDA Trigger Level 1)
MDA restrictions will only apply if there is a breach of the
Pillar 1 requirements
(Minimum capital requirements + Combined buffer requirements)
Pillar 2 requirements in Norway do not influence the MDA
trigger level
• Stated in a letter from the Ministry of Finance dated 15 January 2016
• Confirmed by the NFSA in a response letter dated 15 February 2016, and stated in a
circular from the NFSA dated 27 June 2016
1) On 27 April 2018 the Norwegian FSA published a consultation paper with its proposal for final implementation of
CRR/CRD IV. The FSA suggests to include the Pillar 2 requirements in the calculation of the MDA trigger level when
the CRR/CRD IV is to be fully implemented in Norway. The Ministry of Finance has not yet expressed its view on the
proposal, therefore, it is uncertain whether the proposal will be adopted.

72
DNB’s Solid Profitability Should Ensure AT1 Coupon Payments
Dividend payments on ordinary shares and coupon
payments on Additional Tier 1 (AT1) instruments are at the
discretion of the issuer
* Statement given at the DNB Capital Markets Day (27 November 2014)
31,9
23,4
26,9
13,1
0,1 0,5 1,0 1.0 1) 2,9
7,3 9,3
15,2
0
5
10
15
20
25
30
35
40
2009 2010 2011 2012 2013 2014 2015 2016 2017 H1 18
Profit Before Tax AT1 Coupon Payments Dividend and share buy-back
DNB will give due consideration to
the capital hierarchy and look to
preserve the seniority of claims
going forward*
1) Estimated AT1 coupon payments for 2018.
73
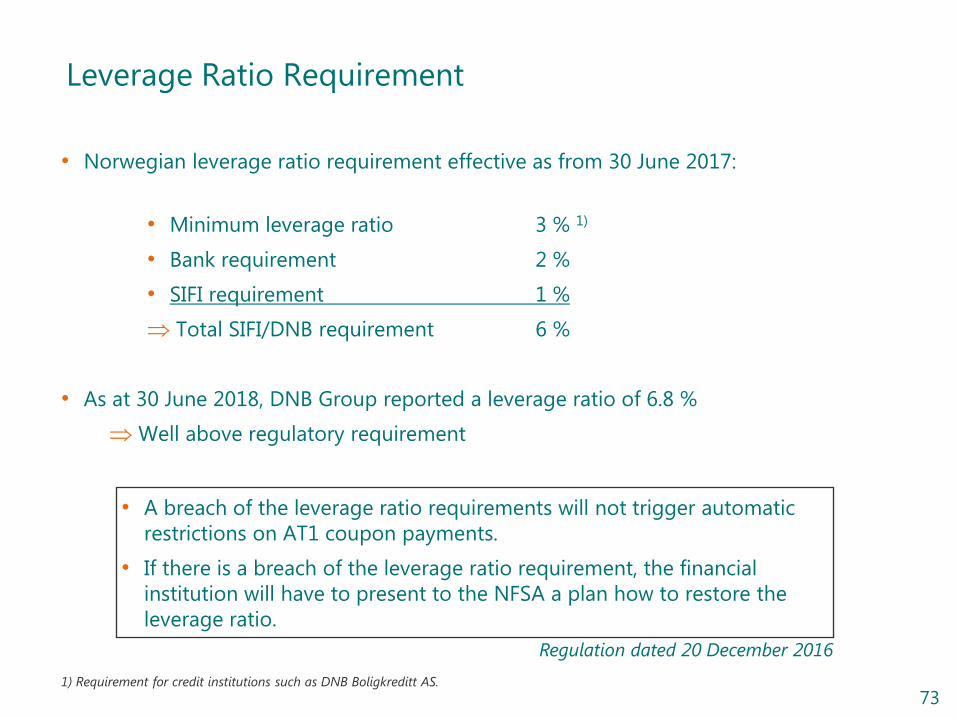
Leverage Ratio Requirement
• Norwegian leverage ratio requirement effective as from 30 June 2017:
• Minimum leverage ratio 3 % 1)
• Bank requirement 2 %
• SIFI requirement 1 %
Total SIFI/DNB requirement 6 %
• As at 30 June 2018, DNB Group reported a leverage ratio of 6.8 %
Well above regulatory requirement
• A breach of the leverage ratio requirements will not trigger automatic
restrictions on AT1 coupon payments.
• If there is a breach of the leverage ratio requirement, the financial
institution will have to present to the NFSA a plan how to restore the
leverage ratio.
Regulation dated 20 December 2016
1) Requirement for credit institutions such as DNB Boligkreditt AS.
74
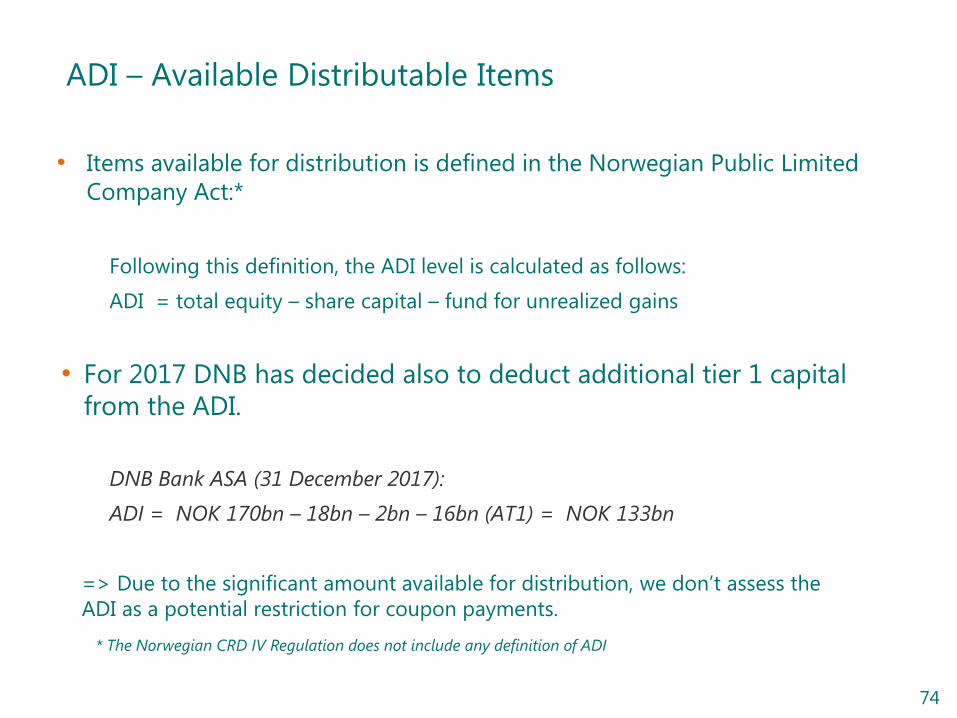
ADI – Available Distributable Items
• Items available for distribution is defined in the Norwegian Public Limited
Company Act:*
Following this definition, the ADI level is calculated as follows:
ADI = total equity – share capital – fund for unrealized gains
• For 2017 DNB has decided also to deduct additional tier 1 capital
from the ADI.
DNB Bank ASA (31 December 2017):
ADI = NOK 170bn – 18bn – 2bn – 16bn (AT1) = NOK 133bn
=> Due to the significant amount available for distribution, we don’t assess the
ADI as a potential restriction for coupon payments.
* The Norwegian CRD IV Regulation does not include any definition of ADI

75
Appendix
Appendix E:
Additional Slides
- Financial performance and Other information
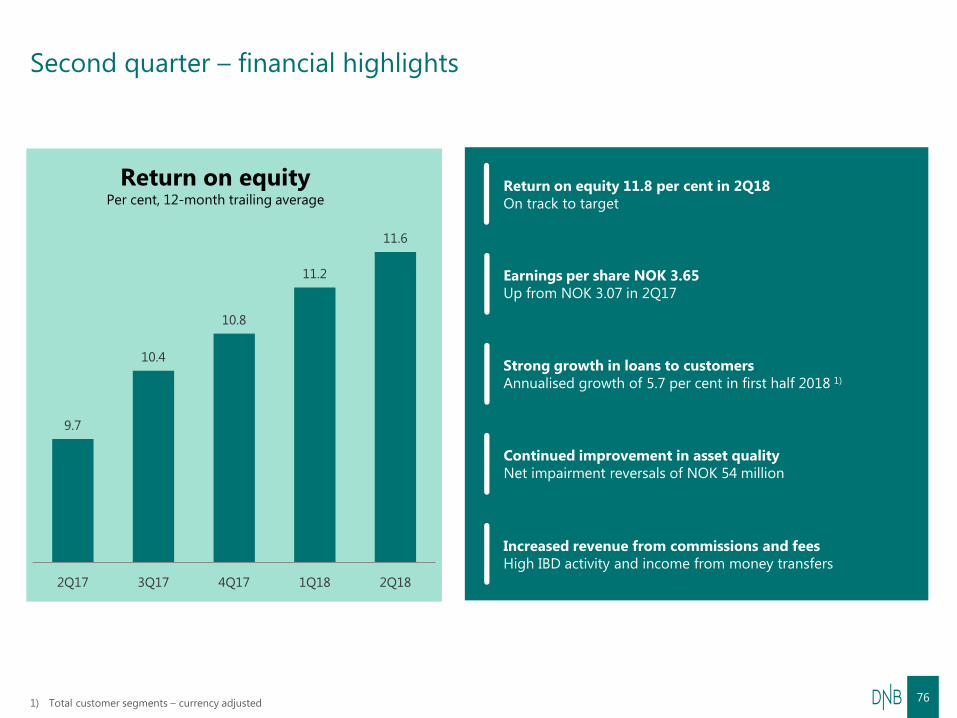
9.7
10.4
10.8
11.2
11.6
2Q17 3Q17 4Q17 1Q18 2Q18
Return on equity Per cent, 12-month trailing average
76 1) Total customer segments – currency adjusted
Second quarter – financial highlights
Increased revenue from commissions and fees
High IBD activity and income from money transfers
Return on equity 11.8 per cent in 2Q18
On track to target
Earnings per share NOK 3.65
Up from NOK 3.07 in 2Q17
Strong growth in loans to customers
Annualised growth of 5.7 per cent in first half 2018 1)
Continued improvement in asset quality
Net impairment reversals of NOK 54 million
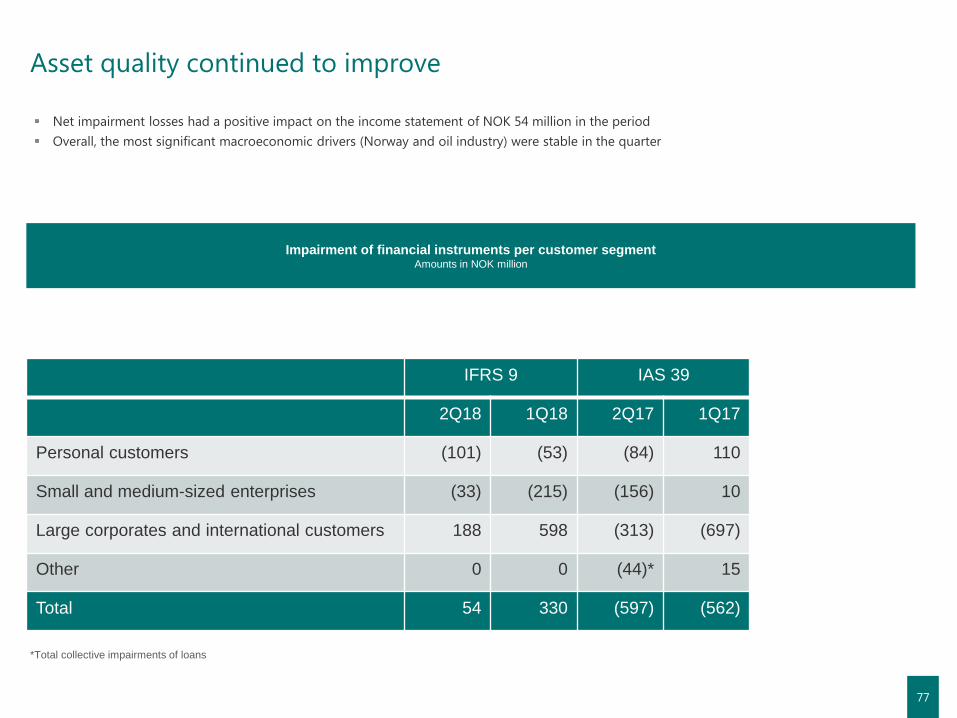
Net impairment losses had a positive impact on the income statement of NOK 54 million in the period
Overall, the most significant macroeconomic drivers (Norway and oil industry) were stable in the quarter
Impairment of financial instruments per customer segment Amounts in NOK million
77
*Total collective impairments of loans
Asset quality continued to improve
IFRS 9 IAS 39
2Q18 1Q18 2Q17 1Q17
Personal customers (101) (53) (84) 110
Small and medium-sized enterprises (33) (215) (156) 10
Large corporates and international customers 188 598 (313) (697)
Other 0 0 (44)* 15
Total 54 330 (597) (562)

78
Disclaimer
• This material has been prepared on the basis of the information provided by DNB Bank ASA (referred to as "DNB Bank") and public available sources. DNB ASA – the holding company of the DNB group is referred to as "DNB " in this presentation.
• This material is presented solely for information purposes and is not to be construed as a solicitation or an offer to buy or sell any securities or related financial instruments and should not be treated as giving investment advice. It has no regard to the specific investment objectives, financial situation or particular needs of any recipient. No representation or warranty, either express or implied, is provided in relation to the accuracy, completeness or reliability of the information contained herein. It should not be regarded by recipients as a substitute for the exercise of their own judgment. Any opinions expressed in this material are subject to change without notice and DNB Bank is not under any obligation to update or keep current the information contained herein. In addition, institutions mentioned in this material, their affiliates, agents, directors, partners and employees may make purchases and/or sales of the Notes as principal or agent or may act as market maker or provide investment banking or other services in respect of the Program or the Notes which may be issued from time to time thereunder. DNB, the Arranger and the Dealers and their respective affiliates, agents, directors, partners and employees accept no liability whatsoever for any loss or damage of any kind arising out of the use of all or any part of this material.
• The Notes are not to be offered or sold in any jurisdiction in circumstances in which the distribution of this document or the Notes would be prohibited in such jurisdiction. This document must not be acted on or relied on by persons who are not eligible to invest in the Notes. Any investment or investment activity to which this communication relates is available only to persons eligible to invest in the Notes and will be engaged in only with such persons.
• Furthermore, you should consult with your own legal, regulatory, tax, business, investment, financial and accounting advisers to the extent that you deem it necessary, and make your own investment, hedging and trading decisions (including decisions regarding the suitability of an investment in the Notes which may be offered from time to time) based upon your own judgment and advice from such advisers as you deem necessary and not upon any view expressed in this presentation.