Embed Size (px)
Citation preview

ARTICLE IN PRESS
Journal of Financial Economics 81 (2006) 1–26
0304-405X/$
doi:10.1016/j
$We than
Department
obtaining da
Mitch Peters
Business Sch�CorrespoE-mail ad
www.elsevier.com/locate/jfec
Do a firm’s equity returns reflect the riskof its pension plan?$
Li Jina, Robert C. Mertona,�, Zvi Bodieb
aHarvard Business School, Baker Library 353, Boston, MA, 02163, USAbBoston University, School of Management, 595 Commonwealth Avenue, Boston, MA, 02215, USA
Received 15 July 2004; received in revised form 1 January 2005; accepted 17 June 2005
Available online 13 February 2006
Abstract
This paper examines the empirical question of whether systematic equity risk of US firms as
measured by beta from the capital asset pricing model reflects the risk of their pension plans. There
are a number of reasons to suspect that it might not. Chief among them is the opaque set of
accounting rules used to report pension assets, liabilities, and expenses. Pension plan assets and
liabilities are off-balance sheet and are often viewed as segregated from the rest of the firm, with its
own trustees. Pension accounting rules are complicated. Furthermore, the role of the Pension Benefit
Guaranty Corporation clouds the real relation between pension plan risk and firm equity risk.
The empirical findings in this paper are consistent with the hypothesis that equity risk does reflect
the risk of the firm’s pension plan despite arcane accounting rules for pensions. This finding is
consistent with informational efficiency of the capital markets. It also has implications for corporate
finance practice in the determination of the cost of capital for capital budgeting. Standard procedure
uses de-leveraged equity return betas to infer the cost of capital for operating assets. But the
de-leveraged betas are not adjusted for the risk of the pension assets and liabilities. Failure to
make this adjustment typically biases upward estimates of the discount rate for capital budgeting.
- see front matter r 2006 Elsevier B.V. All rights reserved.
.jfineco.2005.06.005
k Anna Yu, Alvaro Vivanco and especially Jason Oh for excellent research assistance, and the
of Research at Harvard Business School, especially Sarah Eriksen and Sarah Woolverton, for help in
ta used in this paper. We benefited greatly from discussions with Lisa Meulbroek, Akiko Mitsui and
en and comments from two anonymous referees as well as seminar participants at the Harvard
ool and the Brattle Group.
nding author.
dress: [email protected] (R.C. Merton).

ARTICLE IN PRESSL. Jin et al. / Journal of Financial Economics 81 (2006) 1–262
The magnitude of the bias is shown here to be large for a number of well-known US companies. This
bias can result in positive net present value projects being rejected.
r 2006 Elsevier B.V. All rights reserved.
JEL classifications: G14; G23; G31
Keywords: Defined benefit pension plan; Market efficiency; Cost of capital; Capital budgeting
1. Introduction
In this paper, we examine the empirical question of whether real-world equity returnsreflect the risk of corporate pension plans. We focus on the systematic risk of the firm and usebeta from the Sharpe (1964) capital asset pricing model (CAPM) as the measure of such risk.1
Many reasons can be cited for why pension risk might not be reflected in equity returns.Pension plan assets and liabilities are off-balance sheet and are often viewed as segregatedfrom the rest of the firm. Pension plans have their own trustees, and pension accountingrules are complicated. Furthermore, the role of the Pension Benefit Guaranty Corporation(PBGC) as guarantor of corporate pension benefits to employees complicates the relationbetween the risk of the pension plan and the risk of the firm equity.A substantial literature in economics and finance studies value transparency, or whether
pension assets and pension liabilities affect the market valuation of firms. Representativepapers include Oldfield (1977), Feldstein and Seligman (1981), Feldstein and Morck(1983), Bodie et al. (1987), Bulow et al. (1987), and Bodie and Papke (1992). These papersprovide considerable empirical evidence that the equity market valuation of firms takesinto account the difference between the value of pension plan assets and its liabilities, i.e.,the pension surplus or deficit (if that difference is negative). Carroll and Niehaus (1998)confirm those findings in a parallel test of debt market recognition of the value of thepension surplus or deficit by empirically examining the positive relation between fundingof defined-benefit pension funds and debt ratings. Furthermore, in both equity and debtmarkets, there seems to be an asymmetric pattern in the impact of changes in pensionsassets and liabilities on the market value of the firm and on debt ratings. While each dollarincrease in liabilities lowers the market value of the firm by about a dollar, an equalincrease in pension assets raises the firm’s market value by less than a dollar. Similarly, apension deficit reduces debt ratings by more than the same size pension surplus increasesdebt ratings. This is consistent with the view that, while an underfunded pension liabilityshould be fully reflected as a corporate liability, overfunded pension assets are not entirelya corporate asset, because of the difficulty of converting an overfunded pension plan’sassets into unencumbered corporate assets.However, the literature has almost no analysis, either theoretical or empirical, about
how the risk level of a defined-benefit pension plan affects the risk of the market value ofthe firm. As we shall see, value transparency does not necessarily imply risk transparency.
1Although the explicit measure of systematic risk used here is in the context of the CAPM, the same concept can
be applied to multiple beta asset pricing models, such as the Fama and French three-factor model (1996), the Ross
(1976) arbitrage pricing theory, and the intertemporal CAPM (Merton, 1992, Chapter 15). Also, we have focused
on the systematic risk, although idiosyncratic risk, or the total risk, might be of some interest. Our data did not
permit us to use these alternative measures of risk.

ARTICLE IN PRESSL. Jin et al. / Journal of Financial Economics 81 (2006) 1–26 3
The former is a static measure, whereas the latter is a dynamic measure. To our knowledge,our paper is the first to focus on dynamic measurement by testing whether pension plansystematic risk is reflected in firm equity risk.
Given that estimates of beta play a pivotal role in performance evaluation and in theestimated cost of capital calculation, accurate estimation of beta is crucial. The questionwe address therefore has important implications for the correct calculation of operatingasset beta and tests of market efficiency, regardless of the direction of the answer.
On the one hand, if pension risk is not accurately reflected in the firm’s equity beta(which implies that the market is informationally inefficient), then standard analysisusually underestimates the true systematic risk of the firm. This underestimation of riskcould lead to the appearance of superior corporate performance on a risk adjusted basisand that in turn would lead to a pattern of overvaluation of the firm.
On the other hand, if the firm’s equity beta does accurately reflect its pension plan risk, itcan have a significant implication for corporate finance in estimating a firm’s cost ofcapital. The standard methodology for calculating the cost of capital treats it as a weightedaverage of the cost of equity and the after-tax cost of debt (which is the pre-tax cost of debtadjusted for the tax shield generated by the corporate debt). See, for example, Brealey andMyers (2002), Copeland and Weston (1992), Ross et al. (2002), and Van Horne andWachowicz (1995). Such calculation implicitly neglects the pension plan, or, it assumesthat the pension assets and liabilities have the same risk characteristics as the operatingassets and therefore do not need to be counted separately. The plain facts are that pensionplan assets and liabilities are substantial for many firms, and they would onlycoincidentally have the same risk characteristics as the operating assets. As will bedemonstrated, large estimation biases for the firms’ operating betas can exist in such cases.
In Section 2, we derive the theoretical asset beta for the firm’s operating assets as afunction of the firm’s equity beta, pension asset beta, and debt and pension liability beta.From this, we derive the specification errors in the estimation of the operating asset beta ifpension assets and liabilities are completely ignored, and if the value of the pension plan iscorrectly taken into account but not its risk. For a selected sample of firms we show as anempirical matter that the resulting overstatement of the cost of capital can be substantial.This section is based on Merton (2002). See also Merton (2004). In Section 3, we use thetheoretical specifications to study US pension plan risk using data from 1993 to 1998 forcompanies filing Employee Retirement Income Security Act (ERISA) form 5500. Thisperiod was prior to the sharp and sustained decline in the stock market, particularlyNasdaq, in 2000–2002, and the subsequent media spotlight on pension plan risk. Wefind that the market risk of the firm’s equity reflects the risk level of its pension plan. InSection 4, we examine the sensitivity of test findings to our assumptions. We find ourresults to be robust. In Section 5, we conclude.
2. Theory
In the United States, when a company sponsors a defined-benefit pension plan, theplan’s assets and liabilities, although segregated, are, in economic terms, assets andliabilities of the company. The company and its pension plan as a consolidated entity havethree groups with a claim on the firm’s total assets: (1) the employees–retired and active,(2) the investors–shareholders and creditors, and (3) the government, through corporatetaxes and corporate pension benefit guarantees. The employees’ claim on the retirement

ARTICLE IN PRESSL. Jin et al. / Journal of Financial Economics 81 (2006) 1–264
benefits, the pension liability, is a debt-like liability of the firm, secured by the pensionassets as specific collateral.Ignoring the effect of taxes and the PBGC, we derive the relations between pension plan
risk and firm equity risk, and we discuss how the firm’s operating asset risk can be correctlyestimated from the pension plan risk and observed equity risk. We then derive the structureof estimation specification errors in measuring firm operating asset risk when pension riskis accounted for improperly. In doing so, we analyze two circumstances: (1) that the entirepension plan, assets and liabilities, is neglected in the estimation of operating asset risk and(2) that the values of pension assets and liabilities are correctly taken into account, but therisks of plan assets and liabilities are not. We then discuss the effect of corporate tax andthe role of PBGC.2
2.1. The estimation of operating asset risk from pension and stock market data
Consider the case in which there are no taxes and no Pension Benefit GuarantyCorporation.Define OA as the value of operating assets, E as the value of equity, D as the value of
debt, PA as the value of pension assets, PL as the value of pension liabilities, S ¼ PA� PLas the pension surplus, and L ¼ D=E as the leverage ratio. By the balance sheet identity,
assets ¼ OAþ PA ¼ E þDþ PL ¼ liabilities.
We examine three cases.Correct case: The calculation of operating asset risk correctly incorporates both the
value and the risk characteristic of the pension plan.The beta of operating assets, bOA, when both the pension value and pension risk are
correctly taken into account is
bOA ¼E
OAbE þ
D
OAbD �
PA
OAbPA �
PL
OAbPL
� �
¼E
OAðbE þ bDÞ þ
D� E
OAbD �
PA
OAðbPA � bPLÞ �
S
OAbPL. ð1Þ
Error case 1: The calculation of operating asset risk ignores the pension plan, both itsvalue and its risk.3
If both the value and the risk of the pension plan are ignored, then the estimatedoperating asset beta becomes
bOA ¼D
E þDbD þ
E
E þDbE . (2)
2Throughout the paper we are focusing on the pre-tax cost of capital, or, all-equity cost of capital. This is to
take the firm’s actual levered cost of equity and debt and to back out the cost of capital as if the firm were all-
equity financed (i.e., assuming away the impact of debt interest tax shield and the cost of financial distress). The
all-equity cost of capital serves as a better benchmark than the actual cost of capital, for all firms by removing the
impact of financing, and thus making it much more comparable across firms that have potentially different capital
structure. This would also accord better with people’s intuition: when it is said that two firms in the same industry
are comparable, it typically means that their assets have comparable risk. Thus the comparison is on the left-hand
side of the balance sheet (i.e., assets), instead of the right-hand side of the balance sheet (i.e., financing decision).3The standard textbook treatments typically calculate the weighted average cost of capital (WACC) as the
weighted average cost of debt and equity, with no adjustment for pension risks. See examples cited in footnote 2.
ARTICLE IN PRESSL. Jin et al. / Journal of Financial Economics 81 (2006) 1–26 5
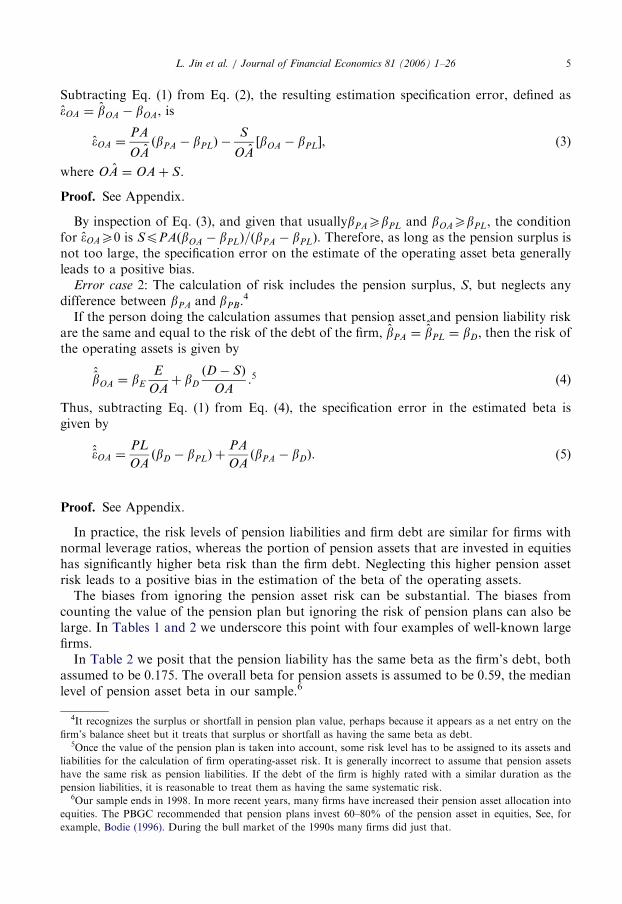
Subtracting Eq. (1) from Eq. (2), the resulting estimation specification error, defined aseOA ¼ bOA � bOA, is
eOA ¼PA
OAðbPA � bPLÞ �
S
OA½bOA � bPL�, (3)
where OA ¼ OAþ S.
Proof. See Appendix.
By inspection of Eq. (3), and given that usuallybPAXbPL and bOAXbPL, the conditionfor eOAX0 is SpPAðbOA � bPLÞ=ðbPA � bPLÞ. Therefore, as long as the pension surplus isnot too large, the specification error on the estimate of the operating asset beta generallyleads to a positive bias.
Error case 2: The calculation of risk includes the pension surplus, S, but neglects anydifference between bPA and bPB.
4
If the person doing the calculation assumes that pension asset and pension liability riskare the same and equal to the risk of the debt of the firm,
^bPA ¼^bPL ¼ bD, then the risk of
the operating assets is given by
^bOA ¼ bE
E
OAþ bD
ðD� SÞ
OA.5 (4)
Thus, subtracting Eq. (1) from Eq. (4), the specification error in the estimated beta isgiven by
^eOA ¼PL
OAðbD � bPLÞ þ
PA
OAðbPA � bDÞ. (5)
Proof. See Appendix.
In practice, the risk levels of pension liabilities and firm debt are similar for firms withnormal leverage ratios, whereas the portion of pension assets that are invested in equitieshas significantly higher beta risk than the firm debt. Neglecting this higher pension assetrisk leads to a positive bias in the estimation of the beta of the operating assets.
The biases from ignoring the pension asset risk can be substantial. The biases fromcounting the value of the pension plan but ignoring the risk of pension plans can also belarge. In Tables 1 and 2 we underscore this point with four examples of well-known largefirms.
In Table 2 we posit that the pension liability has the same beta as the firm’s debt, bothassumed to be 0.175. The overall beta for pension assets is assumed to be 0.59, the medianlevel of pension asset beta in our sample.6
4It recognizes the surplus or shortfall in pension plan value, perhaps because it appears as a net entry on the
firm’s balance sheet but it treats that surplus or shortfall as having the same beta as debt.5Once the value of the pension plan is taken into account, some risk level has to be assigned to its assets and
liabilities for the calculation of firm operating-asset risk. It is generally incorrect to assume that pension assets
have the same risk as pension liabilities. If the debt of the firm is highly rated with a similar duration as the
pension liabilities, it is reasonable to treat them as having the same systematic risk.6Our sample ends in 1998. In more recent years, many firms have increased their pension asset allocation into
equities. The PBGC recommended that pension plans invest 60–80% of the pension asset in equities, See, for
example, Bodie (1996). During the bull market of the 1990s many firms did just that.
ARTICLE IN PRESS
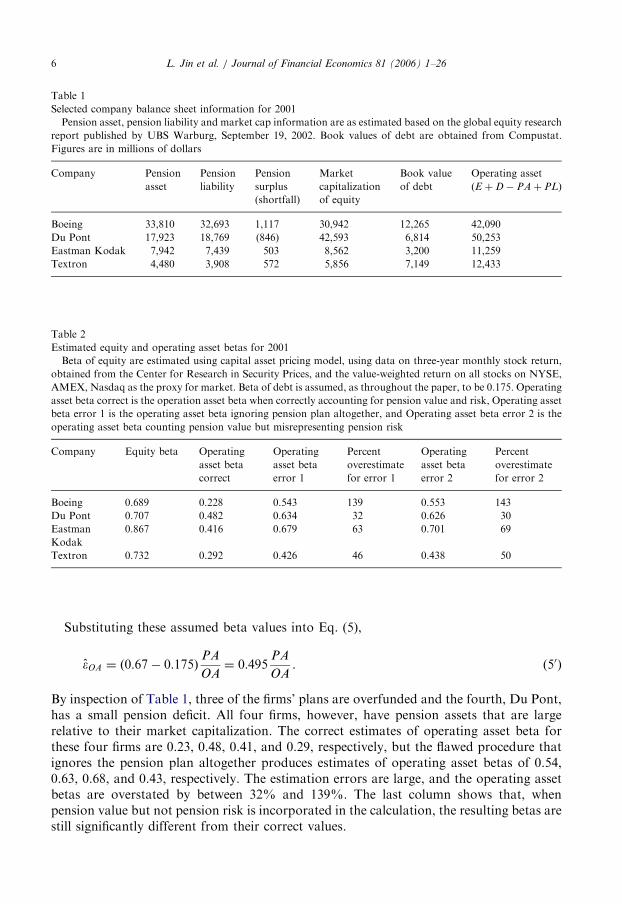
Table 1
Selected company balance sheet information for 2001
Pension asset, pension liability and market cap information are as estimated based on the global equity research
report published by UBS Warburg, September 19, 2002. Book values of debt are obtained from Compustat.
Figures are in millions of dollars
Company Pension
asset
Pension
liability
Pension
surplus
(shortfall)
Market
capitalization
of equity
Book value
of debt
Operating asset
(E þD� PAþ PL)
Boeing 33,810 32,693 1,117 30,942 12,265 42,090
Du Pont 17,923 18,769 (846) 42,593 6,814 50,253
Eastman Kodak 7,942 7,439 503 8,562 3,200 11,259
Textron 4,480 3,908 572 5,856 7,149 12,433
Table 2
Estimated equity and operating asset betas for 2001
Beta of equity are estimated using capital asset pricing model, using data on three-year monthly stock return,
obtained from the Center for Research in Security Prices, and the value-weighted return on all stocks on NYSE,
AMEX, Nasdaq as the proxy for market. Beta of debt is assumed, as throughout the paper, to be 0.175. Operating
asset beta correct is the operation asset beta when correctly accounting for pension value and risk, Operating asset
beta error 1 is the operating asset beta ignoring pension plan altogether, and Operating asset beta error 2 is the
operating asset beta counting pension value but misrepresenting pension risk
Company Equity beta Operating
asset beta
correct
Operating
asset beta
error 1
Percent
overestimate
for error 1
Operating
asset beta
error 2
Percent
overestimate
for error 2
Boeing 0.689 0.228 0.543 139 0.553 143
Du Pont 0.707 0.482 0.634 32 0.626 30
Eastman
Kodak
0.867 0.416 0.679 63 0.701 69
Textron 0.732 0.292 0.426 46 0.438 50
L. Jin et al. / Journal of Financial Economics 81 (2006) 1–266
Substituting these assumed beta values into Eq. (5),
eOA ¼ ð0:67� 0:175ÞPA
OA¼ 0:495
PA
OA. (50)
By inspection of Table 1, three of the firms’ plans are overfunded and the fourth, Du Pont,has a small pension deficit. All four firms, however, have pension assets that are largerelative to their market capitalization. The correct estimates of operating asset beta forthese four firms are 0.23, 0.48, 0.41, and 0.29, respectively, but the flawed procedure thatignores the pension plan altogether produces estimates of operating asset betas of 0.54,0.63, 0.68, and 0.43, respectively. The estimation errors are large, and the operating assetbetas are overstated by between 32% and 139%. The last column shows that, whenpension value but not pension risk is incorporated in the calculation, the resulting betas arestill significantly different from their correct values.

ARTICLE IN PRESS
Table 3
Estimated costs of capital for 2001
The cost of capital is estimate as the all-equity cost of capital (i.e., by ignoring the impact of tax on debt cost of
capital). We use the capital asset pricing model to estimate equity cost of capital, assuming a risk-free rate of
5%/year and a market risk premium of 7%/year
Company Correct cost of
capital estimate
(%)
Cost of capital
estimate error 1
(%)
Percent
overestimate for
error 1
Cost of capital
estimate error 2
(%)
Percent
overestimate for
error 2
Boeing 6.59 8.80 34 8.87 35
Du Pont 8.37 9.44 13 9.38 12
Eastman
Kodak
7.91 9.75 23 9.91 25
Textron 7.04 7.98 13 8.06 15
L. Jin et al. / Journal of Financial Economics 81 (2006) 1–26 7
Thus, standard cost of capital calculations, which do not distinguish between theoperating asset risk and pension plan risks, can materially overestimate the discount ratefor operating projects. For an equity risk premium of 7% and a risk-free rate of 5%, thecorrect cost of capital for the existing operating assets of Boeing is 6.59%, but the standardapproach yields 8.80%, an overestimate of about 34%. For Du Pont, Eastman Kodak,and Textron, the correct cost of capital is 8.37%, 7.91%, and 7.04%, respectively, whilethe standard approach yields 9.44%, 9.75%, and 7.98%, respectively, for a 13% to 23%error. The effect of the overestimation of cost of capital is summarized in Table 3.
2.2. Effect of corporate taxes
Consider the effect of corporate taxes on the relation between the risk of the pensionplan and the risk to investors in the firm. There is a considerable range in the theory ofcorporate finance about the effect of taxes on the valuation of a firm and, thus, on the riskof the firm. The original controversy is focused on whether debt financing increases thetotal value of the firm relative to its value under all-equity financing. As shown by Miller(1977), the answer hinges on the complex interaction between corporate and personaltaxation in a general model of capital market equilibrium.
Black (1980) and Tepper (1981) examine the effect of corporate taxes on the valuation ofcorporate pension assets and liabilities. Under symmetric assumptions about contributionopportunities, tax payments, and rebates, they conclude that a $1 change in the pre-taxvalue of pension surplus (i.e., assets minus liabilities) causes a $ð1� tÞ change in the valueof the firm, where t is the effective corporate tax rate. Thus the government bears fraction t
of the pension surplus risk through taxes.Bulow et al. (1987) revisit the question and conclude that depending on the extent to
which the ceiling on pension fund contributions can be binding, the relation ranges from(1�t) to 1.0. Beyond the theoretical complexities, there are further empirical ones. Theeffective versus statutory tax rates for real-world firms vary considerably in cross-sectionand for the same firm over time. Accounting rules that govern how pension surplus iscomputed for determining contribution limitations currently have multi-year smoothingfeatures. Thus, in the absence of individual firm tax-rate data, we make no adjustment fortaxes in our test specification in Section 3.

ARTICLE IN PRESSL. Jin et al. / Journal of Financial Economics 81 (2006) 1–268
2.3. Effect of PBGC insurance
The PBGC covers any shortfall in funding for the pension plans of bankrupt firms, ineffect providing the plan participants with a put option on the pension fund collateral fortheir benefits (There is a ceiling on benefits covered of $44,386 per year per employee, forthe year 2004). The price charged for this PBGC insurance is not a function of either thecredit quality of the plan sponsor or of the risk of the plan’s assets. Thus the premium forcoverage is not equal to its fair market value. Distressed firms are charged less than the fairvalue and healthy firms are charged more.7 Even if PBGC insurance were fairly priced, theinsurance transfers part of the risk associated with the pension assets and liabilities fromthe corporate sponsor to the PBGC. PBGC insurance creates an incentive for distressedfirms to underfund the pension plan and invest the plan in risky assets. Bodie et al. (1985)find some empirical evidence of this effect. At the theoretical level, the existence of thePBGC introduces a complex nonlinear relation between the value and risk of pensionassets and liabilities and the risk of investor capital for corporations that are in financialdistress. See Bodie (1996), for the discussion about the PBGC pension put. Partly for thisreason, we focus in our empirical analysis on firms that are not in distress.
3. Empirical analysis
In Section 2 we derive the risk relations among the firm’s assets and liabilities when theyare fully recognized by investors and measured at market prices. In this section we explorethe question: Do those relations hold in practice? We consider, as an empirical matter, theextent to which a company’s pension funding status and asset mix are incorporated in therisk of its equity. Specifically we test the hypothesis that a higher pension plan risktranslates into a higher overall firm market risk, and we also estimate the magnitude of thepension risk-firm risk relation.
3.1. Data and measurement of variables
The data used in our study come from three sources: ERISA Form 5500 filings,Compustat, and the Center for Research in Security Prices (CRSP). ERISA Form 5500provides asset allocation information for each plan sponsored by a company. The assetsare disaggregated into categories such as certificates of deposit, US government securities,corporate debt instruments and common stocks and reported at market value. Sponsors ofany plan with more than one hundred employees are required by law to file the form. TheForm 5500 tape that we acquire covers the years 1993–1998. We obtain company level dataabout pension liabilities and other balance sheet and income statement variables fromCompustat. We match data from the two sources to create a merged company level dataset. CRSP data are used to calculate equity betas for the firms in our sample.Form 5500 data are made available to the public with roughly a two-year lag.8
Compustat data are created from company 10-K reports, which are released with a much
7The detailed procedures for setting pension premium can be found from the PBGC website, at http://
www.pbgc.gov/publications/factshts/PREMFACT.htm.8The Form 5500 data are released by ERISA with roughly a two-year lag. However, part of the pension funds
asset allocation information might be available to the general public sooner, especially if these pension funds are

ARTICLE IN PRESS
Table 4
Pension asset categories as reported in Form 5500 and assumed beta risk
Pension asset categories Assumed beta Average asset
allocation (percent)
Equities
Common stock 1.000 11.9
Joint venture 1.000 0.3
Employer securities Estimated equity beta 6.4
Interest in registered investment companies 1.000 29.7
Preferred stock 0.175 0.2
Bonds
Government bonds 0.175 5.1
Corporate debt instruments (preferred and other) 0.175 3.3
Loans to participants 0.175 20.3
Loans secured by mortgages, and other loans 0.175 0.3
Cash
Non-interest bearing cash 0.006 3.7
Certificates of deposit 0.006 18.5
Real estate
Both income producing and nonincome producing 0.150 0.3
real estate
L. Jin et al. / Journal of Financial Economics 81 (2006) 1–26 9
shorter time lag than Form 5500 data. The Compustat data are also more widely used bymarket participants.
From the asset allocation information reported in Form 5500, we compute the totalamount of pension assets. We also measure the average systematic risk exposure from thepension plan assets by making certain assumptions about the beta risk of variouscategories of assets. Table 4 contains the assumptions about beta for various asset classesthat we use in computing the total risk of pension assets and pension liabilities, as well asthe average asset allocation decisions of DB plans in our sample.9
The total pension liability measure is obtained from COMPUSTAT. COMPUSTATreports two different measures: the Accumulated Benefit Obligation (ABO) and the
(footnote continued)
large and self-managed. Funds are typically required by various other regulations to reveal certain information to
the public. For example, Securities and Exchange Commission regulation 13F requires institutions (including
pension funds) to report quarterly holdings of securities when the total holdings are above $100 million. In any
case, the lack of timely information in pension asset allocation decisions might not be as severe a problem as it
appears. Pension asset allocation decisions empirically do not change much over time for any specific firm. A
simple correlation analysis reveals that the first-order auto-correlation between pension asset risk over time is
more than 0.95. Thus, knowing the past asset allocation decisions of a firm generally gives one a good idea about
its current asset allocation decisions.9The estimates of the beta risk for asset categories are drawn from a study done by the Harvard Management
Company to calculate the portfolio choices for the firm. The numbers are cited from Light (2001). We take
corporate debt as the same beta as the other debt instruments, at 0.175. This is a simplification. The beta of real-
world corporate debt should depend on the duration and riskiness of the debt, but we lack those data. As a
robustness check, we also approximated the corporate debt beta by estimating the beta of the five-year Treasury
note. The average rolling beta estimate for our sample period is 0.178, reasonably close to what we use.

ARTICLE IN PRESSL. Jin et al. / Journal of Financial Economics 81 (2006) 1–2610
Projected Benefit Obligation (PBO). We believe that the ABO is a more accurate measureof the economic value of the liability. See, for example, the discussion in Bodie 1990.However, the ABO was required to be disclosed only prior to FAS 132, and now it needsbe disclosed only for underfunded plans. Therefore in our data, ABO data are sometimesmissing. Whenever possible, we use the ABO as the measure of the amount of pensionliability. In the cases in which such measure is not available, we estimate the ABO as thePBO multiplied by the most recently available historical ratio of ABO to PBO for thatfirm. If no such ratio is available, we multiply the PBO by 0.83, the average of ABO toPBO for all firms in our sample.There is some reason to believe that pension liabilities might have a higher beta than
corporate debt, because the former typically has a longer duration. While somecontroversy has arisen as to what is the most appropriate benchmark of pension liability,one commonly used benchmark for pricing pension liability is the 30-year Treasury bondrate.10 In our sample period, the estimate of duration of a 30-year Treasury bond isroughly 13 years, using the average reported duration from CRSP Fixed Term Indices File.This is in line with the duration assumption used in current practice.11 Thus we think a 30-year Treasury bond can be a useful benchmark to estimate the pension liability beta. Usingthat benchmark, the in-sample estimate of the beta of pension liabilities is about 0.46 if wedo a 60-month rolling estimate, using all the monthly returns up to the end of the previousyear. However, the estimate is sensitive to the underlying assumptions. An estimate usingall 72 months of in-sample data from 1993 to 1998, for example, would come to about0.18.12 Both measures might have some justifications. The rolling beta probably captureswhat the market knows at that time, while the in-sample estimate including 1998 datamight also be appealing as it shows how infrequent events could potentially impact thebeta.13 In our empirical results below, we report both estimates for the beta of pensionliabilities (bPL ¼ 0:18 and bPL ¼ 0:46), and let the readers decide which one is moreappropriate.Both the measures of pension assets and pension liabilities are still subject to
measurement errors. ERISA Form 5500 contains information only for pension assetclasses, and an asset within the class certainly can have different systematic risk than whatwe assume for the average of the class. On the pension liabilities side, firms do have someleeway in calculating the pension liabilities. For example, firms are allowed to set thediscount rate for pension liabilities between 90% and 120% of the 30-year Treasury rate.As mentioned before, there are cases in which the precise measures of ABO are notavailable and have to be approximated. These measurement errors likely add noise, but notsystematic bias, to the empirical results presented below.
10The other commonly used benchmark is the AA-rated bonds of significant maturity. See, for example,
Statement of Financial Accounting Standards No. 87: Employers’ Accounting for Pensions. Other benchmarks
include the 30-year swap rate (dollar LIBOR), Moody’s Corporate Bond Yield Averages, and agency benchmark
bonds. See, for example, Moore and Peskin (2002).11According to Jared Gross, formerly chief financial economist at the PBGC, both the current law and the
recent legislative proposals use a set of widely available bond indices for the purpose of creating a discount rate
used in present-valuing pension liabilities. The concept at work is that these indices are generally consistent with
the overall duration of pension liabilities (12 years is a reasonable approximation).12Year 1998 estimate of bond beta is different from previous years. We suspect it is linked to the flight to quality
around the Russian bond default and the LTCM crisis.13For the same reason, many people have argued against taking out rare events such as the Depression years
and the years immediately following the World War II, when estimating equity premium.

ARTICLE IN PRESS
Table 5
Summary statistics
Equity beta is calculated using market model and up to one year of weekly return data. Weighted average beta
for equity and debt is calculated as the market value weighted average beta of debt and equity:
bEE=ðE þDÞ þ bDD=ðE þDÞ, and Pension risk is bPAPA=ðE þDÞ þ bPLPL=ðE þDÞ, where bPL is assumed to
be equal to 0.180 and bPA is the weighted average beta of all pension assets
Variable Number of
observation
Mean Standard
deviation
Quatile 1 Median Quatile 3
Equity beta 4453 0.759 0.868 0.283 0.705 1.203
Firm risk (weighted average beta
for equity and debt)
4453 0.525 0.517 0.231 0.486 0.793
Pension risk (pension asset risk
minus pension liability risk)
4453 0.014 0.074 �0.012 0.003 0.036
L. Jin et al. / Journal of Financial Economics 81 (2006) 1–26 11
To estimate the equity betas, we use weekly data for one year (up to 52 observations). Tomake sure our beta estimate is meaningful, we eliminate stocks that have not been tradedfor more than 43 weeks during a year. Because we are using relatively higher frequencydata, to adjust for nonsynchronous trading, we employ the Dimson (1979) adjustment withone lag and no leads to calculate the beta. To test robustness, we also examine differentspecifications of leads and lags and do not find a qualitative change in the results.
The summary statistics of our sample is reported in Table 5.Table 5 shows a large variation in the pension asset betas. Further analysis shows that
the pension asset beta variation is largely cross-sectional, such that each year we have astandard deviation of 0.3–0.4 for the cross-sectional variation of beta of pension assets.However, for any specific firm, the pension asset beta changes only slowly over time, suchthat the pension asset beta for the sample firm is highly correlated over time.
From the firm’s balance sheet identity, E þD ¼ OAþ PA� PL, the firm’s investedcapital, defined as debt plus equity, equals the value of operating assets plus the pensionplan surplus.
Define the capital structure risk, i.e., the systematic risk borne by the equity and debtholders of the firm, as
bEþD ¼ bE
E
E þDþ bD
D
E þD.
It follows that
bEþD ¼bPAPA
E þD�
bPLPL
E þDþ
bOAOA
E þD.
Thus there is a one-to-one relation between the risk of the firm’s capital structure,measured by the weighted average of equity and debt risk, and the net pension plan risk,measured as
bPension ¼bPAPA
E þD�
bPLPL
E þD.
ARTICLE IN PRESSL. Jin et al. / Journal of Financial Economics 81 (2006) 1–2612
Namely,
bEþD ¼ bpension þbOAOA
E þD. (6)
We use this relation to test whether the beta risk of pensions is incorporated in the risk ofthe firm’s capital structure
bEþD ¼ aþ bbpension þ e. (7)
In this regression, b represents the sensitivity of firm risk to firm pension risk, and a
represents the part of the expected firm risk that cannot be picked up by the pension risk.We try to capture a by various instrumental variables. We expect b to be positive and closeto one in magnitude.By using a single coefficient b in the above regression, we are assuming that the degree of
sensitivity of firm risk to pension asset risk and pension liability risk is the same. While onemight attempt to further distinguish the hypothesis between the pension asset and pensionliability risk sensitivity, estimation error for the beta of pension liability makes theinterpretation of such a refinement in the test questionable. Beta of pension liabilityestimate varies, depending on the estimation method. Adding to the complication,disagreements could arise about the true benchmark with which to compare pensionliability, and large cross-sectional variation could be found in individual pension planliability duration, which we do not observe. Such variation could be influenced by a varietyof characters of the plans: age of the retiree and current employees, accumulated benefit,etc. Therefore, compared with the precision of the pension asset beta estimate, pensionliability beta estimates are much noisier. This noise causes a large standard deviation andsensitivity of the point estimates to assumptions about pension liability beta. As aconsequence, we report in each table the corresponding results for two different values ofthe b of pension liability: bPL ¼ 0:18 and bPL ¼ 0:46.14 Given the noise, we emphasize lessthe precise magnitudes of the point estimates, as they typically span a large confidenceinterval. Also for that reason, we focus our discussion on the regressions with singlecoefficient for pension risk, instead of separately estimating the impacts of pension assetand liability risk on firm risk. However, as a robustness check, we also report theregression results allowing for separate estimation of the impacts of pension asset andliability risk on firm risk.
3.2. Restriction to nondistressed firms
As noted before we restrict our attention to firms that are not in financial distress. Firmsin financial distress should be analyzed separately for three important theoretical reasons.First, for distressed firms, the effect of the guarantee provided by the Pension BenefitGuarantee Corporation is potentially large and must be taken into account. Second, thebetas of the debt and equity of firms in distress are nonlinear functions of the value of thefirm. See Merton (1992, Chapters 11, 12). Third, we use the book value of debt as anapproximation for market value. This proxy works reasonably well when the firm is not indistress, because the market value of the debt typically does not deviate significantly from
14We do also report the regression coefficient for a whole range of the assumption of the beta of pension liability
in Fig. 1.

ARTICLE IN PRESSL. Jin et al. / Journal of Financial Economics 81 (2006) 1–26 13
the book value of debt.15 But this is not true for debt of firms in financial distress, whichcan sell at a discount to book value and often trades with an equity-like beta. In fact, whenwe examine the distressed firms, we do not obtain any reliable relation between pensionrisk and firm risk.
We use three empirical measures to identify the financially distressed firms: (1) book tomarket value as a combination measure of both types of distress, in which a higher measureindicates distress, (2) return on investment as a measure of operating business distress, inwhich a lower measure indicates distress, and (3) leverage as a measure of financial distress,in which a higher measure indicates distress.16,17 In each year in our sample, we rank allfirms in the previous year by each measure of distress, and take the decile of firms with themost severe measure as distressed and the rest as nondistressed. We subsequently runregressions for the next year only on firms that are not in distress in the previous year.
3.3. Test results and interpretation
We fit the following panel data regression:
bEþD ¼ aþ bbpension þ e. (8)
To be consistent with a large body of literature in finance, we use the Fama and MacBeth(1973) methodology to compute robust standard errors for the coefficient estimates.Specifically, we first run cross-sectional regressions for each year separately, whilecontrolling for fixed effects at the industry levels using the two-digit Standard IndustrialClassification (SIC) code, and report the time-series averages of the coefficient estimatesand use the time-series standard errors of the average slopes to draw inferences. The Famaand MacBeth methodology is a convenient and conservative way to account for potentialcross-correlations in the residuals. As reported by Fama and French (2002), the Fama andMacBeth standard errors are often two to five times the Ordinary Least Squares standarderrors from pooled panel data regressions that ignore residual cross-correlations.
The Fama and MacBeth procedure does not take into account autocorrelations, thus itis further corrected by following the procedure in Pontiff (1996) to adjust the time-seriesstandard deviations to allow for autocorrelations in the coefficient estimates.18
15A caveat is that even for non-distressed firms, interest rate changes can cause significant changes in the value
of fixed rate debt value. The 0.175 estimate for the beta of debt used throughout the paper is primarily the result of
estimated correlations between interest rate changes and equity returns during the sample period and not the risk
of default. With the widespread use of interest rate swaps by corporations, it is not easy to determine the effect of
interest-rate changes on firm and equity values. We have nevertheless explored this effect and tried to adjust the
book value of debt by the change in the market interest rate to better approximate the market value of debt. Such
adjustments give results that are consistent with those reported in the paper, suggesting that the adjustment for
book to market value difference in debt is not driving the results of the paper. Detailed results are available upon
request.16We recognize that for the Fama and French (1992) model, book-to-market is a systematic risk factor, not
necessarily associated only with distress. As discussed in Section 4.1, excluding or including this group in the firm
sample does not affect our findings.17Return on investment is defined as net income divided by total assets, and financial leverage is defined as debt
divided by total assets, both are defined explicitly in Table 7. Book-to-market ratio is the book value of common
equity plus balance-sheet deferred taxes for fiscal year t�1, over market equity for December of year t�1. Use of these
measures as indicators for financial and operating-business distress can be found in Andrade and Kaplan (1998).18Pontiff (1996) realizes that, in a setting of serious serial correlation, because the slope coefficients in the Fama
and MacBeth regressions are persistent through time, the Fama and MacBeth standard errors could still be biased
ARTICLE IN PRESS
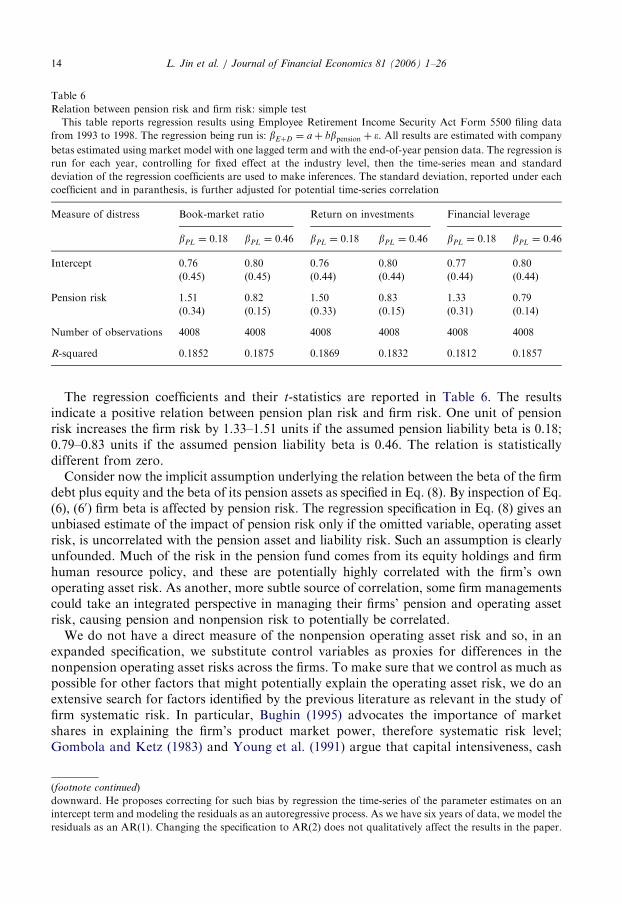
Table 6
Relation between pension risk and firm risk: simple test
This table reports regression results using Employee Retirement Income Security Act Form 5500 filing data
from 1993 to 1998. The regression being run is: bEþD ¼ aþ bbpension þ e. All results are estimated with company
betas estimated using market model with one lagged term and with the end-of-year pension data. The regression is
run for each year, controlling for fixed effect at the industry level, then the time-series mean and standard
deviation of the regression coefficients are used to make inferences. The standard deviation, reported under each
coefficient and in paranthesis, is further adjusted for potential time-series correlation
Measure of distress Book-market ratio Return on investments Financial leverage
bPL ¼ 0:18 bPL ¼ 0:46 bPL ¼ 0:18 bPL ¼ 0:46 bPL ¼ 0:18 bPL ¼ 0:46
Intercept 0.76 0.80 0.76 0.80 0.77 0.80
(0.45) (0.45) (0.44) (0.44) (0.44) (0.44)
Pension risk 1.51 0.82 1.50 0.83 1.33 0.79
(0.34) (0.15) (0.33) (0.15) (0.31) (0.14)
Number of observations 4008 4008 4008 4008 4008 4008
R-squared 0.1852 0.1875 0.1869 0.1832 0.1812 0.1857
L. Jin et al. / Journal of Financial Economics 81 (2006) 1–2614
The regression coefficients and their t-statistics are reported in Table 6. The resultsindicate a positive relation between pension plan risk and firm risk. One unit of pensionrisk increases the firm risk by 1.33–1.51 units if the assumed pension liability beta is 0.18;0.79–0.83 units if the assumed pension liability beta is 0.46. The relation is statisticallydifferent from zero.Consider now the implicit assumption underlying the relation between the beta of the firm
debt plus equity and the beta of its pension assets as specified in Eq. (8). By inspection of Eq.(6), (60) firm beta is affected by pension risk. The regression specification in Eq. (8) gives anunbiased estimate of the impact of pension risk only if the omitted variable, operating assetrisk, is uncorrelated with the pension asset and liability risk. Such an assumption is clearlyunfounded. Much of the risk in the pension fund comes from its equity holdings and firmhuman resource policy, and these are potentially highly correlated with the firm’s ownoperating asset risk. As another, more subtle source of correlation, some firm managementscould take an integrated perspective in managing their firms’ pension and operating assetrisk, causing pension and nonpension risk to potentially be correlated.We do not have a direct measure of the nonpension operating asset risk and so, in an
expanded specification, we substitute control variables as proxies for differences in thenonpension operating asset risks across the firms. To make sure that we control as much aspossible for other factors that might potentially explain the operating asset risk, we do anextensive search for factors identified by the previous literature as relevant in the study offirm systematic risk. In particular, Bughin (1995) advocates the importance of marketshares in explaining the firm’s product market power, therefore systematic risk level;Gombola and Ketz (1983) and Young et al. (1991) argue that capital intensiveness, cash
(footnote continued)
downward. He proposes correcting for such bias by regression the time-series of the parameter estimates on an
intercept term and modeling the residuals as an autoregressive process. As we have six years of data, we model the
residuals as an AR(1). Changing the specification to AR(2) does not qualitatively affect the results in the paper.

ARTICLE IN PRESS
Table 7
List of control variables
Variable Calculation Compustat item numbers
Market share by value Calculated using market value and the
industry classification codes
DATA24*DATA25
Market share by sales Calculated using total sales and the
industry classification codes
DATA12
Capital intensiveness Current assets/total assets DATA4/DATA6
Cash position Cash and short-term investments/total
assets
DATA1/DATA6
Financial leverage Debt/total assets (Data9+Data34)/DATA6
Growth rate Log (total assets/lagged total assets) Log(DATA6/DATA6_lag)
Liquidity Current assets/current liabilities DATA4/DATA5
Return on investment Net income/total assets DATA172 / DATA6
Firm size Log (total assets) Log(DATA6)
Research and development Research and development expense/
total assets
DATA46/DATA6
Advertisement Advertising expense/total assets DATA45/DATA6
L. Jin et al. / Journal of Financial Economics 81 (2006) 1–26 15
position, and return on investment could potentially explain firm beta; Rosenberg andMcKibben (1973) and Rosett (2001), among others, point out that financial leverage couldaffect firm risk level; Beaver et al. (1970) and Young et al. (1991) propose the use of growthrate of the firm assets and the liquidity of firms; Beaver et al. (1970), Rosenberg andMcKibben (1973), and Reinganum (1982) argue for the importance of firm size inexplaining firm beta; and Chan et al. (2001) argue that research and development andadvertisement affect stock returns systematically and therefore should be part of the firmsystematic risk. By using these variables in an expanded specification, we can also see if oursignificant findings in the univariate analysis of pension fund risk recognition by themarket in Eq. (8) are just a surrogate for the variables that were used in earlier studies totest whether pension plan value is recognized in a firm’s stock price. That is not the case.
The list of control variables and the detailed procedure to construct them is in Table 7.The results of the regression with control variables are listed in Table 8, which reports
explicitly only the coefficient estimates and their significance for the pension plan riskvariables as in Eq. (8). We also report the estimates of coefficients for all control variables.
The coefficient on pension risk is slightly different, but still statistically significant. Thepoint estimate of the coefficient ranges from 0.85 when the assumed bpension_liability is 0.18to 1.22 when the assumed bpension_liability is 0.46. This is not significantly higher than oneminus the corporate tax rate.19
19The reason for a regression coefficient to be higher than one minus the tax rate could be the fact that many
firms are overfunded during the 1993–1998 period, thus according to the discussion in Bulow et al. (1987) their
funding constraint is binding. Burlow, Morck, and Summers argued that, if the pension plan reached funding
ceiling and the firm is otherwise unable to contribute further to the pension plan, and if that increase in the
pension asset value (through appreciation of market value of pension assets) is never forced to be taken out, so
that the plan could be overfunded forever, then, for each dollar increase in plan asset value, the firm value
increases by $1. To see this, assume the tax rate is t, and firm pre-tax investment return is r. Then, for a $1 increase
in the market value of pension assets, (1�t) of firm value is created immediately because pension assets are pre-tax
and can be converted to firm asset at the rate of (1�t). Also, because the $1 in the pension plan earns returns of $r

ARTICLE IN PRESS
Table 8
Relation between pension risk and firm risk, nondistressed firms only
This table reports regression results using Employee Retirement Income Security Act (ERISA) Form 5500 filing
data from 1993 to 1998. The regression being run is bEþD ¼ aþ bbpension þ ccontrolþ e. All results are estimated
with company betas estimated using market model with one lagged term and with the end-of-year pension data.
The regression is run for each year, controlling for fixed effect at the industry level, then the time-series mean and
standard deviation of the regression coefficients are used to make inferences. The standard deviation, reported
under each coefficient and in paranthesis, is further adjusted for potential time-series correlation
Measure of distress Book–market ratio Return on investments Financial leverage
bPL ¼ 0:18 bPL ¼ 0:46 bPL ¼ 0:18 bPL ¼ 0:46 bPL ¼ 0:18 bPL ¼ 0:46
Intercept �0.04 �0.02 �0.37 �0.34 0.11 0.13
(0.44) (0.44) (0.42) (0.42) (0.43) (0.43)
Pension risk 1.22 0.85 1.12 0.88 1.12 0.84
(0.22) (0.13) (0.21) (0.12) (0.21) (0.13)
Market share by value 10.64 10.67 7.92 7.85 10.17 10.14
(1.03) (1.03) (1.02) (1.02) (1.00) (0.99)
Market share by sales �9.65 �9.60 �6.68 �6.45 �8.50 �8.38
(1.33) (1.33) (1.30) (1.30) (1.23) (1.23)
Capital intensiveness 0.38 0.42 0.25 0.28 0.35 0.38
(0.15) (0.14) (0.14) (0.14) (0.15) (0.15)
Cash position 0.32 0.30 �0.22 �0.24 0.19 0.17
(0.24) (0.23) (0.22) (0.22) (0.23) (0.23)
Financial leverage �0.01 �0.02 �0.08 �0.10 �0.46 �0.48
(0.10) (0.10) (0.10) (0.10) (0.13) (0.13)
Growth rate �0.09 �0.13 0.18 0.14 0.12 0.09
(0.08) (0.08) (0.08) (0.08) (0.08) (0.08)
Liquidity �0.03 �0.04 �0.01 �0.01 �0.03 �0.04
(0.01) (0.01) (0.01) (0.01) (0.01) (0.01)
Return on investment 2.70 2.74 7.00 7.07 2.66 2.68
(0.23) (0.23) (0.34) (0.34) (0.21) (0.21)
Firm size 0.08 0.08 0.10 0.10 0.09 0.09
(0.01) (0.01) (0.01) (0.01) (0.01) (0.01)
Advertisement 0.75 0.74 1.10 1.10 1.10 1.09
(0.46) (0.46) (0.45) (0.44) (0.50) (0.50)
Research and development 6.78 6.94 6.35 6.46 7.01 7.14
(0.65) (0.64) (0.66) (0.66) (0.64) (0.64)
Number of observations 4008 4008 4008 4008 4008 4008
R-squared 0.3762 0.3785 0.3132 0.3155 0.3657 0.3689
(footnote continued)
each year forever instead of rð1� tÞ as nonpension assets would earn, there is an annual incremental value of $rt.
The after-tax value to the firm of this extra saving is $rtð1� tÞ each period. This, discounted at the after-tax rate of
return of r(1�t), would give a present value of $t. Thus the total value to firm would be $ð1� tÞ þ $t ¼ $1. The
L. Jin et al. / Journal of Financial Economics 81 (2006) 1–2616

ARTICLE IN PRESS
0
0.2
0.4
0.6
0.8
1
1.2
1.4
1.6
1.8
0 0.1 0.2 0.3 0.4 0.5 0.6 0.7
Pension liability beta assumption
Co
eff
icie
nt
on
pe
ns
ion
ris
k
Estimate Lower bound Upper bound
Fig. 1. Point estimate of pension risk as a function of the assumption about pension liability beta.
L. Jin et al. / Journal of Financial Economics 81 (2006) 1–26 17
Pension liability beta assumptions can have significant impacts on the estimatedcoefficient on pension risk. Fig. 1 reports the estimated coefficient on pension risk as afunction of the assumed bpension_liability. When bpension_liability is increased from 0 to about0.6, the coefficient estimate of pension risk first increases and then decreases. The peakcoefficient estimate of 1.22 is achieved at around bpension_liability ¼ 0.2. The coefficientestimate corresponding to bpension_liability ¼ 0:6 is about 0.68, whereas the coefficientestimate corresponding to bpension_liability ¼ 0:03 is about 0.76.
4. Robustness checks
In this section, we conduct several robustness checks and report the results.
4.1. Distressed firms
Distressed firms are likely to have a distinctly different pattern than nondistressed firms.Thus we re-run the regression analysis specified in Table 8 with the distressed firmssubsample. The results are reported in Table 9.
Inspection of Table 9 shows that the relation between pension risk and firm risk isinsignificant for these firms.
(footnote continued)
above is an extreme case for real-world pension plans. In practice, pension accounting rules typically allows for
smoothing of pension investment gains or losses only over a limited period of time (often 15 years), but probably
not infinitely. The time value of a pension asset appreciation that is slowly amortized over time has less than one-
for-one relation to firm value. Using a marginal tax rate of 46% and assuming 15-year amortization, Bulow et al.
(1987) calculate that the true value of a dollar change in pension asset to firm is approximately $0.72, higher than
the $0.54 implied by (1�t), but lower than $1. The marginal tax rate for 1993–1998 is 34% to 35%, and the
corresponding value of a dollar increase in pension value to firm value would be about $0.80.

ARTICLE IN PRESS
Table 9
Relation between pension risk and firm risk, distressed firm only
This table reports regression results using Employee Retirement Income Securities Act Form 5500 filing data
from 1993 to 1998. The regression being run is bEþD ¼ aþ bbpension þ ccontrolþ e. All results are estimated with
company betas estimated using market model with one lagged term and with the end-of-year pension data. The
regression is run for each year, controlling for fixed effect at the industry level, then the time-series mean and
standard deviation of the regression coefficients are used to make inferences. The standard deviation, reported
under each coefficient and in paranthesis, is further adjusted for potential time-series correlation
Measure of distress Book–market ratio Return on investments Financial leverage
bPL ¼ 0:18 bPL ¼ 0:46 bPL ¼ 0:18 bPL ¼ 0:46 bPL ¼ 0:18 bPL ¼ 0:46
Intercept 0.09 0.10 0.12 0.12 �0.09 �0.10
(0.26) (0.26) (0.47) (0.48) (0.51) (0.51)
Pension risk �0.29 �0.11 �0.25 �0.11 0.01 �0.08
(0.15) (0.09) (0.41) (0.26) (0.58) (0.32)
Market share by value 1.70 1.73 3.07 3.10 8.04 7.91
(2.50) (2.51) (2.34) (2.34) (2.81) (2.82)
Market share by sales 0.75 0.74 �2.98 �2.96 �5.63 �5.52
(1.58) (1.59) (1.90) (1.91) (3.88) (3.89)
Capital intensiveness 0.09 0.07 �0.20 �0.22 0.43 0.43
(0.13) (0.13) (0.30) (0.29) (0.33) (0.33)
Cash position 0.38 0.36 0.80 0.81 �1.83 �1.87
(0.20) (0.21) (0.60) (0.60) (0.83) (0.83)
Financial leverage �0.03 �0.03 0.11 0.11 0.19 0.19
(0.10) (0.10) (0.18) (0.18) (0.23) (0.23)
Growth rate 0.04 0.04 �0.06 �0.06 �0.21 �0.20
(0.06) (0.06) (0.15) (0.15) (0.14) (0.14)
Liquidity �0.01 �0.01 �0.03 �0.03 �0.08 �0.08
(0.01) (0.01) (0.04) (0.04) (0.07) (0.07)
Return on investment 0.00 0.00 0.05 0.05 0.71 0.72
(0.08) (0.08) (0.22) (0.22) (0.31) (0.31)
Firm size 0.00 0.00 0.03 0.03 �0.01 �0.01
(0.01) (0.01) (0.03) (0.03) (0.04) (0.04)
Advertisement �0.90 �0.90 �1.35 �1.35 �0.94 �0.95
(0.68) (0.68) (1.16) (1.16) (0.82) (0.82)
Research and development 0.60 0.53 5.66 5.60 6.67 6.75
(1.05) (1.06) (1.10) (1.10) (1.87) (1.84)
Number of observations 445 445 445 445 445 445
R-squared 0.5125 0.5231 0.5523 0.5378 0.5227 0.5183
L. Jin et al. / Journal of Financial Economics 81 (2006) 1–2618
We also re-run the regressions of Table 8, with the full sample (both distressed andnondistressed firms). While not reported for brevity, the results are qualitatively similar tothose in Table 8. The relation between pension risk and firm risk is still significant and in
ARTICLE IN PRESSL. Jin et al. / Journal of Financial Economics 81 (2006) 1–26 19
the predicted directions. Thus, the a priori choice to exclude distressed firms does notchange the core findings.
4.2. Eliminate the impact of employer security
Many firms in our sample have employer securities in the pension assets. In thepreceding tables we estimate the beta for these stocks and use these to estimate the pensionasset beta. Thus, in the regression specification in Eq. (8), both sides could be affected bythe firm’s equity beta. It is conceivable that an estimation error in firm equity beta wouldtherefore affect both the dependent variable and the independent variable and thus couldcreate potential bias.
To address that concern, we conduct a robustness check in which we remove the impact ofemployer securities from the right-hand side, by subtracting from both sides of Eq. (8) the term
bemployer_stock �$employer_stock_in_pension
E þD
and re-run the regression in Table 8. The results from this robustness check are reported inTable 10.
As can be seen from Table 10, the adjustment on employer security beta does notsignificantly affect the results.
As another robustness check, we estimate Eq. (8) by assuming that employer securityhas a beta of one instead of the estimated equity beta for the firm. The results, unreportedbecause of space considerations, do not qualitatively differ from those in Table 8.
4.3. Filtered tests
One concern with the interpretation of our findings is that there are likely to be manyfirms that have negligible pension assets and liabilities compared with the firm assets. Forthese firms, we would expect that pension risk would not have a first-order impact on theoverall firm risk, especially considering the various other factors that might affect the firmrisk. Including these observations in our regression analysis would not likely addinformation, and thus dilute the fit of the true relation we are attempting to estimate. Withthis in mind, we also run regressions requiring either that pension assets represent greaterthan a certain percentage of the total firm book asset (PA=ðE þDÞ4threshold) or that theproduct of pension asset beta risk and the ratio of pension asset to total asset is greaterthan a specified threshold (bPAPA=ðE þDÞ4threshold). We use threshold levels rangingfrom 2% to 20%, and the results are qualitatively the same.
Table 11 reports the filtered test results for a 2% threshold with nondistressed firms selectedby book-to-market ratio only. Other measures of distress give qualitatively similar results.
Again, our test results support the hypothesis that market seems to react to the risk levelof the pension plan as predicted. A higher pension risk increases the total market risk ofthe firm asset, while a lower pension risk decreases the market risk of the firms.
4.4. Separate coefficient estimate of pension asset and pension liability risk
Even though we believe it to be less interpretable given the large noise in the estimationof pension liability beta, for completeness of our results we also re-run the regression with

ARTICLE IN PRESS
Table 10
Robustness check with impact of employer security removed from pension risk
This table reports regression results using Employee Retirement INcome Securities Act Form 5500 filing data
from 1993 to 1998. The regression being run is bEþD ¼ aþ bbpension þ ccontrolþ e, where we remove the impact
of employer security from both bEþD and cbpension. All results are estimated with company betas estimated using
market model with one lagged term and with the end-of-year pension data. The regression is run for each year,
controlling for fixed effect at the industry level, then the time-series mean and standard deviation of the regression
coefficients are used to make inferences. The standard deviation, reported under each coefficient and in
paranthesis, is further adjusted for potential time-series correlation
Measure of distress Book–market ratio Return on investments Financial leverage
bPL ¼ 0:18 bPL ¼ 0:46 bPL ¼ 0:18 bPL ¼ 0:46 bPL ¼ 0:18 bPL ¼ 0:46
Intercept �0.03 �0.03 �0.35 �0.35 0.12 0.12
(0.45) (0.45) (0.43) (0.43) (0.44) (0.44)
Pension risk 1.17 0.86 1.07 0.88 1.08 0.85
(0.23) (0.14) (0.21) (0.13) (0.21) (0.13)
Market share by value 10.71 10.72 8.06 7.98 10.23 10.19
(1.05) (1.05) (1.04) (1.04) (1.01) (1.01)
Market share by sales �9.71 �9.64 �6.81 �6.57 �8.53 �8.41
(1.36) (1.35) (1.33) (1.33) (1.25) (1.25)
Capital intensiveness 0.36 0.40 0.23 0.26 0.33 0.35
(0.15) (0.15) (0.14) (0.14) (0.15) (0.15)
Cash position 0.29 0.28 �0.23 �0.24 0.17 0.16
(0.24) (0.24) (0.23) (0.23) (0.23) (0.23)
Financial leverage �0.01 �0.02 �0.08 �0.10 �0.45 �0.47
(0.10) (0.10) (0.10) (0.10) (0.14) (0.14)
Growth rate �0.10 �0.13 0.16 0.13 0.11 0.07
(0.08) (0.08) (0.08) (0.08) (0.08) (0.08)
Liquidity �0.03 �0.03 �0.01 �0.01 �0.03 �0.04
(0.01) (0.01) (0.01) (0.01) (0.01) (0.01)
Return on investment 2.63 2.66 6.82 6.89 2.59 2.60
(0.24) (0.24) (0.35) (0.35) (0.22) (0.22)
Firm size 0.08 0.08 0.10 0.10 0.09 0.09
(0.01) (0.01) (0.01) (0.01) (0.01) (0.01)
Advertisement 0.77 0.75 1.11 1.10 1.12 1.11
(0.47) (0.46) (0.45) (0.45) (0.51) (0.50)
Research and development 6.67 6.82 6.24 6.34 6.89 7.01
(0.66) (0.65) (0.68) (0.67) (0.65) (0.65)
Number of observations 4008 4008 4008 4008 4008 4008
R-squared 0.3137 0.3155 0.3693 0.3630 0.3752 0.3726
L. Jin et al. / Journal of Financial Economics 81 (2006) 1–2620
full control variables as in Table 8, while allowing for the pension asset risk and pensionliability risk to have separate impacts on firm risk. The coefficient on pension asset risk inthis regression is not dependent on the assumption about pension liability beta. The

ARTICLE IN PRESS
Table 11
Filtered test results
This table reports regression results using Employee Retirement Income Securities Act Form 5500 filing data
from 1993 to 1998. The regression run is bEþD ¼ aþ bbpension þ ccontrolþ e. All results are estimated with
company betas estimated using market model with one lagged term and with the end-of-year pension data. The
regression is run for each year, controlling for fixed effect at the industry level, then the time-series mean and
standard deviation of the regression coefficients are used to make inferences. The standard deviation, reported
under each coefficient and in paranthesis, is further adjusted for potential time-series correlation
Filter used Measure of distress: book–market ratio
b�PAPA=TA40:02 PA=TA40:02
bPL ¼ 0:18 bPL ¼ 0:46 bPL ¼ 0:18 bPL ¼ 0:46
Intercept �0.36 �0.33 �0.24 �0.23
(0.66) (0.66) (0.52) (0.52)
Pension risk 1.65 1.24 1.32 0.98
(0.37) (0.24) (0.24) (0.15)
Market share by value 11.34 11.33 11.59 11.59
(1.81) (1.81) (1.26) (1.25)
Market share by sales �8.14 �8.12 �10.79 �10.71
(2.40) (2.39) (1.63) (1.63)
Capital intensiveness 0.28 0.36 0.24 0.29
(0.25) (0.25) (0.17) (0.17)
Cash position 1.01 0.97 0.68 0.66
(0.41) (0.41) (0.29) (0.29)
Financial leverage 0.25 0.24 0.03 0.02
(0.17) (0.17) (0.11) (0.11)
Growth rate �0.10 �0.18 �0.07 �0.11
(0.14) (0.14) (0.10) (0.10)
Liquidity �0.06 �0.06 �0.04 �0.04
(0.03) (0.03) (0.02) (0.02)
Return on investment 3.49 3.53 2.70 2.71
(0.38) (0.38) (0.27) (0.27)
Firm size 0.08 0.08 0.08 0.08
(0.02) (0.02) (0.02) (0.02)
Advertisement �0.54 �0.61 0.38 0.33
(0.84) (0.84) (0.53) (0.53)
Research and development 6.50 6.39 6.65 6.74
(1.00) (0.99) (0.74) (0.73)
Number of observations 1508 1508 3136 3136
R-squared 0.4148 0.4216 0.3583 0.3632
L. Jin et al. / Journal of Financial Economics 81 (2006) 1–26 21
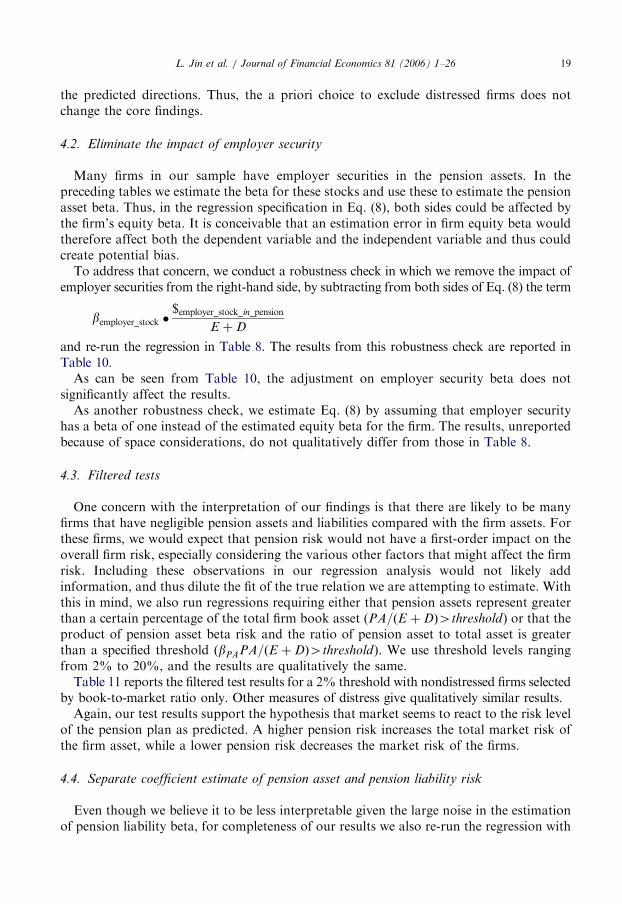
coefficient has a point estimate of 0.85 and a standard deviation of 0.25. However, thepoint estimate of the coefficient on pension liability risk varies considerably with theassumption about pension liability beta. Fig. 2 plots the point estimate as well as a 95%
ARTICLE IN PRESS
-10
-9
-8
-7
-6
-5
-4
-3
-2
-1
00 0.1 0.2 0.3 0.4 0.5 0.6
Pension liability beta assumption
Co
effi
cien
t o
n p
ensi
on
liab
ility
ris
k
Point estimate of coefficient on pension liability risk Lower bound Upper bound
Fig. 2. Point estimate of pension liability risk in separate coefficient regression as a function of the assumption of
pension liability beta.
L. Jin et al. / Journal of Financial Economics 81 (2006) 1–2622
confidence interval of the coefficient of pension liability risk, as a function of the assumedpension liability beta. For example, if pension liability beta is 0.03, the point estimate ofthe coefficient on pension liability risk is �13, with a 95% confidence interval of (�18, �8).However, when pension liability beta is 0.6, the point estimate of the coefficient on pensionliability risk is �0.7, with a 95% confidence interval of (�0.9, �0.4).
5. Conclusion
This paper focuses on an important but previously neglected area of corporate finance.Namely, the impact of off-balance sheet and nonoperating risks on the risk of a firm’sequity and the bias it could induce in estimation of the firm’s cost of capital for capitalbudgeting. The paper’s specific focus is a corporation’s defined-benefit pension plan, whichfor some firms is as large as the market capitalization of the firm sponsoring the plan.Current accounting rules for corporate pensions are complicated and opaque. We examinethe potential biases that can be introduced in the market’s perception of a company’sequity risk by ignoring the risk of its pension assets and liabilities, and we performempirical tests to determine whether such a bias exists in practice.The central empirical finding of the paper is that the stock market seems to
process the available pension information without bias despite the practical difficultiesof deciphering corporate pension accounts. Using the best publicly available US data,our regression tests indicate that equity betas of firms do appear to accurately reflect thebetas of their pension assets and liabilities. That is good news for market efficiency of thecapital markets.The bad news is that standard cost-of-capital calculations used in corporate finance,
which do not distinguish between the operating asset risk and pension plan risk, can
ARTICLE IN PRESSL. Jin et al. / Journal of Financial Economics 81 (2006) 1–26 23
greatly overestimate the discount rate for net present value analysis of operating projects.When calculating a firm’s operating cost of capital for use in performance measurementand in capital budgeting, the standard approach to estimation fails to take proper accountof the pension plan sponsored by the firm. The resulting estimate of operating asset betaand cost of capital are almost always too high. As shown in Table 3, for some well-knowncompanies, the calculated cost of capital can be more than 30% higher than its true value.In such cases, capital projects with positive net present value could be rejected bymanagement.
In this paper, we focus on just one nonoperating risk item of the firm, the companypension plan. Other nonoperating asset-related risk exposures might have a significantimpact on the risk of a firm’s equity and on the calculation of its cost of capital. A perhapsprosaic, but important, one, especially for established hi-tech firms, is the net cash andmarketable securities held by the firm. Off-balance sheet risks of the firm from derivativesand other significant contractual obligations including performance guarantees canpotentially distort cost of capital estimates for its operating businesses. Empirical researchon their actual impact remains a task for the future.
Appendix A. Issues with the data
Despite the amount of different data files that were eventually incorporated,homogeneity exists among the data sources. The pension liabilities data all came fromCompustat. The information is released to the general public through company 10K form,thus market should be able to incorporate this information rapidly.
Following the convention in the empirical finance literature, missing research anddevelopment and advertisement measures are treated as zeros to retain the size of the validsample. Alternatively, we test the specifications with and without research anddevelopment, advertisement, or both, and they do not affect the results qualitatively.
We combine the CRSP returns data and the Compustat data through the mergedCompustat and CRSP database file, by merging PERMNO and GVKEY (the uniqueidentifiers in CRSP and Compustat, respectively). The pension asset data from Form 5500is matched with the Compustat through the employment identification number (EIN). Thisproved better than Committee on Uniform Securities Identification Procedures (CUSIP),as there are a number of redundant CUSIPs. A test of the first 100 data points showed thatthere was remarkably high success rate in the combination (no incorrect matches, althougha handful of companies had merged and had different names in one data set or the other).The only problem is that this method works to the extent that firms have a unique EIN.Often, but not always, when a firm is purchased by another plan, the acquired firms keepits old EIN as all the employment taxes are filed by the subsidiary. Thus larger firms andmore acquisitive firms present a problem. To our knowledge, the only way to partiallyaddress this is to manually search the names of the sponsors, and this works only if it is notan unrelated name of a subsidiary.20
The beta of pension asset is calculated by assigning different asset types to broadcategories (real estate, cash, bonds, equities, etc.), and assigning beta for each asset types.If a company has more than one defined-benefit pension plan, the assets in the multipleplans are summed up. Given that we do not know the exact holdings of the pension assets
20We thank Mitchell Petersen for sharing with us his experience on merging pension data with Compustat data.
ARTICLE IN PRESSL. Jin et al. / Journal of Financial Economics 81 (2006) 1–2624
beyond the designation of asset classes, we are able to use only the average risk level foreach asset class to measure the pension plan risk. Admittedly, if we could get moreaccurate estimate of the holdings of pension assets or more precise measures of each of theassets’ beta, or both, that would likely improve our test results.
Appendix B. Derivation of equations in Section 2
Proof of Eq. (3). If both the value and the risk of pension are ignored, then the estimatedoperating asset risk becomes
bOA ¼D
E þDbD þ
E
E þDbE . (9)
If OA ¼ E þD is defined as the pseudo operating asset, then, from accounting identity,OA ¼ OAþ S and
bOA ¼D
OAbD þ
E
OAbE ¼
1
1þ LbE þ
1
1þ LbD. (10)
Thus
bOA ¼E
OAbE þ
D
OAbD �
PA
OAbPA �
PL
OAbPL
� �
¼OAþ S
OAbOA �
PA
OAðbPA � bPLÞ �
bPL
OAS
¼ bOA þS
OAðbOA � bPLÞ �
PA
OAðbPA � bPLÞ. ð11Þ
The estimation error, defined as eOA ¼ bOA � bOA, is given by
eOA ¼ bOA � bOA
¼ �S
OAðbOA � bPLÞ þ
PA
OAðbPA � bPLÞ
¼PA
OAðbPA � bPLÞ �
S
OA
1
1þ LðbE � bDÞ � ðbPL � bDÞ
� �. ð12Þ
Plugging in the definition of eOA, eOA ¼PAOAðbPA � bPLÞ �
SOA½bOA � bPL þ eOA�. Re-
arranging results in
eOA ¼PA
OAðbPA � bPLÞ �
S
OA½bOA � bPL�. (13)
Thus one sufficient condition for eOAX0 is bPAXbPL;bOAXbPL, and sp0: &
Proof of Eq. (5). From the accounting identity OAþ S ¼ E þD, OA ¼ E þ ðD� SÞ, i.e.,pension deficit is treated as a negative debt.In terms of risk calculation, the miscalculated operating asset beta satisfies
^bOAOA ¼ bEE þ bDðD� SÞ. (14)

ARTICLE IN PRESSL. Jin et al. / Journal of Financial Economics 81 (2006) 1–26 25
Thus the bias in the beta is given by
^eOA ¼^bOA � bOA
¼ bE
E
OAþ bD
ðD� SÞ
OA�
E
OAbE �
D
OAbD þ
PA
OAbPA �
PL
OAbPL
� �
¼PL� PA
OAbD þ
PA
OAbPA �
PL
OAbPL
¼PL
OAðbD � bPLÞ þ
PA
OAðbPA � bDÞ: & ð15Þ
References
Andrade, G., Kaplan, S., 1998. How costly is financial (not economic) distress? Evidence from highly leveraged
transactions that became distressed. Journal of Finance 53 (5), 1443–1493.
Beaver, W., Kettler, P., Scholes, M., 1970. The association between market determined and accounting
determined risk measures. Accounting Review 45 (4), 654–682.
Black, F., 1980. The tax consequences of long-run pension policy. Financial Analyst Journal 36 (4), 21–28.
Bodie, Z., 1990. The ABO, the PBO, and pension investment policy. Financial Analyst Journal 46 (5), 27–34.
Bodie, Z., 1996. What the pension benefit guaranty corporation can learn from the federal savings and loan
insurance corporation. Journal of Financial Services Research 10 (1), 83–100.
Bodie, Z., Papke, L., 1992. Pension fund finance. In: Bodie, Z., Munnell, A. (Eds.), Pensions and the Economy.
University of Pennsylvania Press, Philadelphia, PA, pp. 149–172.
Bodie, Z., Light, J., Morck, R., Taggart, R., 1985. Corporate pension policy: an empirical investigation. Financial
Analysts Journal 41 (5), 10–16.
Bodie, Z., Light, J., Morck, R., Taggart, R., 1987. Funding and asset allocation in corporate pension plans: an
empirical investigation. In: Bodie, Z., Shoven, J., Wise, D. (Eds.), Issues in Pension Economics. National
Bureau of Economic Research Project Report Series. University of Chicago Press, Chicago, Illinois and
London, UK, Chicago and London, pp. 15–44.
Brealey, R., Myers, S., 2002. Principles of Corporate Finance. Irwin/McGraw-Hill, New York.
Bughin, J., 1995. Union-firm bargaining and the influence of product market power and production technology
on systematic risk. Management Science 41 (8), 1267–1278.
Bulow, J., Morck, R., Summers, L., 1987. How does the market value unfunded pension liabilities? In: Bodie, Z.,
Shoven, J., Wise, D. (Eds.), Issues in Pension Economics National Bureau of Economic Research Project
Report Series. University of Chicago Press, Chicago, Illinois and London, UK, pp. 81–104.
Carroll, T., Niehaus, G., 1998. Pension plan funding and corporate debt ratings. Journal of Risk and Insurance 65
(3), 427–443.
Chan, L., Lakonishok, J., Sougiannis, T., 2001. The stock market valuation of research and development
expenditures. Journal of Finance 56 (6), 2431–2456.
Copeland, T., Weston, J., 1992. Financial Theory and Corporate Policy. Addison-Wesley Publishing Company,
New York.
Dimson, E., 1979. Risk measurement when shares are subject to infrequent trading. Journal of Financial
Economics 7 (2), 197–226.
Fama, E., French, K., 1992. The cross-section of expected stock returns. Journal of Finance 47 (2), 427–465.
Fama, E., French, K., 2002. Testing trade-off and pecking order predictions about dividends and debt. Review of
Financial Studies 15 (1), 1–33.
Fama, E., MacBeth, J., 1973. Risk, return, and equilibrium: empirical tests. Journal of Political Economy 81 (3),
607–636.
Feldstein, M., Morck, R., 1983. Pension funding interest rate assumptions, and share prices. In: Bodie, Z.,
Shoven, J. (Eds.), Financial Aspects of the United States Pension System. University of Chicago Press,
Chicago, Illinois and London, UK, pp. 177–207.
Feldstein, M., Seligman, S., 1981. Pension funding, share prices, and national savings. Journal of Finance 36 (4),
801–824.
ARTICLE IN PRESSL. Jin et al. / Journal of Financial Economics 81 (2006) 1–2626
Gombola, M., Ketz, E., 1983. A note on cash flow and classification patterns of financial ratios. Accounting
Review 58 (1), 105–114.
Light, J., 2001. Harvard Management Company. Harvard Business School Case No. 9-201-129. Harvard Business
School Publishing, Boston, MA.
Merton, R., 1992. Continuous-Time Finance Revised edition. Basil Blackwell, Oxford, UK.
Merton, R., 2002. Financial engineering: the underlying discipline for financial innovation and risk management.
Presentation at Massachusetts Institute of Technology, Cambridge, MA.
Merton, R., 2004. The real problem with pensions. Harvard Business Review 82 (12), 21.
Miller, M., 1977. Debt and taxes. Journal of Finance 32 (2), 261–275.
Moore, J., Peskin, M., 2002. Discount benchmarks for defined benefit pension plans. Morgan Stanley, New York.
Oldfield, G., 1977. Financial aspects of the private pension system. Journal of Money, Credit and Banking 9 (1),
48–54.
Pontiff, J., 1996. Costly arbitrage: evidence from closed-end funds. Quarterly Journal of Economics 111 (4),
1135–1151.
Reinganum, M., 1982. A direct test of Roll’s conjecture on the firm size effect. Journal of Finance 37 (1), 27–35.
Rosenberg, B., McKibben, W., 1973. The prediction of systematic and specific risk in common stocks. Journal of
Financial and Quantitative Analysis 8 (2), 317–333.
Ross, S., 1976. The arbitrage theory of capital asset pricing. Journal of Economic Theory 13 (3), 341–360.
Ross, S., Westerfield, R., Jaffe, J., 2002. Corporate Finance. McGraw-Hill/Irwin, New York.
Rosett, J., 2001. Equity risk and the labor stock: the case of union contracts. Journal of Accounting Research 39
(2), 337–364.
Sharpe, W., 1964. Capital asset prices: a theory of market equilibrium under conditions of risk. Journal of Finance
19 (3), 425–442.
Tepper, I., 1981. Taxation and corporate pension policy. Journal of Finance 36 (1), 1–13.
Van Horne, J., Wachowicz, J., 1995. Fundamentals of Financial Management. Prentice-Hall, Englewood Cliffs,
NJ.
Young, S.D., Berry, M., Harvey, D., Page, J., 1991. Macroeconomic forces, systematic risk, and financial
variables: an empirical investigation. Journal of Financial and Quantitative Analysis 26 (4), 559–564.