Embed Size (px)
Citation preview
Do Administrative Leadership Styles Affect Agricultural Education Teachers?
A Research Project to Fulfill Requirements for the Master of Science Degree in
Agriculture and Natural Resource Systems Management The University of Tennessee, Martin
Submitted by: William M. Lea, Jr. August 2011
ii
Acknowledgements I would like to thank Dr. Jimmy Butler, Dr. Barbara Darroch, and Dr. Philip Smartt for
their assistance with completion of my graduate coursework and this research project. I would
also like to thank my family for all their support financially and emotionally; without both I
could not have made it. I would like to recognize my wife Terri; without her patience and
constant source of encouragement there is no way I could have completed this project. I want to
acknowledge my mother Gale Bevis, who provided me with inspiration to complete the work
necessary to obtain this degree. Without the advice and support of my father, Bill Lea, I would
not have finished.
I want to honor both my grandmothers with this paper. Although both are gone now, I
still feel their presence every day. Without their belief in me and support of everything I tried to
do I would not be where I am. My grandmother Ann Livingston allowed me to grow in my own
time, from dropping out of college to completing my masters. Cherry Lea provided me with love
and support to accomplish all my dreams.
iii
Abstract
This study was conducted to determine if administration leadership style affects the
ability of high school agricultural teachers to cover necessary competencies set forth by the
Tennessee Department of Education. Four leadership styles were identified in the study:
transformational, democratic, laissez-faire and autocratic.
To meet the objectives of the study, a survey was developed and distributed via email to
high school agricultural educators in Tennessee. Survey Monkey TM was used to collect the
survey responses. The data were obtained from Survey Monkey TM in Excel format. Responses
were given a point value to determine which style and what level of support the administration
gave to each respondent. Contingency tables and chi square analysis were used to determine if
there was a relationship between school size and support level, between school size and
leadership style, between leadership style and years of teaching, between leadership style and
education level, and between leadership style and gender. These relationships are important in
identifying which schools offer agricultural education teachers the most support.
Transformational leaders were the largest group (61%) identified by survey respondents
and they were the most supportive. The democratic leadership style was the next largest group
followed by the laissez-faire style. Both styles were supportive. The autocratic leaders were not
supportive. The relationship between leadership style and the level of support provided by the
administration was significant (P < 0.0001), primarily because of the lack of support provided by
autocratic leaders. Of those who responded to the survey, 31% of the teachers, the largest age
group, had only one to five years of experience. This is important because teachers with little or
iv
no experience need the most support and benefit from an administration with a transformational
leadership style.
In conclusion, the study indicated that administrators can have an impact on agricultural
education teachers and their classes. This information can be useful in determining which
schools are most conducive to teachers looking for employment and current teachers wanting to
change their agricultural education program.
v
Table of Contents
Chapter I – Introduction and General Information ...................................................................1
Introduction ............................................................................................................................1
Statement of Problem ..............................................................................................................1
Chapter II – Review of the Literature .........................................................................................2
Concept of Culture ..................................................................................................................2
Organizational Culture ...........................................................................................................2
School Culture ........................................................................................................................3
Agricultural Education ............................................................................................................5
Leadership Styles and Behavior ..............................................................................................6
Chapter III – Materials and Methods ........................................................................................13
Survey Participants ...............................................................................................................13
Instrument Design .................................................................................................................13
Procedures .............................................................................................................................14
Chapter IV – Results and Discussion .........................................................................................15
Chapter V – Conclusions .............................................................................................................22
Literature Cited ...........................................................................................................................23
Appendix A– Survey Instrument ................................................................................................25
Appendix B – Survey Results .....................................................................................................30
vi
List of Figures
Figure 1. Distribution of ages within survey respondents. ...........................................................18 Figure 2. Distribution of educational credentials of survey respondents ......................................18 Figure 3. Distribution of teaching experience among survey respondents ...................................19 Figure 4. Distribution of school size among survey respondents .................................................19 Figure 5. Distribution of administrative leadership styles as determined from respondents’ answers to questions on leadership style .......................................................................................20 Figure 6. Relationship between leadership style and school size .................................................21 Figure 7. Relationship between leadership style and level of support provided ..........................21
1
CHAPTER I - Introduction and General Information
Introduction
This research project was developed to document how school-level leadership affects the
ability of agricultural education teachers in Tennessee high schools to cover competencies set by
the state department of education. Education in the state faces many new challenges, with high
stakes testing determining the effectiveness of school systems. Teachers are being asked to
utilize classroom instruction time to reinforce areas that will be tested, along with other duties to
ensure student and school success. This study provides insight regarding which administrative
leadership style has the greatest impact on agricultural education and provides adequate
opportunity for agricultural education teachers to provide challenging and innovative learning
experiences for their students. This study also determined if there is a relationship between
school size and leadership style. This research will be valuable in the preparation of new
agricultural education teachers as well as updating current teachers on ways to ensure that course
competencies are covered.
Statement of the Problem
The objective of this study was to determine which administration leadership style has
the greatest impact on agricultural education teachers in Tennessee, and if leadership style
affected the ability of teachers to adequately cover course competencies set by the state.
2
CHAPTER II - Review of Literature
Concept of Culture
According to Deal and Peterson (1990), culture consists of the stable, underlying social
meanings that shape beliefs and behavior over time. Anthropologists first developed the concept
of culture to explain differences among the entire life patterns of societies, tribes and national
groupings. Deal and Peterson (1990) showed that culture is historically rooted and socially
transmitted as a set of deep patterns of thinking. Culture represents ways of acting that give
meaning to human experience and unconsciously dictate how experience is seen, assessed, and
acted on. Culture is a concept that helps people to perceive and understand the complex forces
that work below the surface of human groups and organizations (Deal & Peterson, 1990). The
term culture was established hundreds of years ago, and has the same definition today: culture
includes shared values, beliefs, rituals, ceremonies, traditions, norms, and myths. Common to
many people is culture as it relates to race. The culture of a group can be defined as a pattern of
shared assumptions the group has learned in response to problems of external adaptation and
internal integration that has worked well enough to be considered valid and, therefore, to be
taught to new members as the correct way to perceive, think, and feel in relation to those
problems (Schein, 1985).
Organizational Culture
Organizational cultures are created by leaders (Schein, 1985). According to Schein
(1985), organizational culture has to do with groups that develop group cultures. He summarized
this culture as a pattern of assumptions that are invented, discovered, or developed by a given
3
group. The norms of the culture will change as problems of external adaptation and internal
integration are recognized. Once the norms have worked well enough to be considered valid,
they are taught to new members as the correct way to perceive, think, and feel in relation to those
problems (Schein, 1985). Because of the human need for consistency and order, culture affects
most aspects of an organization – its strategy, its structure, its processes, its reward and control
systems, and its daily routine (Schein, 1990). When culture becomes dysfunctional, leadership is
needed to help the group unlearn some of its cultural assumptions and learn new assumptions.
The discussion of what leadership is could be simplified if we recognized that the unique and
essential function of leadership is the manipulation of culture (Schein, 1990). Without
leadership, groups would not be able to adapt to changing environmental conditions.
School Culture
School culture can be defined as the historically transmitted patterns of meaning that
include the norms, values, beliefs, ceremonies, rituals, traditions, and myths understood, in
varying degrees, by members of the school community (Stolp & Smith, 1994). According to
Deal and Peterson (1990), the concept of culture describes the character of a school as it reflects
deep patterns of values, beliefs, and traditions that have been formed over the course of its
history – the stable, underlying social meaning that shape beliefs and behavior over time. This
system of meaning often shapes what people think and how they act. Barth (2002) defined
school culture as a “complex pattern of norms, attitudes, beliefs, behaviors, values, ceremonies,
traditions and myths that are deeply ingrained in the very core of the organization” (p.7). This
may suggest that a school’s culture has more influence on the life and learning in schools than
school boards, superintendents, other district office administrators and state boards of education.
4
According to Stolp and Smith (1994), other researchers (Deal & Peterson, 1990; Thacker
& McInerney, 1992) have compiled some impressive evidence on school culture. Healthy and
sound school cultures correlate strongly with increased student achievement and motivation, and
with teacher productivity and satisfaction. Fyans and Maehr (1990) reviewed the effects of five
dimensions of school culture: academic challenges, comparative achievement, recognition for
achievement, school community, and perception of school goals. These studies found support
for the proposition that students are more motivated to learn in schools with strong cultures. A
project established to improve elementary student test scores by Thacker and McInerney (1992)
looked at the effects of school culture on student achievement. The project’s key components
were to create a new mission statement, to develop goals based on outcomes for students, to
align the curriculum with those goals, to improve staff development, and to increase building
level decision-making. With this plan in place, the number of students who failed an annual
statewide test dropped by as much as 10 percent.
Schools and other institutions work best when people are committed to certain commonly
held values and are bonded to one another and to the organization by means of key symbols
(Deal & Peterson, 1990). Principals that identify the “heroic” individuals, celebrate milestone
events and accomplishments, and engage in various expressive activities, encourage strong
school cultures that focus upon improving education. The culture of an organization can
influence its productivity, and there is reason to believe that the same cultural dimensions that
account for high performance in business account for high achievement in schools (Deal &
Peterson (1990).
5
Agricultural Education
Agricultural education is an important part of many schools across the state of Tennessee.
In Tennessee, 33,822 students are enrolled in agricultural education, 11% of the total enrollment
in career technical education. During the 2008 – 2009 school year, there were seven agricultural
programs of study offered and 345 approved agriculture programs of study being taught in
Tennessee high schools (The Tennessee Council for Career and Technical Education, 2010).
The number of programs of study increased for the 2009-2010 school year with the addition of
an agricultural education program of study due the increased interest of students wanting to
become teachers. There are total of 13,339 Future Farmers of America (FFA) members in
Tennessee, which is 22% of the total student membership in career technical education
organizations (Tennessee FFA Association, 2010). FFA is not only the largest career technical
organization in Tennessee, it is the largest in the nation with over 500,000 members.
Agricultural education becomes a culture of its own in many schools because of the large
number of students involved in these classes.
Agricultural education instruction is based on a three circle model where each component
is dependent on the other. The components are classroom/laboratory instruction, which is
contextual learning, supervised agriculture experience (SAE) programs, which are work-based
learning programs, and the student leadership organization known as FFA (National FFA
Organization). The ability of the agricultural education teacher to effectively use each part of the
model is dependent on how school leadership directs the culture of the school. There are many
FFA activities that take place outside of school such as state and national conventions. Career
development events, which are extensions of the classroom instruction component, allow FFA
members to compete with other members and often require students to miss class. Instruction in
6
many classes is not limited to the classroom; there are competences that require work in the
agriculture lab, or outside of the school.
Leadership Styles and Behavior
“Leadership is a group phenomenon” (Knezevich, 1984). According to Knezevich
(1984), the most effective leader may be the person who assists in identifying and clarifying
goals, as well as inspiring the group to realize them. Stogdill (1948) determined that traits by
themselves do not make a leader, but the behaviors of the individual in relation to the nature of
the group to be led are important. Research indicates that strong leadership is very important in
maintaining an effective school where high expectations of student learning exist for all students
(Rossow, 1990). Leaders affect the organization by exhibited behaviors. Nomura (1999), a
principal with 25 years of experience at a low-income urban elementary school and at a middle
school, shared what he learned during his tenure. He indicated that the leader has to understand
the culture of the school before any changes can take place.
According to Knezevich (1984), leadership behavior patterns tend to vary with the
problems that need to be addressed, the persons involved, and with other conditions of the
situation. Styles may change, but usually there tends to be a dominant behavior pattern for those
individuals in leadership roles. As indicated by Marzano et al. (2005), a principal affects student
achievement through a number of indirect paths that involve factors such as events, people,
culture, and structures. There are many general leadership characteristics of principals but there
are specific actions that affect student achievement (Marzano et al., 2005). These actions, or
responsibilities, include affirmation, change agent, contingent rewards, communication, culture,
discipline, flexibility, focus, ideals/beliefs, and input. In addition, intellectual stimulation,
7
curriculum/instruction, knowledge of curriculum, monitoring/evaluation, order, outreach,
relationships, resources, situational awareness and visibility are important. According to
Marzano et al. (2005), these 21 responsibilities of principals are behaviors that positively affect
the dependent variables of student behaviors, teacher behaviors, and dropout rates.
There are three leadership styles that have been sustained over time: autocratic,
democratic, and laissez-faire. The autocratic style represents centralized decision-making power
in the leader and reluctance to share the position of power with others. There is no collaboration,
and threat and punishment are part of the negative components of this style. In the democratic
leadership style, there is collaboration between the group and the leader for key policies and the
decision-making process. “Authority and power are shared and not confined to the top echelons”
(Knezevich, 1984 p.67). The laissez-faire leadership style allows for complete freedom of action
to groups or individuals without leader direction or participation. “The primary leadership role is
to provide support services, such as materials and supplies, and to participate only when
requested by the group” (Knezevich, 1984 p.67). Any and all of these approaches may be used
by a leader to direct or influence group productivity depending upon organizational policies and
cultural values.
Through the years, leadership styles have gone through some transitions to include other
behavior patterns in leadership styles. Knezevich (1984) identified four other styles:
manipulative, nomothetic, idiographic, and transactional. There are distinct behaviors for each
style of leadership. In the manipulative style, the leader indicates a request and then appoints a
committee to approve the request. The nomothetic leadership style is task-oriented and places
institutional operating integrity above the necessity for establishing pleasant working
relationships and leader acceptance by members of the social system (Knezevich, 1984). Being
8
more relationship-oriented, the idiographic style gives high priority to enhancing morale,
individual development, and human needs satisfaction. This style may lend itself to more
personal conflicts and leader frustration. Finally, the transactional leadership style is a
combination of nomothetic and the idiographic leadership styles. This leadership style would
facilitate personal self-fulfillment of organization members through their acceptance of the
challenge to increase productivity and recognition for contributions to the goal achievements.
Many researchers (Burns 1978; Beare et al. 1989; Bennis and Nanus 1985) have
addressed the importance of transformational leadership. The transformational principal will
have a clear school vision, help develop shared meaning among members of the school staff
regarding their purposes, and create a high level of commitment to the accomplishment of these
purposes (Campos, 1993). Principals need to be mindful of staff and focus on their level of
motivation and commitment in order to enhance a collaborative school culture (Campos, 1993).
Flexibility, vision, emphasis on personal and individual growth, and facilitating interaction
between teachers appear to be important and essential ingredients of leadership that contribute to
collaboration, motivation and commitment (Campos, 1993). Yuki (1994) indicated that some
theories of transformational leadership examine how leaders change the culture and structure of
the organization to be consistent with management strategies for accomplishing organizational
objectives.
Burns (1978) formed an early concept of transformational leadership. He describes
transforming leadership as a process in which “leaders and followers raise one another to higher
levels of morality and motivation.” (p.20). “Transformational leadership involves shaping,
expressing, and mediating conflict among groups of people in addition to motivating
individuals” (Yuki, 1994, pp. 350-351). The extent to which a leader is transformational is
9
measured primarily in terms of the leader’s effect on followers. Followers of a transformational
leader feel trust, admiration, loyalty, and respect toward the leader and they are motivated to do
more than they originally expected to do. The leader transforms and motivates followers by
making them aware of the importance of task outcomes, inducing them to transcend their own
self-interest for the sake of the organization or team, and activating their higher-order needs
(Yuki, p. 351).
Transformational behaviors were formulated by Bass (1985). He included three
components in transformational leadership: charisma (a process wherein a leader influences
followers by arousing strong emotions and identification with the leader), intellectual stimulation
(a process where leaders increase follower awareness of problems and influence followers to
view problems from a new perspective), and individualized consideration (providing support,
encouragement, and developmental experiences to followers). An additional component,
inspiration, was added from studies with Bass (1985). Inspiration may be defined as the extent to
which a leader communicates an appealing vision, uses symbols to focus subordinate effort, and
models appropriate behaviors.
Bass (1985) viewed transformational leadership as distinct from charismatic leadership in
several respects. According to Bass (1985) “Charisma is a necessary ingredient of
transformational leadership, but by itself it is not sufficient to account for the transformational
process” (Bass 1985, p. 352). Charismatic leaders, as well as their followers, believe they are
superhuman. In organizations with this type of leader, any attempts to transform will not be
successful unless the culture is changed. Bass’s research showed that organizational culture
provides insight into how a leader’s charisma may be institutionalized and the dynamics of
transformational leadership.
10
There are three categories of leadership factors associated with transformational
leadership style, and three outcomes of leadership styles: Transformational leadership style
includes idealized behaviors, inspirational motivation, intellectual stimulation, and
individualized consideration (Bass and Avolio, 1997). These behaviors are known as the five I’s:
Principals with Idealization Attributes instill pride in others for being associated with
them, go beyond self-interest for the good of the group, and act in ways that build others’
respect, display a sense of power and confidence, make personal sacrifices for others’ benefit,
and reassure others that obstacles will be overcome (Bass and Avolio, 1997).
Principals with Idealization Behaviors talk about their most important values and beliefs,
specify the importance of having a strong sense of purpose, consider the moral and ethical
consequences of decisions, emphasize the importance of having a collective sense of mission,
champion exciting new possibilities, and talk about the importance of trusting each other.
Principals with Inspirational Motivation talk optimistically about the future, talk
enthusiastically about what needs to be accomplished, articulate a compelling vision of the
future, express confidence that goals will be achieved, provide an exciting image of what is
essential to consider, and take a stand on controversial issues (Bass and Avolio, 1997).
Principals with Intellectual Stimulation re-examine critical assumptions to question
whether they are appropriate, seek differing perspectives when solving problems, get others to
look at problems from many different angles, suggest new ways of looking at how to complete
assignments, encourage non-traditional thinking to deal with traditional problems, and encourage
rethinking those ideas which have never been questioned before (Bass and Avolio, 1997) .
11
Principals with Individualized Consideration are interested in the individuals. This type
of principal realizes the different needs, goals and strengths of the individual. They listen to
concerns and help develop the individual through teaching and coaching (Bass and Avolio,
1997).
Transactional Leadership Style displays behaviors associated with constructive,
contingent reward and corrective, management by exception. (Bass and Avolio (1997) explained
these behaviors:
In Contingent Reward behaviors, the leader provides others with assistance in exchange
for their efforts, discuss in specific terms who is responsible for achieving performance targets,
make clear what one can expect to receive when performance goals are achieved, express
satisfaction when others meet expectations, clarify what outcomes are expected, and deliver what
is promised in exchange for support (Bass and Avolio, 1997).
In Management-by-Exception (Active) behaviors, the leader focuses attention on
irregularities, mistakes, exceptions, and deviations from standards, concentrate their full attention
on dealing with mistakes, complaints, and failures, keep track of all mistakes, direct their
attention toward failures to meet standards, arrange to know if and when things go wrong, and
watch for any infractions of rules and regulations (Bass and Avolio, 1997).
In Management-by-Exception (Passive) behaviors, the leader fails to interfere until
problems become serious, waits for things to go wrong before taking action, shows a firm belief
in “If it ain’t broke, don’t fix it,” demonstrates that problems must become chronic before taking
action, takes no action until complaints are received, and have to be told what went wrong before
taking any action (Bass and Avolio, 1997).
12
The final leadership style, Laissez-Faire is considered a Non-Transaction style of
leadership. This style is confirmed by the following behaviors: avoid getting involved when
important issues arise, absent when needed, avoid making decisions, delay responding to urgent
questions, avoid dealing with chronic problems, and fail to follow-up request for assistance.
These traits are consistent with Bass and Avolio’s (2000) six factors and descriptors of
transformational, transactional, and laissez-faire leadership styles.
In conclusion, existing research suggests that a principal’s human relations skills, levels
of trust and decision making skills are related to the success of a principal as an educational
leader. Failure to empower subordinates and deal with conflict are often why principals are not
successful as educational leaders. It is important that schools become places where all
stakeholders are engaged in school reform or renewal efforts for improving the schools and
where supervisory support encourages the entire staff to model behaviors that foster a
professional environment. The issue of all stakeholders as a part of these professional
communities must be addressed by principals who wish to improve their leadership skill in
building a more supportive climate that allows all stakeholders to develop to their full potential.
.
13
CHAPTER III - Materials and Methods
Survey Participants
The mailing list for the survey consisted of all the high school agricultural education
teachers in the state of Tennessee. A total of 320 email addresses were used from the state of
Tennessee agricultural education teacher directory. Educational and school demographics of the
population were determined during the survey.
Instrument Design
The survey used in this study was approved by the University of Tennessee at Martin’s
Institutional Review Board(IRB approval number: 11-E054005/Lea,Wil). The participants
completed the survey through an email link that directed them to an Internet-based survey site:
www.surveymonkey.com. The survey consisted of 44 questions/statements. (Appendix A). The
survey questions were designed to determine the administration’s leadership style, and to
indicate what level of support the administration provides agricultural education teachers based
on their responses. A Likert scale of strongly disagree to strongly agree was used where
appropriate. The last part of the survey was used to determine the demographics of the
participants including age, gender, years teaching, years teaching agriculture, school size and
community size. The results of the survey were compiled by Survey Monkey in spreadsheet
format.
14
Procedures
Survey MonkeyTM was used to administer the survey and collect the data for this research.
Survey Monkey kept track of all the responses and those who did not respond were sent two
reminder emails. The participants were emailed a direct link to Survey Monkey to complete the
survey. After the survey was sent, it was determined that the list of teachers had become
outdated. To rectify this error, a second list of teachers was created to include active agricultural
education teachers not emailed in the first mail-out, and another set of emails was sent out. The
response rate was 90 teachers out of 320 emails, approximately 28%. The results were sent to the
author by email and downloaded into Excel. The responses were assigned a point value to
determine leadership style and the effect each teacher felt their administration had on their
classes. A range was determined based on the total points possible for all the questions used to
determine leadership style and effect on the class room. Questions one through eighteen were
used to determine leadership style and questions nineteen through thirty six were used to
determine level of support. A value of one was given to strongly agree, two to agree, three to
neutral, a four to disagree, and five to strongly disagree. The points were totaled for each
participant.
The SAS statistical program was utilized to create contingency tables and to calculate
chi square tests to determine if there was a relationship between leadership style and
demographics of the school. The data were also used to see if there was a relationship between
leadership style and how supportive the administration was.
15
Chapter IV Results and Discussion
Detailed results from the survey can be found in Appendix B. The majority (73.2%) of
the 90 respondents were male while 26.8% of the respondents were female. The ages of the
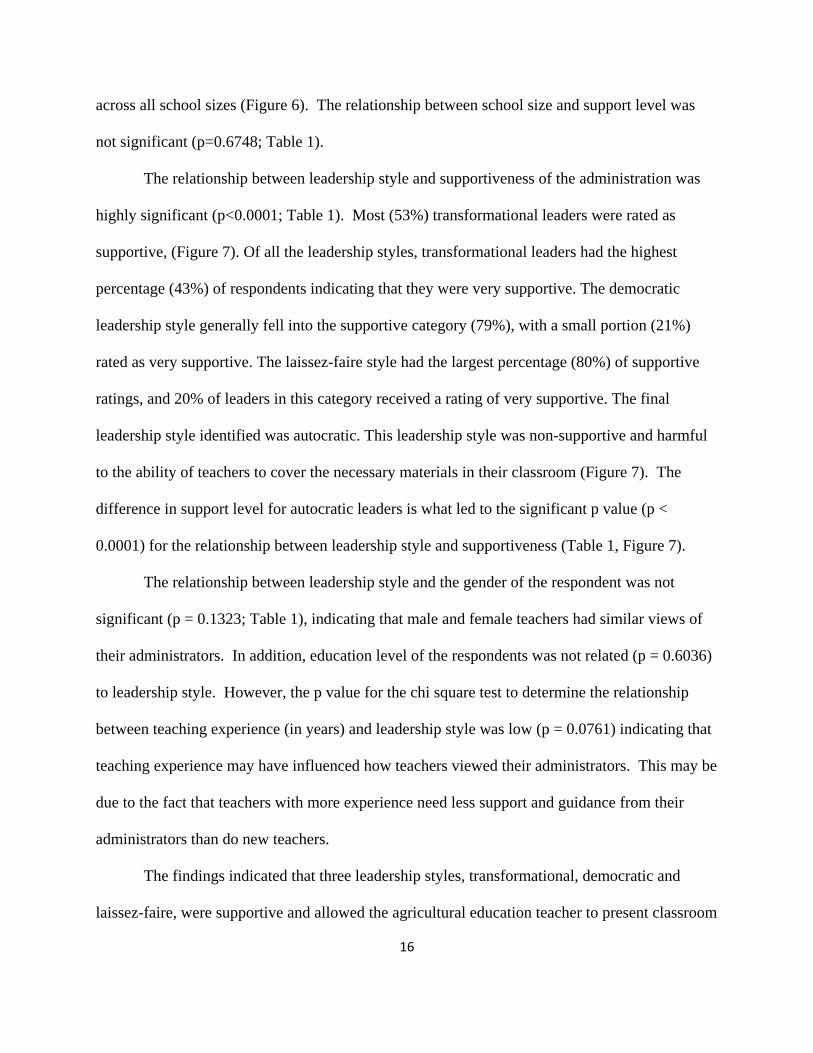
respondents ranged from 20 years to 65 years and over. The group with the highest response rate
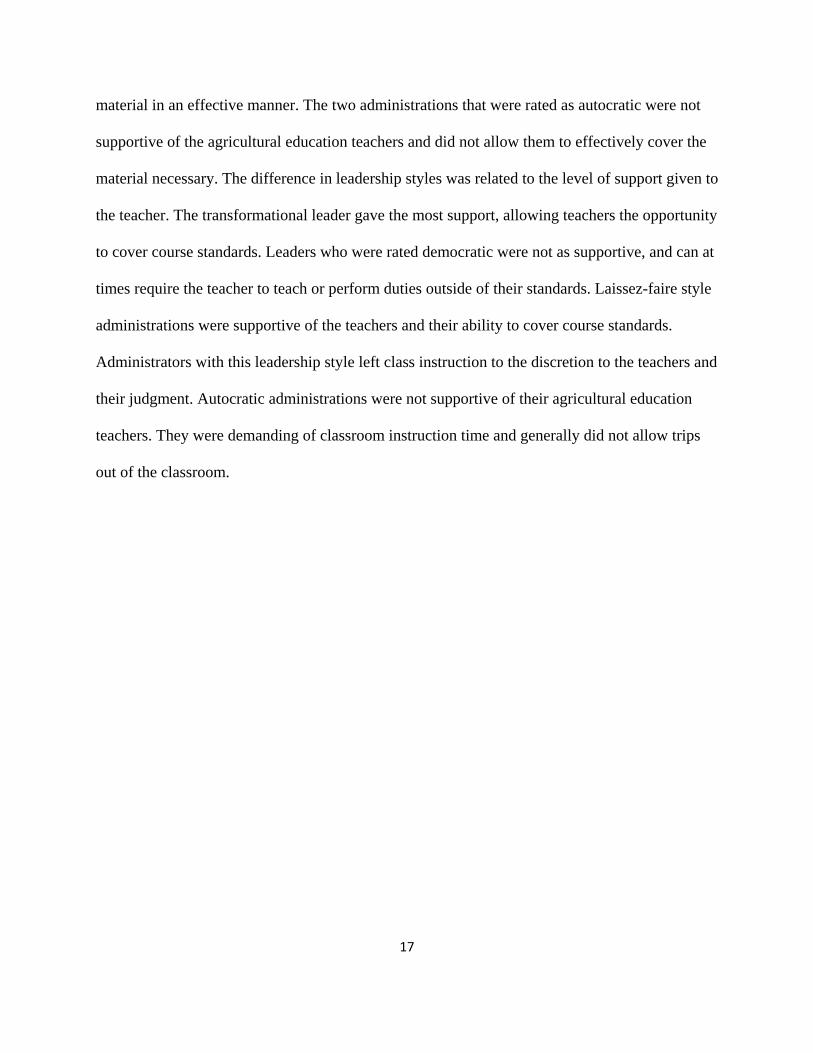
was 31-35 years of age (24.1%; Figure 1). Education levels varied from bachelor’s degree to
education specialists. The groups with the highest level of responses held bachelor’s degrees
(45.2%) or master’s degrees (33.3%; Figure 2).
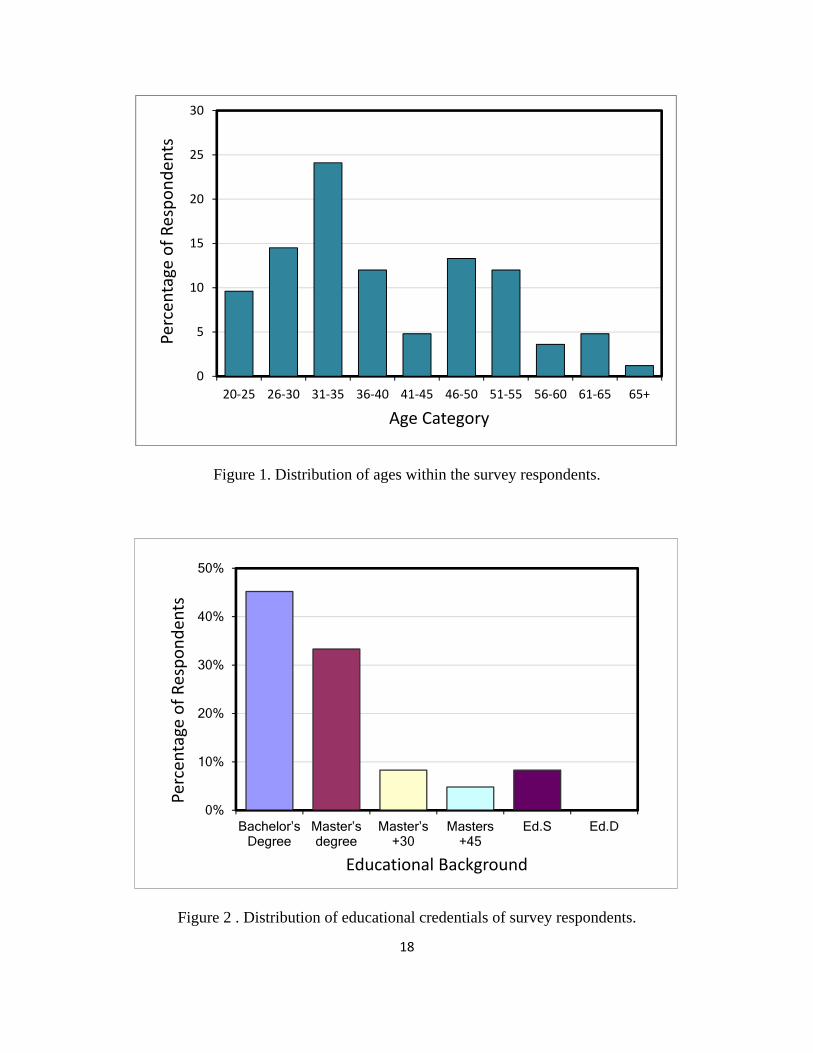
Teaching experience ranged from 1 year to 35 years or more, with the largest group
having 1 to 5 years of experience (29.4%; Figure 3). School size was reported as number of
students, with the majority of respondents coming from schools with 500 to 1000 (33.7%) and
1000 to 1500 students (31.4%; Figure 4). Most schools had two agricultural education teachers
(49.4%), or one agricultural educator (29.4%). Some schools (14.1%) had three agricultural
educators and only 7.1% of respondents came from schools with four or more agricultural
educators.
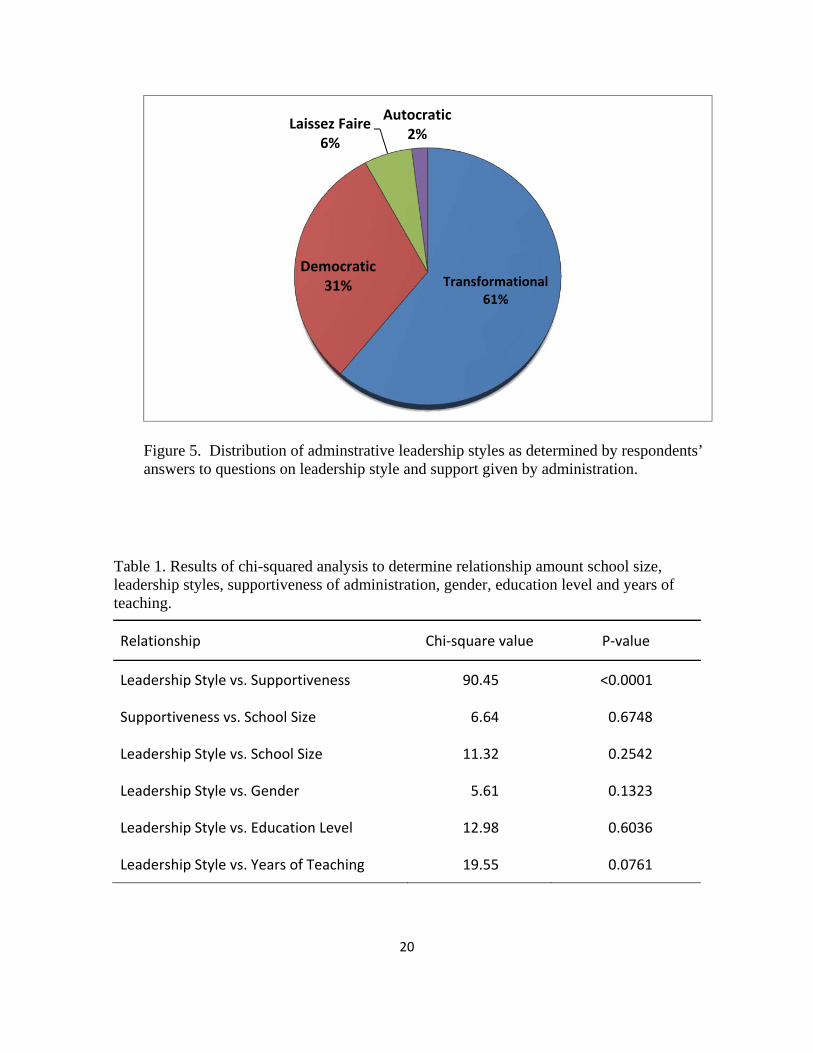
Based on the responses from the survey, four leadership styles were identified: autocratic,
democratic, laissez-faire and transformational (Figure 5). Most teachers described their
administration as transformational (61%). Thirty-one percent of respondents had democratic
leaders, 6% had laissez-faire leaders and only 2% of the teachers in the survey had autocratic
leaders (Figure 5).
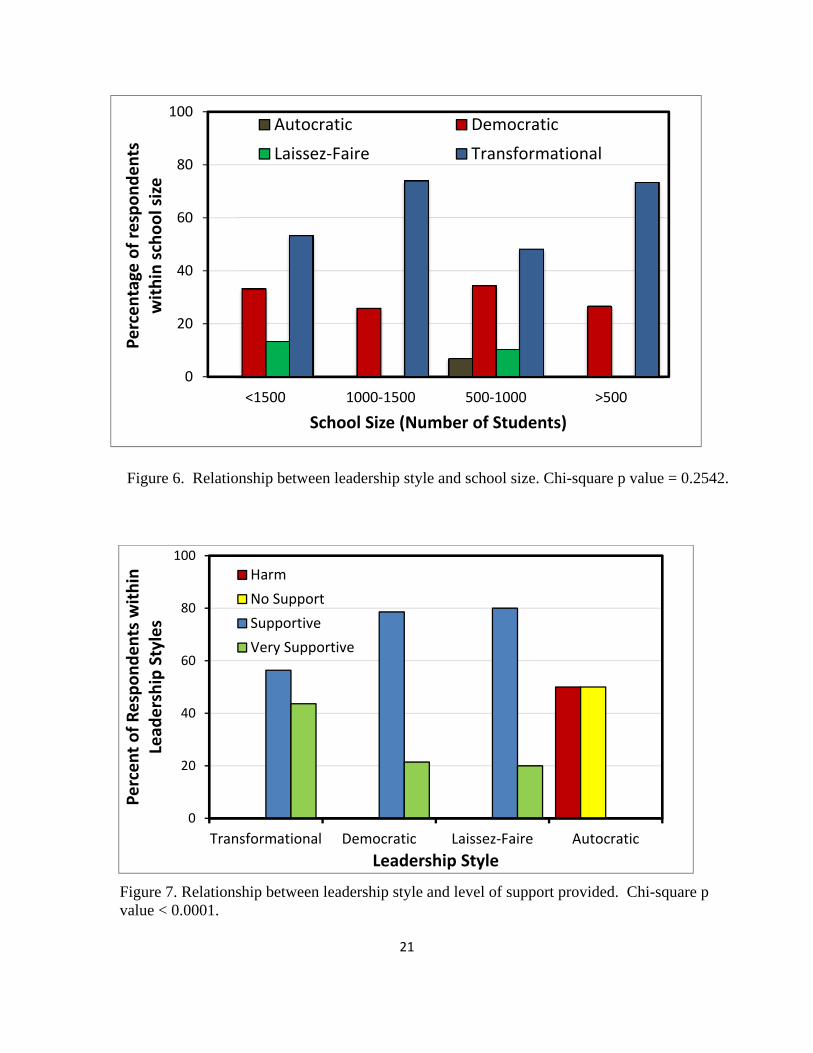
The relationship between school size and the leadership style of administrators as rated
by agricultural education teachers was not significant (p=0.2542; Table 1). Within school size
categories, the percentage of schools with democratic or transformational leaders was similar
16
across all school sizes (Figure 6). The relationship between school size and support level was
not significant (p=0.6748; Table 1).
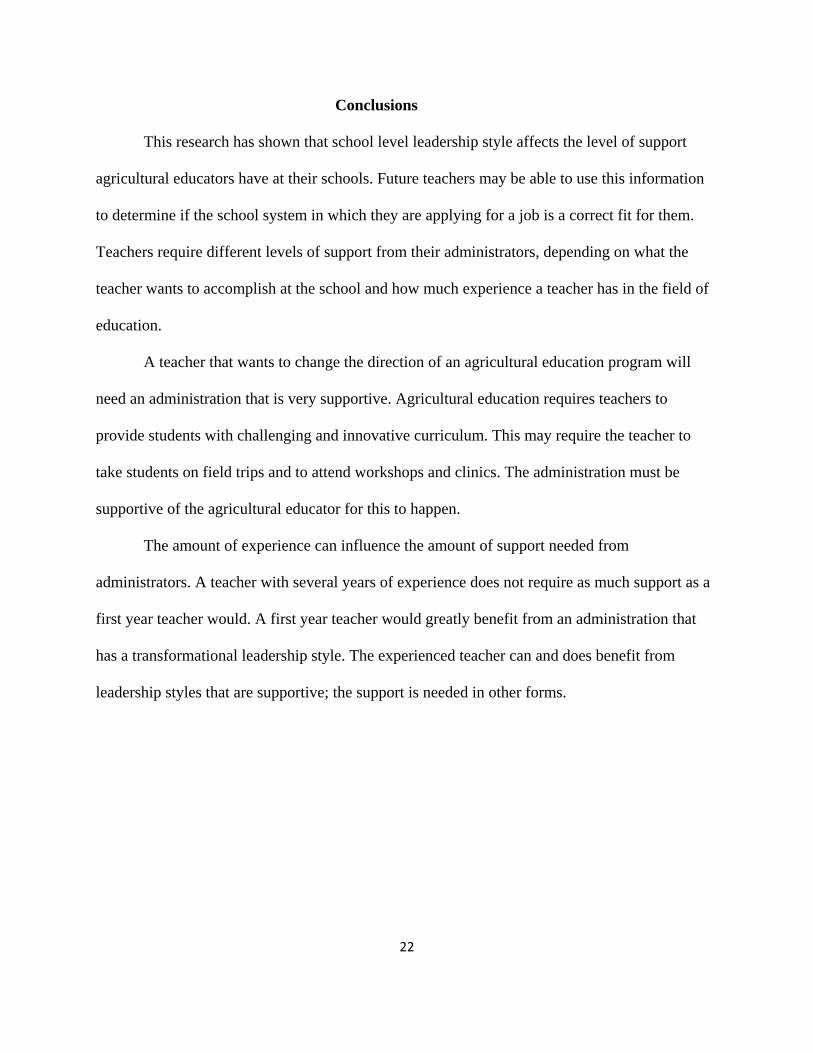
The relationship between leadership style and supportiveness of the administration was
highly significant (p<0.0001; Table 1). Most (53%) transformational leaders were rated as
supportive, (Figure 7). Of all the leadership styles, transformational leaders had the highest
percentage (43%) of respondents indicating that they were very supportive. The democratic
leadership style generally fell into the supportive category (79%), with a small portion (21%)
rated as very supportive. The laissez-faire style had the largest percentage (80%) of supportive
ratings, and 20% of leaders in this category received a rating of very supportive. The final
leadership style identified was autocratic. This leadership style was non-supportive and harmful
to the ability of teachers to cover the necessary materials in their classroom (Figure 7). The
difference in support level for autocratic leaders is what led to the significant p value (p <
0.0001) for the relationship between leadership style and supportiveness (Table 1, Figure 7).
The relationship between leadership style and the gender of the respondent was not
significant (p = 0.1323; Table 1), indicating that male and female teachers had similar views of
their administrators. In addition, education level of the respondents was not related (p = 0.6036)
to leadership style. However, the p value for the chi square test to determine the relationship
between teaching experience (in years) and leadership style was low (p = 0.0761) indicating that
teaching experience may have influenced how teachers viewed their administrators. This may be
due to the fact that teachers with more experience need less support and guidance from their
administrators than do new teachers.
The findings indicated that three leadership styles, transformational, democratic and
laissez-faire, were supportive and allowed the agricultural education teacher to present classroom
17
material in an effective manner. The two administrations that were rated as autocratic were not
supportive of the agricultural education teachers and did not allow them to effectively cover the
material necessary. The difference in leadership styles was related to the level of support given to
the teacher. The transformational leader gave the most support, allowing teachers the opportunity
to cover course standards. Leaders who were rated democratic were not as supportive, and can at
times require the teacher to teach or perform duties outside of their standards. Laissez-faire style
administrations were supportive of the teachers and their ability to cover course standards.
Administrators with this leadership style left class instruction to the discretion to the teachers and
their judgment. Autocratic administrations were not supportive of their agricultural education
teachers. They were demanding of classroom instruction time and generally did not allow trips
out of the classroom.
18
Figure 1. Distribution of ages within the survey respondents.
Figure 2 . Distribution of educational credentials of survey respondents.
0
5
10
15
20
25
30
20‐25 26‐30 31‐35 36‐40 41‐45 46‐50 51‐55 56‐60 61‐65 65+
Percentage of Respondents
Age Category
0%
10%
20%
30%
40%
50%
Bachelor’s Degree
Master’s degree
Master’s +30
Masters+45
Ed.S Ed.D
Percentage of Respondents
Educational Background
19
Figure 3. Distribution of teaching experience among survey respondents.
Figure 4. Distribution of school size among survey respondents.
0%
5%
10%
15%
20%
25%
30%
35%
1-5 6-10 11-15 16-20 21-25 26-30 31-35 35 ormore
Percentage of Respondents
Years of Teaching Experience
0%
5%
10%
15%
20%
25%
30%
35%
40%
500 or less 500 to 1000 1000 to 1500 500 or more
Percentage of Respondents
School Size (number of students)
20
Figure 5. Distribution of adminstrative leadership styles as determined by respondents’ answers to questions on leadership style and support given by administration.
Table 1. Results of chi-squared analysis to determine relationship amount school size, leadership styles, supportiveness of administration, gender, education level and years of teaching.
Relationship Chi‐square value P‐value
Leadership Style vs. Supportiveness 90.45 <0.0001
Supportiveness vs. School Size 6.64 0.6748
Leadership Style vs. School Size 11.32 0.2542
Leadership Style vs. Gender 5.61 0.1323
Leadership Style vs. Education Level 12.98 0.6036
Leadership Style vs. Years of Teaching 19.55 0.0761
Transformational61%
Democratic 31%
Laissez Faire6%
Autocratic2%
21
Figure 6. Relationship between leadership style and school size. Chi-square p value = 0.2542.
Figure 7. Relationship between leadership style and level of support provided. Chi-square p value < 0.0001.
0
20
40
60
80
100
<1500 1000‐1500 500‐1000 >500
Percentage of respondents
within school size
School Size (Number of Students)
Autocratic Democratic
Laissez‐Faire Transformational
0
20
40
60
80
100
Transformational Democratic Laissez‐Faire Autocratic
Percent of Respondents within
Lead
ership Styles
Leadership Style
Harm
No Support
Supportive
Very Supportive
22
Conclusions
This research has shown that school level leadership style affects the level of support
agricultural educators have at their schools. Future teachers may be able to use this information
to determine if the school system in which they are applying for a job is a correct fit for them.
Teachers require different levels of support from their administrators, depending on what the
teacher wants to accomplish at the school and how much experience a teacher has in the field of
education.
A teacher that wants to change the direction of an agricultural education program will
need an administration that is very supportive. Agricultural education requires teachers to
provide students with challenging and innovative curriculum. This may require the teacher to
take students on field trips and to attend workshops and clinics. The administration must be
supportive of the agricultural educator for this to happen.
The amount of experience can influence the amount of support needed from
administrators. A teacher with several years of experience does not require as much support as a
first year teacher would. A first year teacher would greatly benefit from an administration that
has a transformational leadership style. The experienced teacher can and does benefit from
leadership styles that are supportive; the support is needed in other forms.
23
Literature Cited
Barth, R. S. (2002). The culture builder. Educational Leadership, 59, 6-11.
Bass, B. M. (1985). Leadership and performance beyond expectations. New York: Free Press. Bass and Avolio (1997). Full range leadership development: A manual for the multifactor leadership questionnaire. Redwood City CA: Mind Garden, Inc. Bass and Avolio (2000). MLQ Multifactor leadership questionnaire second edition sampler set. Redwood City, CA: Mind Garden, Inc. Beare, H., Caldwell, B. J., & Millikan, R. H. (1989). Creating an excellent school. Some new management techniques. London: Routledge Education. Bennis, W. G., & Nanus, B. (1985). Leaders: The strategies for taking charge. New York: Harper & Row. Burns, J. M. (1978). Leadership. New York: Harper & Row.
Campos, C. A. (1993). Collaborative school cultures: How principals make a difference. School Organization, 13, 119-128. Deal, T. & Peterson, K. (1990). The principal’s role in shaping school culture. Washington, DC: Office of Educational Research and Improvement. Fyans,L.J. & Maehr,M. (1990) School Culture, Student Ethnicity, and Motivation. Urbana, Ill:
The National Center for School Leadership. Knezevich, S. J. (1984). Administration of public education. New York: Harper & Row.
Marzano, R., Waters, T., & McNulty, B. (2005). School leadership that works: From research to results. Alexandria, VA: Association for Supervision and Curriculum Development. Nomura, K. (1999). Learning to lead. Thrust For Educational Leadership, 29, 18-20. Rossow, L. F. (1990). The principalship. Englewood, NJ: Prentice Hall.
Schein, E. H. (1985). Organizational culture and leadership. 2nd Ed. San Francisco: Jossey-Bass. Schein, E.H. (1990). "Organizational Culture." American Psychologist 45 (1990), 109-119.
24
Stogdill, R.M. (1948) Personal Factors Associated with Leadership: A survey of The Literature. Journal of Phychology. 25: 35-71.
Stolp,S. & Smith, S (1994) School Culture and Climate: The role of The Leader. OSSC Bulletin. Eugene, Oregon School Study Council.
Thacker, J & McInerney (1992) Changing Academic Culture to Improve Student Achievement in
Elementary Schools. ERS Spectrum 10 (4) 18-23University: Teachers College Press. Tennessee FFA Association. (2010) Tennessee FFA Association Update, Retrieved January 13, 2011 from http://www.tnffa.org/association/FFA%20update%202010.pdf The Tennessee Council for Career and Technical Education (2010), 2008/2009 Biannual report Retrieved January 13, 2011 from http://www.tn.gov/education/cte_council/doc/biennialreport0809.pdf Yuki, G. (1994). Leadership in organizations. Englewood Cliffs, NY: Prentice Hall.
25
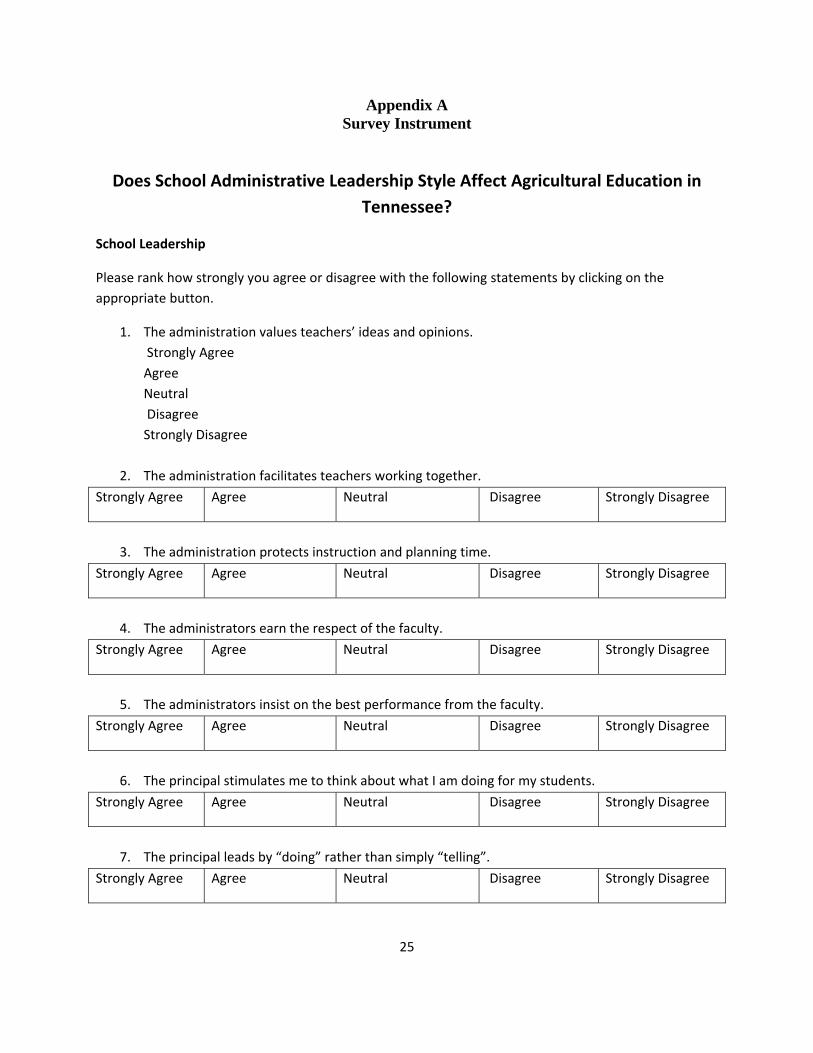
Appendix A Survey Instrument
Does School Administrative Leadership Style Affect Agricultural Education in
Tennessee?
School Leadership
Please rank how strongly you agree or disagree with the following statements by clicking on the
appropriate button.
1. The administration values teachers’ ideas and opinions.
Strongly Agree
Agree
Neutral
Disagree
Strongly Disagree
2. The administration facilitates teachers working together.
Strongly Agree Agree Neutral Disagree Strongly Disagree
3. The administration protects instruction and planning time.
Strongly Agree Agree Neutral Disagree Strongly Disagree
4. The administrators earn the respect of the faculty.
Strongly Agree Agree Neutral Disagree Strongly Disagree
5. The administrators insist on the best performance from the faculty.
Strongly Agree Agree Neutral Disagree Strongly Disagree
6. The principal stimulates me to think about what I am doing for my students.
Strongly Agree Agree Neutral Disagree Strongly Disagree
7. The principal leads by “doing” rather than simply “telling”.
Strongly Agree Agree Neutral Disagree Strongly Disagree
26
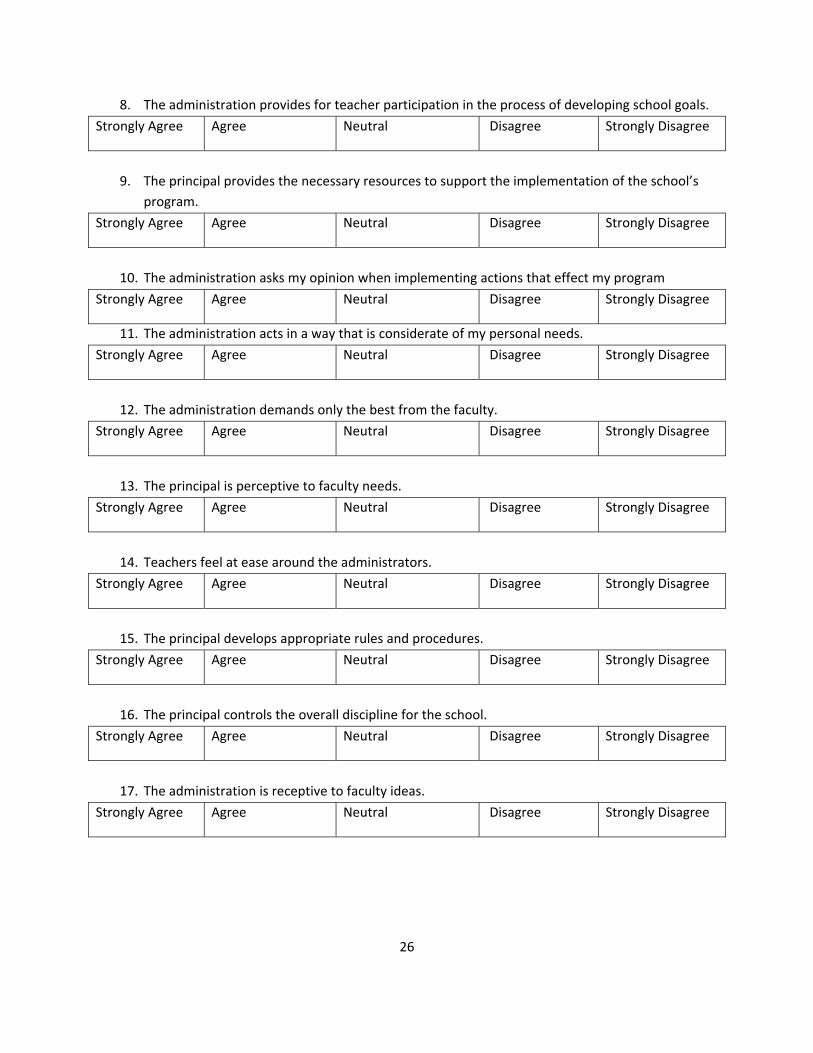
8. The administration provides for teacher participation in the process of developing school goals.
Strongly Agree Agree Neutral Disagree Strongly Disagree
9. The principal provides the necessary resources to support the implementation of the school’s
program.
Strongly Agree Agree Neutral Disagree Strongly Disagree
10. The administration asks my opinion when implementing actions that effect my program
Strongly Agree Agree Neutral Disagree Strongly Disagree
11. The administration acts in a way that is considerate of my personal needs.
Strongly Agree Agree Neutral Disagree Strongly Disagree
12. The administration demands only the best from the faculty.
Strongly Agree Agree Neutral Disagree Strongly Disagree
13. The principal is perceptive to faculty needs.
Strongly Agree Agree Neutral Disagree Strongly Disagree
14. Teachers feel at ease around the administrators.
Strongly Agree Agree Neutral Disagree Strongly Disagree
15. The principal develops appropriate rules and procedures.
Strongly Agree Agree Neutral Disagree Strongly Disagree
16. The principal controls the overall discipline for the school.
Strongly Agree Agree Neutral Disagree Strongly Disagree
17. The administration is receptive to faculty ideas.
Strongly Agree Agree Neutral Disagree Strongly Disagree
27
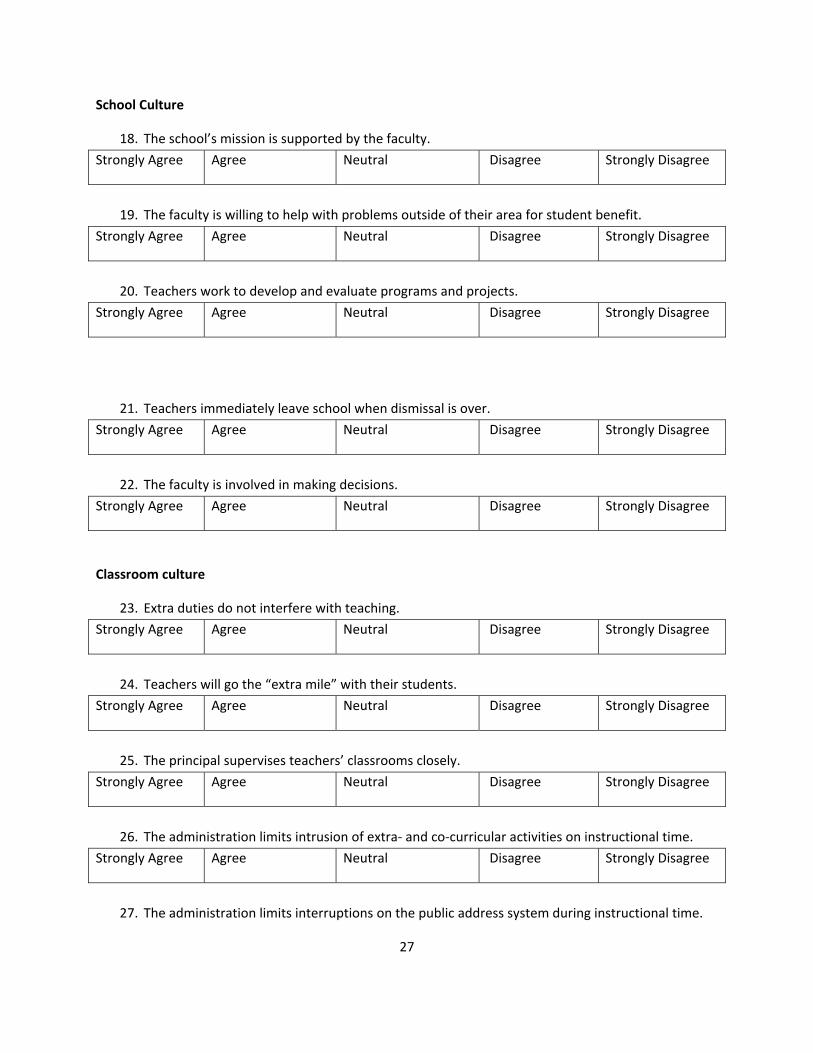
School Culture
18. The school’s mission is supported by the faculty.
Strongly Agree Agree Neutral Disagree Strongly Disagree
19. The faculty is willing to help with problems outside of their area for student benefit.
Strongly Agree Agree Neutral Disagree Strongly Disagree
20. Teachers work to develop and evaluate programs and projects.
Strongly Agree Agree Neutral Disagree Strongly Disagree
21. Teachers immediately leave school when dismissal is over.
Strongly Agree Agree Neutral Disagree Strongly Disagree
22. The faculty is involved in making decisions.
Strongly Agree Agree Neutral Disagree Strongly Disagree
Classroom culture
23. Extra duties do not interfere with teaching.
Strongly Agree Agree Neutral Disagree Strongly Disagree
24. Teachers will go the “extra mile” with their students.
Strongly Agree Agree Neutral Disagree Strongly Disagree
25. The principal supervises teachers’ classrooms closely.
Strongly Agree Agree Neutral Disagree Strongly Disagree
26. The administration limits intrusion of extra‐ and co‐curricular activities on instructional time.
Strongly Agree Agree Neutral Disagree Strongly Disagree
27. The administration limits interruptions on the public address system during instructional time.
28
Strongly Agree Agree Neutral Disagree Strongly Disagree
28. I am able to adequately cover all course competencies set forth by the state Department of
Education.
Strongly Agree Agree Neutral Disagree Strongly Disagree
29. The administrators allow me to present course material in ways I feel are most effective.
Strongly Agree Agree Neutral Disagree Strongly Disagree
30. The administration asks me to teach material other than competencies during class time.
Strongly Agree Agree Neutral Disagree Strongly Disagree
Extracurricular Activities
31. The administration allows students to leave school to attend school related events.
Strongly Agree Agree Neutral Disagree Strongly Disagree
32. The principal supports student activities outside of school.
Strongly Agree Agree Neutral Disagree Strongly Disagree
33. The administration allows teachers to take students on school related field trips.
Strongly Agree Agree Neutral Disagree Strongly Disagree
34. The administration allows teachers to leave school or miss school for contests or other
agriculture education related events.
Strongly Agree Agree Neutral Disagree Strongly Disagree
35. The principal allows students to leave early or miss school for contests or other agriculture
education related events.
Strongly Agree Agree Neutral Disagree Strongly Disagree
29
Demographics
How many students are in your school?
A. 500 or less B. 500 to 1000 C. 1000 to 1500 D.1500 or more
What is the population of your town or community?
A. 5000 or less B 5000 to 10000 C 10000 to 15000 D 15000 or more
How many teachers are in your school?
a.< 10 b. 10‐20 c. 21‐30 d.31‐40 e. 41‐50 f. 50+
How many agriculture education teachers are employed in your school?
A .1 b.2 c.3 d.4 or more
How many years have you been teaching?
A. 1‐5 B. 6‐10 C. 11‐15 D. 16‐20 E. 21‐25 F. 26‐30 G. 31‐35 H. 35+
How many years have you been teaching agriculture?
A. 1‐5 B. 6‐10 C. 11‐15 D. 16‐20 E. 21‐25 F. 26‐30 G. 31‐35 H. 35+
Educational background
A. Bachelor’s Degree B. Master’s degree C. Master’s +30 D. Masters+45 E. Ed.S F. Ed.D
Your Age?
A. 20‐25 B. 26‐30 C. 31‐35 D. 36‐40 E. 41‐45 F. 46‐50 G. 51‐55 H. 56‐60 I. 61‐65
65+
Gender ? A. Female B. Male
30
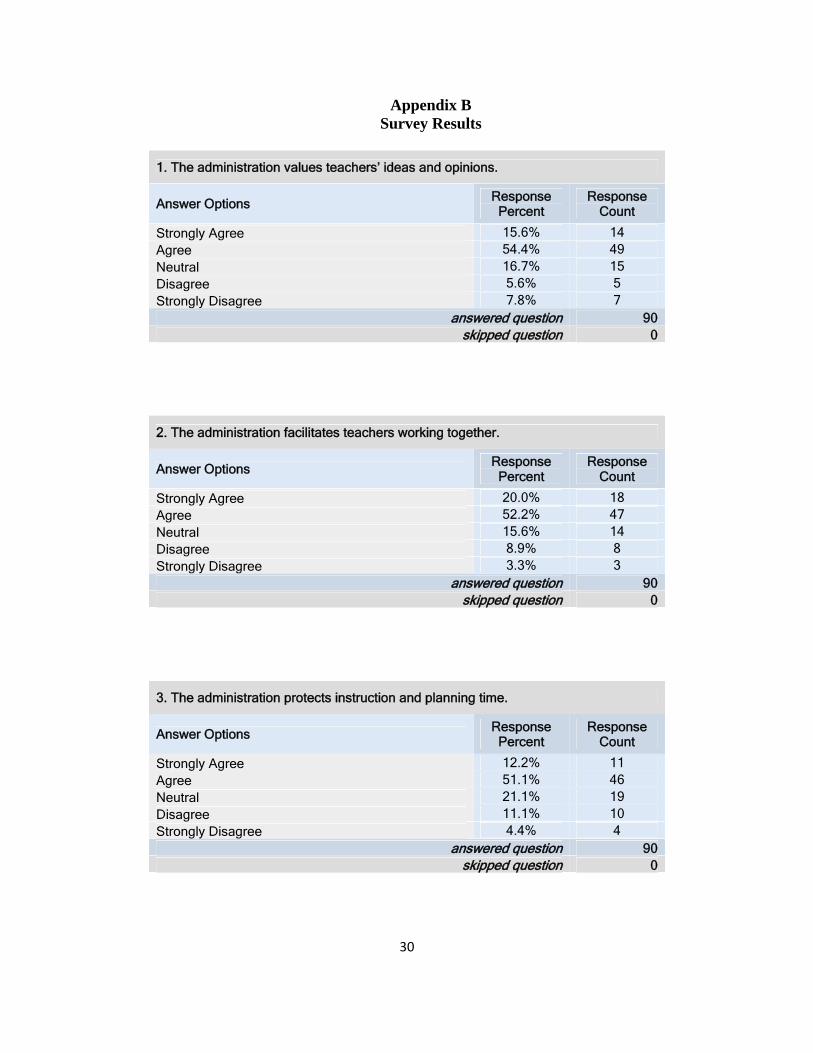
Appendix B Survey Results
1. The administration values teachers’ ideas and opinions.
Answer Options Response Percent
Response Count
Strongly Agree 15.6% 14 Agree 54.4% 49 Neutral 16.7% 15 Disagree 5.6% 5 Strongly Disagree 7.8% 7
answered question 90 skipped question 0
2. The administration facilitates teachers working together.
Answer Options Response Percent
Response Count
Strongly Agree 20.0% 18 Agree 52.2% 47 Neutral 15.6% 14 Disagree 8.9% 8 Strongly Disagree 3.3% 3
answered question 90 skipped question 0
3. The administration protects instruction and planning time.
Answer Options Response Percent
Response Count
Strongly Agree 12.2% 11 Agree 51.1% 46 Neutral 21.1% 19 Disagree 11.1% 10 Strongly Disagree 4.4% 4
answered question 90 skipped question 0
31
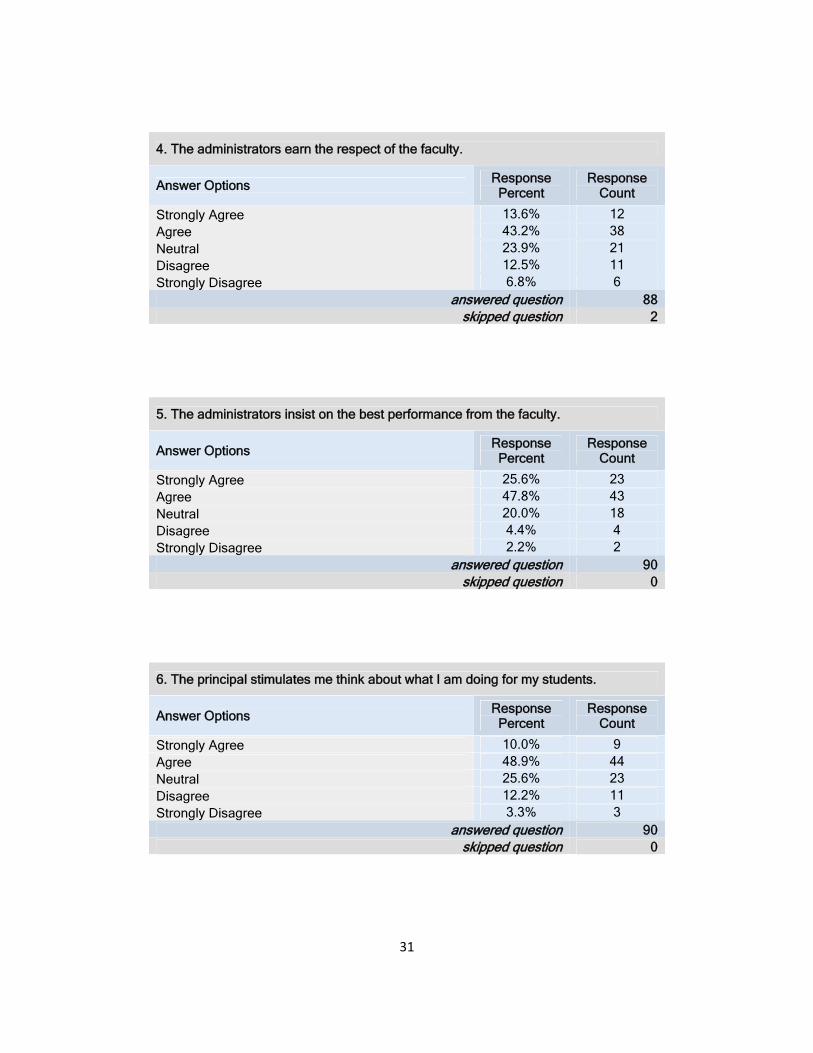
4. The administrators earn the respect of the faculty.
Answer Options Response Percent
Response Count
Strongly Agree 13.6% 12 Agree 43.2% 38 Neutral 23.9% 21 Disagree 12.5% 11 Strongly Disagree 6.8% 6
answered question 88 skipped question 2
5. The administrators insist on the best performance from the faculty.
Answer Options Response Percent
Response Count
Strongly Agree 25.6% 23 Agree 47.8% 43 Neutral 20.0% 18 Disagree 4.4% 4 Strongly Disagree 2.2% 2
answered question 90 skipped question 0
6. The principal stimulates me think about what I am doing for my students.
Answer Options Response Percent
Response Count
Strongly Agree 10.0% 9 Agree 48.9% 44 Neutral 25.6% 23 Disagree 12.2% 11 Strongly Disagree 3.3% 3
answered question 90 skipped question 0
32
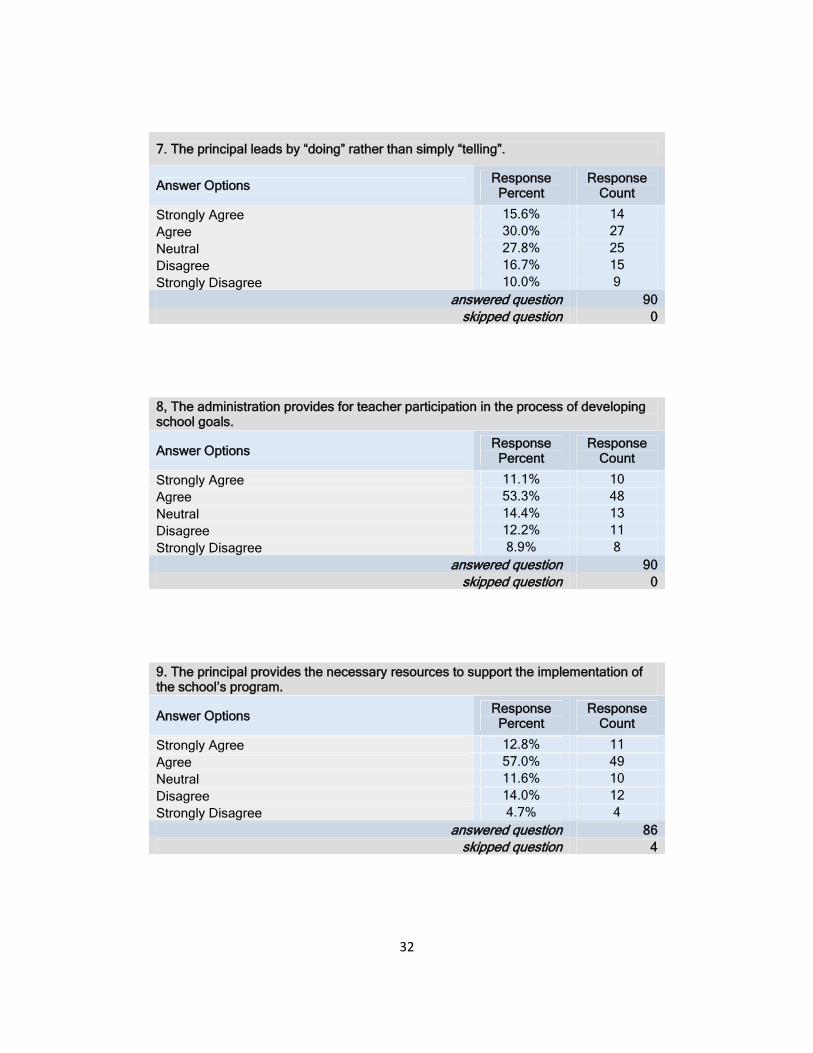
7. The principal leads by “doing” rather than simply “telling”.
Answer Options Response Percent
Response Count
Strongly Agree 15.6% 14 Agree 30.0% 27 Neutral 27.8% 25 Disagree 16.7% 15 Strongly Disagree 10.0% 9
answered question 90 skipped question 0
8, The administration provides for teacher participation in the process of developing school goals.
Answer Options Response Percent
Response Count
Strongly Agree 11.1% 10 Agree 53.3% 48 Neutral 14.4% 13 Disagree 12.2% 11 Strongly Disagree 8.9% 8
answered question 90 skipped question 0
9. The principal provides the necessary resources to support the implementation of the school’s program.
Answer Options Response Percent
Response Count
Strongly Agree 12.8% 11 Agree 57.0% 49 Neutral 11.6% 10 Disagree 14.0% 12 Strongly Disagree 4.7% 4
answered question 86 skipped question 4
33
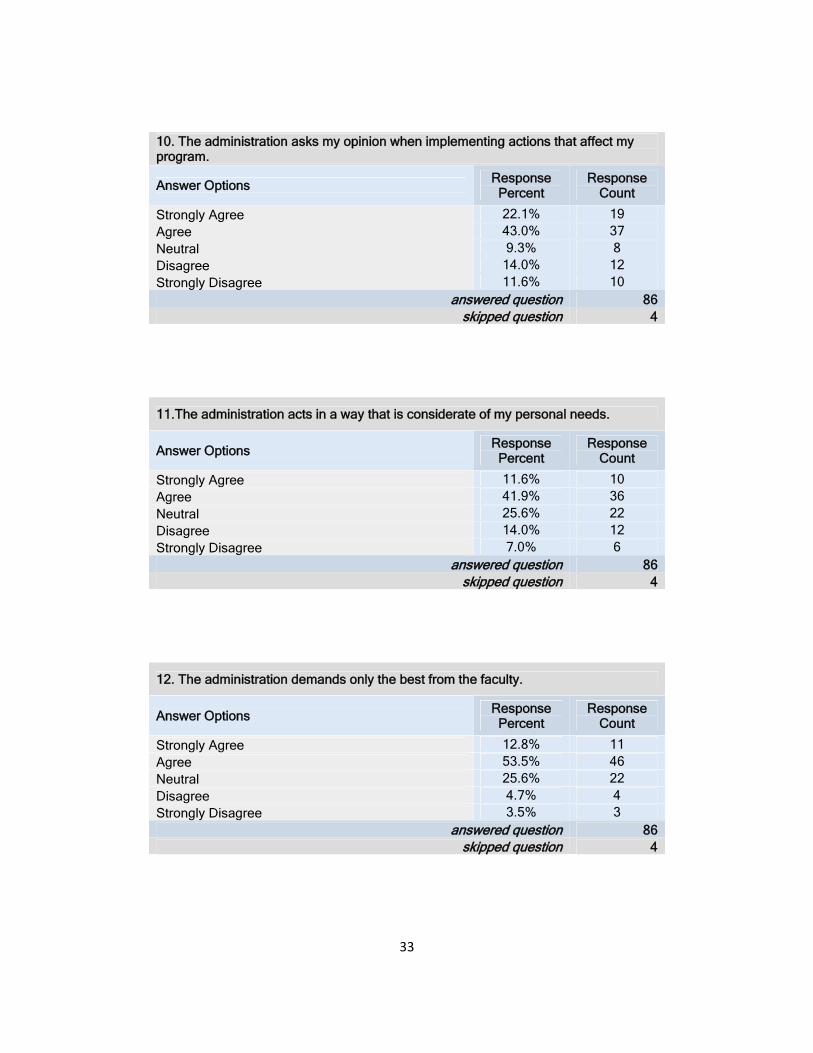
10. The administration asks my opinion when implementing actions that affect my program.
Answer Options Response Percent
Response Count
Strongly Agree 22.1% 19 Agree 43.0% 37 Neutral 9.3% 8 Disagree 14.0% 12 Strongly Disagree 11.6% 10
answered question 86 skipped question 4
11.The administration acts in a way that is considerate of my personal needs.
Answer Options Response Percent
Response Count
Strongly Agree 11.6% 10 Agree 41.9% 36 Neutral 25.6% 22 Disagree 14.0% 12 Strongly Disagree 7.0% 6
answered question 86 skipped question 4
12. The administration demands only the best from the faculty.
Answer Options Response Percent
Response Count
Strongly Agree 12.8% 11 Agree 53.5% 46 Neutral 25.6% 22 Disagree 4.7% 4 Strongly Disagree 3.5% 3
answered question 86 skipped question 4
34
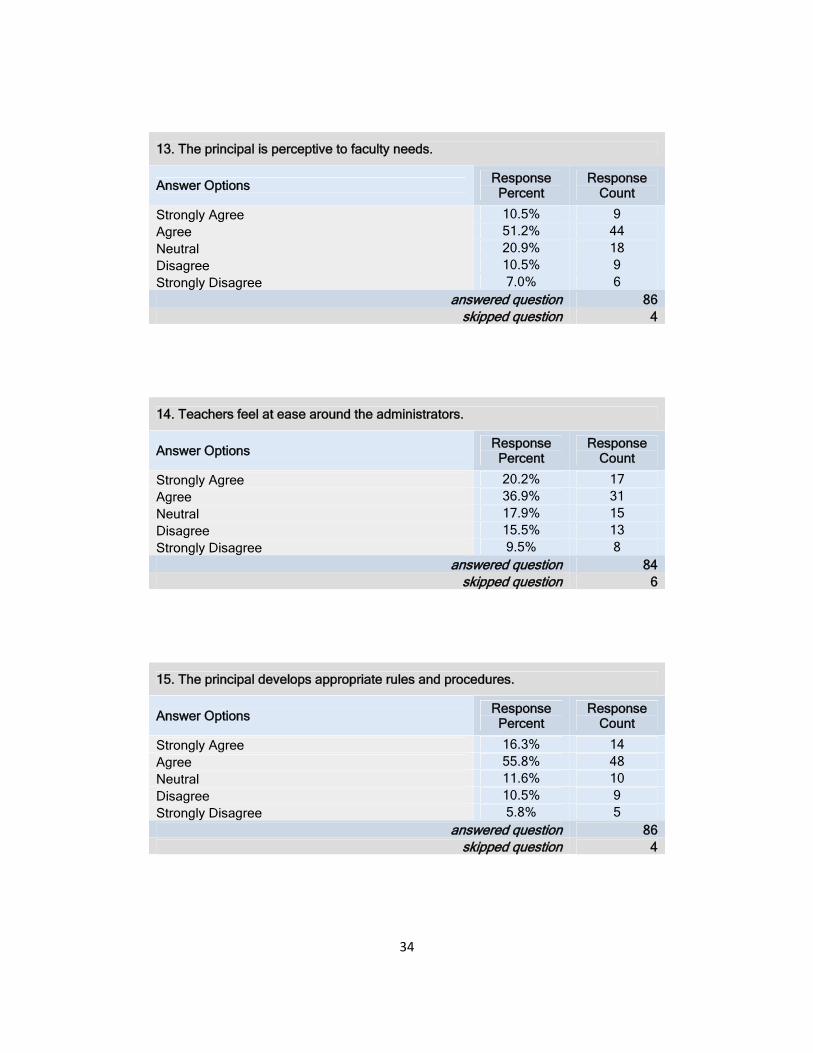
13. The principal is perceptive to faculty needs.
Answer Options Response Percent
Response Count
Strongly Agree 10.5% 9 Agree 51.2% 44 Neutral 20.9% 18 Disagree 10.5% 9 Strongly Disagree 7.0% 6
answered question 86 skipped question 4
14. Teachers feel at ease around the administrators.
Answer Options Response Percent
Response Count
Strongly Agree 20.2% 17 Agree 36.9% 31 Neutral 17.9% 15 Disagree 15.5% 13 Strongly Disagree 9.5% 8
answered question 84 skipped question 6
15. The principal develops appropriate rules and procedures.
Answer Options Response Percent
Response Count
Strongly Agree 16.3% 14 Agree 55.8% 48 Neutral 11.6% 10 Disagree 10.5% 9 Strongly Disagree 5.8% 5
answered question 86 skipped question 4
35
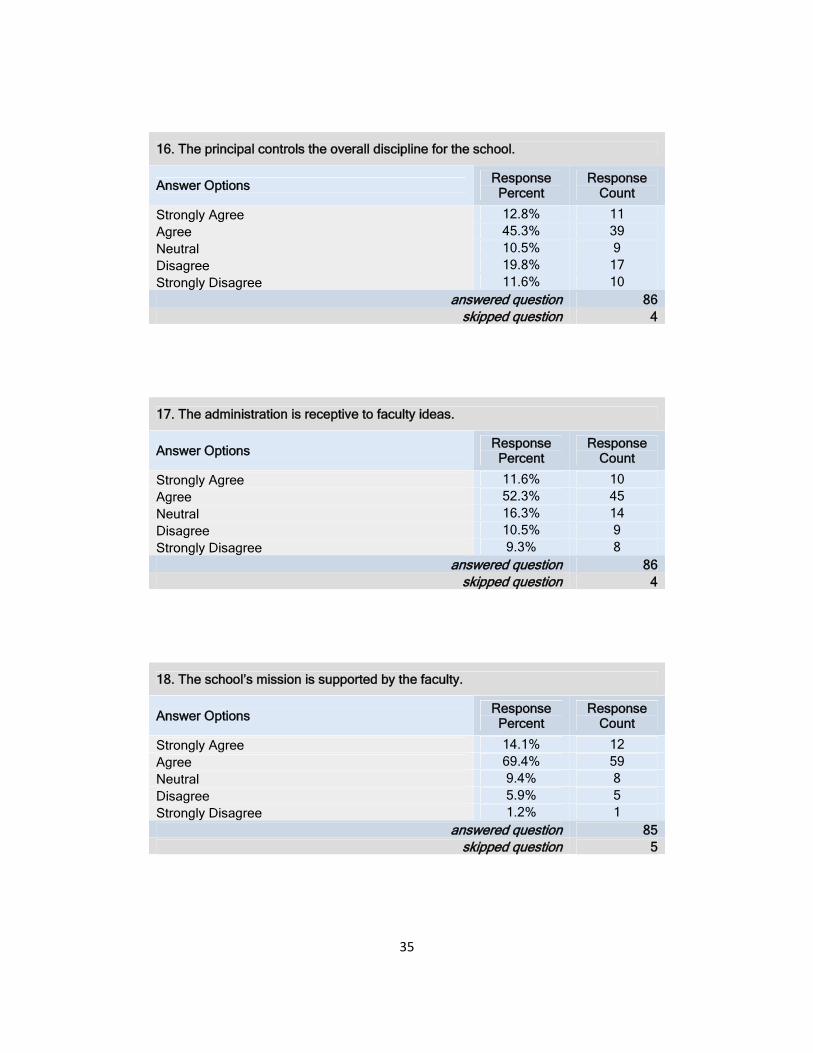
16. The principal controls the overall discipline for the school.
Answer Options Response Percent
Response Count
Strongly Agree 12.8% 11 Agree 45.3% 39 Neutral 10.5% 9 Disagree 19.8% 17 Strongly Disagree 11.6% 10
answered question 86 skipped question 4
17. The administration is receptive to faculty ideas.
Answer Options Response Percent
Response Count
Strongly Agree 11.6% 10 Agree 52.3% 45 Neutral 16.3% 14 Disagree 10.5% 9 Strongly Disagree 9.3% 8
answered question 86 skipped question 4
18. The school’s mission is supported by the faculty.
Answer Options Response Percent
Response Count
Strongly Agree 14.1% 12 Agree 69.4% 59 Neutral 9.4% 8 Disagree 5.9% 5 Strongly Disagree 1.2% 1
answered question 85 skipped question 5
36
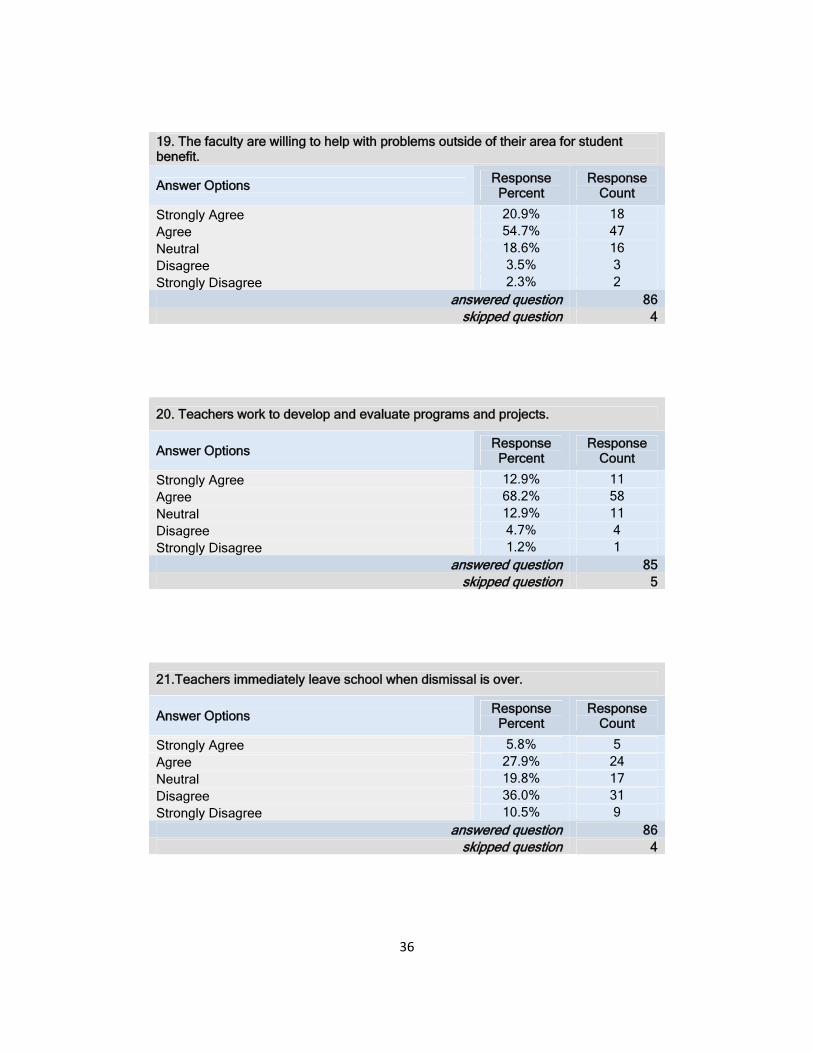
19. The faculty are willing to help with problems outside of their area for student benefit.
Answer Options Response Percent
Response Count
Strongly Agree 20.9% 18 Agree 54.7% 47 Neutral 18.6% 16 Disagree 3.5% 3 Strongly Disagree 2.3% 2
answered question 86 skipped question 4
20. Teachers work to develop and evaluate programs and projects.
Answer Options Response Percent
Response Count
Strongly Agree 12.9% 11 Agree 68.2% 58 Neutral 12.9% 11 Disagree 4.7% 4 Strongly Disagree 1.2% 1
answered question 85 skipped question 5
21.Teachers immediately leave school when dismissal is over.
Answer Options Response Percent
Response Count
Strongly Agree 5.8% 5 Agree 27.9% 24 Neutral 19.8% 17 Disagree 36.0% 31 Strongly Disagree 10.5% 9
answered question 86 skipped question 4
37
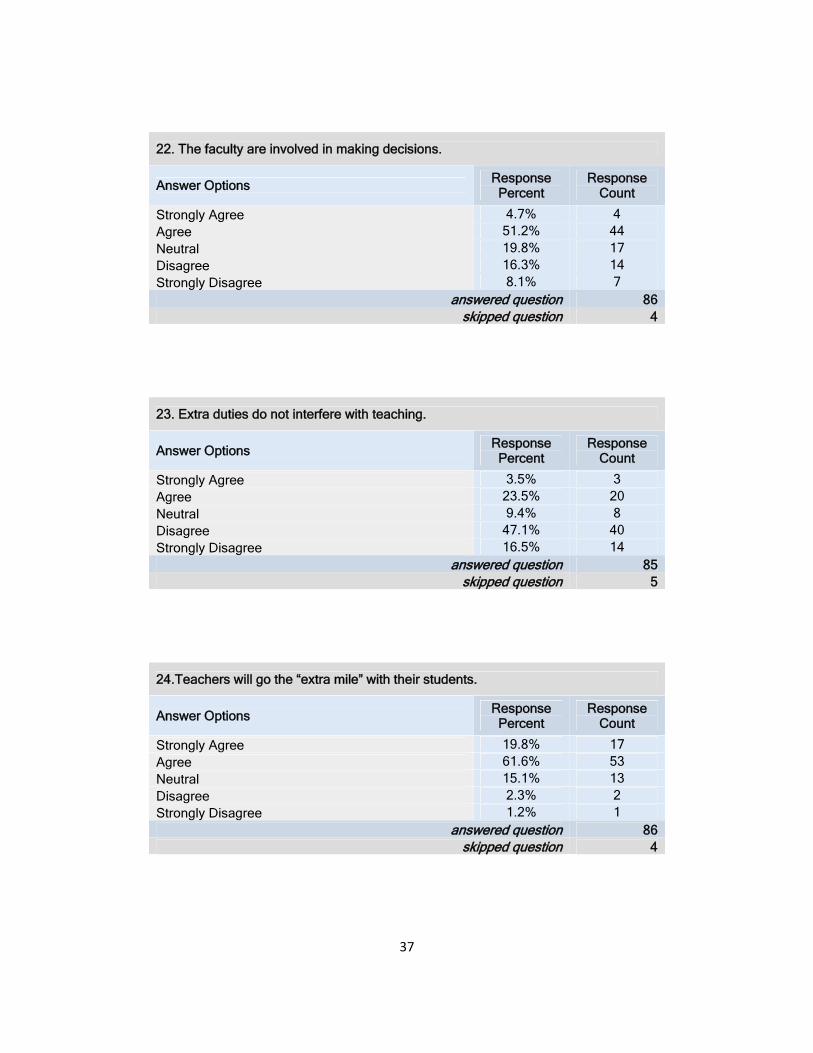
22. The faculty are involved in making decisions.
Answer Options Response Percent
Response Count
Strongly Agree 4.7% 4 Agree 51.2% 44 Neutral 19.8% 17 Disagree 16.3% 14 Strongly Disagree 8.1% 7
answered question 86 skipped question 4
23. Extra duties do not interfere with teaching.
Answer Options Response Percent
Response Count
Strongly Agree 3.5% 3 Agree 23.5% 20 Neutral 9.4% 8 Disagree 47.1% 40 Strongly Disagree 16.5% 14
answered question 85 skipped question 5
24.Teachers will go the “extra mile” with their students.
Answer Options Response Percent
Response Count
Strongly Agree 19.8% 17 Agree 61.6% 53 Neutral 15.1% 13 Disagree 2.3% 2 Strongly Disagree 1.2% 1
answered question 86 skipped question 4
38
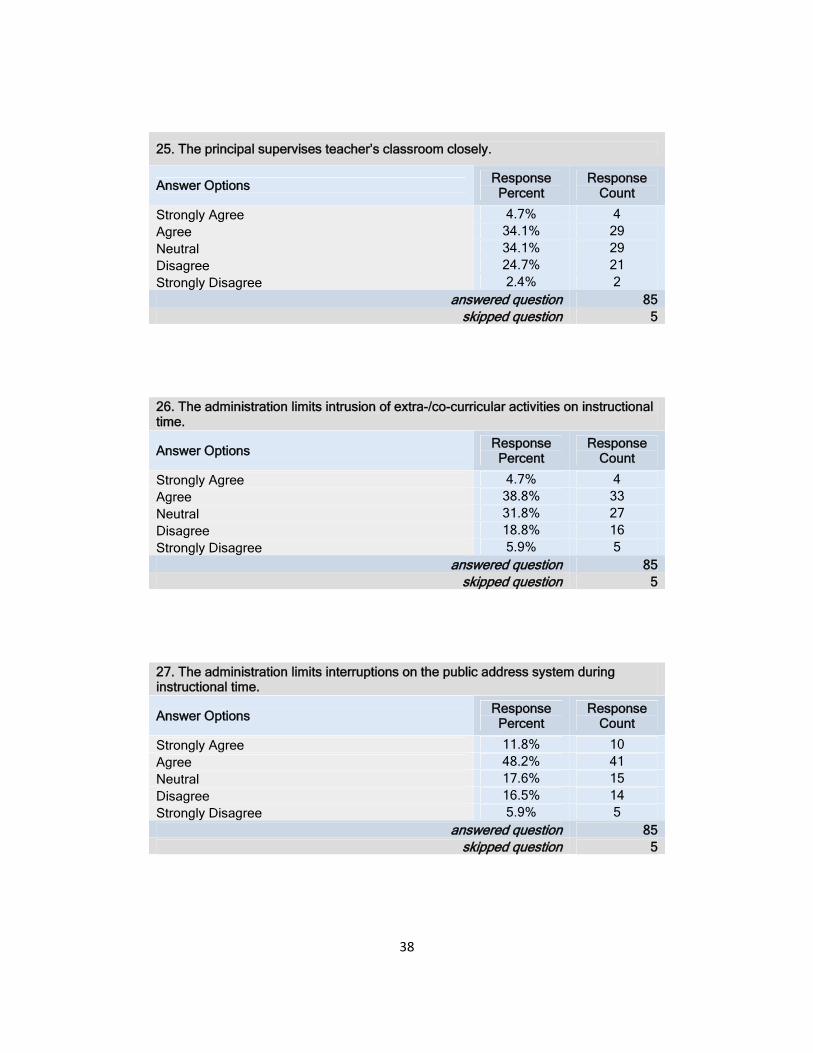
25. The principal supervises teacher’s classroom closely.
Answer Options Response Percent
Response Count
Strongly Agree 4.7% 4 Agree 34.1% 29 Neutral 34.1% 29 Disagree 24.7% 21 Strongly Disagree 2.4% 2
answered question 85 skipped question 5
26. The administration limits intrusion of extra-/co-curricular activities on instructional time.
Answer Options Response Percent
Response Count
Strongly Agree 4.7% 4 Agree 38.8% 33 Neutral 31.8% 27 Disagree 18.8% 16 Strongly Disagree 5.9% 5
answered question 85 skipped question 5
27. The administration limits interruptions on the public address system during instructional time.
Answer Options Response Percent
Response Count
Strongly Agree 11.8% 10 Agree 48.2% 41 Neutral 17.6% 15 Disagree 16.5% 14 Strongly Disagree 5.9% 5
answered question 85 skipped question 5
39
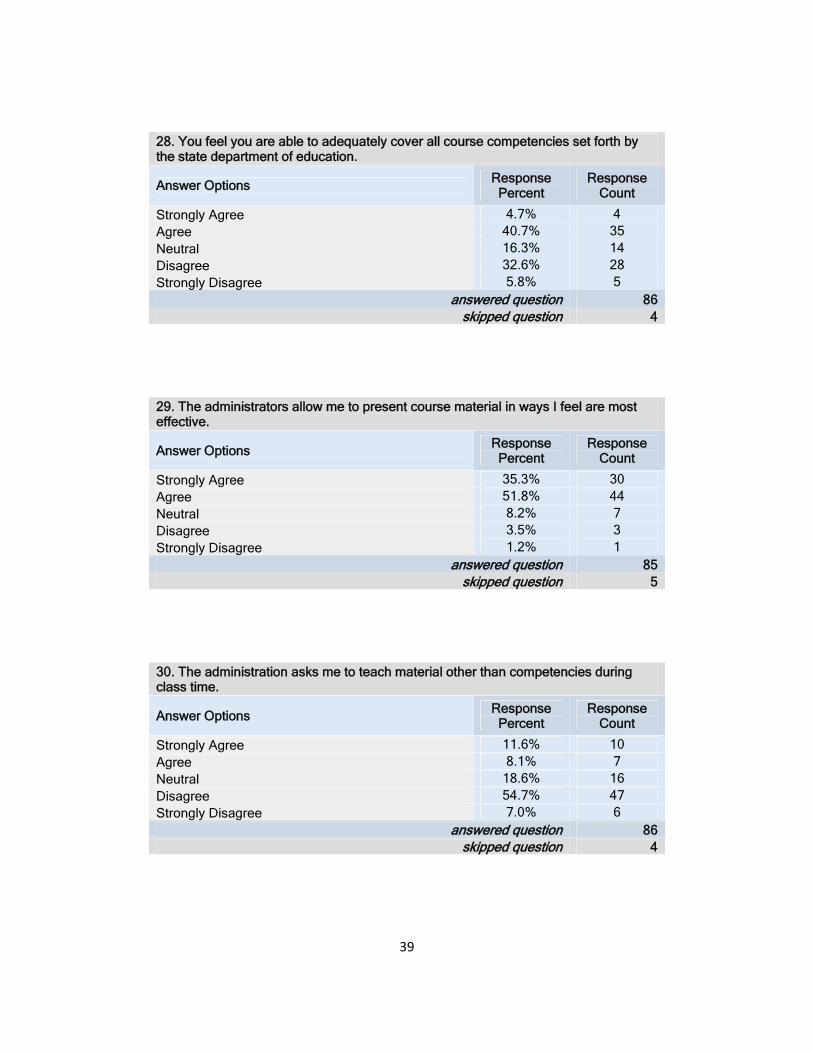
28. You feel you are able to adequately cover all course competencies set forth by the state department of education.
Answer Options Response Percent
Response Count
Strongly Agree 4.7% 4 Agree 40.7% 35 Neutral 16.3% 14 Disagree 32.6% 28 Strongly Disagree 5.8% 5
answered question 86 skipped question 4
29. The administrators allow me to present course material in ways I feel are most effective.
Answer Options Response Percent
Response Count
Strongly Agree 35.3% 30 Agree 51.8% 44 Neutral 8.2% 7 Disagree 3.5% 3 Strongly Disagree 1.2% 1
answered question 85 skipped question 5
30. The administration asks me to teach material other than competencies during class time.
Answer Options Response Percent
Response Count
Strongly Agree 11.6% 10 Agree 8.1% 7 Neutral 18.6% 16 Disagree 54.7% 47 Strongly Disagree 7.0% 6
answered question 86 skipped question 4
40
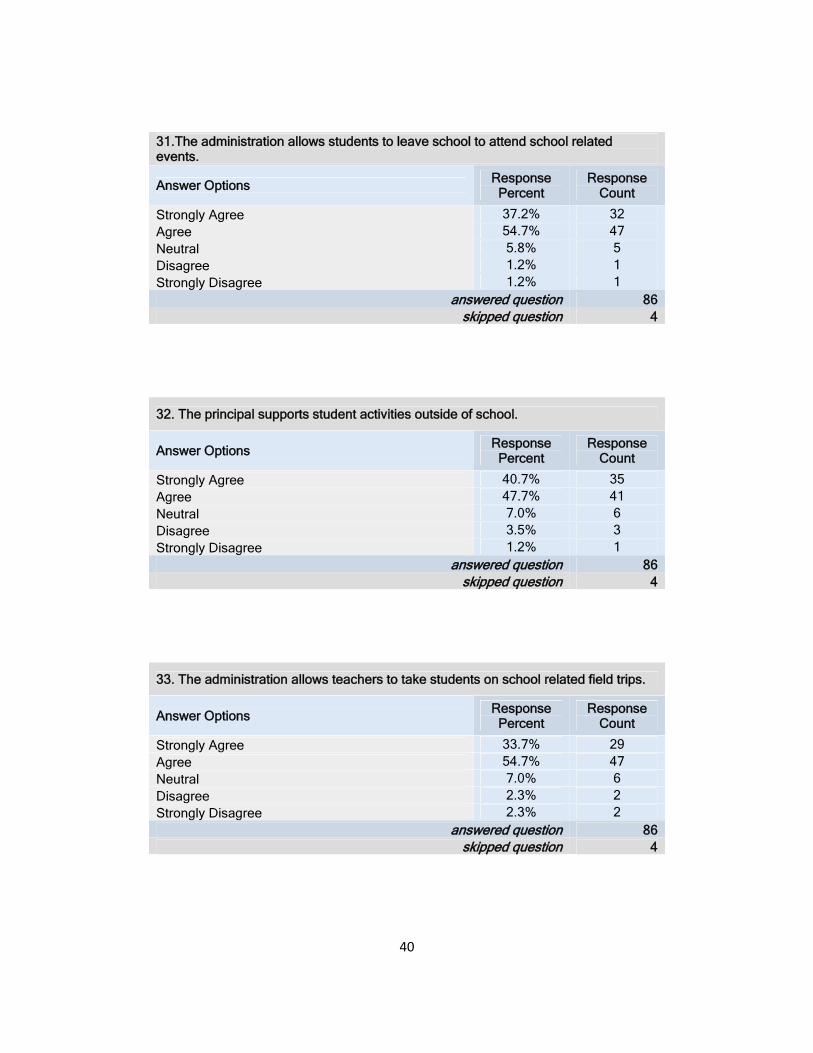
31.The administration allows students to leave school to attend school related events.
Answer Options Response Percent
Response Count
Strongly Agree 37.2% 32 Agree 54.7% 47 Neutral 5.8% 5 Disagree 1.2% 1 Strongly Disagree 1.2% 1
answered question 86 skipped question 4
32. The principal supports student activities outside of school.
Answer Options Response Percent
Response Count
Strongly Agree 40.7% 35 Agree 47.7% 41 Neutral 7.0% 6 Disagree 3.5% 3 Strongly Disagree 1.2% 1
answered question 86 skipped question 4
33. The administration allows teachers to take students on school related field trips.
Answer Options Response Percent
Response Count
Strongly Agree 33.7% 29 Agree 54.7% 47 Neutral 7.0% 6 Disagree 2.3% 2 Strongly Disagree 2.3% 2
answered question 86 skipped question 4
41
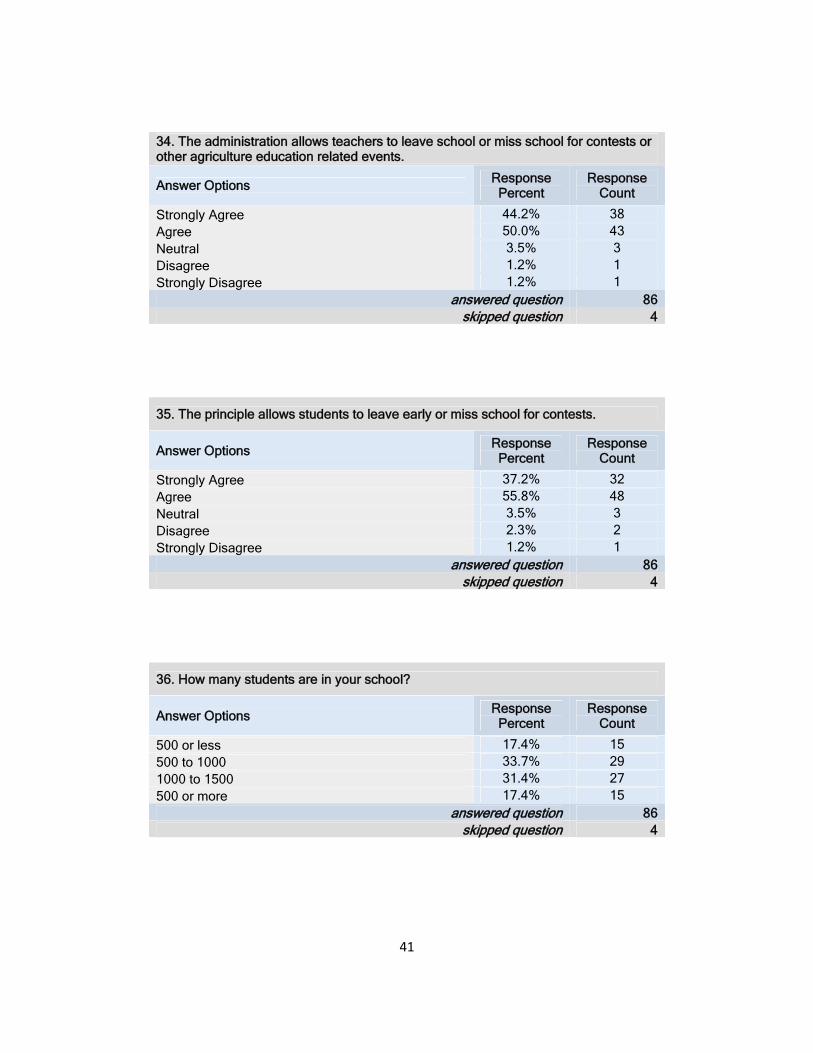
34. The administration allows teachers to leave school or miss school for contests or other agriculture education related events.
Answer Options Response Percent
Response Count
Strongly Agree 44.2% 38 Agree 50.0% 43 Neutral 3.5% 3 Disagree 1.2% 1 Strongly Disagree 1.2% 1
answered question 86 skipped question 4
35. The principle allows students to leave early or miss school for contests.
Answer Options Response Percent
Response Count
Strongly Agree 37.2% 32 Agree 55.8% 48 Neutral 3.5% 3 Disagree 2.3% 2 Strongly Disagree 1.2% 1
answered question 86 skipped question 4
36. How many students are in your school?
Answer Options Response Percent
Response Count
500 or less 17.4% 15 500 to 1000 33.7% 29 1000 to 1500 31.4% 27 500 or more 17.4% 15
answered question 86 skipped question 4
42
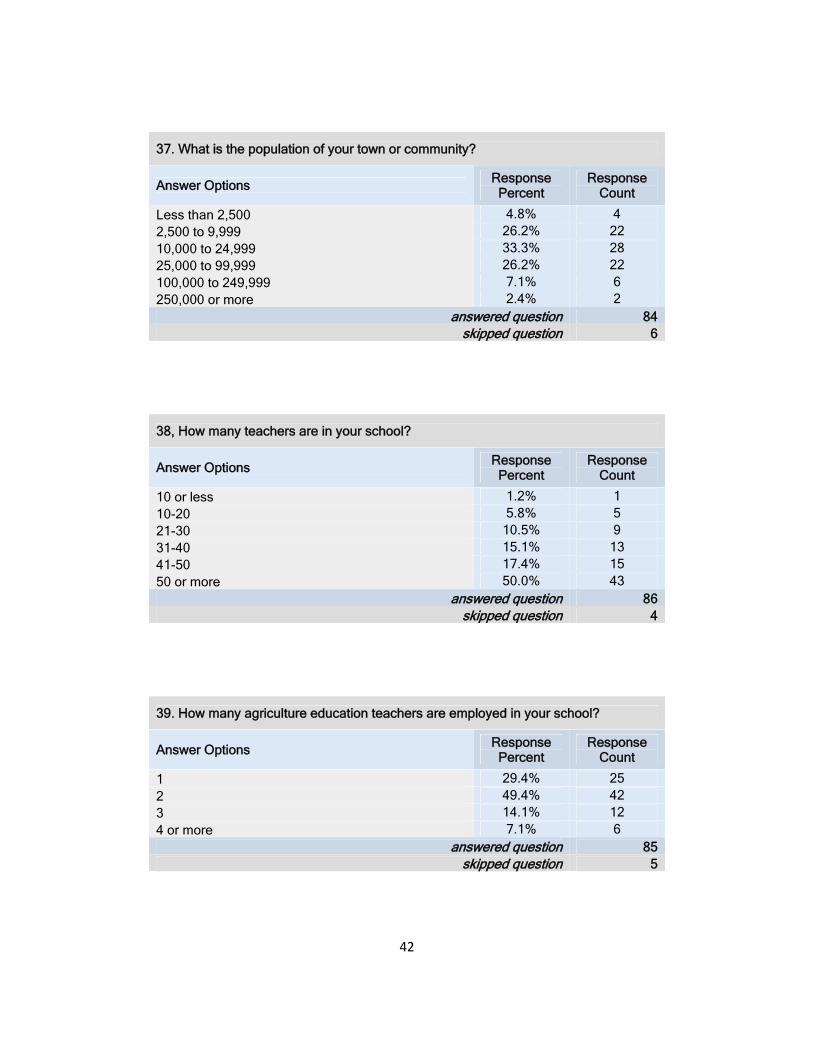
37. What is the population of your town or community?
Answer Options Response Percent
Response Count
Less than 2,500 4.8% 4 2,500 to 9,999 26.2% 22 10,000 to 24,999 33.3% 28 25,000 to 99,999 26.2% 22 100,000 to 249,999 7.1% 6 250,000 or more 2.4% 2
answered question 84 skipped question 6
38, How many teachers are in your school?
Answer Options Response Percent
Response Count
10 or less 1.2% 1 10-20 5.8% 5 21-30 10.5% 9 31-40 15.1% 13 41-50 17.4% 15 50 or more 50.0% 43
answered question 86 skipped question 4
39. How many agriculture education teachers are employed in your school?
Answer Options Response Percent
Response Count
1 29.4% 25 2 49.4% 42 3 14.1% 12 4 or more 7.1% 6
answered question 85 skipped question 5
43
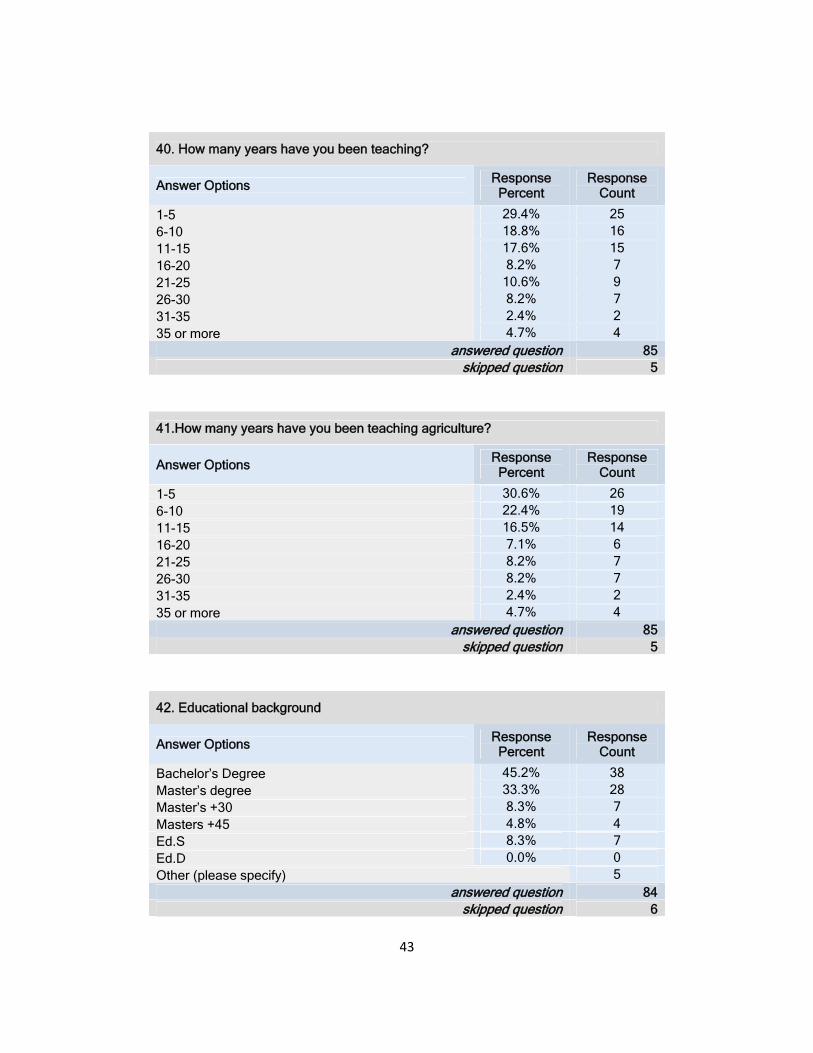
40. How many years have you been teaching?
Answer Options Response Percent
Response Count
1-5 29.4% 25 6-10 18.8% 16 11-15 17.6% 15 16-20 8.2% 7 21-25 10.6% 9 26-30 8.2% 7 31-35 2.4% 2 35 or more 4.7% 4
answered question 85 skipped question 5
41.How many years have you been teaching agriculture?
Answer Options Response Percent
Response Count
1-5 30.6% 26 6-10 22.4% 19 11-15 16.5% 14 16-20 7.1% 6 21-25 8.2% 7 26-30 8.2% 7 31-35 2.4% 2 35 or more 4.7% 4
answered question 85 skipped question 5
42. Educational background
Answer Options Response Percent
Response Count
Bachelor’s Degree 45.2% 38 Master’s degree 33.3% 28 Master’s +30 8.3% 7 Masters +45 4.8% 4 Ed.S 8.3% 7 Ed.D 0.0% 0 Other (please specify) 5
answered question 84 skipped question 6
44
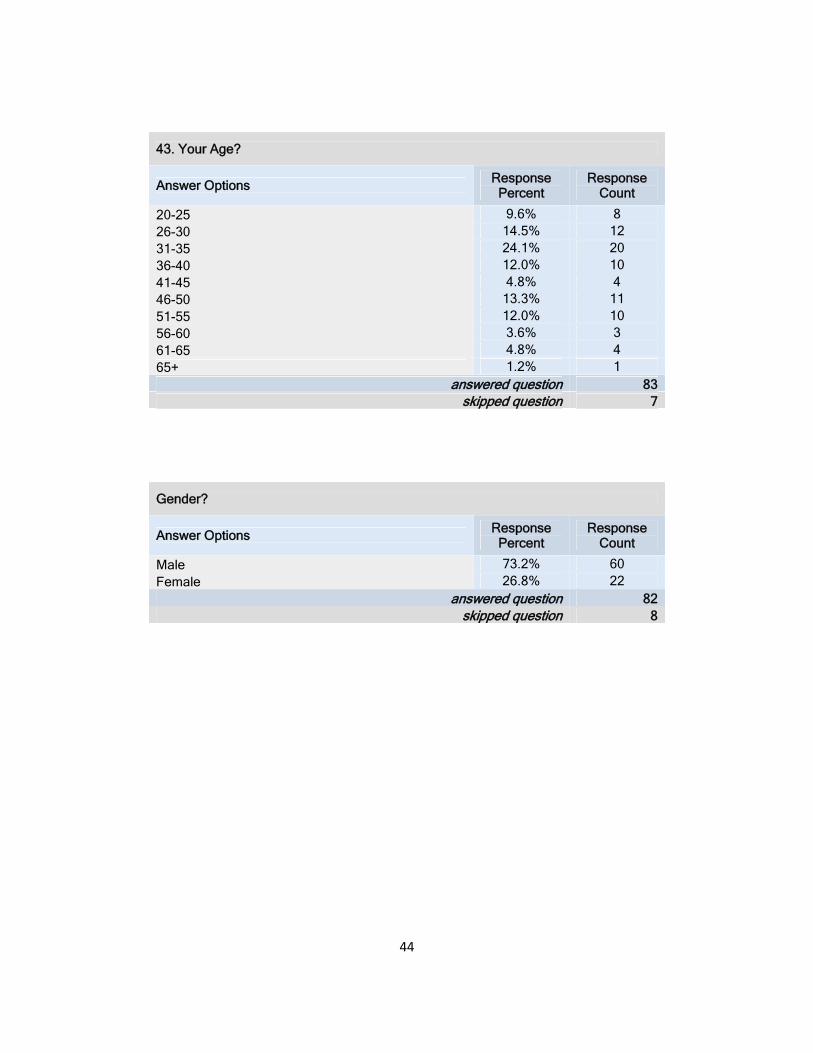
43. Your Age?
Answer Options Response Percent
Response Count
20-25 9.6% 8 26-30 14.5% 12 31-35 24.1% 20 36-40 12.0% 10 41-45 4.8% 4 46-50 13.3% 11 51-55 12.0% 10 56-60 3.6% 3 61-65 4.8% 4 65+ 1.2% 1
answered question 83 skipped question 7
Gender?
Answer Options Response Percent
Response Count
Male 73.2% 60 Female 26.8% 22
answered question 82 skipped question 8