Embed Size (px)
Citation preview
Do Day Traders Rationally Learn About Their Ability?
Brad M. Barber Graduate School of Management University of California, Davis
Yi-Tsung Lee Guanghua School of Management
Peking University
Yu-Jane Liu Guanghua School of Management
Peking University
Terrance Odean Haas School of Business
University of California, Berkeley
Ke Zhang Haas School of Business
University of California, Berkeley
October 2017
_________________________________
We are grateful to the Taiwan Stock Exchange for providing the data used in this study. Barber appreciates the National Science Council of Taiwan for underwriting a visit to Taipei, where Timothy Lin (Yuanta Core Pacific Securities) and Keh Hsiao Lin (Taiwan Securities) organized excellent overviews of their trading operations. We have benefited from the comments of seminar participants at the University of Southern California, the University of Oregon, the University of Utah, the University of Virginia, Santa Clara University, the University of Texas, Texas A&M, Washington University, Peking University, and HKUST.

Do Day Traders Rationally Learn about Their Ability
Abstract
We analyze the performance of and learning by individual investors who engage in day
trading in Taiwan from 1992 to 2006 and test the proposition that individual investors
rationally speculate as day traders in order to learn whether they possess the superior
trading ability. Consistent with models of both rational and biased learning, we document
that unprofitable day traders are more likely to quit than profitable traders. Inconsistent
with models of rational speculation and learning, we document that the aggregate
performance of day traders is negative, that the vast majority of day traders are
unprofitable, and many persist despite an extensive experience of losses, .
1
Papers (Mahani and Bernhardt (2007) and Linnainmaa (2010)) develop models in
which an individual investor rationally chooses to trade speculatively—knowing that
most other individuals lose money through speculation—in order to learn whether or not
she has the ability to reliably profit through speculation. In these models, investors do not
initially know their own abilities and rationally infer these by observing their trading
performance. Gervais and Odean (2001) present a model in which biased learning leads
successful investors to become overconfident. In this model, too, investors do not initially
know their own abilities and must infer these from performance. However, when they are
successful, these investors irrationally attribute success disproportionately to their ability
rather than luck, leading investors to overestimate their own abilities and trade too
aggressively; even investors with more past failures than successes may become
overconfident by overweighting their successes.
We test the predictions of rational Bayesian learning models by analyzing the
performance of day traders in Taiwan. We focus on day traders, those who buy and sell
the same stock within a day, as these traders are almost surely speculators. Using the
complete transaction data for the Taiwan Stock Market over 15 years (1992 to 2006), we
find evidence of learning among day traders. The majority of day traders quit relatively
quickly (more that 75% of all day traders quit within two years), and poor performers are
more likely to quit. These results are consistent with the models of both rational and
biased learning. In this respect, our paper complements the emerging evidence that
learning is an important factor in the behavior of individual investors. Using Finnish
data, Seru, Shumway, and Stoffman (2010) document investors not only learn about their
ability by trading, but also get better with experience. Linnainmaa (2010) calibrates a
structural model in which investors rationally learn about their ability through trading
using trading records of active individual Finnish investors. Consistent with the
prediction of his model, investors are more likely to increase trade size after successful
trades and more likely to decrease trade size or quit trading after unsuccessful trades.
Furthermore, the size and quitting effects are stronger early in an investor’s career, when
his or her prior beliefs about ability are more diffuse. Using US broker data, Nicolosi,
Peng, and Zhu (2009) show that trade intensity increases following signals of strong
2
performance. Analyzing data from the National Stock Exchange in India, De et. al.
(2010) document that investors increase trading in response to recent profits and that the
sign of profits matters more than their magnitude.
Previous tests of rational learning models of trading have focused primarily on
confirming evidence, e.g., do investors increase (decrease) trading in response to
successful (unsuccessful) trades? To properly test these models it is, however, equally or
more important to also look for disconfirming evidence. While we, too, find clear
evidence of learning, we also document behavior that is not consistent with rational
Bayesian learning as modeled by Mahani and Bernhard (2007) and Linnainmaa (2010)
for two reasons:
First, if the entry (and exit) of new speculators who are testing their trading
acumen is stable over time, then the sign of the expected lifetime profits of new
speculators is the same as that of aggregate speculator profits. Therefore risk-averse or
risk-neutral potential speculators with no special prior knowledge of their abilities should
only “trade to learn” if aggregate speculator profits are positive. In fact, using complete
data for the Taiwan market, the aggregate performance of day traders net of fees is
negative in each of the 15 years that we study. A profit-maximizing risk-averse (or risk-
neutral) Bayesian investor would not enter a market if her expected lifetime profits were
negative.
Second, though performance affects day trader survival, many poor performing
traders persist. Each month from 1993-2005, we sort traders based on the number of
days they have engaged in day trading as of the end of the previous month and on the past
profitability of their intraday trades. To have an accurate measure of day trading
experience, we exclude traders who day traded in 1992. Previously unprofitable traders
with 50 or more days of past day trading experience have a 95.3% probability of day
trading again in the next 12 months, while previously profitable traders with 50 or more
days of past day trading experience have a 96.4% probability doing so. So, not only do
3
experienced day traders with histories of losses persist in day trading, they do so at nearly
the same rate day traders who have been profitable.
The rest of this paper is organized as follows. After reviewing related research
(section I), we discuss Taiwan market rules, data, and methods (section II). In section III,
we present the performance of day traders sorted in aggregate and partitioned by past
performance and trading activity. In section IV, we explore the source of profits for
profitable day traders. In section V, we explicitly test the learning models. After
discussing our results (section VI), we make some concluding remarks (section VII).
I. Learning by Speculators The suggestion that investors learn from experience is neither novel nor
controversial.1 Learning is a ubiquitous feature of human experience. From a welfare and
policy perspective, the question is not whether investors learn, but how well they learn.
In this section we develop testable predications that emanate from a rational model of
learning and highlight the predictions would discriminate between rational and biased
models of learning.
Mahani and Bernhardt (2007) argue that rational Bayesian learning can explain
several empirical regularities: cross-sectionally, most speculators lose money; large
speculators outperform small speculators; past performance positively effects subsequent
trade intensity; most new traders lose money and cease speculation; and performance
shows persistence. Similar to Mahani and Bernhardt (2007), Linnainmaa (2010) develops
a structural model of rational learning. Using trading data from Finland, he finds
investors with poor performance are likely to quit and trading intensity increases
following good performance.
1 A number of papers document investor learning in various forms including Feng and Seasholes (2005), Seru, Shumway, and Stoffman (2007), Nicolosi, Peng, and Zhu (2009), Chiang, Hirshleifer, Qian, and Shreman (2010), Choi, Laibson, Madrian and Metrick (2010), De, Gondhi, and Pochiraju (2010), and Odean, Strahilesvitz, and Barber (2010).
4
In Mahani and Bernhardt (2007), novice speculators lose while the experienced
profit, but aggregate performance should be positive and represent an upper bound on the
return to day trading. To see the logic behind this assertion, consider the following
simple, concrete, example. Suppose that 21 new speculators try trading each year. Only
one of these has skill; 20 are unskilled. Unskilled speculators trade for one year, lose $1,
and quit. Skilled speculators trade for 10 years, earn $1 each year and quit. Thus
aggregate speculator profits each year are -$10. Because skilled speculators stay in the
market longer, skilled speculators account for a greater fraction of active speculators (i.e.,
10/30) than of new speculators (i.e., 1/21). Expected lifetime profits for a new speculator
are . Note that aggregate annual profits divided by
the number of new speculators each year are equal to expected lifetime profits (i.e., -
$10/21 =-$ 0.476) and that aggregate annual profits divided by the number of all
speculators trading in a year (e.g., -10/30 = -$ 0.333) are of the same sign but lower
magnitude than expected lifetime profits. Thus, when aggregate profits are negative, they
provide an upper limit to the unconditional expected lifetime profits of a speculator. If
traders have rational prior beliefs about the unconditional expected lifetime profits from
engaging in speculations, then the aggregate performance of speculators should be
positive. This leads to our first null hypothesis:
H1: The aggregate net performance of day traders is positive (non-negative).
The alternative is that the aggregate net performance of day traders is negative.
This is consistent with traders holding biased prior beliefs about the unconditional
expected lifetime profits from trying day trading.
In the rational learning models, unsuccessful traders quit trading after the
accumulation of negative signals outweighs their positive initial prior beliefs about their
ability. Gervais and Odean (2001) develop a model in which investors take too much
credit for their success and thus, relative to a Bayesian, overweight successes when
learning about their ability. In their model, too, successful investors have more ability
than unsuccessful ones and investors respond to good performance by trading more
aggressively. In contrast to the rational Baysian model, their model can also explain
persistent trading by previously unsuccessful traders; these traders put too much weight
on successes and too little on failures when updating beliefs about their abilities
€
(1/21)$10 + (20 /21)(−$1) = −$0.476
5
Persistent trading in the face of losses is not consistent with the models of rational
learning. However, it is difficult to disentangle whether an unprofitable day trader is
persisting because of biased learning or biased priors beliefs. Without a clear and
accurate model of quickly traders should learn from losses coupled with estimates of
prior beliefs, one cannot say precisely how quickly unsuccessful rational traders should
quit. We present evidence of remarkable trading persistence in the face of losses, for
example, nearly 3/4ths of day-trading volume is generated by unsuccessful day-traders
with at least 10 days of day trading experience. The reader must assess for him or herself
whether this perverse persistence is due to biased prior beliefs, biased learning, or both.
The rational learning models predict that unsuccessful speculators will quit while
successful speculators are likely to persist. Thus—irrespective of prior beliefs—the
rational learning models predict our second null hypothesis:
H2: Experienced day traders with previous net losses will not continue to trade.
Under Gervais and Odean’s biased learning model, it is possible for unsuccessful
traders to become overconfident, and more active traders, if their learning bias is
sufficient. Thus continuing to trade by unprofitable day-traders is contrary to the rational
learning models but consistent with biased learning.
II. Data and Methods
II.A. Day Traders and Speculative Trading
Empirical tests of the learning models must identify traders who trade
speculatively. Investors might reasonably trade to save (or consume), to rebalance their
portfolios, or to reduce their tax liability. Thus, an important feature of our empirical
strategy is to identify a clean sample of speculators. We do so by focusing on day trading
on the Taiwan Stock Exchange. Day trading is the purchase and sale of the same stock
by an investors on a day. We argue that these intraday trades are almost certainly
speculative. Moreover, day trading is common and prevalent in Taiwan.
6
We are not the first to study day trading, though the sample of day traders we
study is much larger and the time-series much longer than those in prior studies.2 The one
exception to this generalization being Barber, Lee, Liu, and Odean (2010) who identify a
small subset of day traders (less than 1% of the day trading population) predictably earn
profits. None of these prior studies used the empirical setting to test rational and biased
models of learning, the focus of our investigation.
II.B. Taiwan Market Rules
Before proceeding, it is useful to describe the Taiwan Stock Exchange (TSE). The
TSE operates in a consolidated limit order book environment where only limit orders are
accepted. During the regular trading session, from 9:00 a.m. to noon during most of our
sample period, buy and sell orders can interact to determine the executed price subject to
applicable automatching rules.3 Minimum tick sizes are set by the TSE and vary
depending on the price of the security. Generally, orders are cleared using automatching
rules one to two times every 90 seconds throughout the trading day. Orders are executed
in strict price and time priority. An order entered into the system at an earlier time must
be executed in full before an order at the same price entered at a later time is executed.
Although market orders are not permitted, traders can submit aggressive price-limit
orders to obtain matching priority. During our study period, there is a daily price limit of
7% in each direction and a trade-by-trade intraday price limit of two ticks from the
previous trade price.
Since our analysis focuses on day trading, an important consideration is
transaction costs. The TSE caps commissions at 0.1425% of the value of a trade. Some
brokers offer lower commissions for high-volume traders. Officials at brokerage firms
and the TSE indicated to us that the largest commission discount offered is 50% (i.e., a
commission of roughly 7 basis points); these same officials estimated the trade-weighted 2 Harris and Schultz (1998) study SOES bandits at two brokers. Garvy and Murphy (2002, 2005) analyze 15 and 1,386 day traders at one US broker. Seasholes and Wu (2004) analyze the trades of 10 active traders on the Shanghai Stock Exchange. Linnainmaa (2003) analyzes 7,686 Finnish day traders. 3 Trading also occurred on Saturdays during most of our sample period. Before December 1997, Saturday trading occurred from 9:00-11:00. From January to March, 1998, stocks were traded only on the second and the fourth Saturday in each month. From April 1998 to December 2000, Saturday trading occurred from 9 am to noon. From 2001 on, there has been no trading on Saturday.
7
commission paid by market participants to be about 10 basis points. We use the 10 basis
points when calculating returns net of fees. Taiwan also imposes a transaction tax on
stock sales of 0.3%.
II.C. Trades Data and Descriptive Statistics We use a unique and remarkably complete dataset, which contains the entire
transaction data, underlying order data, and the identity of each trader on the Taiwan
Stock Exchange (TSE). With these data, we provide a comprehensive accounting of the
profitability of day traders during the period 1992 through 2006.
The trade data include the date and time of the transaction, a stock identifier,
order type (buy or sell -- cash or margin), transaction price, number of shares, a broker
code, and the identity of the trader. In total, the dataset contains 3.7 billion purchase (or
sale) transactions with a value of $NT 310 trillion (approximately $10 trillion US).4 The
trader code allows us to broadly categorize traders as individuals, corporations, dealers,
foreign investors, and mutual funds. The majority of investors (by value and number) are
individual investors. Corporations include Taiwan corporations and government-owned
firms (e.g., in December 2000 the government-owned Post, Banking, and Insurance
Services held over $NT 213 billion in Taiwanese stock).5 Dealers include Taiwanese
financial institutions such as Fubon Securities, Pacific Securities, and Grand Cathay
Securities. Foreign investors are primarily foreign banks, insurance
companies, securities firms, and mutual funds. During our sample period, the largest
foreign investors are Fidelity Investments, Scudder Kemper, and Schroder Investment
Management. Mutual funds are domestic mutual funds, the largest of which is ABN-
AMRO Asset Management with $NT 82 billion invested in Taiwanese stocks in
December 2000.
4 The mean TWD/USD exchange rate from 1992 to 2006 was 30.54 with a low of 24.65 and a high of 35.01. 5 Many corporations are small firms that are majority or wholly owned by an individual. Thus, the corporate category of trader also includes thousands of individual investors who trade under the label of corporation.
8
We define day trading as the purchase and sale, in any order, of the same stock on
the same day by an investor. Specifically, if an investor buys and sells the same stock on
the same day, we calculate the number of shares bought (Sb), the number of shares sold
(Ss), the average purchase price (Pb), and the average sales price (Ps). The value of day
trading is defined as half of the total value of sales and purchases (½*Pb*min(Sb,Ss)+
½*Ps*min(Sb,Ss)). Over our sample period, aggregate day trading accounts for more than
19% of the total dollar value of aggregate trading volume. Most day trading (about 2/3rds)
involves the purchase and sale of the same number of shares in a stock over the course of
one day (i.e., most day trades yield no net change in ownership at the close of the day).
Virtually all day trading can be traced to individual investors. In the average
month, individual investors account for over 99% of all day traders (and 95% of day
trading volume). Individuals and corporations are free to short sell, though dealers,
mutual funds, and foreigners are prohibited from doing so on the TSE. These short sale
restrictions might partially explain the tendency for day trading to concentrate among
individual investors. In contrast to U.S. markets, dealers are not active providers of
liquidity. TSE rules state that dealers are required to “efficiently adjust the demand and
supply in the market depending on the market situation, and ensure that the formation of
fair price and its sound operation are not harmed,” yet dealers face no specific penalties
for failing to meet this requirement. Dealer trades emanate from their proprietary trading
activity. Based on our discussions with dealers in the TSE, the majority of this
proprietary trading is not necessarily intended to provide liquidity. Chae and Wang
(2003) also report that TSE dealers are not net providers of liquidity. In the remainder of
the paper, we focus on individual investors.
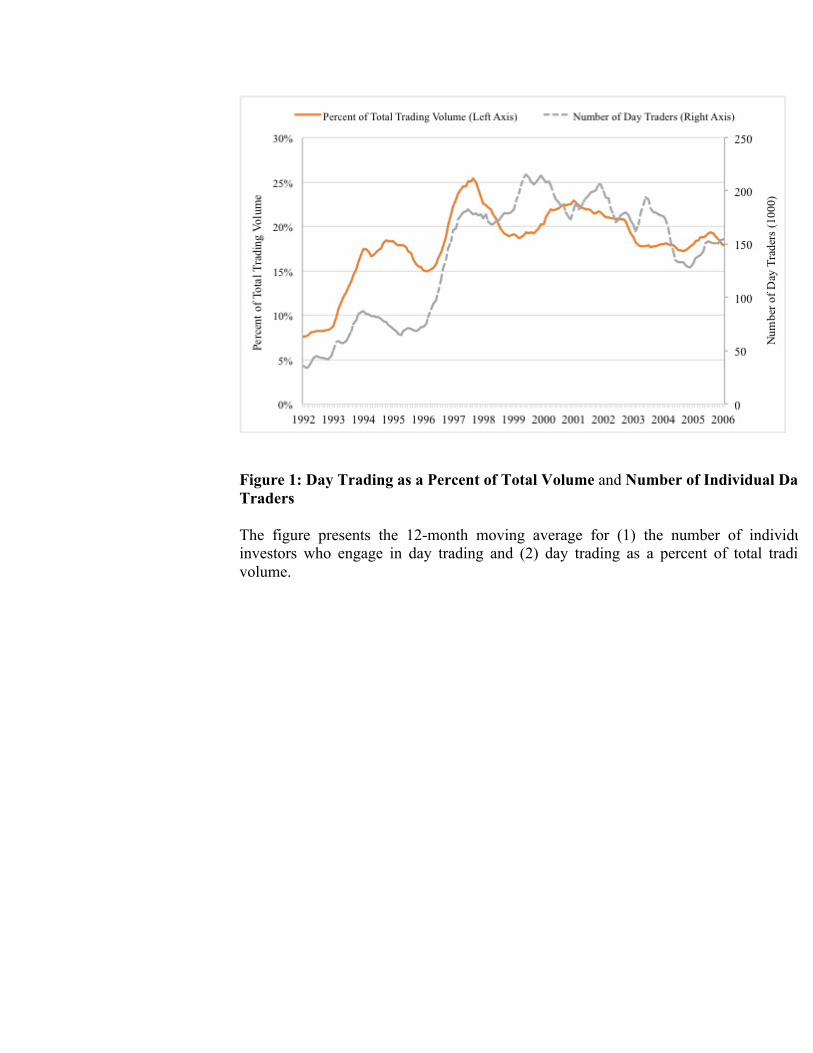
In Figure 1, we plot day trading as a percentage of total trading volume and the
number of individuals who day trade by month. While day trading was somewhat less
prevalent in the early part of our sample period, the share of volume traced to day trading
has been consistently around 20% of total trading volume from 1995 to 2006. In the
average month, almost 140,000 individuals day trade. With an adult population of about
16 million (total population about 22 million), this means just shy of 1% of the adult
9
population day trades in the average month. In terms of both a percentage of total trading
volume and numbers of traders, day trading is an equilibrium feature of the Taiwan stock
exchange with no apparent trend over the from 1997 through 2006.
II.D. Performance Measurement Our primary performance measurement focuses on the intraday profits of all
trades made by day traders and on trade-weighted intraday returns. In a subsequent
analysis, we also analyze the event time profitability of purchases and sales to ensure the
inferences we draw from the analysis of intraday profits are accurate.
We first calculate the intraday returns to day trading. To do so, we identify all
trades made by day traders. We calculate the profits on round-trip day trades and other
position opening trades that remain open at the close of the trading day. The other trades
are either purchases to open a long position or sales that open a short position. The profits
for trades that lead to an open position are calculated relative to closing prices on the date
of the trade (i.e., mark-to-market at the day’s closing price). To calculate the daily return
earned by a day trader, we sum the proceeds from stocks sold to close long positions and
bought to close short positions (or their mark-to-market equivalent at the close of the
trading day) and divide by the cost of initiating the position (i.e., the value of stocks
bought or sold short at the time of the purchase or sale). We refer to this return as the
gross intraday return from day trading. To calculate the net intraday return to day trading,
we assume a 5 basis points (bps) commission on purchases, a 5 bps commission on sales,
a 30 bps transaction tax on sales. (See appendix for details.)
It is important to include both round-trip and one-sided trades to measure the
performance of day trading. Focusing only on round-trip trades would yield a biased
measure of performance if investors sell winners and hold losers (i.e., exhibit the
disposition effect). For example, assume some day traders randomly buy and sell
(random traders), while others close only winning investments while riding losers
(disposition traders). Were we to analyze only the profits of round-trip trades, it is clear
that the disposition traders would have better round-trip returns than the random traders
merely because they have a rule regarding when to close a position. Since the disposition
10
effect is prevalent among Taiwanese investors and among day traders elsewhere,6 it is
important to include both round-trip and other trades when analyzing performance.
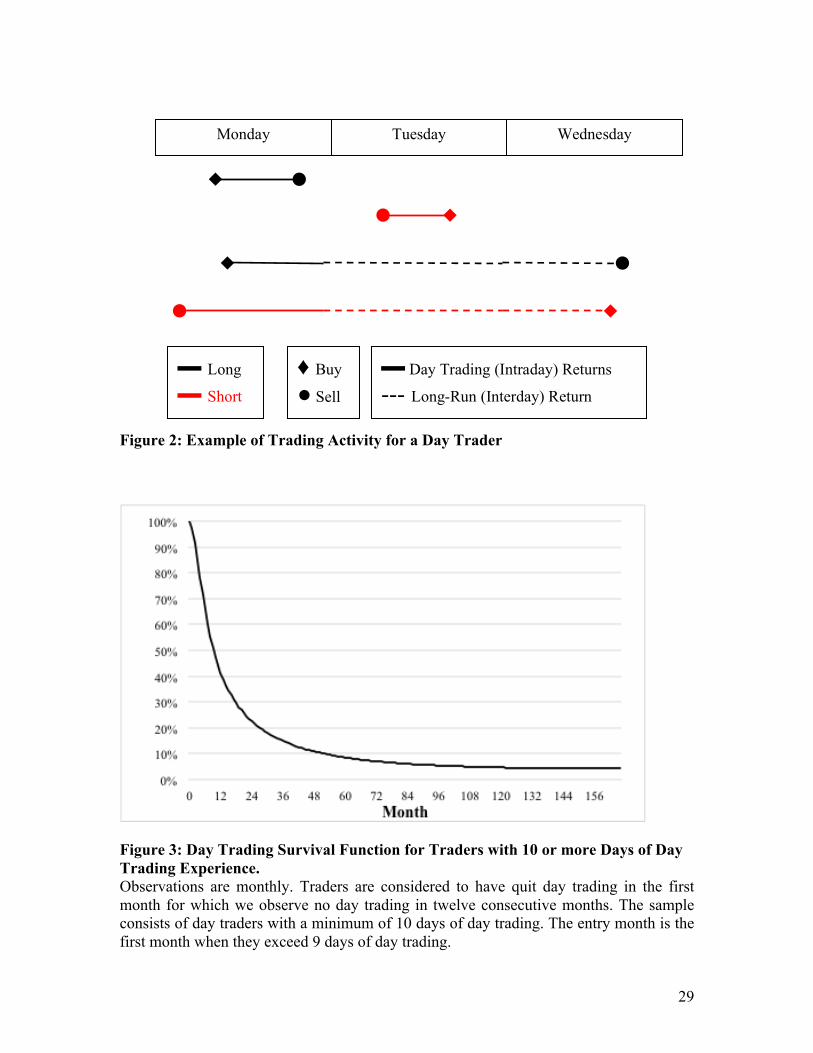
In Figure 2, we present an example of four trades by a day trader. The red lines
represent short positions, while the black lines represent long positions. The solid lines
are the portion of returns that are included in our day trading profits, while the dashed
lines are included in the analysis of long-run returns. It’s clear from this graph that, by
combining the two analyses, we capture the full experience of a trader.
III. Rational and Behavioral Learning Models: Confirming Evidence
We begin by estimating the survival rate of day traders. Our trading data starts in
1992. To reasonably ensure that we are analyzing new day traders, we restrict our
analysis to those who begin day trading after 1992. Our data ends in 2006 and thus is
right-censored. We consider a trader to have quit day trading if we observe no day trading
for 12 consecutive months. As a result of this requirement, we do not analyze day traders
who begin day trading in 2006 since we cannot reliably observe whether they have quit.
In Figure 3, we present a five-year Kaplan-Meier survival function. We consider
the survival of day traders who have day traded for at least 10 days – and designate the
first month when they hit the minimum 10-day threshold as their entry month.
For many of these traders, day trading is a persistent activity. Only 2.5% drop out
within one month, while survival rates at one, two, and three years are 44%, 24% and
15% respectively.
To test whether magnitude of past profitability affects the decision to quit day
trading, we estimate the following Cox proportional hazard rate model,
, where X is a matrix of independent variables, B is a vector of
6 Barber, Lee, Liu, and Odean (2007) and Linnainmaa (2005) document, respectively, that individual Taiwanese investors and Finnish day traders exhibit the disposition effect.
�
h(t,x) = h0(t)e{XB}
11
coefficient estimates, h0(t) is the baseline hazard rate (i.e., the hazard rate when all
covariates are equal to zero), and h(t,x) is the hazard rate conditional on a set of
covariates (x) at time t. In our application, a trader becomes at risk of quitting once he
begins day trading.
Again, we restrict our analysis to day traders who have day traded for a minimum
of 10 days. To assess the impact of past performance on quitting, we use net intraday
returns. To estimate the impact of past returns on the propensity to quit day trading, we
construct a series of 26 dummy variables corresponding to the following ranges in basis
points: (-∞, -90 ], (-90, -85], … , (25, 30], (30, ∞). When estimating the Cox proportional
hazard rate model, we set the range (0, 5 bps] as the default category and include the
remaining 25 dummy variables as covariates in our estimation. As control variables we
include measures of past day trading activity: the log of the number of days with day
trading activity, the log of the number of days since a trader’s first day trade, and the log
of the total volume of day trading. In the event history analysis, all independent variables
are updated monthly.
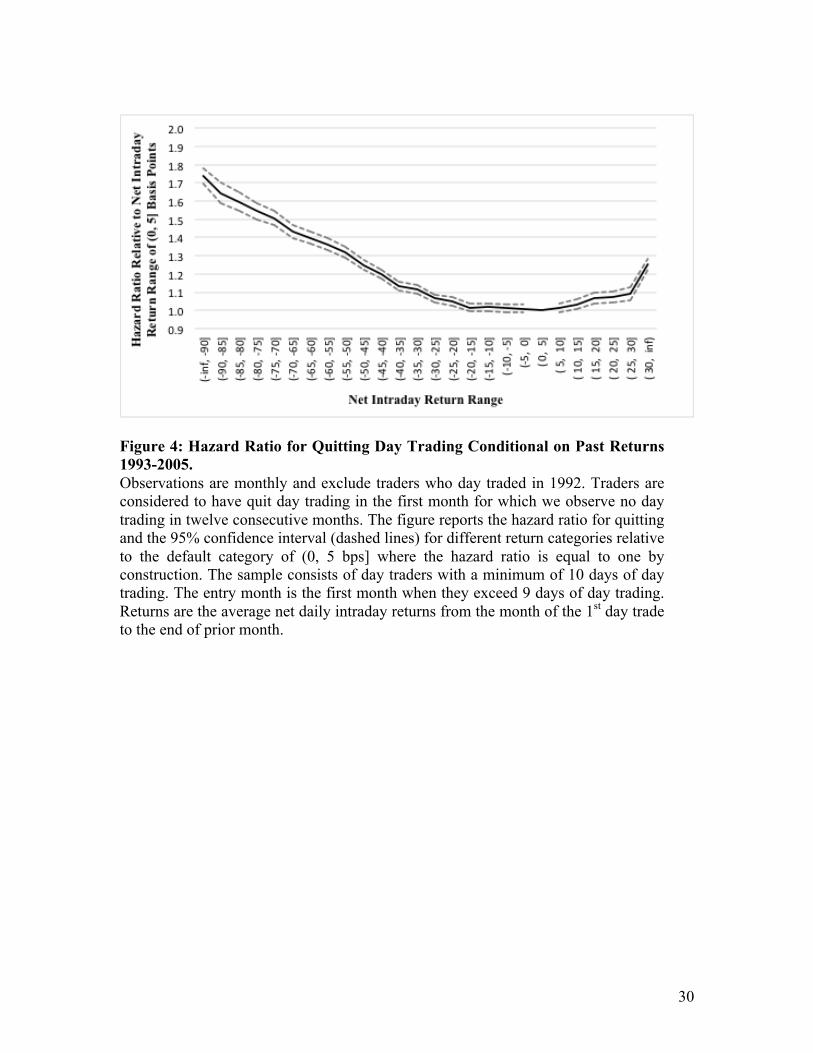
The results of this analysis are presented in Figure 4. The horizontal axis of the
figure represents net intraday return categories, while the vertical axis represents the
hazard rate relative to the omitted profit category (net intraday return in the interval (0,
0.05]). As predicted by the learning models, the net intraday return is negatively related
to the hazard rate. More profitable day traders are less likely to quit.7
However, the effect is not linear. The propensity to quit is relatively insensitive to
differences past net intraday returns in the -30 bps to 30 bps range. Traders with past net
intraday returns in the (30 bps, infinity) range are more likely to quit than those with
7 The relation between profits and the propensity to quit is similar regardless of whether we include control variables. However, the control variables are all reliably related to hazard ratios at the 1% significance level. Traders with more days of day trading experience are less likely to quit; a one standard deviation increase in the log of number of days of past day trading reduces the base case hazard rate to 0.43. Day traders who have been trading longer are more likely to quit; a one standard deviation in the log of the number of days since a trader’s first day trade increases the hazard rate to 1.24. Heavy day traders are more likely to quit; a one standard deviation increase in the log of past day trading volume increases the hazard rate to 1.11.
12
returns in the -30 bps to 30 bps range, though not as likely as traders with more negative
returns.
In the domain of negative returns, the propensity to quit is quite sensitive to the
magnitudes. For example, consider the impact on hazard rates of moving across four
equidistant profit categories: (0, 0,05], (-0.30, -0.25], (-0.60, -0.55] and (-0.90, -0.85].
The first move, from just profitable to the low range of losses increases the hazard rate
six percentage points (from 1.00 to 1.06); the second move, from the low range of losses
to mid range losses, increases the hazard rate by an additional 30 percentage points (from
1.06 to 1.36), the third move, from the mid range of losses to a high range increases the
hazard rate by an additional 36 percentage points (from 1.36 to 1.72).
In summary, these analyses provide strong evidence that traders learn about their
own ability by trading. Those who profit are less likely to quit, though the effect is most
pronounced for those with steep losses.
III.A. Rational Learning Models: Disconfirming Evidence
To this point, we find support for the rational and behavioral learning models of
investor behavior. Poor performers are more likely to quit day trading.. The confirming
evidence indicates learning is an important feature of financial markets. In this section,
we argue that rational learning does not explain behavior of the large population of
speculative investors for three reasons: aggregate performance is negative, experienced
speculators lose money, and unprofitable speculators persist.
A. 1. Aggregate performance is negative
To evaluate the performance of day traders relative to their opportunity cost of
holding the market portfolio, we estimate abnormal returns by regressing the portfolio
excess return (portfolio return less risk-free rate) on the excess return on a value-
weighted market index. We construct our own market index using market capitalization
from the Taiwan Economic Journal (TEJ) and individual stock returns calculated from
the TSE data. The intercept of this regression is our measure of abnormal returns.
13
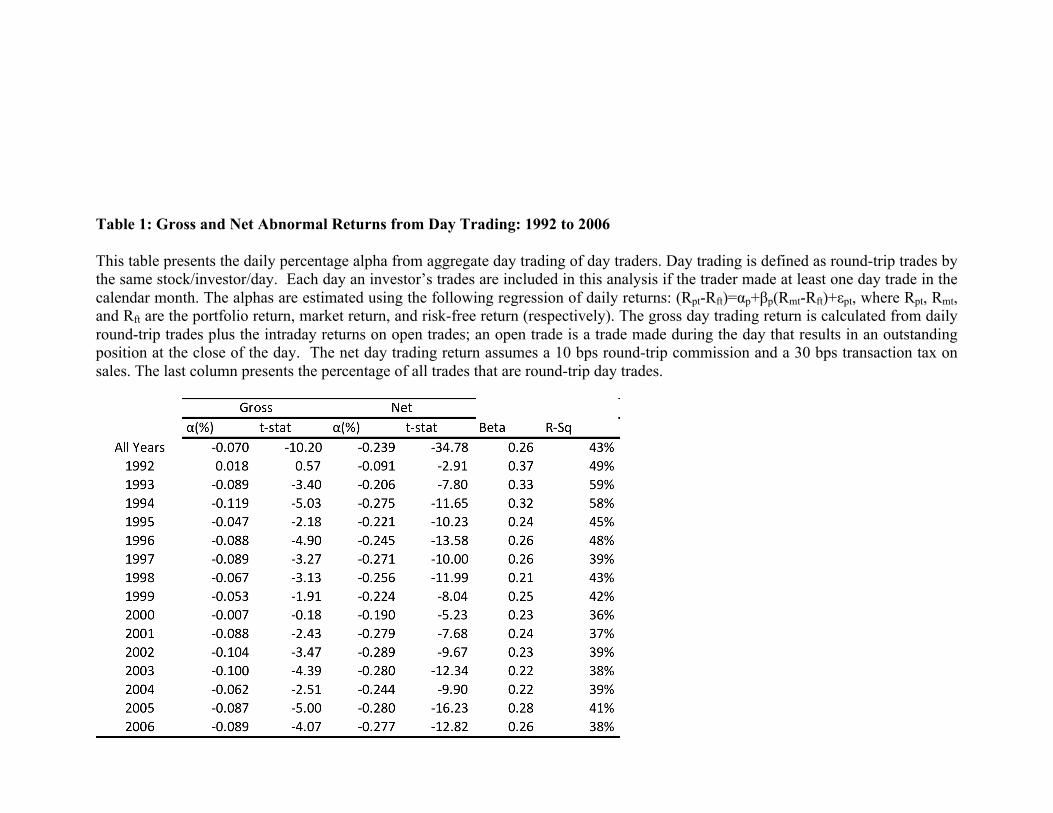
In Table 1, we present the gross and net performance of all day traders. Though
our performance analysis weights investors by the investments they make, we do not
distinguish occasional day traders from active day traders in this preliminary analysis.
We analyze the day trades and other trades of these investors in the months in which they
day trade.
There are two reasons that including all trades in the month of day trading might
positively bias our performance analysis. First, due to the disposition effect, day traders
are more likely to close profitable positions. Thus, months in which we observe day
trading are more likely to be profitable months. Second, it is possible that good
investment performance leads to day trading (i.e., reverse causation). (In subsequent
analyses, we identify day traders ex-ante to avoid these issues.) We are not concerned by
these biases in this preliminary analysis since we document poor performance in
aggregate.
In the second column of Table 1, we present the gross abnormal intraday returns
of day traders. On average, day traders lose 7 basis points on their day trading before
costs (t=-10.2). In the fourth column we see that trading costs more than triple the losses
to 23.9 basis points per day. Moreover, we observe reliably negative gross and net
performance in all years but 1992.
In aggregate, day trading is a losing proposition; day trading is an industry that
consistently and reliably loses money. From an industrial organization perspective, it is
difficult to understand how such an industry survives. For people to knowingly day trade,
most must either be overconfident about their prospects of success or derive non-financial
utility from the activity and knowingly suffer losses as a result. Finally, the poor
aggregate performance of day trading is not consistent with the learning model of Mahani
and Bernhardt (2007). In their model, novice speculators lose while the experienced
profit, but aggregate performance should be positive and represent the equilibrium return
14
to day trading. We discuss this issue in detail and explicitly test rational learning models
after presenting results on cross-sectional variation in performance.
A. 2. Experienced Day Traders Continue To Lose Money
A central feature of the learning model is the observation that bad traders quit.
This raises two natural questions. First, do traders with a long history of losses continue
to trade? Second, what fraction of day trading can we trace to traders with a history of
losses?
Do traders with a long history of losses continue to trade? To investigate the
relation between experience, past performance, and continued trading we categorize day
traders into groups based upon past day trading experience and whether or not they have
been profitable Each month from 1993-2005, we sort traders based on the number of days
they have engaged in day trading and on the cumulative profitability of their past intraday
trades as of the end of the previous month. To have an accurate measure of day trading
experience, we exclude traders who day traded in 1992. We exclude traders with fewer
than 10 days of past day trading experience sorting the remaining traders into those with
10 to 49 days, 50 to 99 days, 100 to 199 days, 200 to 399 days, and 400 or more days of
day trading experience. We further partition these experience groups into those with
positive cumulative past intraday profits and those with negative or zero cumulative past
intraday profits. We then measure the propensity for traders in each
experience/profitability group to stop day trading for one month or for twelve consecutive
months.
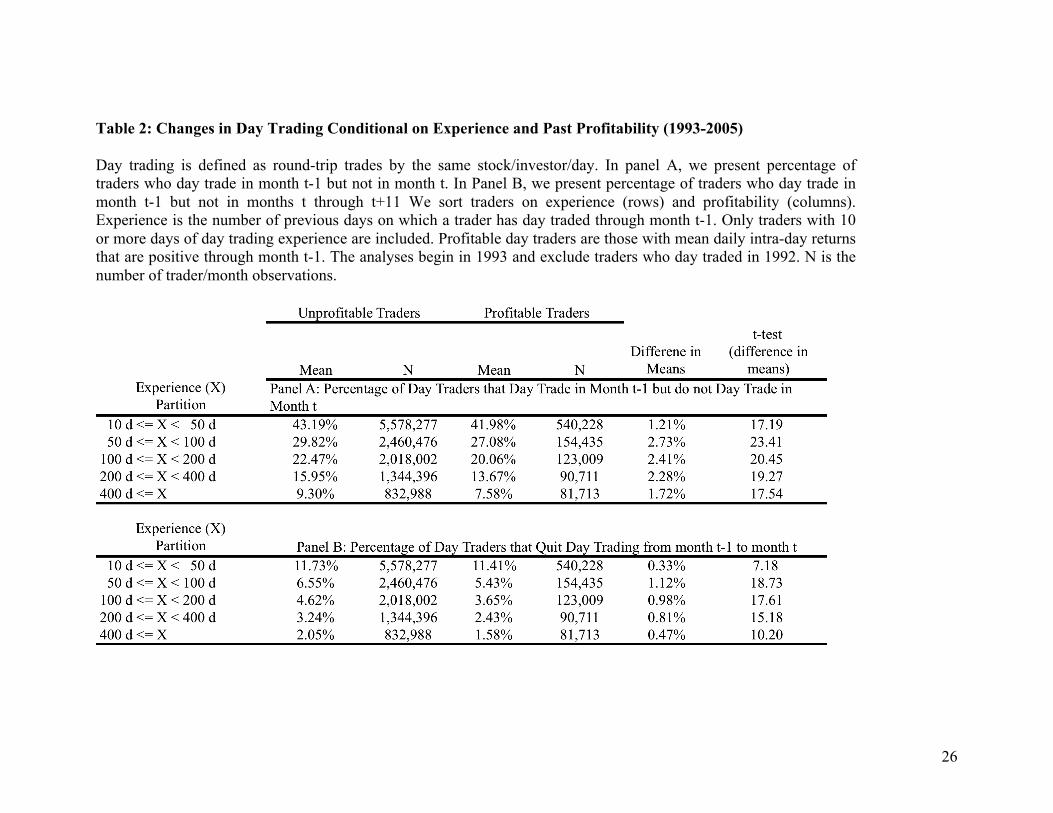
Table 2 Panel A reports the rate at which traders stop day trading for at least one
month. Not surprisingly, traders with less experience are more likely to stop. For
example, 41.98% of profitable traders and 43.19% unprofitable traders with 10 to 49 days
of experience stop trading for at least one month while only 7.58% of profitable traders
and 9.30% of unprofitable traders with 400 or more days of experience do so. What is
more surprising is that the rates at which traders stop trading is almost the same whether
they have been profitable or unprofitable.
15
Table 2 Panel B reports the rates at which traders stop day trading for at least
twelve consecutive months. Naturally, these rates are lower than those for stopping for a
month, but a similar pattern emerges as in Panel A. 5.43% of profitable traders and
6.55% of unprofitable traders with 10 to 49 days of experience stop trading for at least
twelve months. Of traders who have day traded 400 or more days, profitable traders have
a 1.58% probability of quitting for twelve or more months and unprofitable traders have a
2.05% probability quitting. Using columns 2 – 5 and the last four rows of Panel B one
can calculate that all previously unprofitable traders with 50 or more days of past day
trading experience have a 95.3% probability of day trading again in the next 12 months,
while previously profitable traders with similar experience have a 96.4% probability
doing so. Traders are sensitive to losses, but not very sensitive.
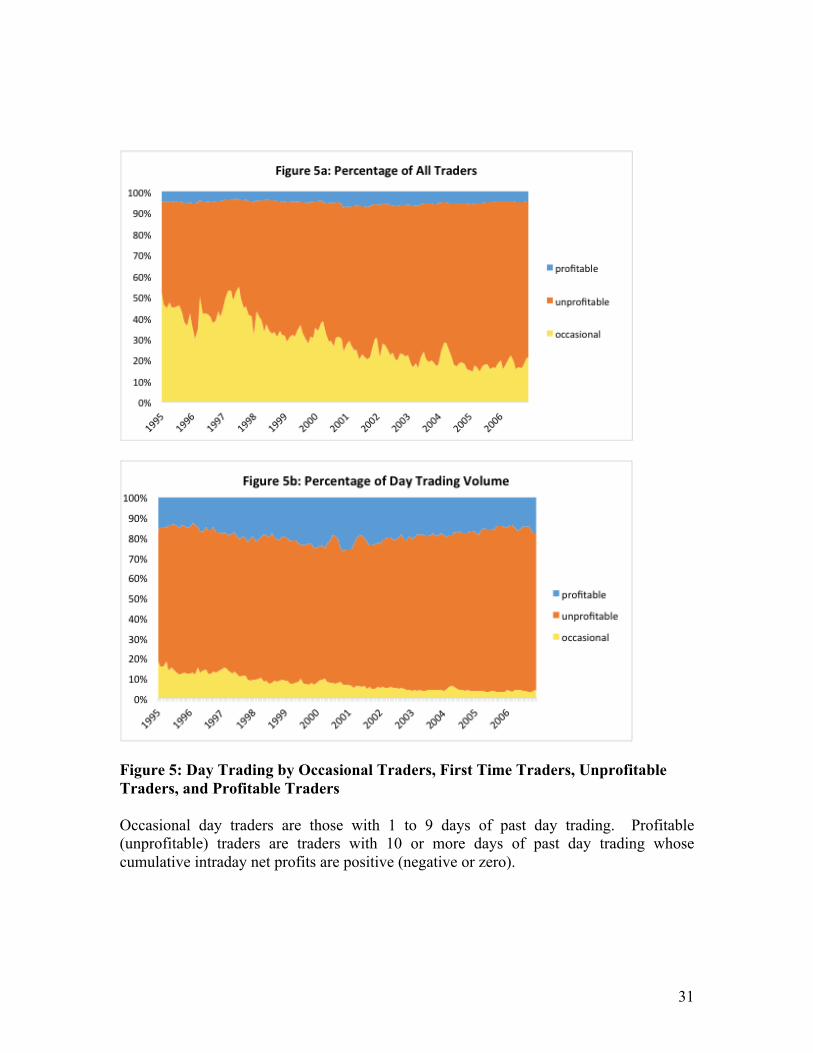
What fraction of day trading can we trace to traders with a history of losses? To
answer this question, each month we sort traders who day trade that month into three
groups: occasional day traders—traders with 1 to 9 days of day trading experience;
unprofitable day traders—traders with 10 or more days of day trading experience and
negative (or zero) life time net intraday profits (prior to the month of sorting); profitable
day traders—traders with 10 or more days of day trading experience and positive life
time net intraday profits (prior to the month of sorting. In Figure 5 we graph the relative
sizes of these three groups from 1995 through 2006 when measured by number of traders
(Figure 5a) and trading volume in dollars (Figure 5b). Throughout this twelve-year period
the fraction of profitable day traders is consistently about 5%. The fraction of
unprofitable traders grows to over 2/3rds as more and more occasional day traders are
reclassified as profitable or unprofitable. As one would expect, profitable and
unprofitable day traders account for proportionately more trading volume that occasional
day traders. In aggregate over the sample period, unprofitable traders account for 72% of
trading volume and in the last several years of the sample they consistently account for
about 80% of trading volume.
16
Thus, most day traders are unprofitable, most day trading is generated by
previously unprofitable traders, and unprofitable day traders with considerable experience
persist at day trading at almost the same high rate at profitable experienced day traders.
These observations are not consistent with models of rational learning.
A. 3. Event Time Analysis and the Persistence of Performance
So far we considered only intra-day returns. This is appropriate given our focus
on day trading. However, not all positions initiated by day traders are closed the day they
are opened. Do day traders earn profits on positions that they hold beyond the close of
trading? We address this question with an event time analysis of returns subsequent to
purchases and sales.
Each day we sort traders on profitability and experience over the last 365 calendar
days (366 for leap years). Profitable (unprofitable) is cumulative intraday net profits over
the previous year that are positive (negative or zero). Experience bins are based on
number of days of day trading during the previous 365 days with: Low experience (0-5),
Exp. 2 (6-10), Exp 3 (11-20), Exp 4 (21-40), Exp 5 (41-80), Hi Exp ( > 80). We
aggregate all purchases by day traders in each group by stock and day where the day of
the transaction is event day 1. We then calculate the mean market-adjusted abnormal
return on event day τ (MAτ) (weighted by the value of stocks bought) using purchase
prices and closing prices to calculate event day 1 market adjusted returns and ignoring
trading costs. There is a similar calculation for the sales of each group. Finally, we
calculate the cumulative (market-adjusted) abnormal return on stocks bought less the
cumulative (market-adjusted) abnormal return on stocks sold as:
CART = ( MAτ
buy
τ=1
T
∑ − MAτsell ) . (2)
The results for a 10 trading day event horizon are displayed in Figure 7. The most
striking results in the graph are: 1) irrespective of experience, traders with past profits
outperform those with past losses and 2) for traders with positive past profits, cumulative
abnormal returns increase with experience, and 3) profitable traders with more than 40
17
days of day trading experience in the last year earn more than enough to cover 40 basis
points of round trip transaction costs. Most of this profit is earned on the day of the
transaction.
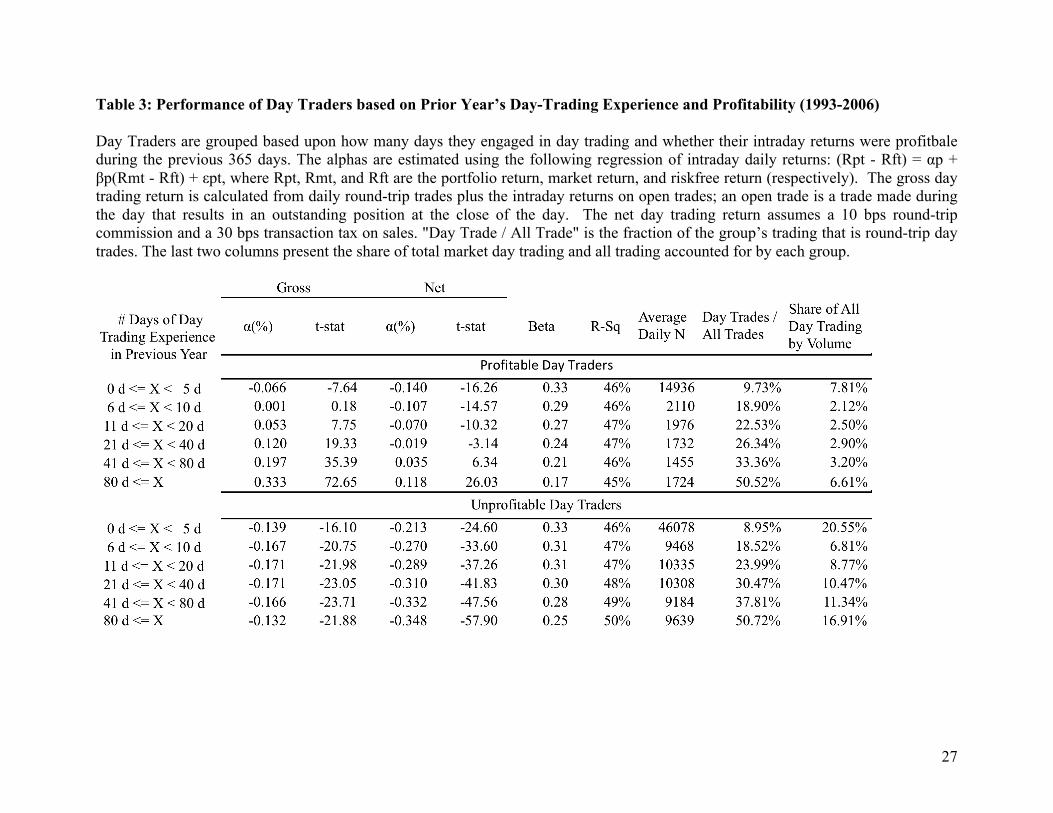
We look at the persistence of profitability from another angle by calculating, as in
Table 1, gross and net abnormal intraday returns. We partition day traders daily using the
same criteria as for Figure 6. Results are reported in Table 3. 1) Irrespective of
experience, traders with past profits outperform those with past losses, 2) for traders with
positive past profits, cumulative abnormal returns increase with experience, and 3)
profitable traders with more than 40 days of day trading experience in the last year earn
more than enough to cover their transaction costs.
These results confirm that an extensive history of profitability is a strong predictor
of future profitable. However, very few traders are predictably profitable. In the last
column of Table 3, we see that only 9.81% (3.20%+6.61%) of day trading volume is
generated by predictably profitable day traders. From column 8, we can calculate that
these predictably profitable traders constitute less than 3% of all day traders on an
average day.
IV. Discussion Our data are remarkably well suited for testing models of rational learning such as
Mahani and Bernhard’s. Mahani and Bernhard write that their “prototypical novice
speculator is the Japanese hairdresser Kiyoshi Wakino” who day trades between giving
haircuts (p. 1317). We observe the day trading of hundreds of thousands of investors over
a seventeen-year period. And while our day traders are Taiwanese and certainly not all
hairdressers, it is probable that—like Kiyoshi Wakino—many of our novice day traders
pursue trading in addition to, if not during, a regular job. Despite the size and
appropriateness of our data, our results simply do not support the rational learning
models. In Mahani and Bernhard’s model, day trading is, in aggregate, profitable because
skilled day traders are able to take advantage of the insensitivity of liquidity traders to
price and the willingness of competitive market-makers to forego a profit. In Taiwan, day
18
traders, in aggregate, lose money. Therefore it is not rational for a risk-averse investor
with no special claim to superior ability to undertake day trading in hopes of discovering
that he is amongst the chosen few. Furthermore, it is not rational for day traders who have
incurred persistent losses to continue day trading for the purpose of learning about their
ability.
So why do investors take up day trading and why do so many persist in the face of
losses? We consider three broadly defined answers to this question.
First, it could be the case that day traders do not have standard risk-averse
preferences; they may be risk-seeking or attracted to investments with highly skewed
investments, such as lotteries, that have negative expected returns but a small probability
of a large payoff as suggested by Kumar (2009). However, the day trading profits that we
document are similar in magnitude to, and far less prevalent than, the losses. Unlike
lottery winners, day traders must succeed on repeated gambles in order to achieve overall
success. Such repeated gambles do not tend to generate highly skewed distributions.
Furthermore, daily day trading returns have a negative mean, and yet lower variance and
less right-hand skewness than the average Taiwanese stocks. Define the annual day
trading return as the sum of the returns earned on each day of day trading. For traders
with a minimum of ten days of day trading, the skewness of the annual return is -0.22
(i.e., modestly negatively skewed). In contrast, when we calculate the skewness of
annual returns across individual stocks listed on the TSE from 1981 to 2009, the
coefficient of skewness is positive in all but one year and averages 2.36. Thus, a risk or
lottery seeker could better maximize his utility, with far less effort, by simply buying and
holding a single volatile stock.
Second, day traders may be overconfident in their prior beliefs about their
abilities and biased in the way they learn. Several papers (e.g., Odean (1998, 1999),
Barber and Odean (2000, 2001)) argue that overconfidence causes investors to trade more
than is in their own best interest. Overconfident day traders may simply be bearing losses
that they did not anticipate. While novice day traders undoubtedly realize that other day
19
traders lose money, stories of successful day traders may circulate in non-representative
proportions, thus giving the impression that success is more frequent than it is. Once
investors undertake day trading, their prior overconfidence may be reinforced through
biased learning as in Gervais and Odean (2001). Furthermore, heavy day traders, who
earn gross profits but net losses, may not fully consider trading costs when assessing their
own ability.
Third, day traders may trade for non-financial motivations including
entertainment, a taste for gambling, and the desire to impress others (see, e.g. Grinblatt
and Keloharju (2009)). Some investors may enjoy the process of day trading so much that
they are willing to persist in the face of regular losses. Some investors may be attracted to
the casino like qualities of day trading with its frequent bets, wins, and losses.8 Some
investors may choose to day trade in hopes of impressing others.9
We are unable to explicitly test whether day traders are motivated by
overconfidence rather than the desire for entertainment, gambling, or to impress others.
Nor is there reason to believe that overconfidence and non-financial motivations are
mutually exclusive. Quite to the contrary, entertainment, gambling, and the desire to
impress others are all likely to be more attractive reasons to trade if one is overconfident
about one’s likelihood of success.
In Mahani and Bernhard’s model, “all speculators are made worse off if some
speculators are slightly overconfident” (p. 1315). Our results are consistent with this
prediction. If heavy day traders persist in trading due to overconfidence, then that
overconfidence is detracting from their own welfare and that of other speculators. The
welfare of the heavy traders themselves is diminished because, on average, they earn net
losses; the welfare of other speculators is diminished because, on average, heavy traders 8 Kumar (2009) shows a correlation between the propensity to gamble and the types of investment decisions U.S. investors make. Barber, Lee, Liu, and Odean (2008) document that the introduction of a National Lottery in Taiwan coincided with a significant drop in trading volume on the Taiwan Stock Exchange. Grinblatt and Keloharju (2009) document that investors prone to sensation seeking trade more frequently. 9 Several papers argue that investment decisions are influenced by social concerns, for example, Barber, Heath, Odean (2003), Statman (2004), and Hong and Kacperczyk (2009).
20
earn gross profits thereby reducing the average returns of other investors. The
beneficiaries of this overconfidence are brokerage firms—through commissions—and the
government—through the transaction tax.
V. Conclusion We test predictions of models of learning by rational traders and find clear
evidence that the decision to continue or increase day trading is influenced by previous
day trading returns. Nevertheless, rational models of learning do not explain all or even
most day trading. The most experienced day traders lose money and nearly 3/4ths of day
trading can be traced to traders with a history of losses. Persistent trading in the face of
losses is inconsistent with models of rational learning. So, too, is the decision to try day
trading when ex-ante expected lifetime profits are negative. For prospective day traders,
“trading to learn” is no more rational or profitable than playing roulette to learn.
21
References Barber, Brad M., Chip Heath, and Terrance Odean, 2003, Good Rationales Sell: Reason-
Based Choice Among Group and Individual Investors in the Stock Market, Management Science, 49, 1636-1652.
Barber, Brad M., Yi-Tsung Lee, Yu-Jane Liu, and Terrance Odean, 2007, Is the Aggregate Investor Reluctant to Realize Losses? Evidence from Taiwan, European Financial Management, 2007, Vol. 13, 423-447.
Barber, Brad M., Yi-Tsung Lee, Yu-Jane Liu, and Terrance Odean, 2008, Just How Much Do Individual Investors Lose by Trading?, Review of Financial Studies, forthcoming.
Barber, Brad M., Yi-Tsung Lee, Yu-Jane Liu, and Terrance Odean, 2010, Do Some
Individual Investors have Skill: Evidence from Day Trading, working paper. Barber, Brad M., and Terrance Odean, 2000, Trading Is Hazardous to Your Wealth: The
Common Stock Investment Performance of Individual Investors, Journal of Finance, 2000, Vol. 55, No. 2, p.773-806.
Barber, Brad M., and Terrance Odean, 2001, Boys will be Boys: Gender,
Overconfidence, and Common Stock Investment, Quarterly Journal of Economics, 116, 261-292.
Chae, Joon, and Albert Wang, 2003, Who Makes Markets? Do Dealers Provide or Take
Liquidity? working paper #4434-03, MIT, Cambridge, MA. De, Sankar , Gondhi, Naveen R. and Pochiraju, Bhimasankaram, 2010, Does Sign Matter
More than Size? An Investigation into the Source of Investor Overconfidence. Available at SSRN: http://ssrn.com/abstract=1657926
Garvey, Ryan, and Anthony Murphy, 2002, How Profitable Day Traders Trade: An
Examination of Trading Profits, working paper, University College Dublin, Dublin, Ireland.
Gervais, Simon, and Terrance Odean, 2001, Learning to be Overconfident, Review of
Financial Studies, 14, 1-27. Garvey, Ryan and Anthony Murphy, 2005, The Profitability of Active Stock Traders,
Journal of Applied Finance, 93-100. Grinblatt, Mark, and Matti Keloharju, 2000, The Investment Behavior and Performance
of Various Investor Types: A Study of Finland’s Unique Data Set, Journal of Financial Economics, 55, 43-67.
22
Grinblatt, Mark, and Matti Keloharju, 2001, What makes investors trade?, Journal of Finance, 56, 589-616.
Grinblatt, Mark, and Matti Keloharju, 2009, Sensation Seeking, Overconfidence, and
Trading Activity, Journal of Finance, 64, 549-578. Harris, Jeffrey H., and Paul H. Schultz, 1998, The Trading Profits of SOES Bandits,
Journal of Financial Economics, 50, 39-62. Hong, Harrison, and Marcin Kacperczyk, 2009, The Price of Sin: The Effects of Social
Norms on Markets, Journal of Financial Economics, 93, 15-36. Kumar, Alok, 2009, Who Gambles in the Stock Market, Journal of Finance, 64, 1889-
1933. Linnainmaa, Juhani T., 2003, The Anatomy of Day Traders. AFA 2004 San Diego
Meetings. Available at SSRN: http://ssrn.com/abstract=472182 or doi:10.2139/ssrn.472182
Linnainmaa, Juhani T., 2005, The Individual Day Trader, 2005, UCLA working paper. Linnainmaa, Juhani T., 2010, Why Do (Some) Households Trade So Much? AFA 2008
New Orleans Meetings Paper. Available at SSRN: http://ssrn.com/abstract=972807
Mahani and Bernhardt, 2007, Financial Speculators’ Underperformance: Learning, Self-
Selection, and Endogenous Liquidity, Journal of Finance, 62, 1313-1340. Nicolosi, Gina, Peng, Liang, and Ning Zhu, 2009, Do Individual Investors Learn from
Their Trading Experience?, Journal of Financial Markets, 12, 317-336. Odean, Terrance, 1998, Volume, Volatility, Price, and Profit When All Traders Are
above Average, Journal of Finance, 53, 1887-1934. Odean, Terrance, 1999, Do Investors Trade too Much?, American Economic Review, 89,
1279-1298. Seasholes, Mark and Guojun Wu, 2007, Predictable Behavior, Profits, and Attention,
Journal of Empirical Finance, 14, 590-610. Seru, Amit, Shumway, Tyler, and Noah Stoffman, 2010, Learning by Trading, Review of
Financial Studies, 23, 705-739. Statman, Meir, 2004, What Do Investors Want?, Journal of Portfolio Management, 153-161.
23
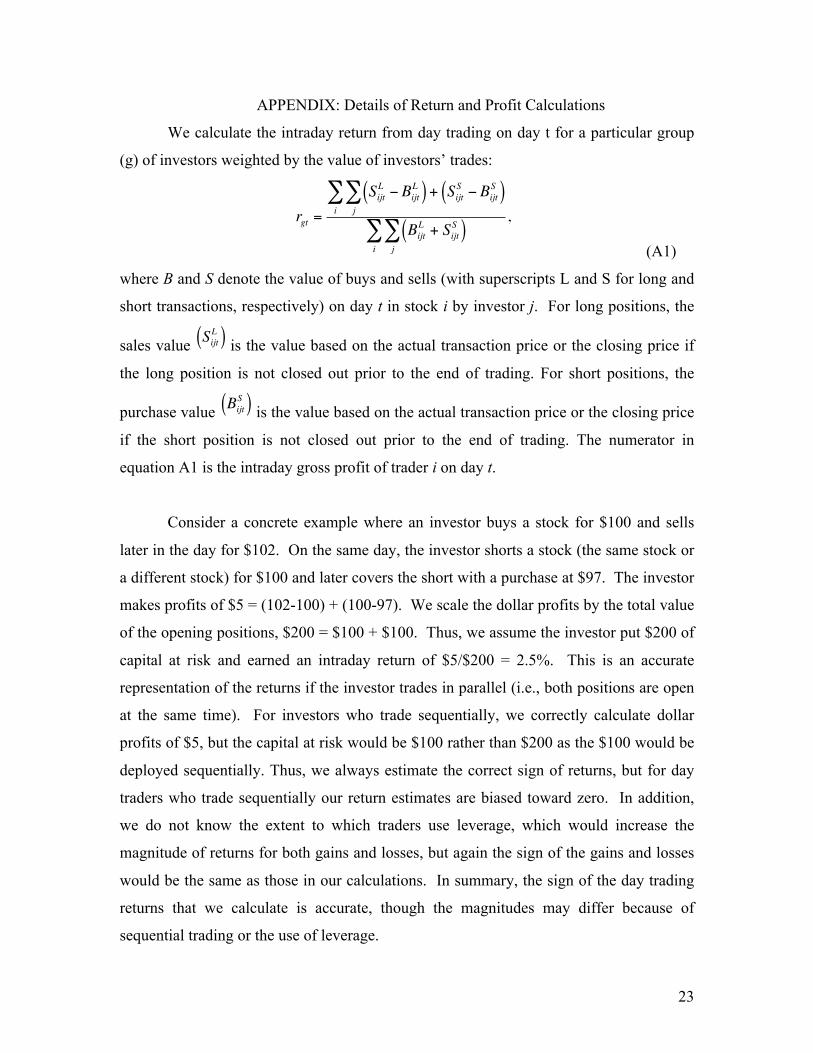
APPENDIX: Details of Return and Profit Calculations
We calculate the intraday return from day trading on day t for a particular group
(g) of investors weighted by the value of investors’ trades:
(A1)
where B and S denote the value of buys and sells (with superscripts L and S for long and
short transactions, respectively) on day t in stock i by investor j. For long positions, the
sales value is the value based on the actual transaction price or the closing price if
the long position is not closed out prior to the end of trading. For short positions, the
purchase value is the value based on the actual transaction price or the closing price
if the short position is not closed out prior to the end of trading. The numerator in
equation A1 is the intraday gross profit of trader i on day t.
Consider a concrete example where an investor buys a stock for $100 and sells
later in the day for $102. On the same day, the investor shorts a stock (the same stock or
a different stock) for $100 and later covers the short with a purchase at $97. The investor
makes profits of $5 = (102-100) + (100-97). We scale the dollar profits by the total value
of the opening positions, $200 = $100 + $100. Thus, we assume the investor put $200 of
capital at risk and earned an intraday return of $5/$200 = 2.5%. This is an accurate
representation of the returns if the investor trades in parallel (i.e., both positions are open
at the same time). For investors who trade sequentially, we correctly calculate dollar
profits of $5, but the capital at risk would be $100 rather than $200 as the $100 would be
deployed sequentially. Thus, we always estimate the correct sign of returns, but for day
traders who trade sequentially our return estimates are biased toward zero. In addition,
we do not know the extent to which traders use leverage, which would increase the
magnitude of returns for both gains and losses, but again the sign of the gains and losses
would be the same as those in our calculations. In summary, the sign of the day trading
returns that we calculate is accurate, though the magnitudes may differ because of
sequential trading or the use of leverage.
€
rgt =
SijtL − Bijt
L( ) + SijtS − Bijt
S( )j∑
i∑
BijtL + Sijt
S( )j∑
i∑
,
€
SijtL( )
€
BijtS( )
24
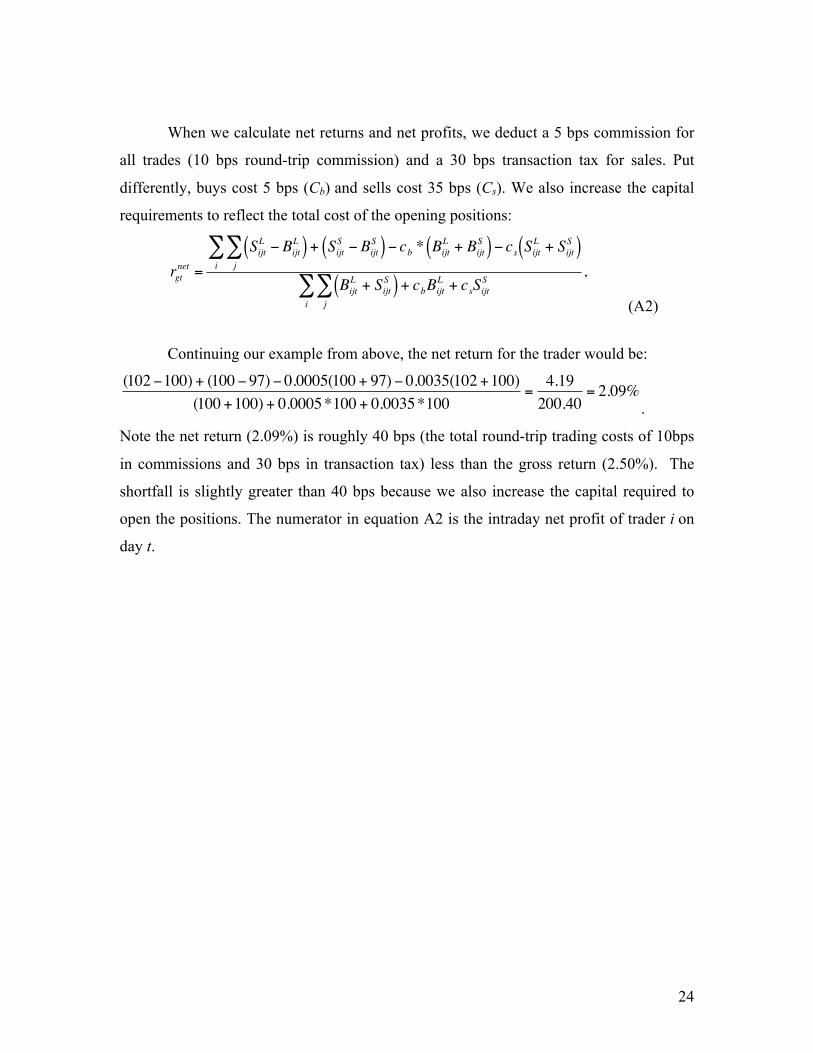
When we calculate net returns and net profits, we deduct a 5 bps commission for
all trades (10 bps round-trip commission) and a 30 bps transaction tax for sales. Put
differently, buys cost 5 bps (Cb) and sells cost 35 bps (Cs). We also increase the capital
requirements to reflect the total cost of the opening positions:
(A2)
Continuing our example from above, the net return for the trader would be:
. Note the net return (2.09%) is roughly 40 bps (the total round-trip trading costs of 10bps
in commissions and 30 bps in transaction tax) less than the gross return (2.50%). The
shortfall is slightly greater than 40 bps because we also increase the capital required to
open the positions. The numerator in equation A2 is the intraday net profit of trader i on
day t.
€
rgtnet =
SijtL − Bijt
L( ) + SijtS − Bijt
S( )j∑
i∑ − cb * Bijt
L + BijtS( ) − cs SijtL + Sijt
S( )
BijtL + Sijt
S( ) + cbBijtL + cs
j∑
i∑ Sijt
S ,
€
(102 −100) + (100 − 97) − 0.0005(100 + 97) − 0.0035(102 +100)(100 +100) + 0.0005*100 + 0.0035*100
=4.19200.40
= 2.09%
25
Table 1: Gross and Net Abnormal Returns from Day Trading: 1992 to 2006 This table presents the daily percentage alpha from aggregate day trading of day traders. Day trading is defined as round-trip trades by the same stock/investor/day. Each day an investor’s trades are included in this analysis if the trader made at least one day trade in the calendar month. The alphas are estimated using the following regression of daily returns: (Rpt-Rft)=αp+βp(Rmt-Rft)+εpt, where Rpt, Rmt, and Rft are the portfolio return, market return, and risk-free return (respectively). The gross day trading return is calculated from daily round-trip trades plus the intraday returns on open trades; an open trade is a trade made during the day that results in an outstanding position at the close of the day. The net day trading return assumes a 10 bps round-trip commission and a 30 bps transaction tax on sales. The last column presents the percentage of all trades that are round-trip day trades.
26
Table 2: Changes in Day Trading Conditional on Experience and Past Profitability (1993-2005)
Day trading is defined as round-trip trades by the same stock/investor/day. In panel A, we present percentage of traders who day trade in month t-1 but not in month t. In Panel B, we present percentage of traders who day trade in month t-1 but not in months t through t+11 We sort traders on experience (rows) and profitability (columns). Experience is the number of previous days on which a trader has day traded through month t-1. Only traders with 10 or more days of day trading experience are included. Profitable day traders are those with mean daily intra-day returns that are positive through month t-1. The analyses begin in 1993 and exclude traders who day traded in 1992. N is the number of trader/month observations.
27
Table 3: Performance of Day Traders based on Prior Year’s Day-Trading Experience and Profitability (1993-2006) Day Traders are grouped based upon how many days they engaged in day trading and whether their intraday returns were profitbale during the previous 365 days. The alphas are estimated using the following regression of intraday daily returns: (Rpt - Rft) = αp + βp(Rmt - Rft) + εpt, where Rpt, Rmt, and Rft are the portfolio return, market return, and riskfree return (respectively). The gross day trading return is calculated from daily round-trip trades plus the intraday returns on open trades; an open trade is a trade made during the day that results in an outstanding position at the close of the day. The net day trading return assumes a 10 bps round-trip commission and a 30 bps transaction tax on sales. "Day Trade / All Trade" is the fraction of the group’s trading that is round-trip day trades. The last two columns present the share of total market day trading and all trading accounted for by each group.
28
Figure 1: Day Trading as a Percent of Total Volume and Number of Individual Day Traders The figure presents the 12-month moving average for (1) the number of individual investors who engage in day trading and (2) day trading as a percent of total trading volume.
29
Figure 2: Example of Trading Activity for a Day Trader
Figure 3: Day Trading Survival Function for Traders with 10 or more Days of Day Trading Experience. Observations are monthly. Traders are considered to have quit day trading in the first month for which we observe no day trading in twelve consecutive months. The sample consists of day traders with a minimum of 10 days of day trading. The entry month is the first month when they exceed 9 days of day trading.
Monday Wednesday Tuesday
♦ Buy
● Sell
▬ Day Trading (Intraday) Returns
--- Long-Run (Interday) Return
▬ Long
▬ Short
30
Figure 4: Hazard Ratio for Quitting Day Trading Conditional on Past Returns 1993-2005. Observations are monthly and exclude traders who day traded in 1992. Traders are considered to have quit day trading in the first month for which we observe no day trading in twelve consecutive months. The figure reports the hazard ratio for quitting and the 95% confidence interval (dashed lines) for different return categories relative to the default category of (0, 5 bps] where the hazard ratio is equal to one by construction. The sample consists of day traders with a minimum of 10 days of day trading. The entry month is the first month when they exceed 9 days of day trading. Returns are the average net daily intraday returns from the month of the 1st day trade to the end of prior month.
31
Figure 5: Day Trading by Occasional Traders, First Time Traders, Unprofitable Traders, and Profitable Traders Occasional day traders are those with 1 to 9 days of past day trading. Profitable (unprofitable) traders are traders with 10 or more days of past day trading whose cumulative intraday net profits are positive (negative or zero).
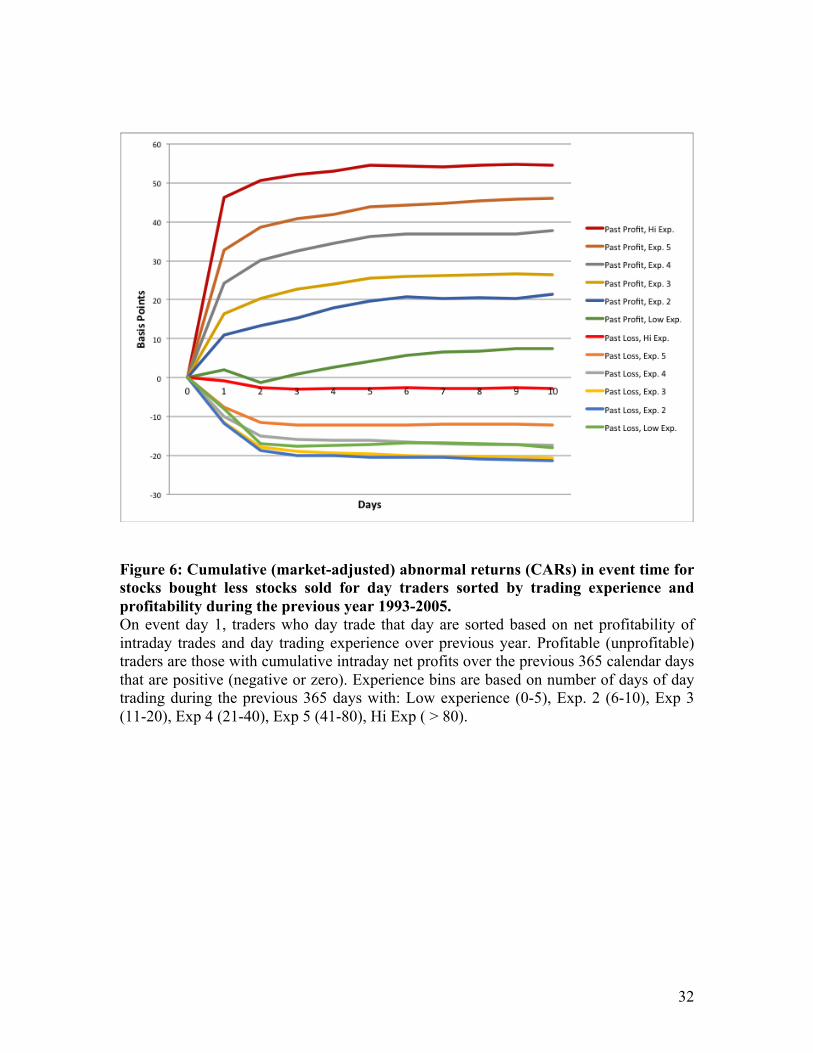
32
Figure 6: Cumulative (market-adjusted) abnormal returns (CARs) in event time for stocks bought less stocks sold for day traders sorted by trading experience and profitability during the previous year 1993-2005. On event day 1, traders who day trade that day are sorted based on net profitability of intraday trades and day trading experience over previous year. Profitable (unprofitable) traders are those with cumulative intraday net profits over the previous 365 calendar days that are positive (negative or zero). Experience bins are based on number of days of day trading during the previous 365 days with: Low experience (0-5), Exp. 2 (6-10), Exp 3 (11-20), Exp 4 (21-40), Exp 5 (41-80), Hi Exp ( > 80).