Embed Size (px)
Citation preview

Do finalisation counts improve loss reserves?
Greg Taylor Taylor Fry Consulting Actuaries
Sydney Australia
Casualty Loss Reserve Seminar, Boston USA 15-17 September 2013
Jing Xu University of New South Wales
Sydney Australia

More formal title
“An empirical investigation of the value of finalisation count information to loss reserving”
Formal paper at https://cas.confex.com/cas/clrs13/webprogram/Session6523.html
Partially funded by Institute of Actuaries of Australia
2 Taylor & Xu Finalisation counts

Purpose
• Consider a data set consisting of triangles of: – Paid loss amounts
– Reported claim counts
– Finalisation counts
• The objective is to forecast the amount of outstanding paid losses – Together with an estimate of prediction error
• Is the prediction error likely to be larger or smaller by virtue of the recognition of the claim counts in the loss reserving model?
3 Taylor & Xu Finalisation counts
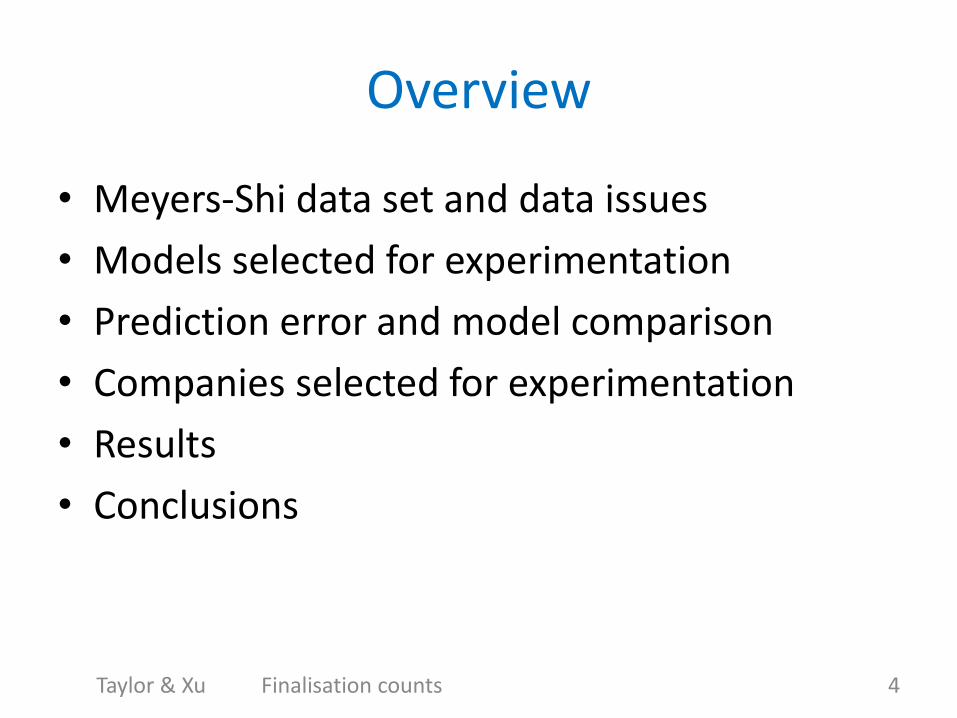
Overview
• Meyers-Shi data set and data issues
• Models selected for experimentation
• Prediction error and model comparison
• Companies selected for experimentation
• Results
• Conclusions
4 Taylor & Xu Finalisation counts

Overview
• Meyers-Shi data set and data issues
• Models selected for experimentation
• Prediction error and model comparison
• Companies selected for experimentation
• Results
• Conclusions
5 Taylor & Xu Finalisation counts

Meyers-Shi data set (1)
• Produced around 2011 by Glenn Meyers & Peng Shi
– See http://www.casact.org/research/index.cfm?fa=loss_reserves_data
• Extracted from Schedule P returns to NAIC
6 Taylor & Xu Finalisation counts

Meyers-Shi data set (2)
• Separate data set for each of 6 LoBs:
– Private passenger auto liability/medical
– Commercial auto/truck liability/medical
– Workers' compensation
– Medical malpractice - Claims made
– Other liability - Occurrence
– Products liability – Occurrence
• For each LoB, a number of companies
7 Taylor & Xu Finalisation counts

Meyers-Shi data set (3) • Form of data
8 Taylor & Xu Finalisation counts
Accident year
1988
1989
1997
Development year 1 2 10
End of calendar year 1997

Meyers-Shi data set (3) • Form of data
9 Taylor & Xu Finalisation counts
Accident year
1988
1989
1997
Development year 1 2 10
End of calendar year 1997
Training data set
Test data set

Meyers-Shi data set (4)
• Content of triangles
– Paid amounts
– Incurred amounts
10 Taylor & Xu Finalisation counts

Meyers-Shi data set (4)
• Content of triangles
– Paid amounts
– Incurred amounts
– No count data!
• Notifications
• Finalisations – Would these not assist?
11 Taylor & Xu Finalisation counts

Finalisation count data (1)
• Reasons given to explain why these counts would not be helpful
– Generally they are unreliable
• They may be gross or net of reinsurance
• The basis may differ from one year to another
• Some companies simply “make them up” – e.g. divide the triangle of paid losses through by some notional
claim size
12 Taylor & Xu Finalisation counts

Finalisation count data (2)
• It get’s worse
– Finalisation counts, though available from Schedule P, are actually derived data
– Raw claim count data comprise • Reported claims
• Unfinalised claims
13 Taylor & Xu Finalisation counts

Finalisation count data (2)
• It get’s worse – Finalisation counts, though available from Schedule P, are
actually derived data
– Raw claim count data comprise • Reported claims
• Unfinalised claims
#finalisations in a cell = opening #unfinalised + #reported – closing #unfinalised
– So if reported or unfinalised counts are inaccurate, then so will the derived counts of finalisations be inaccurate
14 Taylor & Xu Finalisation counts

Finalisation count data (3)
• It is an empirical fact that some triangles of finalisation counts are inaccurate
• Example
15 Taylor & Xu Finalisation counts
Accident
year 1 2 3 4 5 6 7 8 9 10
1988 0 229 162 81 43 23 11 8 -5 4
1989 876 513 231 105 42 25 16 463 7
1990 1424 854 272 108 66 34 305 8
1991 1693 475 182 86 42 1285 17
1992 1476 445 204 95 1922 23
1993 1159 384 152 4690 34
1994 1521 336 8516 57
1995 953 9641 114
1996 8170 114
1997 409
Number of unfinalised reported claims at end of development year
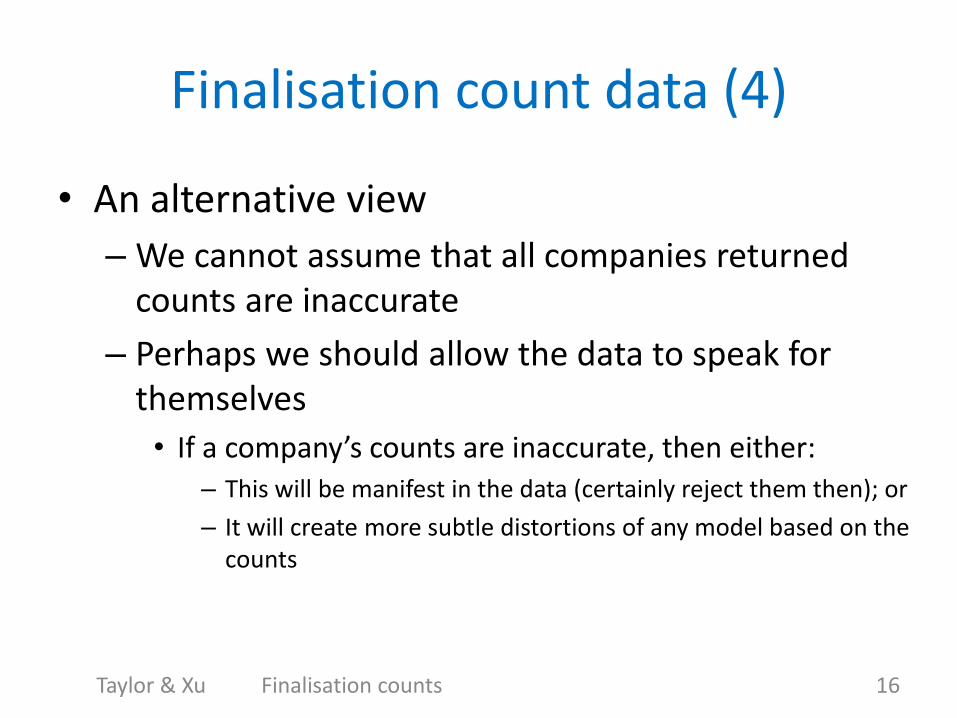
Finalisation count data (4)
• An alternative view
– We cannot assume that all companies returned counts are inaccurate
– Perhaps we should allow the data to speak for themselves
• If a company’s counts are inaccurate, then either: – This will be manifest in the data (certainly reject them then); or
– It will create more subtle distortions of any model based on the counts
16 Taylor & Xu Finalisation counts

Finalisation count data (5)
• Suggested general procedure for forecasting loss reserve – Apply a number of models to the data
• Some dependent on counts • Some independent of counts
– For each model generate: • Forecast • Associated uncertainty, e.g. mean square error of prediction
(“MSEP”)
– Select model with smallest MSEP • For current purposes we omit the possibility of a further reduction
in MSEP by means of a combination of models
– Any inaccuracies in the count data can be expected to enlarge the MSEP of models depending on them
17 Taylor & Xu Finalisation counts

Finalisation count data (5)
• On the basis of these arguments, Glenn and Peng agreed to extract triangles of Schedule P count data for 3 of the 6 LoBs: – Private passenger auto liability/medical – Commercial auto/truck liability/medical – Workers' compensation
• We chose to experiment with workers' compensation data since: • This would be the longest tailed of the 3 LoBs • We considered that it would carry the greatest forecast uncertainty
– In fact, workers' compensation is not especially long tailed • We would expect the methods we develop here to produce even
stronger results for Auto Bodily Injury or General Liability
18 Taylor & Xu Finalisation counts

Final data set
• Workers' compensation
– Training triangle and test triangle for:
• Paid amounts
• Incurred amounts
• Reported counts
• Unfinalised (equivalently, finalised) counts
19 Taylor & Xu Finalisation counts

Overview
• Meyers-Shi data set and data issues
• Models selected for experimentation
• Prediction error and model comparison
• Companies selected for experimentation
• Results
• Conclusions
20 Taylor & Xu Finalisation counts

Models selected for experimentation
1. Chain ladder: widely used, independent of claim counts
2. A model that recognises claim counts, especially finalisation counts – Sensitive to changes in the rate of claim finalisation
3. An intermediate model that recognises counts of reported claims but not finalisations – Insensitive to changes in the rate of claim finalisation;
BUT – Not based on age-to-age ratios, so forecasts for latest
accident years possibly less volatile than chain ladder
21 Taylor & Xu Finalisation counts

Chain ladder: preliminaries (1)
• Notation
𝑘 denotes accident year
𝑗 denotes development year
𝑌𝑘𝑗 denotes incremental claim amount in 𝑘, 𝑗 cell
𝑌𝑘𝑗∗ = 𝑌𝑘𝑖
𝑗𝑖=1 denotes cumulative claim amount
to 𝑘, 𝑗 cell
22 Taylor & Xu Finalisation counts

Chain ladder: preliminaries (2)
• Poisson distribution 𝑌~𝑃𝑜𝑖𝑠𝑠𝑜𝑛 𝜇
𝐸 𝑌 = 𝜇 𝑉𝑎𝑟 𝑌 = 𝜇
• Over-dispersed Poisson (ODP) distribution
– Define 𝑍 by 𝑍/ 𝜙 ~ 𝑃𝑜𝑖𝑠𝑠𝑜𝑛(𝜇/𝜙)
𝐸 𝑍 = 𝜇 𝑉𝑎𝑟 𝑍 = 𝜙𝜇
– Write 𝒁~𝑶𝑫𝑷(𝝁, 𝝓)
23 Taylor & Xu Finalisation counts
mean scale parameter, dispersion parameter

Chain ladder (ODP Mack form)
1) Accident periods are stochastically independent, i.e. 𝑌𝑘1𝑗1
, 𝑌𝑘2𝑗2 are stochastically independent if 𝑘1 ≠ 𝑘2.
2) For each 𝑘 = 1,2, … , 𝐽, the 𝑌𝑘𝑗∗ (j varying) form a
Markov chain.
3) For each 𝑘 = 1,2, … , 𝐽 and 𝑗 = 1,2, … , 𝐽 − 1, define 𝐺𝑘𝑗 = 𝑌𝑘,𝑗+1 𝑌𝑘𝑗
∗ and suppose that
𝐺𝑘𝑗~𝑂𝐷𝑃 𝑔𝑗 , 𝜙 𝑌𝑘𝑗∗ 2
, where 𝜙 is independent of
𝑘, 𝑗
24 Taylor & Xu Finalisation counts
𝟏 + 𝑮𝒌𝒋 = conventional age-to-age factor

Why the ODP Mack form?
• This project is concerned with loss reserving with estimated prediction error
• Estimation of prediction error requires a stochastic model
• The chain ladder is not conventionally formulated as a stochastic model
• BUT the ODP Mack version: – Is stochastic; and
– Its maximum likelihood estimates of age-to-age factors coincide with the conventional ones
25 Taylor & Xu Finalisation counts

A model that recognises reported claim counts (1)
• Notation 𝑁𝑘𝑗 denotes incremental reported claim count in 𝑘, 𝑗
cell
𝑁𝑘 = 𝑁𝑘𝑗∞𝑗=1 = number of claims incurred in accident
year 𝑘
𝑁 𝑘 = 𝑁 𝑘𝑗∞𝑗=1 = an estimate of the number incurred,
from a chain ladder model
• Note that 𝑘 + 𝑗 − 1 denotes experience year, often called payment year, situated on the 𝑘 + 𝑗 − 1 -th diagonal of a triangle
26 Taylor & Xu Finalisation counts

A model that recognises reported claim counts (2)
1) All 𝑌𝑘𝑗 are stochastically independent
2) For each 𝑘 = 1,2, … , 𝐽 and 𝑗 = 1,2, … , 𝐽, suppose that 𝑌𝑘𝑗 ~ 𝑂𝐷𝑃 𝑁𝑘𝜋𝑗𝜆 𝑘 + 𝑗 − 1 , 𝜙𝑘𝑗
where
• 𝜋𝑗 , 𝑗 = 1,2, … , 𝐽 are parameters
• 𝜆: [1, 2, 3, . . , 2𝐽 − 1] → ℜ
27 Taylor & Xu Finalisation counts

A model that recognises reported claim counts (3)
𝒀𝒌𝒋 ~ 𝑶𝑫𝑷 𝑵𝒌𝝅𝒋𝝀 𝒌 + 𝒋 − 𝟏 , 𝝓𝒌𝒋
Equivalently
𝑌𝑘𝑗 𝑁𝑘 ~ 𝑂𝐷𝑃 𝜋𝑗𝜆 𝑘 + 𝑗 − 1 , 𝜙𝑘𝑗 𝑁𝑘2
28 Taylor & Xu Finalisation counts
Payment per claim incurred (“PPCI”)
Dependent on only experience year (diagonal) 𝑘 + 𝑗 − 1 Used to represent claims inflation • Unknown • Requiring estimation
Dependent on only 𝑗 Expected PPCI in the absence of any claim cost inflation

A model that recognises reported claim counts (4)
𝒀𝒌𝒋 𝑵𝒌 ~ 𝑶𝑫𝑷 𝝅𝒋𝝀 𝒌 + 𝒋 − 𝟏 , 𝝓𝒌𝒋 𝑵𝒌𝟐
• Express in GLM form
𝑌𝑘𝑗 𝑁 𝑘 ~ 𝑂𝐷𝑃 𝜇𝑘𝑗 , 𝜙 𝑁 𝑘2
where
𝜇𝑘𝑗 = 𝑒𝑥𝑝 𝑙𝑛 𝜋𝑗 + 𝑙𝑛 𝜆 𝑘 + 𝑗 − 1
• Inflation function 𝜆 . needs to be expressed in a form that is linear in a set of parameters – Simplest available form is
λ 𝑚 = λ𝑚, λ = const. > 0
𝜇𝑘𝑗 = 𝑒𝑥𝑝 𝑙𝑛 𝜋𝑗 + (𝑗 + 𝑘 − 1) 𝑙𝑛 𝜆
– Though there will be experimentation with other forms as necessary
29 Taylor & Xu Finalisation counts
Default assumption: • 𝜙𝑘𝑗constant over
all cells • Empirically
reasonable
A model that recognises claim finalisation counts (1)
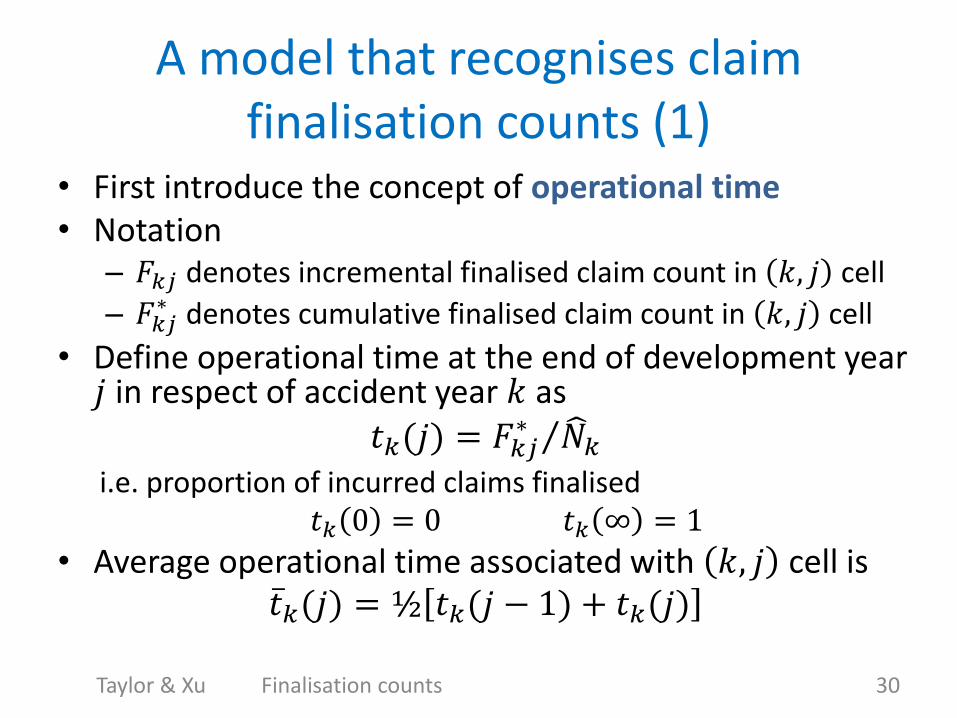
• First introduce the concept of operational time • Notation
– 𝐹𝑘𝑗 denotes incremental finalised claim count in 𝑘, 𝑗 cell
– 𝐹𝑘𝑗∗ denotes cumulative finalised claim count in 𝑘, 𝑗 cell
• Define operational time at the end of development year 𝑗 in respect of accident year 𝑘 as
𝑡𝑘(𝑗) = 𝐹𝑘𝑗∗ 𝑁 𝑘
i.e. proportion of incurred claims finalised 𝑡𝑘 0 = 0 𝑡𝑘 ∞ = 1
• Average operational time associated with 𝑘, 𝑗 cell is 𝑡 𝑘(𝑗) = ½ 𝑡𝑘(𝑗 − 1) + 𝑡𝑘(𝑗)
30 Taylor & Xu Finalisation counts

A model that recognises claim finalisation counts: payments sub-model (1)
1) All 𝑌𝑘𝑗 are stochastically independent
2) For each 𝑘 = 1,2, … , 𝐽 and 𝑗 = 1,2, … , 𝐽, suppose that
𝑌𝑘𝑗 ~ 𝑂𝐷𝑃 𝐹𝑘𝑗 𝜓 𝑡 𝑘(𝑗) 𝜆 𝑘 + 𝑗 − 1 , 𝜙𝑘𝑗
where
– 𝜓: [0,1] → ℜ;
– 𝜆 . is an inflation function of the same type as previously
31 Taylor & Xu Finalisation counts
Based on concept of “settlement queue”

A model that recognises claim finalisation counts: payments sub-model (2)
𝒀𝒌𝒋 ~ 𝑶𝑫𝑷 𝑭𝒌𝒋 𝝍 𝒕 𝒌(𝒋) 𝝀 𝒌 + 𝒋 − 𝟏 , 𝝓𝒌𝒋
Equivalently
𝑌𝑘𝑗 𝐹𝑘𝑗 ~ 𝑂𝐷𝑃 𝜓 𝑡 𝑘(𝑗) 𝜆 𝑘 + 𝑗 − 1 , 𝜙 𝑤𝑘𝑗𝐹𝑘𝑗2
32 Taylor & Xu Finalisation counts
Payment per claim finalised (“PPCF”)
Dependent on only experience year (diagonal) 𝑘 + 𝑗 − 1 Used to represent claims inflation • Unknown • Requiring estimation
Dependent on only 𝑗 Expected PPCF in the absence of any claim cost inflation
Weight

0.3 0.4 0.5 0.6 0.7 0.8 0.9 1.0
-4-2
02
Operational time
Sta
nd
ard
ize
d r
esid
ua
l
A model that recognises claim finalisation counts: payments sub-model (3)
𝒀𝒌𝒋 𝑭𝒌𝒋 ~ 𝑶𝑫𝑷 𝝍 𝒕 𝒌(𝒋) 𝝀 𝒌 + 𝒋 − 𝟏 , 𝝓 𝒘𝒌𝒋𝑭𝒌𝒋𝟐
33 Taylor & Xu Finalisation counts
???
Residual plot for 𝑤𝑘𝑗 = 1 Set 𝑤𝑘𝑗 =
5 + 100 𝑡 𝑘(𝑗) − 0.92 −2 for 𝑡 𝑘 𝑗 ≥ 0.92

A model that recognises claim finalisation counts: finalisations sub-model (1)
• Consider forecasts of future claim amounts
𝒀𝒌𝒋 ~ 𝑶𝑫𝑷 𝑭𝒌𝒋 𝝍 𝒕 𝒌(𝒋) 𝝀 𝒌 + 𝒋 − 𝟏 , 𝝓𝒌𝒋
𝐸 𝑌𝑘𝑗 = 𝐹𝑘𝑗 𝜓 𝑡 𝑘(𝑗) 𝜆 𝑘 + 𝑗 − 1
𝑌 𝑘𝑗 = 𝐹 𝑘𝑗𝜓 𝑡 𝑘(𝑗) 𝜆 𝑘 + 𝑗 − 1
34 Taylor & Xu Finalisation counts
Estimated by payments sub-model GLM
Requires a sub-model of finalisation counts

A model that recognises claim finalisation counts: finalisations sub-model (2)
• Notation – Let 𝑈𝑘𝑗 denote the number of reported but unclosed
claims at the end of development year 𝑗 in respect of accident year 𝑘
• Sub-model
1) All 𝐹𝑘𝑗 are stochastically independent
2) For each 𝑘 = 1,2, … , 𝐽 and 𝑗 = 1,2, … , 𝐽, suppose that
𝐹𝑘𝑗 ~ Bin 𝑈𝑘,𝑗−1 + 𝑁𝑘𝑗 , 𝑝𝑗
where the 𝑝𝑗 are parameters (finalisation probabilities)
35 Taylor & Xu Finalisation counts

A model that recognises claim finalisation counts: forecast algorithm
𝐹 𝑘𝑗 = 𝑈 𝑘,𝑗−1 + 𝑁 𝑘𝑗 𝑝 𝑗
𝑈 𝑘𝑗 = 𝑈 𝑘,𝑗−1 + 𝑁 𝑘𝑗 − 𝐹 𝑘𝑗
𝑡 𝑘(𝑗) = 𝐹 𝑘𝑗∗ 𝑁 𝑘
𝑡 𝑘 𝑗 = ½ 𝑡 𝑘 𝑗 − 1 + 𝑡 𝑘 𝑗
𝑌 𝑘𝑗 = 𝐹 𝑘𝑗𝜓 𝑡 𝑘(𝑗) 𝜆 𝑘 + 𝑗 − 1
36 Taylor & Xu Finalisation counts

A model that recognises claim finalisation counts: payments sub-model re-visited (1)
𝒀𝒌𝒋 ~ 𝑶𝑫𝑷 𝑭𝒌𝒋 𝝍 𝒕 𝒌(𝒋) 𝝀 𝒌 + 𝒋 − 𝟏 , 𝝓𝒌𝒋
• Initial model form:
𝑙𝑛 𝜓 𝑡 = 𝛽1𝑡 + 𝛽2𝑡 2
𝜆 . restricted to linear (constant inflation rate) or linear spline (piecewise constant inflation rate).
37 Taylor & Xu Finalisation counts
𝑡 ∈ 0,1
Estimating a function of a continuous variable, not
development year

A model that recognises claim finalisation counts: payments sub-model re-visited (2)
• Initial model form:
𝑙𝑛 𝜓 𝑡 = 𝛽1𝑡 + 𝛽2𝑡 2
• Anomalies identified from residual plots and modelled as necessary
38 Taylor & Xu Finalisation counts
An anomalous experience year A trending data set
2 4 6 8 10
-3-2
-10
1
Payment year
Sta
ndar
dize
d re
sidu
al
2 4 6 8 10
-10
12
3
Payment year
Stan
dard
ized
resi
dual

A model that recognises claim finalisation counts: extrapolation of inflation
𝒀 𝒌𝒋 = 𝑭 𝒌𝒋𝝍 𝒕 𝒌(𝒋) 𝝀 𝒌 + 𝒋 − 𝟏
• It has been assumed as a normative measure that
𝜆 𝑠 = 𝜆 𝐽 + 𝑘 − 1 for 𝑠 > 𝐽 + 𝑘 − 1
39 Taylor & Xu Finalisation counts
Forecasts require future values of inflation index
Last observed diagonal
Nil future inflation

PPCF model schematic summary
40 Taylor & Xu Finalisation counts
Finalisation
count data
Reported
claim count
data
GLM
Reported
claim count
forecast
OT data
Paid loss
data
PPCF
data
Finalisation
count forecast
GLM
PPCF
forecast

Overview
• Meyers-Shi data set and data issues
• Models selected for experimentation
• Prediction error and model comparison
• Companies selected for experimentation
• Results
• Conclusions
41 Taylor & Xu Finalisation counts

Prediction error (1)
• Estimated by means of parametric bootstrap – Details in paper
• Every sub-model of a model involves estimation and forecast – Hence a source of prediction error
– This must be accounted for in the bootstrap
• Hence
42 Taylor & Xu Finalisation counts
Model Number of sources of prediction error
Chain ladder 1
PPCI 2
PPCF 3

Prediction error (2)
• Some statisticians have argued that models such as PPCF are bound to predict less efficiently than other simpler models because of the drag of the additional sub-models
• But in situations where the simpler models are poor representations of reality the greater accuracy of the more complex models may overcome this drag
43 Taylor & Xu Finalisation counts

Comparison between models
• MSEP estimated by bootstrap
• Converted to coefficient of variation (“CoV”) = MSEP/forecast
• Model with lowest CoV regarded as the producing the most efficient forecast
• N.B. models are NOT assessed by reference to the closeness of their predictions to the outcomes of the test data sets
44 Taylor & Xu Finalisation counts

Overview
• Meyers-Shi data set and data issues
• Models selected for experimentation
• Prediction error and model comparison
• Companies selected for experimentation
• Results
• Conclusions
45 Taylor & Xu Finalisation counts

Quality of companies’ data sets
46 Taylor & Xu Finalisation counts
Nature of data defect Number of
companies
Only small amounts of incurred losses 49
Start-up during period of training data set 14
Wind-down during period of training data set 7
Incurred loss amounts submitted only for a subset of training data
set diagonals
7
No finalisation count data submitted 6
Finalisation count data submitted only for a subset of training data
set diagonals
5
Virtually no paid loss data submitted 1
Reported claim count data submitted only for a subset of training
data set diagonals
1
No defect 76
Total 166

Selection of data sets for experimentation
• Meyers-Shi data set was searched for companies exhibiting: – Variations in OT profiles by accident year (changes in rates of
claim finalisation) • i.e. 𝑡𝑘(𝑗) as a function of 𝑗 varies as 𝑘 varies • Especially, variations in 𝑡𝑘(1) • Or variations in 𝑡𝑘 1998 − 𝑘 (final diagonal of training data set)
– Companies exhibiting large changes in premium volume over the 10 accident years in the training data set were excluded
• All of these criteria were expressed in terms of objective measures – Details in paper
• On this basis, selected 9 companies for detailed analysis – 7 of the 9 exhibited fairly clear changes in rates of claim
finalisation over past years
47 Taylor & Xu Finalisation counts

Overview
• Meyers-Shi data set and data issues
• Models selected for experimentation
• Prediction error and model comparison
• Companies selected for experimentation
• Results
• Conclusions
48 Taylor & Xu Finalisation counts

Results: prediction errors of models
49 Taylor & Xu Finalisation counts
Limited evidence of instability in rates of finalisation
Company
Chain PPCI PPCF Chain PPCI PPCF
ladder ladder
#671 18 11 11 120 106 91
#723 12 8 9 94 101 118
#1538 24 14 11 105 95 138
#1694 6 6 8 83 87 94
#1767 5 5 4 93 109 106
#3360 6 12 22 52 64 81
#4731 8 8 8 123 96 109
#4740 7 6 7 104 94 82
#38733 10 9 22 88 89 289
CoV (%) Ratio to actual (%) Model Number Percentage
of wins of wins
Chain ladder 1.8 20%
PPCI 4.3 48%
PPCF 2.8 31%
Total 9 100%

Results company by company: #1538
50 Taylor & Xu Finalisation counts
Company
Chain PPCI PPCF Chain PPCI PPCF
ladder ladder
#1538 24 14 11 105 95 138
CoV (%) Ratio to actual (%)
Accident
year 1 2 3 4 5 6 7 8 9 10
1988 0.367 0.081 0.030 0.012 0.0057 0.0024 0.0003 0.0003 0.0000 0.0000
1989 0.393 0.097 0.043 0.021 0.0091 0.0042 0.0022 0.0017 0.0015
1990 0.373 0.102 0.047 0.024 0.0116 0.0034 0.0025 0.0015
1991 0.478 0.112 0.048 0.023 0.0131 0.0085 0.0074
1992 0.381 0.078 0.028 0.011 0.0057 0.0035
1993 0.382 0.079 0.029 0.010 0.0048
1994 0.362 0.086 0.039 0.026
1995 0.363 0.090 0.054
1996 0.364 0.114
1997 0.450
Complement of operational time attained by end of development year Persistently high degree of variation in finalisation rates Classical case in favour of PPCF model

Results company by company
• Other cases of high performance by PPCF model are similar
• We don’t dwell on them
• More interesting to examine cases of poor performance by PPCF model
51 Taylor & Xu Finalisation counts

Results company by company: #3360
52 Taylor & Xu Finalisation counts
Company
Chain PPCI PPCF Chain PPCI PPCF
ladder ladder
#3360 6 12 22 52 64 81
CoV (%) Ratio to actual (%)
Accident
year 1 2 3 4 5 6 7 8 9 10
1988 0.119 0.075 0.046 0.032 0.025 0.015 0.008 0.005 0.004
1989 0.483 0.149 0.093 0.062 0.045 0.025 0.015 0.008 0.006
1990 0.473 0.109 0.049 0.008 -0.036 -0.051 0.018 0.014
1991 0.557 0.222 0.168 0.088 0.057 0.033 0.024
1992 0.561 0.225 0.122 0.058 0.025 0.011
1993 0.567 0.172 0.091 0.029 0.015
1994 0.576 0.182 0.052 0.032
1995 0.485 0.114 0.069
1996 0.273 0.092
1997 0.498
Complement of operational time attained by end of development year
Apparently erroneous count data

Results company by company: #38733
53 Taylor & Xu Finalisation counts
Company
Chain PPCI PPCF Chain PPCI PPCF
ladder ladder
#38733 10 9 22 88 89 289
CoV (%) Ratio to actual (%)
Accident
year 1 2 3 4 5 6 7 8 9 10
1988 2,057 1,520 84 18 27 1 14 7 37 1
1989 3,524 834 111 64 7 13 10 282 3
1990 4,438 836 178 6 24 15 4 4
1991 4,577 821 111 62 30 18 3
1992 5,656 913 142 55 25 10
1993 6,067 1,011 143 46 29
1994 5,760 940 120 46
1995 5,487 820 113
1996 5,190 734
1997 4,908
Finalisation count in development year
Apparently erroneous count data again

Results company by company: #1694
54 Taylor & Xu Finalisation counts
Company
Chain PPCI PPCF Chain PPCI PPCF
ladder ladder
#1694 6 6 8 83 87 94
CoV (%) Ratio to actual (%)
Accident
year 1 2 3 4 5 6 7 8 9 10
1988 0.261 0.065 0.031 0.018 0.010 0.006 0.005 0.003 0.002 0.001
1989 0.260 0.064 0.032 0.018 0.012 0.008 0.005 0.004 0.003
1990 0.191 0.060 0.031 0.019 0.012 0.008 0.005 0.004
1991 0.197 0.061 0.032 0.019 0.012 0.009 0.006
1992 0.197 0.061 0.030 0.017 0.011 0.008
1993 0.200 0.060 0.031 0.018 0.012
1994 0.242 0.063 0.033 0.018
1995 0.219 0.060 0.028
1996 0.225 0.060
1997 0.232
Complement of operational time attained by end of development yearOnly a single noticeable change in rates of finalisation

Results company by company: #4731
55 Taylor & Xu Finalisation counts
Company
Chain PPCI PPCF Chain PPCI PPCF
ladder ladder
#4731 8 8 8 123 96 109
CoV (%) Ratio to actual (%)
• Already noted limited evidence of instability in rates of finalisation
• Any evident instability appeared in development years 6 to 8
• These development years • Do not affect accident years
1989 and 1990 • Crucially affect accident years
1991 to 1993 • Have steadily decreasing effect
on accident years 1994 and later
Accident
year chain PPCI PPCF
ladder
1989 76 73 93
1990 38 38 44
1991 29 28 28
1992 21 21 19
1993 17 16 14
1994 12 12 10
1995 9 9 9
1996 7 7 7
1997 5 5 6
Total 8 8 8
Estimated CoV of loss reserve (%)

Overview
• Meyers-Shi data set and data issues
• Models selected for experimentation
• Prediction error and model comparison
• Companies selected for experimentation
• Results
• Conclusions
56 Taylor & Xu Finalisation counts

Conclusions (1)
• Let the data speak for themselves – The use of count data is justified if this leads to lower prediction
error
• Results based on only a small selection (9) of workers compensation portfolios – However, consistent and coherent narrative emerges – Would expect improved relative performance of PPCF model in
some longer tailed lines, e.g. Auto Bodily Injury, Public Liability
• For objectivity, all three models have been applied in as mechanistic fashion – The chain ladder may be seen as inherently more mechanistic
than the others – So the models based on count data may be at a disadvantage in
this comparison
57 Taylor & Xu Finalisation counts

Conclusions (2)
• When an insurer data set shows material and persistent changes in the rate of claim finalisation – There is an a priori expectation that claim count
data might be of value
– And, empirically, they are
– The chain ladder is usually out-performed by PPCI or PPCF model, particularly the latter
– Sometimes this conclusion may apply only to selected accident years
58 Taylor & Xu Finalisation counts