Embed Size (px)
Citation preview

Do Firms Believe in Interest Rate Parity?
Matthew R. McBrady
Bain Capital, LLC
Sandra Mortal
University of Missouri
Michael J. Schill
Darden Graduate School of Business Administration
University of Virginia
December 2007
Abstract
We test whether the currency denomination decisions of firms issuing debt are consistent
with a belief in both covered and uncovered interest rate parity. For a broad sample of
international corporate bonds denominated in six major currencies, we find strong and
consistent evidence that firms alter the currency composition of their debt to respond to
differences in covered and uncovered borrowing rates across currencies. We observe that
emerging market and non-investment grade issuers are less likely to respond to
differences in covered yields consistent with their limited access to currency swap
markets. We conclude that although the gains that firms achieve through opportunistic
currency denomination are economically significant, they may still be consistent with
well-functioning markets.
We are grateful to Yiorgos Allayannis, Keith Brown, Susan Chaplinsky, Melanie Cao, Robert Dubil, Bob
Harris, Michael King, Marc Lipson, Stephen Magee, Bernadette Minton, Michel Robe, Mark Seasholes,
Paul Tetlock, John Wald, Frank Warnock, and Yangru Wu for useful comments. We also wish to
acknowledge valuable feedback from seminar audiences at the Bank of Canada, Darden, Penn State,
SUNY-Binghamton, Texas, and Virginia Tech, and the Northern Finance Association meetings, the
American Finance Association meetings, the Financial Management Association meetings, the
Assurant/Georgia Tech Conference on International Finance, and the McGill Finance Symposium.
Michael Schill is the corresponding author and can be reached at 434-924-4071 or [email protected].

Do Firms Believe in Interest Rate Parity?
Abstract
We test whether the currency denomination decisions of firms issuing debt are consistent
with a belief in both covered and uncovered interest rate parity. For a broad sample of
international corporate bonds denominated in six major currencies, we find strong and
consistent evidence that firms alter the currency composition of their debt to respond to
differences in covered and uncovered borrowing rates across currencies. We observe that
emerging market and non-investment grade issuers are less likely to respond to
differences in covered yields consistent with their limited access to currency swap
markets. We conclude that although the gains that firms achieve through opportunistic
currency denomination are economically significant, they may still be consistent with
well-functioning markets.

1
1. Introduction
Interest rate parity is a bedrock assumption of international finance. It asserts that debt
yields are equivalent across currencies when considering expected movements in
exchange rate spot rates (uncovered parity) or prevailing forward exchange rates (covered
parity). Given its importance to international finance, the academic literature on interest
rate parity is justifiably vast. Nevertheless, although there is a rich understanding of the
behavior of interest and exchange rates, there is surprisingly little understanding of how
market participants respond to cross-currency variation in interest rates. In this paper, we
examine the currency denomination decisions of firms issuing debt in international bond
markets to test whether their behavior is consistent with a belief in the parity of covered
and uncovered interest rates.
Shortly after the breakdown of the Bretton Woods system of fixed exchange rates,
Frenkel and Levich (1975, 1977) established much of the theoretical and empirical
support for covered interest parity in the short-term currency markets. In that context,
covered interest arbitrage strategies are simple and relatively costless. Essentially they
amount to lending in high interest currencies and borrowing in low interest currencies,
exchanging the proceeds from the loan in the spot market, and selling the proceeds of the
investment (plus interest) in the forward market. As a result of the limited risk and
transaction costs over short-term horizons, covered interest parity holds to a first
approximation in normal market conditions.
Covered interest parity for short-term interest rates, however, does not guarantee covered
interest parity for longer-term bond yields. With larger frictions to arbitrage across
currencies, the yields at which firms can issue bonds in different currencies need not be
the same even after long-horizon currency risk is hedged with currency swaps (Clinton,
1988 and McBrady, 2003).1 The standard assumption is that the magnitude of the
1 In practice, firms hedge long-term foreign currency denominated debt with a collection of swap contracts.
The first contract is a foreign currency interest rate swap contract where the borrower promises to exchange
fixed rate interest payments in the foreign currency for floating rate interest payments in the foreign
currency. The second contract is a basis swap contract where the borrower promises to exchange floating

2
deviation from interest rate parity should be bounded by the cost of executing and
holding the round-trip arbitrage position. Deardorff (1979) argues that monitoring
differences in covered interest yields and effectively enforcing long-term covered interest
parity may be left to bond issuers conducting ―one-way arbitrage‖ as they
opportunistically denominate borrowing in low yield currencies. In this paper, we
observe corporate borrowing behavior that is consistent with this proposition. Firms
systematically issue bonds denominated in currencies with relatively lower covered
yields and that those perceived borrowing opportunities subsequently disappear. This
finding suggests that opportunistic issuance by firms may be a primary mechanism for
driving covered interest yields toward parity.
For uncovered interest yields, the empirical evidence for short-horizon exchange rate
behavior is overwhelmingly inconsistent with interest rate parity. In fact, the failure of
short-horizon uncovered interest parity, the so-called ―forward premium puzzle,‖ is one
of the most well documented phenomena in international finance (see, for example, Froot
and Thaler, 1990). At longer horizons, relevant to corporate bond issuance, the evidence
of interest rate parity is more mixed. Chinn and Meredith (2004), for example, present
evidence consistent with interest rate parity for 5 and 10-year yields. We investigate
whether firms systematically denominate bonds in currencies with relatively low nominal
yields and/or those currencies that tend to depreciate.2 Once again, we find strong
interest payments in the foreign currency for floating interest payments in the domestic currency. The last
contract is an interest rate swap contract in the domestic currency where the borrower promises to exchange
floating interest payments in the domestic currency for fixed interest payments in the domestic currency.
The aggregate effect of the collection of three swap contracts is to transform fixed rate interest payments in
the foreign currency to fixed rate interest payments in the domestic currency for a particular maturity that
matches that of the original debt contract. In effect the collection of swap contracts mimics the effect of a
series of forward exchange rate contracts at maturities that match the swap contract terms. For a further
discussion of how bond issuers use currency swaps to hedge foreign-currency bond issuance, see Fletcher
and Taylor (1996) or McBrady and Schill (2007). 2 Such interest rate and exchange rate gaming has long been a conjecture of corporate lending. A 1979
Business Week article provides a case in point. ―After going heavily into Swiss franc debt in the 1960s, the
multinationals saw the franc shoot up by 130% against the dollar between 1970 and 1978. A $100 million
loan made in 1969 had turned into a $230 million liability nightmare nine years later. That sort of thing
cost dozens of corporate treasurers their jobs. But if the Swiss franc now stabilizes against the dollar—as
many foreign exchange analysts are predicting—not going into Swiss franc debt could also mean the loss
of millions of dollars in unnecessary, extra costs for loans. Behind this career-making or career-breaking
dilemma, of course, is the yawning interest rate differential that has opened up between U.S. dollar and
Swiss franc borrowing. Imperial Chemical Industries Ltd. (ICI)…is currently borrowing 230 million Swiss
francs in Zurich for 15 years at 3.5% interest. In the U.S., ICI would probably have to pay closer to 10%

3
support in the data that firms tend to choose low yield currencies when denominating
bonds and that those differences in yields tend to subsequently disappear.
Overall, our analysis seeks to add to the large literature on interest rate parity and the
more recent literature on opportunistic debt issuance. With regard to the former, it is
most closely related to the early work by Frenkel and Levich (1975, 1977) and extensions
of this work by Deardorff (1979) and Callier (1981). With regard to the latter, it is most
closely related to McBrady and Schill (2007), who test for opportunistic currency choice
across six currencies using a sample of government and government agency borrowers.
They observe that these borrowers respond to differences in covered yield, nominal yield,
and exchange rate appreciation. Earlier studies of debt issuance in a cross-currency
context are largely anecdotal and based on studies that look at two currency comparisons
using simple nominal interest rates (Johnson, 1988; Allayannis, Brown, and Klapper,
2003; Henderson, Jegadeesh, and Weisbach, 2006). Our work also augments previous
work on opportunism across various other dimensions of firms’ debt issuance decision.3
This paper offers three main contributions. First, following McBrady and Schill (2007),
we investigate opportunistic debt issuance with a comprehensive sample of corporations
(rather than sovereign governments and agencies), thus extending earlier results to a
much broader corporate finance context. Our sample includes all foreign currency-
denominated bonds issued by firms from 27 countries in each of the major international
currencies of the 1993 to 2005 time period. Second, we investigate opportunistic
issuance with a conditional logit regression set up that increases the power and precision
of the inferences we are able to draw. Finally, we examine both the economic gains that
firms achieve through their opportunistic issuance and the extent to which they appear to
influence subsequent yields and exchange rates. In this way, we provide evidence
for the same 15-year money—650 basis points more to borrow in U.S. dollars…but to take advantage of
this enormous rate differential, the dollar must be stable against the Swiss franc‖ (Business Week, 1979). 3 Friedman (1979) and Baker, Greenwood, and Wurgler (2003), for example, examine the choice between
short-term and long-term debt. Faulkender (2005) examines the choice between fixed-rate and floating-rate
debt. Chaplinsky and Ramchand (2001) examine the choice between public debt and Rule 144A debt. Kim
and Stulz (1988) and Miller and Puthenpurackal (2002) consider opportunism across bond markets.

4
suggesting that firms, rather than more traditional long/short arbitrageurs, effectively
enforce interest rate parity at longer-term horizons.
Overall, we find strong and consistent evidence that firms, like the sovereign and agency
issuers documented in McBrady and Schill (2007), pick currencies in order to exploit
apparent deviations from interest rate parity.4 In any period of time, they are markedly
more likely to issue in the currencies that offer relatively low covered and uncovered
interest yields. There is some evidence that they also are more likely to issue bonds in
currencies that have recently appreciated relative to the other currencies in the sample,
consistent with the expectation that currencies are mean-reverting. Further analysis of
the cross-section variation among issuers bolsters our conclusions. Emerging market and
non-investment grade issuers are markedly less likely than other firms to pick currencies
based on relatively low covered interest yields. In the former case, this follows from the
absence of currency swaps for emerging market currencies. Unable to swap bond
payments into their home currency, emerging market firms have little incentive to
potentially swap their issue currency into any other. For non-investment grade firms, on
the other hand, additional market frictions explain their relative inability to exploit lower
covered interest yields. Currency swap counterparties (AA-rated international banks)
assess credit charges for swaps entered into with less credit-worthy counterparties. These
charges can be 15 to 20 basis points, effectively eliminating the potential gains available
to higher credit-quality issuers.
For the full sample of issuers and time periods, we compare the average borrowing costs
that are realized through firm decisions to denominate bonds in particular currencies with
a ―naïve‖ alternative currency denomination rule. For the full sample of issuers and time
periods, the differences appear relatively minor and insignificant. The full sample,
however, masks periods of relatively high and low issuance in each currency. During
4 This evidence is consistent with what firms say they do. Graham and Harvey (2001) find that 44 percent
of the firms in their survey cite lower borrowing costs as an important reason for issuing foreign currency
obligations. Servaes and Tufano (2006) observe that ―relative interest rates,‖ ―relative credit spreads,‖ and
―expected exchange rate movements‖ are among the most common reasons that firms cite in their study for
issuing debt in a foreign currency. Geczy, Minton, and Schrand (2007) find that 42 percent of the firms
they survey respond that they ―Frequently‖ or ―Sometimes‖ actively take positions in response to a market
view on exchange rate or interest rate movements.

5
periods of relatively high issuance, firms achieve covered interest savings of 5 to 6 basis
points. These gains, of similar magnitude to those documented in McBrady and Schill
(2007), remain after firms hedge their currency risk with swaps. They offer significant
interest cost savings, but are likely to be within the range of well-functioning markets.
We suspect that the gains are too small to be attractive to round-trip arbitrage firms after
taking into account the associated transaction costs and long-horizon holding costs,
though sufficiently attractive to one-way arbitrageurs such as corporate borrowers.
Much larger gains are observed with regard to nominal yields and subsequent exchange
rate depreciation. Firms achieve nominal interest savings of 50 to 80 basis points over
borrowing in other currencies by issuing bonds in relatively low interest currencies in
high-issuance months. Over the subsequent year, they also systematically benefit by
issuing bonds in currencies that tend to depreciate 80 to 110 basis points more than the
other currencies in the sample. While these gains are impressive in magnitude, it is
important to note that they do not come without risk. Given the volatility of exchange
rates, large gains provide necessary compensation for the retention of currency risk.
The rest of the paper is structured as follows. Section 2 describes the bond sample and
our measures of borrowing cost. Section 3 presents the empirical tests. Finally, Section 4
offers concluding remarks.
2. Data
2.1 International corporate bond offerings
We construct a sample of international corporate bond offerings from the Thomson
Financial SDC Platinum Global New Issues dataset over the period from 1993 to 2005.
We obtain all non-convertible, fixed-coupon corporate bonds placed in foreign markets or
denominated in a foreign currency. The designation of international bonds is
accomplished by selecting bonds in the SDC dataset with the variable ―Market area‖

6
equal to ―Euro‖ or ―International.‖ Bonds offered in the issuers’ local currency are
excluded from the sample. Public sector bond offerings (Primary SIC code 6111 or in the
9000s) and trusts (SIC code 619A or B) are eliminated. Bond offerings by financial
institutions (SIC Code 6000s) are also eliminated. The dataset includes 5169 offerings
with an aggregate current U.S. dollar-based total principal of $1.4 trillion.
Since we are looking for equilibrium choice behavior, we omit offerings in euros
(including ECU) and euroland currencies (German marks, French francs, etc.) as these
are transitional currencies over our sample period. Our concern is that over the transition
period many euro-denominated debt offerings are simply ―rebalancing transactions‖ of
retiring old currency debt to replace with new currency debt.5 In order to improve the
power of our empirical tests, we restrict our sample to those offerings that are
denominated in the six most common currencies, the U.S. dollar (USD), British pound
(GBP), Japanese yen (JPY), Swiss franc (CHF), Australian dollar (AUD), and Canadian
dollar (CAD). To ensure that firms maintain a legitimate choice across the sample
currencies, we eliminate offerings from those home countries in which we find bonds
denominated in less than three of the six sample currencies. The revised sample includes
2608 offerings with an aggregate current U.S. dollar-based total principal of $554 billion.
Table 1 summarizes the currency denomination distribution across country of origin of
the corporate borrower. Panel A provides the distribution of the number of offerings by
country and currency and Panel B provides the distribution of the U.S. dollar-based value
of offerings by country and currency. We observe that firms tend to make use of the
broad menu of currency choices in their denomination decision. We find that firms from
some countries do not broadly choose from the menu of currencies. Borrowers from
countries such as Brazil, Portugal, and Indonesia, for example, fail to collectively pass
our sample screens. Some countries tend to have particular concentrations. South Korea,
for example, tends to have a disproportionately large number of JPY denominated issues,
consistent with expected operating cash flow hedging considerations. On a per offering
5 The total number of bond offerings over the sample period for selected ―euroland‖ currencies not included
in the sample are 1451 for the euro, 154 for the German mark, 91 for the French franc, and 37 for the
Italian lire.

7
basis, the bond offerings were on average largest from Italy ($573 million per offering)
and smallest from Austria ($73 million per offering).
In Panel C of Table 1 we report the distribution of international debt by industry, country
type, bond rating, and size of offering. Across industry, we define utilities as those bond
offerings by firms with SIC code within the 4000s. G5 firms are defined as those from
France, Germany, Japan, United States, and United Kingdom. Emerging market firms
are defined as those from the following countries in our sample: Bermuda, Cayman
Islands, China, Hong Kong, Malaysia, Mexico, Singapore, South Africa, and South
Korea. The bond rating is that reported by SDC. We observe that utilities and firms from
G5 countries represent an important segment of our sample. The offerings tend to be
most commonly from BBB-rated firms and be issued in amounts between $100 and $500
million. However, small offerings are much more common for issues in CHF, AUD, and
CAD.
In Panel D of Table 1 we report the share of annual amount issued (converted to USD)
for each of the six sample currencies. We observe that bond offerings in CHF and CAD
were particularly popular in the early 1990s. Bond offerings in AUD were particularly
popular in the mid 1990s. Bond offerings in USD were particularly unpopular in the early
2000s while bond offerings in GBP were particularly popular. The time variation in
share can be large: JPY share goes from 3% in 1998 to 47% in 2000 to 2% in 2002.
Overall the data suggest that currency denomination demand is not static. Our objective
is to test whether the increases in preferences of particular currencies correspond to
periods when the various components of the costs of borrowing in a particular currency
appeared relatively low.
2.2 Borrowing cost measures
We obtain monthly interest rate and exchange rate data to generate a panel of prevailing
borrowing cost measures across the six sample currencies. To estimate the corporate

8
borrowing cost we use the 5-year Bloomberg Fair Market Yield indices for AA-rated
Eurobonds in each sample currency. We choose the 5-year yield because the median
bond maturity for our bond sample is 5 years. While Bloomberg Fair Market Yield
indices do not represent the specific yield at which each of our corporate borrowers could
issue a bond, they are designed to serve as pricing benchmarks and are widely consulted
by fixed-income investment bankers. To maximize their applicability as pricing
benchmarks in each respective market, the yield indices themselves are calculated daily
from term structures constructed from a large sample of the most liquid bonds in each
category (i.e. AA-rated euroyen bonds, for example). To proxy for foreign currency
movements, we follow McBrady and Schill (2007) and use one-year prior realizations of
the exchange rate from Datastream for each currency relative to the euro.
To measure covered yields, we obtain five-year interest rate swap rates for all currencies
from Datastream and USD basis swap yields from Bloomberg. In the latter half of the
1990s, fixed-for-floating currency swaps evolved away from single instruments and
toward two separate ―plain vanilla‖ swaps: a simple interest rate swap packaged together
with a foreign currency ―basis‖ swap. The interest rate swap transforms fixed-rate cash
flows in a given currency into LIBOR-based cash flows in the same currency. The
currency basis swap then exchanges foreign LIBOR-based cash flows for US dollar
LIBOR-based cash flows. To capture the dual effect, the covered spread is defined as the
AA-rated eurobond yield less the total swap yield defined as the interest rate swap yield
plus the basis swap yield for the respective currency.6 Consistent with Clinton (1988) and
6 There are some limitations on the availability of the full panel of data over the sample period. For the
AA-rated Eurobond yield data, the CHF, AUD, and CAD series start in April 2000, December 1994, and
July 1993 respectively. For the basis swap data, the JPY, GBP, CHF, AUD, and CAD series start in June
1997, January 1997, July 1998, March 1997, and February 2000. Because we need a balanced panel for
our empirical tests we impute the values for the nominal yield and the covered yield. Over the sample
period for all currencies other than the yen, basis swap rates rarely exceed +/- 15 basis points. We assume
the missing basis swap yield to be the mean rate for those sample months with available data. Because the
sample mean rate for JPY during LTCM crisis (August 1998 to August 1999) was extraordinarily low and
thus unrepresentative, we exclude the rate for this period in calculating the mean to be used for the missing
values. For the AA-rated Eurobond yield we use the sample currency mean credit premium over
government benchmark yields and then apply that premium to the missing observations based on the
prevailing benchmark yields by currency. For the benchmark yields, we use the 5-year government
benchmark yield for each currency from Datastream.
9
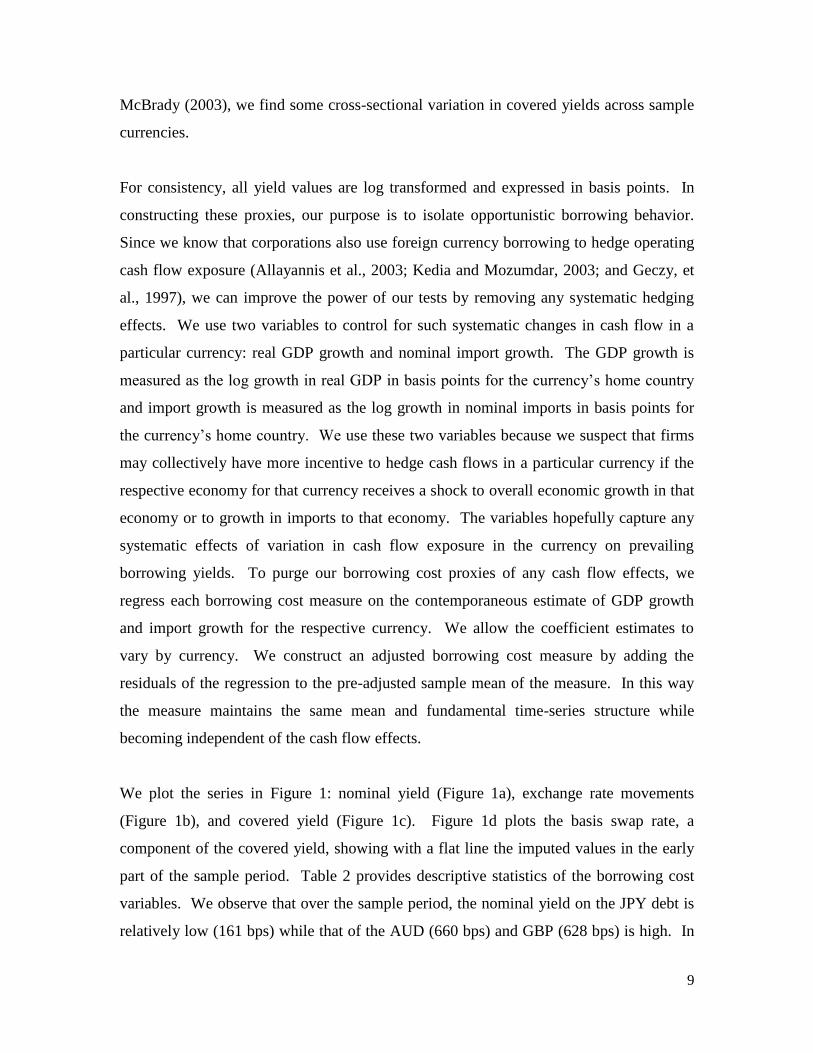
McBrady (2003), we find some cross-sectional variation in covered yields across sample
currencies.
For consistency, all yield values are log transformed and expressed in basis points. In
constructing these proxies, our purpose is to isolate opportunistic borrowing behavior.
Since we know that corporations also use foreign currency borrowing to hedge operating
cash flow exposure (Allayannis et al., 2003; Kedia and Mozumdar, 2003; and Geczy, et
al., 1997), we can improve the power of our tests by removing any systematic hedging
effects. We use two variables to control for such systematic changes in cash flow in a
particular currency: real GDP growth and nominal import growth. The GDP growth is
measured as the log growth in real GDP in basis points for the currency’s home country
and import growth is measured as the log growth in nominal imports in basis points for
the currency’s home country. We use these two variables because we suspect that firms
may collectively have more incentive to hedge cash flows in a particular currency if the
respective economy for that currency receives a shock to overall economic growth in that
economy or to growth in imports to that economy. The variables hopefully capture any
systematic effects of variation in cash flow exposure in the currency on prevailing
borrowing yields. To purge our borrowing cost proxies of any cash flow effects, we
regress each borrowing cost measure on the contemporaneous estimate of GDP growth
and import growth for the respective currency. We allow the coefficient estimates to
vary by currency. We construct an adjusted borrowing cost measure by adding the
residuals of the regression to the pre-adjusted sample mean of the measure. In this way
the measure maintains the same mean and fundamental time-series structure while
becoming independent of the cash flow effects.
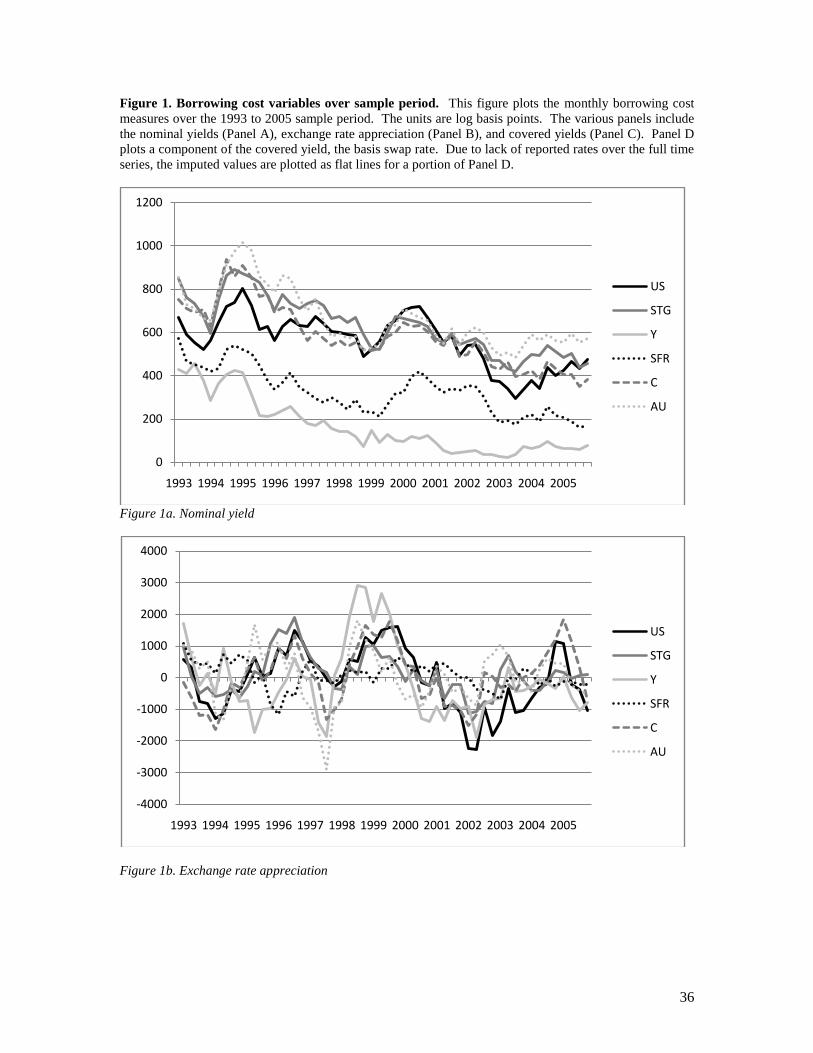
We plot the series in Figure 1: nominal yield (Figure 1a), exchange rate movements
(Figure 1b), and covered yield (Figure 1c). Figure 1d plots the basis swap rate, a
component of the covered yield, showing with a flat line the imputed values in the early
part of the sample period. Table 2 provides descriptive statistics of the borrowing cost
variables. We observe that over the sample period, the nominal yield on the JPY debt is
relatively low (161 bps) while that of the AUD (660 bps) and GBP (628 bps) is high. In

10
the year previous, we observe that the JPY appreciated the most, while the USD
appreciated the least against the euro. Across the covered yields we observe some
variation with the JPY and CHF spread over swaps at near zero while the other currencies
range from 8 to 19 basis points on average. We observe strong serial correlation in the
series and some cross-correlation, with the correlation coefficient between covered yield
and nominal yield series at 0.30.
3. Empirical tests and results
3.1 Testing a model of currency choice
We hypothesize that the probability of issuing debt denominated in one of the six sample
currencies is a function of the respective interest rate. To model the firm’s currency
denomination decision, we use a multinomial response model where the firm chooses to
denominate the bond across the six currencies based on the prevailing yields on
borrowing. To be specific, we use the McFadden (1973) conditional logit model. This
model allows us to investigate how currency choice is affected by multiple currency
attributes, such as the cost of borrowing in the different currencies. In our case, the bond
issuer faces six currency choices, each with six potentially different costs.
In subsequent tests we use a mixed specification that uses features of both the conditional
logit model and the related multinomial logit model. Both models allow for discrete
choice across multiple alternatives. However, the conditional specification models that
choice based on the characteristics of the alternatives, whereas the multinominal
specification models the choice based on the characteristics of the decision maker. In the
context of our analysis, the characteristics of the choice alternatives are the relative
prevailing borrowing costs across currencies, while the characteristics of the decision
maker are the characteristics of the firm.

11
We model currency choice as a function of nominal yields, exchange rate appreciation,
covered yields, and indicator variables which capture the bond offering preferences for
each currency. More formally, this choice is modeled as in Equation 1.
𝑃𝑟𝑜𝑏 𝑌𝑖 = 𝑗 =𝑒𝛽 ′ 𝑥𝑖 ,𝑗 ∗𝑒
𝛼′ 𝑤𝑗
𝑒𝛽 ′ 𝑥𝑖 ,𝑗 ∗𝑒
𝛼′ 𝑤𝑗𝐽𝑗=1
(1)
The probability of issue i being denominated in currency j is a function of xi,j, which is a
vector containing the currency cost attributes for issue i and choice j, and is a vector
containing the respective coefficients. It is also a function of wj, which contains a set of
indicators for the currency being equal to j and is a vector containing the respective
coefficients. To avoid multicollinearity we omit the indicator for the USD, and thus, the
dummy variable coefficients represent the probability of issuing in the given currency
with respect to the USD.7
We provide the coefficient estimates of this model in Panel A of Table 3. For each
specification we present two weighting methods. The first specification weights each
observation equally (EW). The second specification weights each observation by the
principal of the bond offering in USD (VW). McBrady and Schill (2007) aggregate
borrowing decisions by quarter and evaluate borrowing costs at the beginning of the
respective quarter. To further refine their analysis, we report borrowing costs on a
monthly basis, yet to preserve the quarterly horizon of McBrady and Schill, we include
monthly yields over the past rolling quarter as relevant independent variables.
Specifically, we measure borrowing costs as of the beginning of the month, and include
borrowing costs as of month t, t-1 and t-2. Since there is some delay between when a
firm may observe a borrowing opportunity and the realization of that opportunity, we feel
that including two monthly lags on the borrowing cost measure is appropriate,
nevertheless by including contemporaneous and two lagged borrowing cost measures we
7 In estimating our conditional logit model, we must effectively expand our dataset of firm borrowing
decisions by the number of sample currencies. The dependent variable is modeled as a binary variable for
each sample currency. Because we have six sample currencies, each observation in our sample is repeated
six times with the binary dependent variable referring to the binary decision to denominate the bond in each
of the sample currencies in turn.

12
are able to infer what lag structure firms find relevant. The coefficients on the currency
dummies, , which simply capture the same sample composition reported in Table 1 are
not reported. The null hypothesis is that if prevailing interest rates across currencies does
not influence the currency denomination of firm borrowing as implied by interest rate
parity, the coefficients on the borrowing cost measures, , should be zero.
Regressions 1 and 2 provide the estimates for the EW and VW specifications for the
uncovered yields and exchange rate appreciations. Regressions 3 and 4 provide the
estimates for the EW and VW specifications for the covered yields. Regressions 5 and 6
contain regression specifications with all borrowing cost variables together. We observe
a striking pattern in the coefficient estimates. For nearly all the borrowing cost proxies,
the coefficients on the contemporary and once lagged yields are not significantly different
from zero. However for the twice lagged yields, the coefficients are negative and
significant suggesting that the probability of a firm choosing a particular currency
increases as the value of the borrowing cost measure at a two-month lag decreases. Such
findings are inconsistent with firm belief in interest rate parity and evidence of
opportunistic behavior on the part of firms where there is a two-month delay in executing
the borrowing opportunity. The 1-year exchange rate appreciation coefficients are mostly
insignificant, possibly because of the strong correlation across the three exchange rate
variables that exists due to overlapping periods across these variables. Specifically, the
exchange rate appreciation at time period t overlaps with that measured at time period t-1
for 11 of the 12 months.
To simplify the regressions, we omit the concurrent and one month lag variables in
specifications 7 and 8. When we include only the twice lagged exchange rate
appreciation measure on the right-hand side of the regression, we find that the coefficient
on this measure to be now positive and significant. This sign suggests that firms choose
to issue debt in those currencies that have recently appreciated, which would be
consistent with the belief by firm managers that exchange rates are mean reverting. The
two-month lagged nominal yields, exchange rate appreciation, and covered yields appear
to be relevant for firms in choosing their debt denomination. The regression results reject

13
the null hypothesis that bond issuers are indifferent to prevailing covered and uncovered
yields when denominating international bonds. The results provide strong evidence that
the support for opportunistic issuers identified by McBrady and Schill (2007) for a
narrow subsample of firms is also found across the broader population of corporate firms.
Results also report a novel finding that firms react to borrowing cost measures with a two
month lag.
The conditional logit regressions, unlike OLS regressions, are non-linear, and thus the
coefficients do not have economic interpretation. For that reason we report in Panel B of
Table 3 marginal effects for regression 7. Specifically, we compute the change in the
probability of issuing a specific currency resulting from a 100 basis point increase in the
cost of issuing that specific currency (see Green (1997, p. 918) for details of these
calculations). We also compute the model’s estimated probabilities of issuing a
particular currency and compare them to the actual probabilities from Panel A of Table 1,
bottom row. It is encouraging to find that the estimated probabilities are very close to the
actual currency shares.
We find that a 100 basis point increase in the USD nominal yield from its mean (while
keeping all other variables at their means), reduces the probability of denominating debt
in USD by 7 percentage points, (i.e., it reduces its probability from approximately 50% to
43%). By the same token, a 100 basis point increase in the USD covered yield, reduces
the probability of denominating debt in USD by 14 percentage points. Thus, our results
are not only statistically significant, they are also economically significant. The
remaining marginal effects are substantially smaller, but the probabilities of
denominating debt in these other currencies are also substantially smaller resulting
sometimes in larger proportional effects. For example, for the CAD, the least popular
currency in our sample, a 100 basis point increase in its nominal yield reduces the
probability of denominating debt in the CAD by half a percentage point from 2% to 1.5%
(a proportionally large decline in probability of 25% (0.5% / 2%)). Overall, the effect of
cross-sectional variation in borrowing yield appear to influence both statistically and
economically the likelihood of currency denomination of international bonds.

14
We recognize the importance of eliminating the possibility that the regressions are simply
picking up the effects of cash flow hedging by firms exposed to exchange rate risk. We
attempt to control for such systematic effects by purging the borrowing cost series for
time-series variation in relative trade and economic growth. It is possible that our
procedure for purging the borrowing cost series for systematic foreign exchange cash
flow hedging effects does not completely remove such effects. Ideally we would like to
be able to control for the cash flow positions by each firm in each of the 6 sample
currencies. Such data is not available for our sample firms. Some firms report geographic
segment revenue at an aggregated level, but that is insufficient for our purposes.
Faulkender (2005) models firm interest rate sensitivity by regressing 6-month LIBOR on
quarterly cash flows (scaled by assets) and uses the regression coefficients to quantify the
firm’s interest rate exposure. We expect that an exchange rate version of this variable
would be an attractive control variable for firm exchange rate sensitivity, as firms with
sensitivity to a particular exchange rate may be more likely to hedge the sensitivity by
issuing debt in that currency. We follow this procedure by estimating exchange rate
sensitivity to quarterly revenue and operating profit data. We select these line items
because they are above the line items in the income statement that are affected by
exchange rate hedging. If we looked at the exchange rate sensitivity of firm net income
or stock returns we would be unable to distinguish between those firms that have low
sensitivity and those firms that have hedged away their exchange rate exposure (Jorion,
1990).
To estimate the exchange rate sensitivity, we regress the quarterly revenue and operating
profit (Data items 2 and 21 in the quarterly Compustat file) scaled by total assets on the
quarterly exchange rate appreciation relative to the euro for each sample currency in a
rolling fashion over the past five years. Unfortunately, nearly 90% of the firms in our
dataset do not report financial statements on a quarterly basis. We expect that estimates
based on annual performance would be too imprecise to be of much statistical value.
Despite the sample limitation, we proceed with our analysis using the roughly 10 percent

15
of the firms in the dataset that do report quarterly results based on an equity listing in the
United States. This subset of firms is comprised of firms from Canada (38%), United
States (37%), United Kingdom (7%), Norway (6%), Mexico (4%), and other countries
(8%). The sensitivity coefficients are Winsorized at the 10th and 90th percentiles
following Faulkender. These coefficients measure whether the firm sales or operating
profits are historically sensitive to the exchange rate of any of the respective sample
currencies.
We begin our test by re-estimating Regression 7 from Table 3 (not tabulated) with the
smaller sample. We observe that the coefficient on the nominal yield is statistically
significant (t-stat = -3.94), but the coefficients on the exchange rate appreciation and
covered yield are no longer significant. With this regression as the baseline, we
subsequently add the exchange rate sensitivity measures. Both the cash flow sensitivity
measures generate positive and significant coefficients, suggesting that firms with a long
position in the sample currency (positive sensitivity) are statistically more likely to issue
debt in that currency (consistent with a hedging motive). Despite the significance of
these sensitivity coefficients, the addition of these variables maintains virtually no effect
on the borrowing cost coefficients. Based on the two approaches we use to control for
exchange rate hedging motives, we conclude that the correlation between currency
denomination and borrowing costs is not explained by hedging cash flow sensitivity.
3.2. The effect of firm characteristics
Although we observe opportunistic borrowing behavior for our overall corporate sample,
we question whether all international borrowers tend to be similarly motivated by both
covered and uncovered yield borrowing gains. In particular, we suspect that borrowers
from emerging market economies and those with low bond ratings may display different
preferences. For most emerging market countries, a swap contract market did not exist in
the domestic currency over this sample period. Without the ability to swap back into the
domestic currency, we suspect that firms from emerging market economies are likely to

16
be less sensitive to covered yield variations. For firms with non-investment-grade bond
ratings we suspect that they are also likely to be less sensitive to covered yields since
swap contracts with such firms will be executed at substantially greater costs. Such
credit costs may very well be great enough to eliminate the gains from reductions in
covered yields.
To accomplish this cross-sectional test, we include an indicator for the issue originating
from a firm headquartered in an emerging market (Home=EM), and an indicator for the
issue having non-investment grade rating (Rating<BBB). We interact these
characteristics with choice attributes (the borrowing cost measures) and with each of the
currency dummies. By allowing the interaction of both characteristics with the currency
dummies we are allowing the model to maintain different probabilities for each
subsample to issue in any particular currency. As mentioned we also allow the effects of
currency cost on choice to vary with these two characteristics. In conditional logit
models, characteristics are never added by themselves, as they would in more common
models. This is because the characteristics are not a function of currency j and the term
would drop out. Equation 2 contains the mathematical expression of the model for this
specification.
𝑃𝑟𝑜𝑏 𝑌𝑖 = 𝑗 =𝑒𝛽 ′ (𝑥𝑖 ,𝑗+𝑒𝑚 𝑖∗𝑥𝑖 ,𝑗+𝑏3𝑖∗𝑥𝑖 ,𝑗 )∗𝑒
𝛼′ (𝑤𝑗+𝑒𝑚 𝑖∗𝑤𝑗+𝑏3𝑖∗𝑤 𝑗 )
𝑒𝛽 ′ (𝑥𝑖 ,𝑗+𝑒𝑚 𝑖∗𝑥𝑖 ,𝑗+𝑏3𝑖∗𝑥𝑖 ,𝑗 )∗𝑒
𝛼′ (𝑤𝑗+𝑒𝑚 𝑖∗𝑤𝑗+𝑏3𝑖∗𝑤 𝑗 )𝐽𝑗=1
(2)
We report the regression results in Table 4. For presentation purposes none of the
currency dummies and respective interaction coefficients are reported in Table 4, as the
coefficients on these variables effectively represent the sample distribution characteristics
captured in Table 1 Panel C (the likelihood that a bond is denominated in any particular
currency by subsample).
The coefficients on the borrowing cost measures continue to be significantly negative and
those on the exchange rate appreciation continue to be significantly positive. For the
emerging market firms, the coefficient on the covered yield interaction term is positive

17
and significant (specifications 1 and 2). This finding is consistent with the prediction that
emerging market firms are less likely to respond to variations in covered yields. By
contrast, the coefficient on the nominal yield interaction term is indistinguishable from
zero, suggesting that emerging market firms are just as motivated as other firms to benefit
from uncovered yield gains. Regarding exchange rate appreciation, only the interaction
term on the value-weighted specification is significant, suggesting again that emerging
market firms are motivated by uncovered yield gains despite their relative indifference to
covered yield gains.
For the non-investment grade debt firms, the findings are similar to those of the emerging
market firms: response rates are significantly less important for covered yields as
evidenced by the positive coefficient on the interaction between covered yields and an
indicator for the firm being non-investment grade (specifications 3 and 4). Since the
baseline coefficient is negative one might question whether low-rated firms are active in
responding to covered yields. The coefficient on the interaction between nominal yields
and a non-investment grade indicator is indistinguishable from zero, and that between
exchange rate appreciation and the non-investment grade indicator is significant for only
the equally weighted specification, suggesting that non-investment grade borrowers are
just as likely to pursue nominal yield savings as other borrowers. This is consistent with
the notion that low-rated debt firms are relatively more likely to respond to variations in
nominal yields which one might expect if the covered yield market is less open. These
results continue to hold when we include all independent variables simultaneously
(specifications 5 and 6). The results provide support for the prediction that emerging
market firms and firms with low debt ratings are less likely to respond to covered yield
variations, though just as likely to respond to nominal yield variations.
3.3 Economic gains to foreign currency borrowing
To better appreciate the economic gains associated with opportunistic issuance decisions
we begin by computing the mean realized borrowing cost estimates for the sample
18
weighted equally across bond offerings (EW) and weighted by the value of the principal
in each offering (VW). The realized nominal yield estimates (not tabulated) are 470 bps
and 489 bps for the equal-weighted and value-weighted values, respectively. The realized
covered yield estimates are 12 bps and 15 bps for the equal-weighted and value-weighted
values, respectively. For the exchange rate series we adjust the variable from being
defined as the past one-year appreciation rate to the forward one-year appreciation rate.
The realized exchange rate appreciation estimates are -27 bps and -92 bps for the equal-
weighted and value-weighted values, respectively.
To compute the mean gain across bond offerings, we must compare the reported realized
costs to those of some naive benchmark. We follow the approach of McBrady and Schill
(2007). As a reference for the equal-weighted figure we construct a benchmark that
assumes that firms naively denominate their debt proportionally to the total number of
issues in each of the six currencies (bottom row of Table 1, Panel A), namely 50% USD,
10% GBP, 15% JPY, 21% CHF, 3% AUD, and 2% CAD. Such naive weights generate
mean equal-weighted borrowing cost estimates of 461 bps for the nominal yield, -25 bps
for the exchange rate appreciation, and 12 bps for the covered yield when applied over
the sample period.
We follow the same procedure using the principal value weights (bottom row of Table 1,
Panel B) to generate a benchmark for value-weighted borrowing costs. Subtracting the
realized values from the respective naive values provides an estimate of the mean gain
over the naive cost attributed to the firm’s choice of variation in the currency mix over
the sample period. If firms choose to opportunistically issue in particular currencies over
the sample period when the currencies are relatively less costly, the difference between
the naïve value and the realized value will be positive.
As we can sense from these values the unconditional mean of borrowing cost savings is
not great. However, from our earlier analyses we know that not all firms take equal
advantage of variations in interest rates, for example, firms based in emerging markets
and non-investment grade issues are less likely to pursue covered interest rate savings,

19
and thus an unconditional mean would not provide very relevant statistics. Further, we
posit that issues effected during periods of excess issuance activity are more likely to be
motivated by interest rate savings. To tease out the effects across the various sub-
samples we run issue level regressions using the difference between the naive and the
imputed borrowing costs as the dependent variables in three sets of regressions. The
dependent variables represent the savings achieved through opportunistic issuance. The
first set of regressions explains variations in nominal yield savings, the second variations
in exchange rate appreciation savings and the final set variations in covered yield savings.
We include as independent variables an intercept and three dummy variables. The
dummy variables are the emerging market indicator variable and the non-investment
grade rating indicator from the previous section. We also construct an indicator variable
equal to one when the share of all issuance volume (measured monthly in USD) in a
given currency is particularly strong. We do this to be able to distinguish those periods
when the borrowing gains are particularly attractive from those of normal borrowing
costs. By looking at the levels of borrowing costs during periods of abnormal borrowing
in a given currency we hope to be able to better gauge the representative gains associated
with abnormal borrowing opportunities. Our approach follows a similar analysis by
McBrady and Schill (2007). We identify the 15 months with the largest share of issuance
in a particular currency over the sample period for each of the six sample currencies as
heavy issuance months. To be specific, the heavy issue months are identified for each
currency based on the share of total amount issued that is denominated in the particular
currency for that month.
For each set of regressions we run equal- and value-weighted regressions. In equal-
weighted regressions, each issue is given equal weight, and thus we use as the naïve
benchmark the equal-weighted cost computed as described above. The coefficients for
these regressions represent the equal-weighted mean differential for each of the sub-
samples. In value-weighted regressions each issue is weighted by the principal amount
issued in USD, and for these regressions we use as the naïve benchmark the value-
weighted cost. The coefficients for these regressions represent the value-weighted mean

20
differential for each of the sub-samples. The intercept terms capture the global mean
difference in borrowing cost savings, equally or value weighted depending on the
specification, when the indicator variables are zero. A positive intercept suggests
positive gains over the naïve currency denomination rule in non-heavy volume months,
issues by investment grade firms and from non-emerging market countries.
We report these regression results in Table 5. We find that the average borrowing cost
gains, captured by the intercept term, are near zero for most of the nominal yield and
covered yield specifications. The intercept for the equal-weighted covered yield
specification generates a significantly negative difference of 1.4 basis points. The
average gains for the exchange rate movements are 29 and 28 basis points for the equal-
weighted and value-weighted specifications, respectively. This result is consistent with
McBrady and Schill (2007) who also find that currency denomination systematically
anticipates one-year ahead exchange rate movements.
Of potentially more interest are the coefficients on the heavy issue volume indicator
variable. We find the coefficient on this variable to be large and significant in all six
specifications. The equal-weighted and value-weighted coefficients are respectively 53
and 81 basis points for the nominal yield gains, 79 and 110 for the exchange rate gains,
and 5 and 6 basis points for the covered yield gains. The test results clearly suggest that
the periods of heavy issuance in a particular currency are associated with periods of
borrowing cost gains. We suspect that such gains might not be large enough to motivate
a round-trip arbitrageur to take and hold a two-way position for five years, but are large
enough to motivate a firm that already needs the debt capital to prefer currencies that
provide slight savings.
Lastly, the coefficients on the emerging market dummy and the non-investment grade
rating dummy suggest that the gains are not symmetric across firms. Emerging market
firms tend to achieve substantially less covered yield gains. The coefficient on emerging
market dummy with covered yields is a significant -4 basis points for both specifications.
Non-investment grade rated firms tend to obtain less opportunistic gains across all

21
measures. The coefficient on the non-investment grade rating indicator variable is
strongly negative for all measures and all specifications. In general the values suggest
that poorly rated firms realize borrowing costs that are inferior to the naïve benchmark.
3.4 Borrowing Cost Gains in Event Time
Lastly, we investigate the time-series variation of the borrowing cost gains measures in
event time. We plot the mean abnormal borrowing cost gains in event time where Month
0 is the month of the bond offering. We measure the cost savings across each sample
currency from 12 monthly lags through 12 monthly leads relative to the month of the
offer. We plot for each event month the value-weighted mean, weighted by the principal
of the bond offering. For the exchange rate we alter the series somewhat so as to capture
the abnormal appreciation of the currency prior to Month 0 and the abnormal depreciation
of the currency subsequent to Month 0. Specifically this amount is measured as the
exchange rate for Month 0 less the exchange rate at each of the event window months. If
the yen to euro exchange rate moved from 100 at Month -12 to 80 at Month 0 to 100 at
Month +12, the yen has appreciated prior to the offering and depreciated subsequent to
the offering. Such currency movements reduce the euro-based borrowing cost to the
issuing firm by its choice to issue at Month 0. Based on this example, the revised
exchange rate series for the yen would be -20% at Month -12, 0% at Month 0 and -20% at
Month +12. The humped-shaped pattern of the plot correctly indicates that the bond was
issued at the peak of the exchange rate movement.
In the plots, all of the three borrowing series are standardized by subtracting the sample
currency mean and dividing by the standard deviation such that the currencies are treated
equally. The plot is provided in Figure 2. The various panels are the nominal yields
(Panel A), exchange rate appreciation (Panel B), and covered yields (Panel C). Plots for
both the full sample and only those issued during heavy currency volume months are
provided.

22
For all three series, we observe that the borrowing gains tend to peak some months prior
to the offering to about the time of offering. For the nominal yield, the peak for both the
full sample and the heavy volume period offerings occurs several months prior to Month
0. This is also the case for the exchange rate effect for both samples of bond offerings.
We also observe that there is a striking decline in the borrowing gains following Month 0.
This decline is particularly sharp for those bonds offered during the heavy volume
months. The findings are similar to those of McBrady and Schill (2007) for government
and agency bond issuance and Pasquariello, Yuan, and Zhu (2006) for ADRs and
exchange rates.
The time-series evidence is consistent with the notion that firm currency-denomination
decisions represent one-way arbitrage opportunities for these firms. Since the firm must
borrow anyway, choosing a particular currency provides a way to lower the cost of
capital on an ―as needed‖ basis while not incurring the round-trip costs associated with
classic interest-rate arbitrage. It may be that corporations are, in fact, the marginal
market participant that moves yields toward parity.
4. Conclusion
We examine managers’ underlying beliefs about opportunities for borrowing gains from
uncovered and covered interest rate parity deviations. For firms issuing international
bonds, we propose that managers choose across a menu of potential currencies to identify
borrowing bargains based on differences in uncovered or covered interest yields. We
examine the correlation between aggregate bond denomination choice and estimates of
uncovered and covered borrowing costs across a broad set of currencies from 1993 to
2005 to explore firm behavior.
Overall, we find strong evidence that managers respond to measures of covered and
uncovered borrowing costs. Their aggregate issuance decisions are consistent with the
belief that covered and uncovered interest parity does not hold at some horizons. Our

23
results for covered yields are less strong for firms from emerging markets and firms with
non-investment grade bond ratings consistent with their more limited access to currency
swap markets. Overall, the gains that firms achieve are economically significant but
consistent with well-functioning markets. We find that bond yields and exchange rates
systematically move toward parity following periods of relatively high issuance. This
suggests international bond issuers may be effectively the marginal traders who enforce
interest rate parity at long horizons.

24
References
Allayannis, George, Gregory W. Brown, and Leora F. Klapper, 2003, Capital structure
and financial risk: Evidence from foreign debt use in East Asia, The Journal of Finance,
58, 6, 2667-2709.
Baker, Malcolm, Robin Greenwood, and Jeffrey Wurgler, 2003, The maturity of debt
issues and predictable variation in bond returns, Journal of Financial Economics, 70, 2,
261-291.
Business Week, 1979, The lure of Swiss franc debt, Business Week, February 12, 95.
Callier, Philippe, 1981, One Way Arbitrage, Foreign Exchange and Securities Markets: A
Note, The Journal of Finance 36, 1177-1186.
Chaplinsky, Susan, and Latha Ramchand, 2001, The impact of SEC Rule 144A on
corporate debt issuance by foreign firms, Working paper, University of Virginia.
Chinn, Menzie D., and Guy Meredith, 2004, Monetary policy and long-horizon
uncovered interest parity, IMF Staff Papers 51 (3), 409-430.
Clinton, Kevin, 1988, Transaction costs and covered interest arbitrage: theory and
evidence, Journal of Political Economy 96, 358-370.
Deardorff, Alan V., 1979, One-Way Arbitrage and Its Implications for the Foreign
Exchange Markets, Journal of Political Economy 87, 351—364.
Faulkender, Michael, 2005, Hedging or market timing? Selecting the interest rate
exposure of corporate debt, The Journal of Finance, 60, 931-962.
Fletcher, Donna, and Larry Taylor, 1996, Swap Covered Interest Parity in Long-Date
Capital Markets, Review of Economics and Statistics 78, 530-538.
Frenkel, J. A., and R. Levich, 1975, Covered interest arbitrage: unexploited profits?,
Journal of Political Economy 83, 325-338.
Frenkel, J. A., and R. Levich, 1977, Transaction costs and interest arbitrage: tranquil
versus turbulent periods, Journal of Political Economy 85, 1209-1226.
Friedman, B. M., 1979, Substitution and expectation effects of long-term borrowing
behavior and long-term interest rates, Journal of Money, Credit, and Banking 11, 131-
150.
Froot, K.A., and R. Thaler, 1990, Anomalies: Foreign Exchange, Journal of Economic
Perspectives, 4, 179-192.

25
Geczy, Christopher, Bernadette A. Minton, and Catherine Schrand, 1997, Why firms use
currency derivatives, The Journal of Finance, 52, 4, 1323-1354.
Geczy, Christopher, Bernadette A. Minton, and Catherine Schrand, 2007, Taking a view:
corporate speculation, governance, and compensation, The Journal of Finance, 62, 2405-
2443.
Graham, J., and C. Harvey, 2001, The theory and practice of corporate finance: Evidence
from the field, Journal of Financial Economics, 60, 187-243.
Green, William H., 1997, Econometric Analysis. 3rd ed. New Jersey: Prentice Hall.
Henderson, Brian J., Narasimhan Jegadeesh, and Michael S. Weisbach, 2006, World
markets for raising capital, Journal of Financial Economics 82, 63-102.
Johnson, David, 1988, The currency denomination of long-term debt in the Canadian
corporate sector: an empirical analysis, Journal of International Money and Finance, 7,
77-90.
Jorion, P, 1990, The exchange-rate exposure of the U.S. multinationals, The Journal of
Business 63, no. 3 (July): 331–45.
Kedia, Simi, and Abon Mozumdar, 2003, Foreign currency denominated debt: An
empirical examination, The Journal of Business, 76, 521-546.
Kim, Y. C., and Rene M. Stulz, 1988, The Eurobond market and corporate financial
policy: a test of the clientele hypothesis, Journal of Financial Economics 22, 189-205.
McBrady, Matthew, 2003, How integrated are global bond markets? Evidence from
currency swaps, unpublished manuscript, University of Virginia.
McBrady, Matthew, and Michael J. Schill, 2007, Foreign currency denominated
borrowing in the absence of operating incentives, Journal of Financial Economics 86,
125-177.
McFadden, Daniel, 1973, Conditional logit analysis of quantitative choice behavior, in P.
Zaremka, ed., Frontiers in Econometrics. New York: Academic Press.
Miller, Darius P. and John J. Puthenpurackal, 2002, The costs, wealth effects, and
determinants of international capital raising: evidence for public Yankee bonds, Journal
of Financial Intermediation 11. 455-485.
Pasquariello, Paolo, Kathy Yuan, and Qiaoqiao Zhu, 2006, Is there timing abiliy in
currency markets? Evidence from ADR issuances, Working paper, University of
Michigan.

26
Servaes, Henri, and Peter Tufano, 2006, The theory and practice of corporate debt
structure, Working paper, DeutscheBank.

27
Table 1
Summary of international corporate bond offering sample
The table shows the distribution of home country, currency, and borrower characteristics for the 1993 to
2005 sample of international corporate bond offerings. The table reports the total number of bond offerings
(Panel A), the total principal amount offered in billions of current U.S. dollars (Panels B), the distribution
of borrower characteristics (Panel C), and the year of offering (Panel D). The country of origin denotes the
ultimate domicile nation of the issuer as defined by SDC.
Panel A. Total number of bond offerings by country of origin
Sample currency
Country of origin USD GBP JPY CHF AUD CAD TOTAL
Australia 40 1 7 3 0 0 51
Austria 1 0 4 25 0 0 30
Belgium 6 4 7 2 0 0 19
Bermuda 28 3 1 0 0 0 32
Canada 267 6 9 2 0 0 284
Cayman Islands 5 0 4 3 0 0 12
China 6 0 1 1 0 0 8
Denmark 7 0 14 5 1 0 27
Finland 4 1 3 0 0 0 8
France 84 73 61 78 10 13 319
Germany 82 36 53 42 11 3 227
Hong Kong 22 0 5 1 1 0 29
Italy 12 7 7 0 0 0 26
Japan 193 14 0 305 0 3 515
Malaysia 18 2 11 1 0 0 32
Mexico 113 3 1 2 0 1 120
Netherlands 53 6 4 10 2 0 75
New Zealand 18 4 7 2 0 0 31
Norway 32 5 6 18 0 0 61
Singapore 17 0 3 0 1 0 21
South Africa 3 2 3 1 0 0 9
South Korea 52 2 37 3 0 0 94
Spain 15 1 7 3 0 0 26
Sweden 14 3 8 8 2 1 36
Switzerland 47 6 2 0 6 1 62
United Kingdom 163 0 53 8 11 1 236
United States 0 71 64 31 24 28 218
Total 1,302 250 382 554 69 51 2,608
Mkt. share 49.9% 9.6% 14.6% 21.2% 2.6% 2.0%

28
Table 1 (Continued)
Summary of international corporate bond offering sample
Panel B. Total principal amount by country of origin.
Sample currency
Country of origin USD GBP JPY CHF AUD CAD TOTAL
Australia 10,225 316 491 579 0 0 11,611
Austria 200 0 347 1,671 0 0 2,218
Belgium 853 1,064 642 84 0 0 2,643
Bermuda 13,187 756 90 0 0 0 14,033
Canada 73,439 1,396 805 273 0 0 75,912
Cayman Islands 581 0 246 207 0 0 1,034
China 1,725 0 145 112 0 0 1,982
Denmark 957 0 923 417 69 0 2,365
Finland 1,112 359 174 0 0 0 1,645
France 18,979 18,369 8,314 12,571 709 1,323 60,265
Germany 15,954 12,777 9,706 5,092 668 221 44,418
Hong Kong 7,099 0 760 45 220 0 8,124
Italy 9,730 4,278 914 0 0 0 14,921
Japan 39,847 4,582 0 18,338 0 683 63,450
Malaysia 8,658 967 1,777 9 0 0 11,410
Mexico 31,479 766 205 230 0 77 32,757
Netherlands 17,733 2,307 2,044 1,862 125 0 24,071
New Zealand 3,202 908 334 171 0 0 4,616
Norway 8,012 1,110 198 2,040 0 0 11,360
Singapore 6,268 0 19 0 82 0 6,369
South Africa 1,020 379 535 18 0 0 1,952
South Korea 11,410 326 5,750 171 0 0 17,656
Spain 4,230 600 1,116 309 0 0 6,255
Sweden 3,397 778 1,500 584 145 68 6,472
Switzerland 13,250 1,167 1,421 0 539 226 16,602
United Kingdom 53,684 0 7,254 1,277 1,266 62 63,542
United States 0 19,770 16,208 3,947 3,634 2,839 46,398
Total 356,231 72,974 61,915 50,006 7,456 5,499 554,081
Mkt. share 64.3% 13.2% 11.2% 9.0% 1.3% 1.0%

29
Table 1 (Continued)
Summary of international corporate bond offering sample
Panel C. Total principal amount by sub sample
Sample currency
USD GBP JPY CHF AUD CAD TOTAL
Industry
Utilities 125,785 38,239 23,230 18,491 1,500 1,629 208,873
Other industries
230,446 34,734 38,685 31,515 5,957 3,870 345,207
Country type
G5 128,464 55,497 41,481 41,225 6,277 5,129 278,073
Other developed 160,108 15,039 11,244 8,197 878 294 195,759
Emerging markets 67,659 2,437 9,190 585 301 77 80,249
Bond rating
AAA 33,601 11,322 3,513 10,202 3,339 3,839 65,815
AA 42,403 16,149 17,041 16,514 1,561 1,003 94,670
A 64,320 22,180 27,542 6,324 2,315 199 122,879
BBB 110,318 16,035 4,706 333 71 77 131,540
Non investment grade 73,147 3,120 534 178 0 0 76,979
Non rated 32,444 4,168 8,580 16,456 169 381 62,198
Size of offering
$0 to $100m 9,437 2,249 11,735 15,616 2,941 2,541 44,519
$100 to $250m 81,212 18,028 16,579 27,281 2,807 2,225 148,133
$250 to $500m 120,955 29,791 18,221 6,504 1,708 733 177,912
$500 to $1000m 100,641 16,076 10,272 606 0 0 127,594
>$1000m
43,986 6,829 5,108 0 0 0 55,924

30
Table 1 (Continued)
Summary of international corporate bond offering sample
Panel D. Total share of principal amount by year
Sample currency
USD GBP JPY CHF AUD CAD
1993 0.685 0.041 0.032 0.206 0.003 0.034
1994 0.609 0.028 0.132 0.176 0.006 0.049
1995 0.681 0.034 0.090 0.172 0.006 0.017
1996 0.605 0.022 0.200 0.149 0.016 0.007
1997 0.721 0.080 0.104 0.086 0.007 0.002
1998 0.832 0.083 0.028 0.052 0.002 0.002
1999 0.715 0.110 0.072 0.070 0.031 0.003
2000 0.342 0.134 0.467 0.046 0.010 0.001
2001 0.527 0.266 0.135 0.064 0.008 0.000
2002 0.576 0.342 0.024 0.045 0.011 0.001
2003 0.717 0.170 0.047 0.042 0.020 0.004
2004 0.710 0.191 0.041 0.032 0.012 0.014
2005
0.715 0.126 0.020 0.093 0.041 0.005

31
Table 2
Summary statistics of borrowing cost measures
The table reports the means and correlation coefficients across the panel of currencies and the borrowing
cost variables. All values are in log basis points. The sample period is from 1993 to 2005. The nominal
yield is the log-basis point 5-year AA-rated average yield from Bloomberg for the respective currency. The
exchange rate appreciation is the one-year past appreciation rate in the exchange rate spot rates (quoted as
currency i/euro) in log basis points. The covered yield is the log-basis point difference in the 5-year AA-
rated average yield from Bloomberg and the 5-year swap yield from Datastream plus the average basis
swap yield from Bloomberg for the respective currency. All borrowing cost measures are measured at the
beginning of the month.
Nominal yield Exchange rate
appreciation
Covered yield
Currency months
156
156
156
Sample time-series means by currency
USD 560.22 25.27 18.67
GBP 627.64 57.18 16.27
JPY 161.12 130.99 2.61
CHF 322.14 119.94 1.57
AUD 660.14 56.40 8.19
CAD 582.32 25.94 8.37
Sample autocorrelation coefficient
1st order 0.989 0.911 0.736
2nd
order 0.977 0.817 0.664
Sample cross-correlation coefficients
Nominal yield 1.0000 0.0874 0.3011
Exchange rate appreciation 1.0000 -0.0611
Covered yield
1.0000

32
Table 3
Conditional logit regressions
Conditional logit regressions of currency choice on currency attributes (nominal yields, exchange-rate appreciation, and covered yields) and currency dummies,
where USD is the omitted dummy. Panel A tabulates regression coefficients, and Panel B tabulates elasticities. The sample period is from 1993 to 2005. The
currency attributes are defined in Table 2. Time period t is defined as the beginning of the offer month. The observations in the regressions are either equal
weighted (EW) or value weighted (VW) where value is defined as the total principal in USD of the bond. The coefficients on the currency dummies are not
reported, and statistical inference is based on robust standard errors. Elasticities are based on coefficients from regression (7) and represent the change in the
probability of issuing in a certain currency if its cost increases by 100 basis points. The number of observations is 2608. The symbols *, **, and *** indicate
significance at the 10 percent, 5 percent, and 1 percent levels, respectively.
Panel A
(1)
EW
(2)
VW
(3)
EW
(4)
VW
(5)
EW
(6)
VW
(7)
EW
(8)
VW
Nominal yield (t) -0.0009 -0.0023 -0.0010 -0.0021
Nominal yield (t-1) 0.0007 0.0021 0.0003 0.0017
Nominal yield (t-2) -0.0026**
-0.0047***
-0.0022**
-0.0045***
-0.0028***
-0.0047***
Ex-rate app. (t) 0.0000 0.0001 0.0000 0.0001
Ex-rate app. (t-1) -0.0001 0.0000 -0.0000 0.0000
Ex-rate app. (t-2) 0.0002* 0.0002 0.0001 0.0001 0.0001
*** 0.0002
***
Cov. Yield (t) 0.0005 -0.0041 0.0001 -0.0040
Cov. Yield (t-1) 0.0040 0.0056 0.0031 0.0040
Cov. Yield (t-2) -0.0084***
-0.0085* -0.0080
*** -0.0071 -0.0057
***
-0.0063***
Pseudo-Rsqr 0.2478 0.3879 0.2433 0.3756 0.2489 0.3889 0.2487 0.3881

33
Table 3 (Continued)
Conditional logit regressions
Panel B
USD BPD JPY CHE AUD CAD
Nominal yield (t-2) -7.00 -2.50 -3.53 -4.68 -0.74 -0.51
Ex-rate app. (t-2) 0.24 0.09 0.12 0.16 0.03 0.02
Cov. yield (t-2) -14.31 -5.12 -7.22 -9.55 -1.51 -1.05
Est. Prob. 49.51 9.92 14.80 21.17 2.71 1.86
Actual Prob. 49.90 9.60 14.60 21.20 2.60 2.00

Table 4
Conditional logit regression with issuer characteristic interactions
Conditional logit regressions of currency choice on currency attributes (nominal yields, exchange-rate appreciation, and covered yields, all measured at the
beginning of the month two months prior to the offering month) currency dummies (where USD is the omitted dummy), and a number of interactions. The
sample period is from 1993 to 2005. The currency attributes are defined in Table 2. The observations in the regressions are either equal weighted (EW) or value
weighted (VW) where value is defined as the total principal in USD of the bond. D(Rating<BBB) is an indicator variable for the bond rating being below BBB.
D(Home=EM) is an indicator variable for the bond issuer originating from an emerging market. The coefficients on the currency dummies and currency
dummies interacted with D(Rating<BBB) and D(Home=EM) are not reported. Statistical inference is based on robust standard errors. The number of
observations is 2608. The symbols *, **, and *** indicate significance at the 10 percent, 5 percent, and 1 percent levels, respectively.
(1)
EW
(2)
VW
(3)
EW
(4)
VW
(5)
EW
(6)
VW
Nominal yield (t-2) -0.0031***
-0.0049***
-0.0031***
-0.0050***
-0.0030***
-0.0050***
Ex-rate app. (t-2) 0.0001***
0.0003***
0.0001***
0.0003***
0.0001***
0.0003***
Cov. yield (t-2)
-0.0061***
-0.0076***
-0.0079***
-0.0088***
-0.0083***
-0.0095***
Nom. yield x D(Home=EM) 0.0007 0.0025 0.0008 0.0025
Ex-rate app. x D(Home=EM) -0.0002 -0.0004**
-0.0002 -0.0004**
Cov. yield x D(Home=EM)
0.0317***
0.0245***
0.0311***
0.0244***
Nom. yield x D(Rating<BBB) -0.0023 -0.0015 -0.0026 -0.0018
Ex-rate app. x D(Rating<BBB) -0.0005***
-0.0004 -0.0005***
-0.0003
Cov. yield x D(Rating<BBB) 0.0254**
0.0347**
0.0238**
0.0353**
Pseudo-Rsq 0.2969 0.4297 0.2957 0.4288 0.2981 0.4305

Table 5
Abnormal borrowing costs
The table reports pooled OLS regressions representing cross-sectional variations in mean results to see if
firm denomination decisions differ from two naive denomination rules weighted by number (EW) and USD
amount of offerings (VW). The sample period is from 1993 to 2005. The dependent variables are defined
as the difference between the naïve borrowing cost and the realized borrowing cost. We present results for
equal-weighted OLS regressions when the naïve benchmark is the equal-weighted cost, and value-weighted
OLS regressions when the naïve benchmark is the value-weighted cost. The coefficients capture the
borrowing gains achieved by deviating from the respective generic borrowing strategy. The nominal yield
is the log-basis point 5-year AA-rated average yield from Bloomberg for the respective currency. The
exchange rate appreciation is the one-year ahead appreciation rate in the exchange rate spot rates (quoted as
currency i/euro) in log basis points. The covered yield is the log-basis point difference in the 5-year AA-
rated average yield from Bloomberg and the 5-year swap yield from Datastream plus the average basis
swap yield from Bloomberg for the respective currency. D(Heavy issue volume) is an indicator variable
that equals 1 if the month in which the offering was made was one of the 15 busiest months in the sample
period for that currency, where business of the month is defined by the share of total sample bond offerings
denominated in the particular currency. Robust t-statistics are reported in parentheses. The number of
observations is 2608. The symbols *, **, and *** indicate significance at the 10 percent, 5 percent, and 1
percent levels, respectively.
Naïve borrowing cost less realized borrowing cost
Dependent variable Nominal yield Ex. rate appreciation Covered yield
EW VW EW VW EW VW
Intercept 6.39 -0.38 29.14**
27.89**
-1.41***
0.15
(1.61) (0.09) (1.98) (2.17) (3.76) (0.51)
D(Heavy issue vol.) 53.30***
81.38***
78.95***
109.60***
5.01***
6.42***
(5.25) (4.98) (2.63) (3.01) (8.53) (8.02)
D(Home=EM) 4.11 0.98 54.63* 30.25 -4.22
*** -3.83
***
(0.41) (0.11) (1.79) (1.07) (6.60) (6.31)
D(Rating<BBB) -103.60***
-64.40***
-79.23***
-47.09**
-5.13***
-3.76***
(17.27) (11.95) (2.88) (2.00) (9.54) (7.99)
R-sqr 0.0516 0.0641 0.0053 0.0104 0.0640 0.0991
36
Figure 1. Borrowing cost variables over sample period. This figure plots the monthly borrowing cost
measures over the 1993 to 2005 sample period. The units are log basis points. The various panels include
the nominal yields (Panel A), exchange rate appreciation (Panel B), and covered yields (Panel C). Panel D
plots a component of the covered yield, the basis swap rate. Due to lack of reported rates over the full time
series, the imputed values are plotted as flat lines for a portion of Panel D.
Figure 1a. Nominal yield
Figure 1b. Exchange rate appreciation
0
200
400
600
800
1000
1200
1993 1994 1995 1996 1997 1998 1999 2000 2001 2002 2003 2004 2005
US
STG
Y
SFR
C
AU
-4000
-3000
-2000
-1000
0
1000
2000
3000
4000
1993 1994 1995 1996 1997 1998 1999 2000 2001 2002 2003 2004 2005
US
STG
Y
SFR
C
AU

37
Figure 1c. Covered yield
Figure 1d. Basis swap rate
-60
-40
-20
0
20
40
60
80
100
120
1993 1994 1995 1996 1997 1998 1999 2000 2001 2002 2003 2004 2005
US
STG
Y
SFR
C
AU
-50
-40
-30
-20
-10
0
10
20
1993 1994 1995 1996 1997 1998 1999 2000 2001 2002 2003 2004 2005
STG
Y
SFR
C
AU

38
Figure 2. Abnormal borrowing gains in event time. This figure plots the mean abnormal borrowing cost
gains in event time where Month 0 is the month of the bond offering. Plots for both the full sample of bond
offerings and only those issued during high currency share months are provided. High currency share
months are defined as the 15 busiest months in the sample period for that currency, where business of the
month is defined by the share of total sample bond offerings denominated in the particular currency.
Observations are value weighted by the principal of the bond offering in USD. All series are standardized
by subtracting the sample currency mean and dividing by the sample currency standard deviation. The
various panels are the nominal yields (Panel A), exchange rate movements (Panel B), and covered yields
(Panel C). The exchange rate variable measures the standardized amount of exchange rate gain achieved
by offering the bond in month 0. This is measured by calculating the relative amount of exchange rate
appreciation before the bond offering and the relative amount of exchange rate depreciation after the bond
offering. Specifically this amount is measured as the exchange rate for month 0 less the exchange rate at
each of the event window months.
Figure 2a. Nominal yield
-0.05
0.00
0.05
0.10
0.15
0.20
0.25
0.30
0.35
0.40
-12 -10 -8 -6 -4 -2 0 2 4 6 8 10 12
Sta
nd
ard
dev
iati
ons
Month relative to bond offering
Full sample
Offerings issued during high
currency share months

39
Figure 2b. Exchange rate
Figure 2c. Covered yield
-0.40
-0.30
-0.20
-0.10
0.00
0.10
0.20
-12 -10 -8 -6 -4 -2 0 2 4 6 8 10 12
Sta
nd
ard
dev
iati
ons
Month relative to bond offering
Full sample
Offerings issued during
high currency share
months
-0.30
-0.20
-0.10
0.00
0.10
0.20
0.30
0.40
-12 -10 -8 -6 -4 -2 0 2 4 6 8 10 12
Sta
nd
ard
dev
iati
ons
Month relative to bond offering
Full sample
Offerings issued during
high currency share
months