Embed Size (px)
Citation preview
DO FIRMS HEDGE OPTIMALLY?
Evidence from an Exogenous Governance Change
Sterling Huang*
Urs Peyer**
Benjamin Segal*
INSEAD
August 27, 2013
Abstract
We find that an exogenously imposed board composition change significantly affected financial risk management. Using new proxies for the extent of financial risk management in non-financial firms we find that treated firms (those affected by the requirement to have a majority independent board) reduce their financial hedging in a difference-in-difference framework. The reduction is concentrated in firms with higher conflicts of interests factors, such as a high CEO equity ownership level, which exposes CEOs to more idiosyncratic risk, or a higher occurrence of option backdating. We reject the hypothesis that newly independent boards reduce financial hedging due to a lack of knowledge. First, we find no difference in financial hedging for firms where SOX mandated the addition of a financial expert relative to those that already had such expertise. Second, shareholder value increases more during the period of time of the listing rule deliberations for treated firms that hedge prior to the treatment. We conclude that some firms hedge excessively, reducing shareholder value—potentially to the benefit of under-diversified CEOs. Our findings also suggest that the board plays a significant monitoring role in financial risk management.
* INSEAD, Singapore Campus, ** INSEAD, Fontainebleau Campus, Boulevard de Constance, 77300 Fontainebleau, France. Email: sterling. [email protected], [email protected], [email protected]. We thank Anil Shivdasani, Yaniv Grinstein, Ernst Maug, James Noughton, and seminar participants at UNC-Chapel Hill , INSEAD, and conference participants at the 2013 American Accounting Association (AAA) Annual Meeting for their helpful comments.
1
1. Introduction
A large literature on risk management suggests that firms should benefit from
managing risks.1 Consistent with this prediction, Allayannis and Weston (2001) find
an average 5% value premium for firms hedging currency risk. However, agency
problems could lead managers to make suboptimal hedging choices. For example,
Tufano (1996) concludes that managerial risk preferences are important determinants
of the extent of risk management in the gold mining industry. Similar evidence is
shown in Knopf, Nam, and Thornton (2002) and Graham and Rogers, (2002) for other
non-financial firms. While these papers find that CEOs with more equity ownership
hedge more, Kumar and Rabinovitch, (2012) also find that firms with more agency
problems hedge more. Thus, while the average firm seems to benefit from hedging, it
is unclear whether firms hedge optimally.
On the one hand it is possible that firms optimally design compensation and
ownership of their management to induce optimal hedging, e.g., the board provides
more equity ownership to managers in order to induce more hedging. On the other
hand, risk management could be affected by side effects of compensation policies or
remaining agency problems. Given the possible simultaneity of determining
governance and risk management, we ask whether an exogenous change to the
independence of the board of directors affects risk management and if such a change
in risk management is value enhancing or destroying for shareholders.
We exploit the new listing rule imposed by NYSE and NASDAQ in 2003
requiring firms to have a majority of independent directors on their board. In a
difference-in-difference framework similar to Chhaochharia and Grinstein (2009) and
Guthrie et al (2012) we compare treated firms (those that needed to change their
board) to control firms (those that already had a majority of independent directors on
their board) in terms of the extent of risk management and associated value changes.
In order to measure the extent of risk management, we introduce several new
proxies based on hedge accounting data and word count measures. Prior research has
used notional value of hedges reported in 10-K reports (e.g., Allayannis and Weston,
2001; Graham and Rogers, 2002) as a proxy for the extent of risk management.
Unfortunately, FAS 133 introduced in 2000 does not require the reporting of notional 1 Research shows that hedging is valuable to the extent that tax payments (Smith and Stulz, 1985), financial distress costs (Stulz, 1984), information asymmetry costs (Stulz, 1990; De Marzo and Duffie, 1991; Breeden and Viswanathan, 1998), and financing costs (Froot, Scharfstein, and Stein, 1993; Morellec and Smith, 2002) can be reduced.
2
value of hedges anymore.2 Nevertheless, for all firms that still disclose the notional
value – about one third of our sample firms – we document high correlations with our
new hedging measures.
We create a first proxy of financial hedging based on hedge accounting data
available on COMPUSTAT starting from 2001 that records unrealized gains and
losses from financial hedging which offset variations in future cash flow. For
example, a long position in a commodity forward cont ract maturing in a future period
(e.g. oil) may increase in value if the underlying has increased. However, future
operating expenses (e.g., fuel costs) would increase in lockstep. Hedge accounting
treatment delays recognition of the gain on the commodity contract to the period in
which the underlying cost is incurred, at which point they will be netted out in that
period’s profits.3 An advantage of using hedge accounting numbers is that we get an
estimate of the quantitative importance of hedging. A limitation with using hedge
accounting information as a proxy for the extent of financial risk management is that
firms may hedge but not record it as hedge accounting. 4 We create a second proxy
that casts a wider net. The proxy is based on counting words related to financial
hedging in 10-K statements. We use financial hedging terms from Campello et al
(2011) and Graham and Rogers (2002). In a third proxy we extend this word-list
based upon reading 10-K statements of a few high profile hedging firms (e.g.,
Southwest Airlines) to include detailed expressions of financial hedging contracts.
Fourth and fifth, we create focused interest rate and exchange rate hedging proxies to
address concerns that general hedging terms such as ‘option contract’ could also be
used in describing compensation arrangements. The assumption of these proxies is
that firms that use more of these financial hedging expressions are more actively
managing risk using financial hedges. We create a last proxy by searching 10-K
statements for expressions that reflect risk management organizations and functions 2 Statement of Financial Accounting Standards No. 133 : Accounting for Derivative Instruments and Hedging Activities. Early application permitted as early as September 1998. Required for fiscal years beginning after June 15, 1999. Thus, for most firms, first year of application is 2000. 3 Cash-flow hedges include derivatives used to hedge exposure to expected future cash flows that are attributable to a particular risk and may relate to existing assets or liabilities as well as to forecasted transactions (FAS 133). Thus, our proxy Compustat Item AOCIDERGL captures commodities, foreign currency exchange rate and interest rate hedges designated as cash-flow hedges. 4 For example, “ fair value” hedge s – protecting against fluctuations of assets (or liabilities) that are on a company’s balance sheet – may not be included in our Compustat proxy. B ased on a survey, Lins, Servaes, and Tamayo (2011) find that fair value accounting for hedges has significantly affected 42% of the responding firms in how they hedge. They document a reduction in option based hedging but no effect on linear contracts. Furthermore, “natural” or “economic” hedges will not be classified as hedge accounting (see Mulford and Comiskey , 2009).
3
(e.g., Chief Risk Officer). While this proxy is expected to be positively correlated
with the extent of risk management on average, an increase could indicate either more
monitoring or more hedging.
In the difference-in-difference analysis, we find a significant reduction in the
extent of financial risk management for treated firms relative to control firms.
Economically, we find that treated firms relative to control firms display a reduction
in the absolute value of unrealized gains and losses (standardized by lagged book
value of assets) of 21% around the time of the listing rule change.5 We also find that
the number of words related to financial hedging decreases by between 9% and 36%
depending on the measure used. However, treated firms show a marginally significant
increase in the number of words related to the risk management policy and functions.
Our findings are consistent with the interpretation that the board independence
requirement reduces financial hedging but increases discussions about risk
management policy and functions.
However, a simple explanation could be that the treated firms decided to reduce
the risk in their business. Since our hedging variables do not capture exposure, it is
possible that firms would need less financial hedging because they reduced risk. If
that were the case, we would expect equity volatility to decrease for treated firms
(relative to control firms). However, in a difference-in-difference analysis we find that
total equity volatility, and in particular idiosyncratic volatility, increases for treated
firms. Taken together, these findings are consistent with the interpretation that treated
firms reduce hedging, leaving more risk to be borne by equity holders. Our findings
complement those of Guay (1999) and Bartram, Brown, and Conrad (2011), who find
that the introduction of hedging reduced equity volatility. Furthermore, we directly
test whether treated firms lower the level of operating risks by studying changes in
corporate policies. We find no significant treatment effects on policies like firm-
diversification, leverage , cash holding or investment.
Given the reduction in financial hedging induced by the mandated board
change, we ask whether this change is value enhancing or destroying for shareholders.
First, the newly majority independent board may not have the expertise to manage
5 Guay and Kothari (2003) find that among a subsample of large, non -financial firms the amount of cash flow and value hedged using financial derivatives is small. However, their estimates are based on information in 10-K statements prior to the new hedge accounting rules. It is thus possible that our finding of larger unrealized gains and losses due to hedging might be affected by the new reporting requirements.
4
risk, and thus may cut back on hedging for lack of understanding. We call this the
‘knowledge hypothesis’. Alternatively, the ‘monitoring hypothesis’ posits that power
will shift towards the independent directors on the board, who will cut back on
excessive hedging that is not in the interest of shareholders.
To test the ‘knowledge hypothesis’ we use a second, exogenous board rule
change imposed by the Sarbanes -Oxley act (SOX) – whereby firms were required to
have a financial expert on the audit committee – to explore whether treated firms
(with newly independent boards) which also had to add a financial expert saw any
reduction in risk management. Both Minton, Taillard, and Williamson (2012) and
Cunat and Garicano (2010) find evidence that financial expertise at the board level
mattered for risk management in financial firms, albeit with opposite effects.6 In a
difference-in-difference analysis, we find no significant difference in financial
hedging among treated firms (newly independent boards) which are also obligated to
add a financial expert. 7 Furthermore, we find that treated firms increase their
reporting about risk management organization and functions relative to control firms.
Hence, it seems unlikely that the reduction in financial hedging is primarily the result
of adding new, independent directors without sufficient knowledge to properly
oversee financial hedging policies or operations.
To test the monitoring hypothesis, we split the treated firms (board
independence shock) into two groups: those with ex-ante higher agency problems and
those with lower problems. Firms with a CEO who has above sample median equity
ownership are classified as ‘high agency problem’ firms. The reason for this
somewhat unusual classification is that such CEOs have a higher exposure to the
firm’s idiosyncratic risk, a risk not priced in the market by diversified shareholders
6 Minton, Taillard, and Williamson (2012) documented an increase in risk-taking by financially literate independent boards during the financial crisis. Studying Spanish banks, Cunat and Garicano (2010) found that a lack of financial knowledge on the board lowered the quality of the loans and their performance. While both papers investigate the link between boards, risk, and performance, neither shows a direct effect on risk management. Beyond the focus on board quality only, Ellul and Yerramilli (2012) analyze 75 U.S. bank holding companies and create a risk management ranking. They find that banks with better rankings in 2006 were less exposed to subprime-mortgage loans and performed better during the crisis. However, their paper does not show a link between board expertise and risk management ranking. 7 However, there is some evidence that firms that did not have a financial expert on the audit committee in 2002 did hedge less throughout the sample period, consistent with board skills being selected endogenously.
5
but to which the CEOs are nonetheless exposed. 8 We find that such firms display a
significant reduction in financial hedging, consistent with the monitoring hypothesis.
This finding is consistent with Tufano (1996) and Knopf, Nam, and Thornton (2002)
that find firms with high CEO equity exposure hedge more and add that this might be
evidence of suboptimal hedging.9
When we split the sample according to whether boards have received backdated
option grants (following Bebchuk, Grinstein, and Peyer, 2010) as a proxy for agency
problems, we find that only backdating firms experience a reduction in hedging.
Interestingly, Kumar and Rabinovitch (2012) document that firms with higher CEO
entrenchment display a higher likelihood of hedging. Taken together, our findings are
consistent with the interpretation that firms with more agency problems may hedge
idiosyncratic risk that affects CEO utility without creating value for shareholders.
According to the monitoring hypothesis, we expect shares of treated firms that
use financial hedge s to display higher event-time stock returns compared to non-
hedgers. We choose the event time to be during the deliberation period of the listing
requirement changes from February 2002 to November 2003 (similar to Chhaochharia
and Grinstein, 2007). A difference-in-difference approach reveals that treated firms
with financial hedging prior to the listing rule change outperformed treated non-
hedger firms, relative to the difference between hedgers and non-hedgers of control
firms. Depending on the benc hmark model and the proxy for hedging, we find an
outperformance of between 2.5% and 6.4%.
In sum, we find that the exogenously imposed board independence reduced
financial hedging but left other corporate hedging policies, such as leverage or firm
diversification, unaffected. Also, equity volatility, and in particular idiosyncratic risk,
increased for treated firms. Our findings are consistent with the interpretation that
agency problems prompted CEOs to hedge risk, especially idiosyncratic risk, in a way
that benefited themselves at the expense of shareholders. The new board
independence requirement increased the monitoring role of the board which led to a
reduction in financial hedging and a relative increase in firm value, providing
8 Klein’s (2002) finding that higher CEO ownership is (weakly) associated with more earnings management is consistent with the interpretation that higher CEO ownership can indicate higher conflicts of interest. 9 Graham and Rodgers (2002) also find that firms where CEOs have a higher delta of equity ownership hedge more. This is in contrast to Haushalter (2000), who did not find that equity ownership is related to hedging in the oil and gas producing industry.
6
evidence that firms may not hedge optimally, especially if they face more agency
problems.
Our paper contributes to three strands of literature. First, our finding that treated
firms reduce financial hedging and experience an increase in firm value contributes to
the understanding of whether firms hedge optimally. Knopf, Nam, and Thornton
(2002), Graham and Rogers (2002), and Kumar and Rabinovitch (2012), find that
CEOs with more option delta in their incentive compensation hedge more. While
hedging might be valuable as shown in Allayannis and Weston (2001), it is possible
that firms might over-hedge, thus reducing firm value at the margin. Our paper
suggests that firms with higher powered CEO incentive contracts and more agency
problems have hedged too much, potentially to be nefit the CEO at the expense of
shareholders.
Second, we contribute to the discussion about the role of the board in risk
management. To our knowledge , this paper is one of the first to focus on the role of
the board in non-financial firms and to conclude that it plays a significant monitoring
role in risk management. Our study complements research on the link between
governance and risk management in financial institutions. Schmid, Sabato, and Aebi
(2011) assess the role of the board in risk management, finding that if the Chief Risk
Officer (CRO) reported directly to the board (as opposed to the CEO), financial
institutions performed better during the financial crisis. Cunat and Garicano (2010),
and Minton, Taillard, and Williamson (2012) show links between board expertise and
performance of financial institutions during the crises, while Ellul and Yerramilli
(2012) show that banks which they classify as having a ‘better risk management’
performed better during the crisis. Our conclusion is also important in light of the
2010 SEC requirement that firms disclose more information about the role of the
board in risk management , implying that the role of the board is important in this
aspect even in non-financial firms.
Our study contributes to a third strand that focuses on the determinants of
financial risk management in companies. The standard corporate finance literature on
corporate risk management suggests why non-financial firms might want to hedge
(see footnote 1). However, according to the survey by Bodner et al (2011), these
theoretical explanations do not match those given by managers about why they
primarily engage in risk management. Our study adds to this literature by showing
that agency problems and weak monitoring by the board may lead firms to hedge
7
idiosyncratic risk for the benefit of the CEO. Given that we find a reduction in
financial hedging and a simultaneous increase in idiosyncratic risk among the treated
firms, this may partially explain why respondents in Bodner et al (2011) did not
mention reducing idiosyncratic risk as one of the top three reasons for risk
management – it may knowingly be suboptimal.
The rest of the paper is organized as follows: Section 2 describes the data and
methodology, Section 3 analyzes whether board independence affects financial
hedging. In Section 4 we test whether the reduction in hedging is due to adding
independent directors without financial knowledge or whether the board now
monitors better. Section 5 tests whether the observed reduction in financial hedging is
good or bad for shareholders using an event study, and Section 6 concludes.
2. Data and Methodology
2.1. Sample Selection
The first part of the paper investigates whether risk management, in particular
financial hedging, is affected by the exogenously imposed change in board
independence. Firms listed on the NYSE and NASDAQ were mandated to have a
majority of independent directors. The listing rule changes were approved in
November 2003 by the SEC. The listing requirement changes happened around the
same time as the Sarbanes-Oxley Act (SOX) was put in place (Chhaochharia and
Grinstein, 2007). To control for the simultaneous changes imposed on all firms, we
use a difference-in-difference approach first used in Chhaochharia and Grinstein
(2009). We start with all publicly listed firms from the Compustat/CRSP database and
select those that also have information on IRRC about board independence. This
limits our sample to 1017 firms. We further restrict the sample to non-financial firms
(excluding firms with SIC 6000-6999). This leaves us with a final sample of 891
firms and 7271 firm-year observations between 1998 and 2006. Firms are classified as
treated firms if they did not have a majority independent board in 2002, as defined by
IRRC.10 The remaining firms are classified as control firms, i.e., firms not explicitly
10 The IRRC definition of independence is stricter than those of the NYSE/Nasdaq. In an attempt to adjust for the discrepancies, Chhaochharia and Grinstein (2009) reclassify former employees as independent if three or more years have passed since termination. Guthrie et al (2012) show that reclassification may result in inconsistent treatment of directors with or without business relationships:
8
affected by the listing rule change mandating majority board independence.
According to this rule , we classify 202 firms as treated and 689 firms as control firms.
This is similar to Guthrie et al (2012), who have 78% of their sample firms classified
as compliant.
2.2. Methodology
To test whether risk management has changed differently between treated and
control firms, we run the following difference-in-difference regression:
Risk Managementit = ß0 + ßi afterlaw t × treated dummyi + ?'Xit + firmfixed (1) + FF48 × yearfixed + eit
where i indexes firms and t time. The afterlaw dummy is equal to one from 2003
onwards. The treated dummy is equal to one in all sample years if the firm is affected
by the NYSE/NASDQA listing requirement change. Xit represents the independent
variables included as controls. Firmfixed denotes the firm fixed effect. FF48 are
dummies for the Fama-French 48 industries. Yearfixed is a year fixed effect. eit is the
residual. Note that we do not include a treated-dummy separately as it is absorbed in
the firm fixed effect. Similarly, the afterlaw dummy separately is absorbed in
industry-year joint fixed effects. Following Guthrie et al (2012) we report
heteroskedasticity-robust standard errors, clustered at the firm-period level, where the
period refers to the years before and after the rule change, respectively.
2.3 Hedging Variable Definitions
Here we describe the construction of the main variables of interest. Definitions
of all variables used are given in Table A1, in the Appendix.
2.3.1 Cash Flow Hedging
Our first proxy for financial hedging is based on reported cash flow hedging.
Cash flow hedging was introduced with the Financial Accounting Standar d Board
(FASB) Statement No. 133 (FAS 133) in 2000. 11 Under FAS 133, a firm records
changes in the fair value of financial instruments classified as hedging future cash
former employees with business ties to the firm are considered independent, while directors with business ties who were not formerly employed are not considered independent. 11 Campbell (2009) uses cash flow hedging to investigate whether the market efficiently incorporates this information into equity prices, and finds some eviden ce of predictability.
9
flows as a component of equity (accumulated other comprehensive income - AOCI),
rather than as gain or loss in current earnings. The first proxy sums the absolute
values of hedge accounting gains and losses per firm-year. Then we standardize this
variable by lagged book value of assets as a proxy for size.
The amount of cash flow hedging recorded will vary over time for at least three
reasons. First, if the firm increases or decreases cash flow hedging. Second, if the
value of the underlying asset varies. Third, if the hedge contract matures. Thus, in
order to understand whether treated firms change hedging differently from control
firms, the treatment effect should identify firms’ choices to increase or decrease or
end hedges differently from control firms. To the extent that the variation in the
underlying affects both treated and control firms in the same industry, the difference-
in-difference approach with industry-year fixed effec ts should take out the variation in
hedge accounting due to changes in the value of the underlying. Also, if firms’
average maturity of the hedging contracts is about the same, then realizing gains and
losses from expirations of contracts should not affect the difference-in-difference
estimates. However, to the extent that the treatment affects the amount of hedging, the
difference-in-difference estimate should reveal if there is a change in the quantity of
cash flow hedging.
Nonetheless, there are several drawbacks to using the accounting measure of
cash flow hedging as a proxy for financial hedging. First, practitioners (e.g.,
Comiskey and Mulford, 2009) suggested that FAS 133 guidelines are difficult to
implement , making classification of financial instruments as qualified hedges under
the rule a potential restatement risk. However, to affect our inferences from the
difference-in-difference analysis, treated and control firms would have to
systematically react differently to the guidelines. This seems unlikely to the extent
that restatement risks are mainly associated with the correlation between the hedge
and the underlying risk – something that is common to the industry, for which we
include controls. A second drawback of using this proxy of cash flow hedging is that
‘fair value hedges’ (designed to offset variation in value of balance sheet items) are
not recorded in AOCI. Thus, cash flow hedging underestimates overall financial
hedging. A third drawback is that a hedge which is in place but has a va lue of zero
(i.e., many derivative contracts at the time of entering the hedge) does not affect cash
flow hedge reporting until the underlying price moves.
10
2.3.2 Word Count Proxies
As an alternative to using hedge accounting as a proxy for financial hedging, we
create new proxies based on word analysis of the 10-K statements to determine
whether and how much a firm hedges. We create several variables that count the
number of times a specific expression appears in a 10-K statement. The first variable ,
called CLMZ, uses the word list of Campello, Lin, Ma, Zou (2011) [derivative, hedg,
financial instrument, swap, market risk, expos, futures, forward contract, forward
exchange, option contract, risk management, notional]. Campello et al (2011) and
Graham and Rodgers (2002) use these words to identify the location of information
about hedges and collect information on notional values to estimate the extent of
hedging. Under FAS 133, firms do not have to list notional values of the instruments
anymore. Thus, we simply count the number of risk management related expressions
as a proxy for the extent of financial hedging assuming a positive correlation between
risk manageme nt and the number of words used to describe it in the 10-Ks. A second
proxy, called HPS, uses a more extensive list of words (see Appendix) to search the
10-K statements. These additional search words are retrieved from detailed readings
of firms that are known to use financial hedging (e.g., Southwest Airlines). One of the
possible drawbacks of the word search is that certain words might be used as part of
the description of compensation arrangements. Thus, we report results excluding
sections 10 (Directors and Officers) and 11 (Executive Compensation) of the 10-K
from the word count. Interestingly, there is very little difference , as section 11 refers
to the proxy statement for details on executive compensation plans in 95% of the 10-
Ks we searched. Howeve r, even the risk sections of the 10-K can contain references to
executive compensation. Thus, we create proxies that use more specific words related
to interest rate (IRHedge) and foreign exchange (FXHedge) risk hedging (see
Appendix) . The advantage of those more specific hedging variables is that IR and FX
expressions are only used in the context of describing specific exposures and financial
hedges. As a last proxy we count words that relate to risk management organization
and functions , such as the title of the risk management officer (RISK_POLICY). The
existence and mention of risk management organizations and functions is expected to
be indicative of a systematic approach to risk management and the prominence that it
receives as a global process and function rather than an ad hoc or localized function.
We expect that an increase in the first set of proxies indicates more hedging.

11
However, a higher word count on policy related issues could either mean more
hedging or tighter monitoring of risk management.
We create two versions of these proxies: First, we divide the number of words
related to financial hedging by the number of words in the 10K. Second, we create a
standardized variable in the following way: (x – min)/(max – min), where x is the
firm’s number of words related to hedging in a given year, min is the minimum
number of words that a firm in the same industry and year has used, and max is the
maximum number of words a firm in the same industry and year has used. This
variable thus takes values between zero and one.
An advantage of the word count proxies is that we can construct them further
back in time than 2001. A drawback of the word count proxies is that we do not know
what fraction of the exposure and which exposure firms are hedging. Furthermore, it
is possible that certain firms describe their hedging activities in much more detail than
others. Thus, in order for these firm-specific level effects to be controlled for, we run
firm fixed effects regressions. 12 In addition, we control for industry-year fixed effects
to control for possible changes in the risk at the industry-year level and changes in
reporting regulation.
2.3.3 Notional Value of Hedges
Graham and Rogers (2002) analyze firms ’ hedging activity prior to FAS 133 by
collecting notional value of interest rate and foreign exchange rate hedges.
Unfortunately, with FAS 133 some of that information is not required to be disclosed
anymore. However, it turns out that about one in three firms still report notional
values voluntarily. To collect the information, we search each sample firm’s 10-K in
the years post 2000 for the notional values of financial hedges. Since firms voluntarily
report notional values after adoption of FAS 133, we drop firms that do not report
notional values at least once before 2004. We find that 249 firms out of 891 still
report notional values. This selection introduces a potentially important sample bias as
firms are excluded which do not hedge as well as firms that do hedge but do not
report notional values anymore. Our primary purpose of collecting this information is
12 Note that if the exogenous change to the board independence also affects the quantity of reporting in general, then one might worry that a change in our hedging proxies might only be due to changes in reporting rather than real changes in hedging. However, to the extent that the board changes affect the general quantity of information revealed (higher or lower), our proxies adjust for this by dividing hedging word counts by the total word count of the 10-K form.
12
to try helping us understand whether our word count measures correlate with notional
value hedge measures – conditional on firms hedging. This will allow us to estimate
whether variation in word count measures are due to more or less hedging or whether
firms simply discuss their exposure to risk and explain why they are not hedging.
Second, we can estimate whether treated firms that do hedge actually change their
notional values – thus eliminating the concern that the newly majority independent
boards simply change the reporting on financial hedging.
We follow Graham and Rogers (2002) approach in collecting notional values of
interest rate and exchange rate hedges and add notional values of commodity hedges.
Hedges are classified as long positions if the hedge leads firms to gain from an
increase in interest rate, exchange rate, or commodity prices. We then compute the net
hedging position by risk (interest rate, exchange rate, commodity). The total he dging
is then the sum of the absolute value of the ratio of notional hedges to book value of
assets.
2.4 Univariate Statistics
Table 1, panel A lists the univariate statistics of the hedging proxies as averages
across the sample period. All results reported are based on winsorizing variables at the
one and 99th percentile. In our sample of firms, on average, hedging related words
using the CLMZ (HPS) word list account for 0.18% (0. 27%) of all the words in the
10-K statements. The 25th and 75th percentiles are 0.07% and 0.26% (0. 12% and
0.39%). The IRHedge and FXHedge variables have a mean of 0.009% and 0.004%
respectively. More importantly, the correlation between IRHedge (FXHedge) and
HPS are 0.36 and 0. 52, respectively, indicating that a significant fraction of the
variation in HPS is due to variation in financial hedging rather than other types of
descriptions in the 10-K (e.g., compensation programs, leases). We further test the
quality of the word count measure by computing time-series correlations between
HPS and net notional value of hedges of firms that still reported them in the 10-K up
until at least 2004. We find that the average net notional-to-asset ratio is 5%. Graham
and Rogers (2002) and Campello et al (2011) report net-notional-to-asset ratios of
about 9% for their sample firms of hedgers in 1994/95 and 1996-2002, respectively.
When we exclude firms with zero notional value, the average notional-to-asset ratio
increases to a comparable 8% (not tabulated). We then compute a time series
corre lation between our new hedging measures and the net notional-to-asset ratio for
13
each firm with available data. The median correlation between the net notional-to-
asset ratio and CLMZ (HPS, IRHedge, FXHedge ) are 54% (54%, 67%, 42%). The
significantly positive correlations lend further credibility to the word count measures
as proxies for the extent of risk management.
The average standardized CLMZ and HPS measures are 0.16 and 0.18
respectively. If the hedging word use was uniformly distributed between min and max
within an industry-year, the average would be 0.5. These averages indicate that there
are some firms in each industry with a very high count of risk management related
words. However, we did check that the averages were not driven by a handful of
outliers. When winsorizing the variables at the third and 97th percentile, the average
standardized measures increase only marginally to 0.17 and 0.19 respectively,
indicating that there is a wide dispersion in the use of hedging within an industry.13
The number of words related to the risk management organization and functions
is relatively small, representing only 0.007% of the total words in the 10-K. 42% of
the firm-year observations show some description of risk management policy.
Interestingly, Bodner et al (2011) report that 44% of non-financial firms said they had
a risk management policy in place.
The absolute value of cash flow hedges divided by the lagged book value of
assets is 0.15%, while the median is zero. We focus on absolute values as a proxy to
capture the extent of hedging rather than the direction of hedging or the net positions.
A back of the envelop calculation shows that firms which use cash flow hedging
hedge about 19% of their average profits.14 However, we find that only 16% of the
sample firm-years use cash flow hedging (D(CFHedge)). Compared to the 42% of the
firms that report some risk management policy in our sample and Bodner et al’s
(2011) survey evidence of 44% of firms with risk management policies, it seems
likely that the hedge accounting proxy underestimates the extent of financial risk
management. In order to assess whether the cash flow hedge proxy is systematically
biased based upon the industry, we report in panel B of Table 1 the averages for each
of the 10 Fama-French industries.15 According to the hedge accounting proxy, we find
13 We have also run all the regressions winsorizing the hedging variables at the three and 97th percentiles. None of the inferences are affected (not tabulated). 14 On average, firms have an ROA of 5% and hedge 0.09% of assets. Thus, the average firm hedges 3.0% of its profits (0.15%/5% ROA). Among the 16% of the firms which report cash flow hedging, the average profit hedged is therefore about 18.75% (3.0%/16%). 15 Note that we use the Fama-French 48 industry classification in the regressions. However, for expositional purposes we report here the condensed industry classification.
14
that Oil, Gas, and Coal and Util ities (Business Equipment and Wholesale and Retail)
industries are the two highest (lowest) users of financial hedging, on average. We
obtain a similar ranking if we use the word count measures CLMZ and HPS expressed
as a fraction of the total number of words in the 10-K statements. The two top
industries are Oil, Gas, and Coal and Utility, the two bottom industries are Telecom
and Healthcare (followed very closely by Business Equipment and Wholesale and
Retail). While there is significant variation between industries in terms of the average
hedging, the ranking is very similar across the different proxies. This reduces our
concern that the cash flow hedging pr oxy is systematically biased against one
particular industry. There is one interesting exception. Net notional-to-asset ratios for
Oil, Gas, and Coal and Utilities are the lowest of all industries. While those industries
are classified by our other measures as heavy users of financial hedging, the notional
values of the hedges are smaller because the underlying is mostly commodities, not
interest rates or foreign exchange rates. The latter have typically higher notional
values. Note that the fact that the net notional-to-asset ratios have a different industry
distribution does not affect our regression analyses since those are run at the firm
level in a difference-in-difference framework with industry controls.
Panel C of Table 1 shows univariate statistics for control variables that we
include in the regressions. We control for the industry concentration since Giroud and
Mueller (2010, 2011) show that governance changes in competitive industries have
less of an impact. Firm size could affect access to hedging instruments. We use the
log of the book value of assets as a proxy for size. Firm age could correlate with
hedging for a number of reasons. First, older firms would have had more time to do
operating hedges and might thus need fewer financial hedges. Older firms could also
hedge less if they are more complacent. We add Tobin’s Q as a proxy for growth
opportunities. Growth firms might have to trade off between investing in new projects
or hedging if there are financial constraints (e.g., Rampini and Vis hwanathan, 2010).
Hedging could be affected by the performance of the firm (Rampini, Sufi,
Vishwanathan, 2012). We include ROA, lagged ROA, and the stock return over the
calendar year as controls.
3. Board Independence and Financial Hedging
We address the question of whether firms hedge optimally in a difference-in-
difference framework where we study the changes in risk management around the
15
2003 NYSE/NASDAQ listing rule change , which required firms that did not yet have
a majority independent board to change its board composition.
3.1. Hypotheses
In the following section, we describe what changes we expect when the board
becomes independent. Our null hypothesis is that the board does not affect financial
hedging. Alternatively, if the board matters, the amount of financial risk management
could either go up or down at the time when the board has to become majority
independent.
Under the assumption that the newly majority independent board acts in the
interest of shareholders we have the following hypotheses:
H1: Risk management increases if the insider dominated board has done too
little hedging. This increase is in the interest of shareholders.
H2: Risk management decreases if the insider dominated board has done too
much hedging. This decrease is in the interest of shareholders.
It is also possible that the newly majority independent board does not have the
necessary knowledge to hedge the company’s exposure in an optimal way.
H3: Risk management increases, leading to over-hedging. This change would be
suboptimal for shareholders.
H4: Risk management decreases, leading to under-hedging. This change would
be suboptimal for shareholders.
3.2 Difference-in-difference Estimates
3.2.1. Main Results
Table 2 shows estimates of regression (1) w ith the various hedging proxies. In
column 1, the dependent variable is the absolute value of the hedge accounting losses
and gains recorded at the fiscal year end, standardized by lagged book value of assets.
The main variable of interest is the afterlaw * treated dummy interaction. The
coefficient on the interaction term is -0.031, significant at the 10% level. This
coefficient implies that treated firms reduce the amount of unrealized gains and losses
due to hedging by 21% (-0.031/0.145) relative to the overall sample average. We find
that larger firms (measured by log of assets) use more cash flow hedging, as do firms
16
with a higher Tobin’s Q, higher ROA, and a higher stock return. Older firms use less
cash flow hedging.
In column 2 we use the word count measure CLMZ expressed as a fraction of
the total number of words in the 10-K statements, and find a coefficient of -0.017,
significant at the 1% level. To assess the economic impact, compare the coefficient of
-0.017 to the unconditional average of 0.18 percent. Thus , the treatment effect reduces
the fraction of words related to hedging by 9.4% (-0.017/0.18). A similar inference
follows in column 3, where we use the word count measure HPS. The coefficient
there is -0.027, significant at the 1% level. The unconditional average HPS is 0.27.
The coefficient thus implies a reduction of hedging words by 10% (-0.027/0. 27).
Standardizing the variables by the difference between the maximum and minimum
number of words related to hedging in a given industry-year, we find in columns 4
and 5 that treated firms display a statistically significant reduction in financial
hedging use of 0.022 and 0.024 respectively. Thus, within the industry, treated firms
reduce the number of words related to financial hedging by 13.7% (-0.022/0.161) and
13.5% (-0.024/0.178) respectively, relative to control firms in the same industry.
In columns 6 and 7 we report regressions where the hedging measure is based
on a count of words related to either interest rate hedging or foreign exchange
hedging. We show the standardized form of the two hedging variables and find in
both cases significantly negative coefficients, indicating that treated firms reduce the
use of interest rate and foreign exchange related hedging tools. Economically, the
coefficients imply a reduction of 36.4% (-0.036/0.099) for interest rate hedging, and
25.3% (-0.022/0.087) for exchange rate hedging.
One concern with the continuous hedging variable specification is that potential
outliers affect the estimates. In column 8 we report marginal effects of a logit
industry-year fixed effect regression, where the dependent variable is equal to one if
the firm uses an above industry-year-median number of words for the HPS measure
related to financial hedging. The coefficient on the interaction term is again
significantly negative with -0.239, indicating that treated firms reduce financial
hedging around the event. Similar inferences can be drawn from discretizing the
other hedging variables (not shown).
In column 9 we show that even using the net notional-to-asset ratio as a proxy
for the extent of risk management, we find a marginally significant drop among
treated firms. The coefficient of -0.014 implies that treated firms reduce their net
17
notional values of hedging by 1.4% of the assets relative to control firms. Given the
overall mean net notional-to-asset ratio of 4.9%, this is economically a sizable
reduction. Note, however, that this inference applies only to firms which still report
notional values of hedges. These are thus firms that hedge at least in some of the
sample years. Nonetheless, it is reassuring to see that measures used in earlier studies
to proxy for hedging lead to similar inferences, namely, that treated firms reduce their
financial hedging relative to control firms.
All regressions so far are consistent with the interpretation that financial hedging
is reduced in firms that were forced to get a majority independent board relative to the
control firms. However, in column 10 where we use RISK_POLICY as the dependent
variable, we find a positive and significant coefficient on the afterlaw * treated
dummy interaction. Thus, while hedge accounting, the use of words related to
financial hedging, and net notional-to-asset hedging decrease, the discussion of risk
management policy and functions related issues has increased in treated firms.
3.2.2 Robustness
Inferences from the difference -in-difference methodology rely on the
assumption that, absent the treatment effect, both treated and control firms would
have changed the same. To assess whether this is plausible, we test whether treated
and control firms followed a parallel trend prior to the treatment. We test for
differences in hedging measures between treatment and control firms by running the
difference-in-difference regression (1) where we replace the afterlaw dummy with
year dummies. The holdout year, t, is 2002. We find that none of the pre-event
variables are significant, as shown in Table 3, panel A. This analysis suggests that the
parallel trend assumption is not violated for any of the three main hedging proxies.
Furthermore, differences in hedging start to be significantly different from 2004
onwards for all proxies, and for some proxies from 2003 onwards.
We also test whether the firm characteristics we include as control variables
evolve significantly differently. However, we find no significantly different trends in
firm size, measured as the log of assets, Tobin’s Q, ROA and ROA lagged,
contemporaneous stock returns over one year, the Herfindahl-Hirschman index of
industry concentration computed at the three-digit SIC level, and firm age (not
reported). Nonetheless, to test whether the inclusion of these firm level controls are
‘bad controls’ (Angrist and Pischke, 2008) which potentially bias the treatment
18
coefficient dummy, we exclude all control variables, except for the fixed effects.
Table 3, panel B shows that the coefficients and t-statistics on the afterlaw *
treatment dummies are basically unaffected.
3.2.3. Inferences
Based on our hypotheses, there are two possible reasons to observe a drop in
financial hedging and an increase in the discussion about risk management policy:
First, agency problems have led to too much financial hedging. The new board might
monitor more and cut back on hedging (H2). Second, the new board could have cut
back on ex-ante valuable hedging because it does not have the knowledge (H4), and
would discuss the changes in the risk management policy in the 10-K. However, both
hypotheses are formulated holding the level of risk incurred by the company constant.
Since our hedging measures are not able to control for risk exposure, it is possible that
treated firms simply reduce the underlying risks, which in turn reduces the need to use
financial hedges. Thus, the identified treatment effect could be spurious. In order to
address this issue, we test whether the corporate policies were adjusted in a way that
reduces risk and whether equity risk has changed.
3.3. Board Independence and Changes in Risks
One reason why we could find a change in financial hedging for treated versus
control firms is that the treatment affects the amount of risks taken – and accordingly
affects financial risk management. Thus, the question we are asking here is one of
causality. Is it that financial hedging is reduced, which increases risk born by
investors, or is it that business risk and financial risk are reduced, which requires less
financial hedging and reduces risk born by investors?
If the reason for the observed reduction in financial hedging is that treated firms
reduce business and/or financial risks, then we predict firms’ corporate policies to
change in the following directions: 1) Diversification should increase; 2) cash holding
should increase ; 3) leverage should decrease; 4) investment, especially in more risky
R&D, should decrease. To the extent that other policies could be changed (e.g.,
operating leverage, geographic diversification, etc.), the inferences from our tests are
limited by the policies investigated.
We use the same methodology (equation 1) to test whether the board
independence requirement has affected corporate policies. Variables are defined in the
19
Appendix, univariate statistics given in Table 1, panel D, and the regression results
reported in Table 4. We first test whether the number of segments in different four-
digit SIC industries changes , and whether the probability of being diversified (defined
as having multiple segments in different four-digit SICs) has changed. Both
regressions show insignificant coefficients on the afterlaw * treated dummy.
Furthermore, we find no significant treatment effect in cash, leverage , capex, and
R&D.16 Thus, we cannot reject the null hypothesis that the exogenous change in
board independence does not systematically affect corporate policies which would
reduce the level of business and financial risk taken by treated firms. This finding is
consistent with the interpretation that the documented reduction in financial hedging
is unlikely driven by a lower need for hedging since business risk and financial risk
are not reduced by the treatment.
3.4. Board Independence and Equity Risk Changes
Guay (1999) finds that firms which start using financial hedging reduce their
equity risk, and Bartram, Brown, and Conrad (2011) show in a cross-country study
that firms which use more financial hedging display lower equity volatility, both in
the systematic as well as idiosyncratic volatility parts. Based on those prior findings,
we expect that a reduction in hedging should lead to an increase in equity volatility.
Alternatively, if the reduction in hedging was because treated firms reduce their
business and/or financial risks, then we would expect treated firms to display a
reduction in equity volatility.
3.4.1 Methodology and Variable Definition
We ask whether equity volatility has changed differently for treated and control
firms. In these tests we use proxies for equity volatility at the annual frequency as our
dependent variables. We use the following procedures to estimate equity volatility.
First we use a time series of daily stock returns over a calendar year to estimate an
annual equity volatility. To separate volatility into a systematic and an idiosyncratic
risk component, we report results using a one-factor market model. As a robustness
test we also report the idiosyncratic volatility estimates from a four-factor model. Our 16 Bodnar et al (2011) find in their survey that the majority of respondents did not do risk management in order to protect future investments, nor was cash holding a substitute for risk management. However, among those respondents where risk management and cash holding was correlated, the majority said there was a positive association.
20
estimates for the systematic risk component are based on estimating beta using daily
returns over the preceding year. We then compute the annual systematic volatility part
as beta-squared times the market return variance of the year based on daily market
returns. The idiosyncratic volatility is the variance of the (market) model’s residuals.
All dependent variables are in log-form so that the coefficient on the afterlaw *
treated dummy can be interpreted as the percentage change in the volatility.
In equation (1) we additionally include lagged volatility to account for ARCH
and GARCH type behaviors (Engle, 1982; Bollerslev, 1986). In this analysis, the
contemporaneous log stock return is included to control for predictable volatility
changes due to recent stock return trends (e.g., Brandt and Kang, 2004). Since the
amount of firm specific information available to the market can affect the level of risk
(e.g., Morck, Yeung, and Yu, 2000) we also control for the amount of information
released by the board in the 10-K forms. To do this we include the log of the total
number of words in the 10-K statement. Furthermore, prior research has shown that
volatility changes differently after good versus bad news. Thus, we include a proxy
for the tone of the information in the 10-K statement. We use the dictionary created
by Loughran and Macdonald (2011) to determine whether a word is good news, bad
news, or no news.
3.4.2 Does Equity Volatility Change?
Table 5 shows the difference-in-difference regression results. In the first column
we find that total risk increases significantly for treated firms relative to control firms.
The coefficient on afterlaw * treated dummy is 0.049, significant at the 5% level,
indicating that total annualized equity volatility increased by 4.9% for treated firms
relative to control firms. The regression also shows that firms with higher leverage
display higher equity volatility. Under the assumption of constant firm risk, an
increase in leverage is predicted to increase equity risk. Firms with higher ROA,
higher lagged ROA, and higher stock returns display a lower volatility consistent with
the previously documented negative correlation between returns and volatility (e.g.,
Brandt and Kang, 2004). The positive and significant coefficient on lagged volatility
is consistent with an ARCH type process. Firms which increase the information in
the 10-K display an increase in volatility, while those which use more positive words
in their 10-K have a lower volatility. Finally, larger and older firms display a lower
volatility.
21
In column 2 (3) we report the systematic (idiosyncratic) volatility regression
using the value-weighted CRSP index as the market return. We find that treated firms
do not significantly change the systematic risk component compared to the control
firms from before to after the listing rule change . However, idiosyncratic volatility for
treated firms increases significantly as reported in column 3. The same inferences can
be drawn from using the equally-weighted CRSP index as the market return, as shown
in columns 4 and 5. Column 6 reports a regression using the idiosyncratic volatility
from a four factor model. Consistent with the one factor model, we find that
idiosyncratic risk has increased significantly for treated firms.
To the extent that diversified shareholders do not benefit from a reduction in
idiosyncratic risk (at least as much as the undiversified CEO does ), the findings are
consistent with the monitoring role of the newly independent board in their risk
management function. H owever, hedging idiosyncratic risk could theoretically be in
the interest of shareholders as long as frictions such as bankruptcy costs and
asymmetric information costs are sufficiently high. Thus, in the following section we
test whether the reduction in financial hedging is driven by better monitoring (H2) or
by a possible lack of knowledge by the newly independent board (H4).
4. Agency Problems versus Lack of Knowledge
In order to distinguish between H2 and H4, we test first whether financial
expertise, as a proxy for knowledge, affects hedging activity as predicted by H4. To
test H2, we ask whether firms with more agency problems prior to the exogenous
shock experience a bigger drop in hedging. Then we will investigate the shareholder
wealth changes around the introduction of the rule change.
4.1 Financial Expertise
The forth hypothesis assumes that the newly independent board might lack
knowledge to hedge in a value maximizing way. We investigate whether adding
financial experts to the board affects financial hedging.
4.1.1 Methodology
Here we test whether financial experts on the board affect financial hedging.
The problem with such a test is that firms choose director characteristics
endogenously. To alleviate this endogeneity issue we use a new requirement imposed
22
by SOX on firms’ boards, namely that the accounting committee of the board needs to
have a financial expert as a member of the (fully independent) committee. We classify
firms as treated firms if they did not have a financial expert according to the definition
of SOX among their independent board members in 200217. The other firms are used
as control firms. Eighty firms are classified as treated, 811 firms as control firms. We
use the same regression (1) but add the afterlaw * financial expert treatment dummy
which is equal to one for the period after 2003 if the firm did not have a financial
expert on the audit committee in 2002.
4.1.2 Results
Results are shown in Table 6. Across all the specifications shown, we find no
significant changes in financial hedging for treated firms which had to add a financial
expert as an independent board member. However, the board independence treatment
remains significant in all specifications. Interestingly, the correlation between the two
treatment effects is only about 9% suggesting that the two effects are different. Thus,
even if we only include the financial expert treatment dummy, we find no significant
treatment effect using all different hedging variables (not tabulated). In column 8 we
report an industry-year fixed effect logit regression where the dependent variable is
equal to one if the firm-year had an above sample HPS measure. Since we have no
firm fixed effect, we add a dummy equal to one in all sample years if the firm was
treated (financial expert treatment dummy). Interestingly, the negative coefficient on
the financial expert treatment dummy indicates that treated firms which were required
to add a financial expert, have used less financial hedging throughout the sample
period. However, we find no significant coefficient on the afterlaw * financial expert
treatment dummy suggesting that imposing a financial expert on the audit committee
of the board has not significantly altered those firms’ extent of financial hedging.
To the extent that H4 predicts a significant change in financial hedging due to
director knowledge, the above analysis suggests that knowledge is not the primary
driver of the observed dr op in financial hedging by firms required to get a majority
independent board. However, it does not exclude that adding new independent
directors, endogenously chosen to be ‘without’ financial expertise, causes a cut in
valuable hedging activity due to a lack of knowledge. To sharpen the test, we create a 17 We follow the methodology of Kim et al (2012) in implementing the SEC’s definition of financial expert .
23
triple interaction term between the afterlaw * treated dummy and the financial expert
treatment dummy. The fraction of firms falling into this category is relatively small
with only 4% of the firms that do not comply with both requirements. The hypothesis
is that if independent directors, which need to be added, lack the knowledge and thus
cut back on hedging, then the afterlaw * treated dummy should have a negative
coefficient while the triple interaction with the financial expert treatment should be
positive and significant. Finding that the coefficient on the triple interaction is
insignificant or even negative would be consistent with the interpretation that the lack
of knowledge of independent directors is unlikely to explain the reason for cutting
financial hedging.
In Table 7 we find that all triple interaction terms are insignificant, some with a
negative coefficient and some with a positive coefficient while the coefficients on the
afterlaw * treated dummy are still negative and at least marginally significant. Note
that the few observations we have in each of the interaction variables weakens this
test. Nonetheless, the findings are consistent with the interpretation that the lack of
knowledge of newly appointed board members is rather unlikely to explain why firms
did cut their financial hedging.
The finding that adding a financial expert is not related to a change in financial
risk management is somewhat unexpected given the findings in Cunat and Garicano
(2010) as well as Minton et al (2012). While the former finds that Spanish banks
having board members with financial expertise are performing better during the recent
financial crisis thanks to better loans performance, Minton et al (2012) find that U.S.
financial institutions perform worse during the crisis if they had more financial
experts on the board. Our analysis, using an exogenous shock to the financial
expertise of the board of non-financial firms, suggests no significant impact of adding
a financial expert on changes in financial hedging. However, we do find in columns 8
of Tables 5 and 6 that without firm fixed effects there is evidence of a significant
difference in the average level of hedging (over the entire sample period) between
firms that did not have a financial expert on the audit committee in 2002 and those
that did. This suggests that board expertise and the level of hedging might be
simultaneously determined. Such reverse causality issues might explain some of the
differences in the conclusions between Cunat and Garicano (2010) and Minton et al
(2012).
24
4.2 Agency Problems
Hypothesis 2 assumes that the reduction in hedging is due to the monitoring by
the newly majority independent board. Such a board would cut back on excessive
hedging by management. We expect that cutbacks in financial hedging due to
monitoring by the board are more likely in firms with higher agency problems.
4.2.1 CEO Ownership Levels
CEOs with high equity ownership in the firm are more exposed to idiosyncratic
risk which affects their utility but not the utility of a diversified shareholder. Knopf,
Nam, Thornton (2002) find that high CEO equity ownership is associated with more
hedging. Similarly, Graham and Rogers (2002) find CEOs with a higher delta of
ownership hedge more using financial derivatives. We split the sample into high
versus low CEO equity ownership based on the CEOs stock ownership in his/her
company in 2002 relative to the median CEO stock ownership in our sample . We use
equation (1) and interact the afterlaw * treated dummy with a high and a low equity
ownership dummy. Note again that the high and low equity ownership dummies are
not included separately in the regression since they are subsumed in the firm fixed
effect. In Table 8 we show regressions using the different hedging variables. We find
the reduction in financial hedging to be concentrated among high CEO equity
ownership firms, consistent with the interpretation that agency costs have led firms to
hedge too much and the new, majority independent board is monitoring risk
management. An F-test asking whether the two interaction coefficients are different
from each other is significant in five out of the nine specifications.
A potential concern with our conclusion is based on Klein’s (2002) finding that
higher CEO ownership is weakly associated with higher earnings management. If
such managers used hedge accounting and financial derivatives to manage earnings,
our findings might indicate that an independent board cuts back on earning
management rather than reducing risk management. However, such an interpretation
is inconsistent with Klein (2002) and Chen, Cheng, and Wang (2011) that find no
association between board independence and earnings management. In untabulated
tests we replace the proxies for risk management with proxies for earnings
management developed by Stubbern (2010), Jones (1991) and Kotharie et at (2005)
and find no significant coefficients on either the afterlaw * treated dummy nor on the
afterlaw * treated dummy * high (low) CEO ownership dummy.
25
4.2.2 Lucky Option Grants
Another way to separate firms into higher versus lower entrenchment is to split
the sample by firms which have granted backdated options to board members. Firms
are considered to have given board members backdated option using the lucky grant
definition of Bebchuk, Grinstein, and Peyer (2010). A lucky option grant to an
independent board member is an option grant awarded on the day with the lowest
stock price of the calendar month. Bebchuk et al (2010) show that even grants to
independent directors display an abnormally high frequency on the lowest stock price
day of the month. We interact the afterlaw * treated dummy with a backdating
dummy and a no-backdating dummy. The backdating dummy is equal to one if a firm
has given a lucky grant to independent directors in any of the years between 1998 and
2002, and zero otherwise. In Table 9 we show the coefficients of these regressions.
We find that reductions in financial hedging are more likely among firms where
directors did get backdated (lucky) options. Note, however, that the coefficients on
the interaction variable afterlaw * treated dummy * backdate are statistically
insignificant in columns 6 (IR Hedge variable) and 8 (no firm fixed effects). Again,
three of the ten F-tests between the two coefficients are showing statistical
significance.
The tests are consistent with H2 in that the newly independent board cut s back
on financial hedging activities where more agency problems existed. These findings
contribute to Kumar and Rabinovitch (2012) who find that firms with higher CEO
entrenchment display a higher likelihood of hedging.
4.2.3 Hedging Need
Industries vary in their use of financial hedging. As we have shown in Table 1
the fraction of firms per Fama-French 10 industry classification that reports hedge
accounting as of 2002 is between 4% and 26%. According to H2, we expect firms to
have hedged too much due to agency problems which the board did tolerate. The
newly majority independent board, however, seems to cut back on such excessive
hedging according to the tests above. If agency problems are the root cause for
previous excessive hedging, we expect under H2 that firms in industries with a lower
hedging propensity would see their hedging reduced more. The model we have in
mind is one where the utility of the manager increases with a decrease in idiosyncratic
26
risk. Industries where hedging is done extensively anyways because it is good for
shareholder value will likely see less excessive hedging compared to industries where
hedging is uncommon and likely not in the interest of shareholders. Note that H4, the
knowledge hypothesis, predicts either no difference between high and low hedging
need industries or larger cuts in the high hedging need industries assuming that in
high hedging need industries financial knowledge is more important to manage risk.
Table 10 shows regressions where we interact afterlaw * treated dummy with a high
hedging need industry dummy and a low hedging need industry dummy. High
hedging need industries are those where the fraction of firms hedging is above the
median in 2002. Hedging industries are defined using the ten Fama-French industries
classification, while the regression includes industry-year fixed effects where the
industries are defined using the 48 Fama-French industries classification.
We find that the reduction in financial hedging is concentrated among low
hedging need industries. The drop is more significant in low hedging need industries
because the level of hedging is, per construction, lower to start with. In the first
column where the dependent variable is CFHedge , we find a coefficient of -0.036 for
the low hedging need industries, in which the absolute value of cash flow hedging is
0.12. This coefficient implies a reduction in hedging of 30% (-0.036/0.12). The
coefficient on the high hedging industry interaction is an insignificant -0.020.
Furthermore, in high hedging need industries, the average absolute value of cash flow
hedging is 0.18% implying a reduction of only 11% (-0.02/0.18). The coefficients in
the third column where the dependent variable is HPS are -0.029 (low need) and -
0.025 (high need). This implies a reduction in hedging by 12% (-0.029/0.24) in low
hedging need industries, and 8% (-0.025/0.32) in high hedging need industries. These
findings are consistent with the interpretation that the board now monitors better and
cuts excessive hedging especially where the need for hedging seems lower. Further
support comes from the risk policy variable in Tables 8-10 where we find that the
word count related to risk policy increases marginally significantly in the subsamples
classified as having higher agency problems while the change is not significant in the
other subsamples.
5. Event Study
The evidence thus far is consistent with the interpretation that treated firms
reduce financial hedging, especially if there are agency problems. Implicitly this
27
suggests that shareholders are made better off by the governance change. However,
we lack more direct evidence of the impact of the changes in hedging on shareholder
value. Thus, to differentiate further between the two hypotheses, we study the impact
of the treatment on shareholder value conditional on a firm’s financial hedging.
Cutting back on hedging when hedging was excessive due to agency problems
predicts that equity value should increase. Cutting back on optimal hedging programs
due to a lack of knowledge would predict a loss in shareholder value.
We test the impact of hedging on shareholder value following the methodology
of Chha ochharia and Grinstein (2007). They measure shareholder returns over the
period from November 2001 to October 200218, the period of SOX deliberation. We
use a slightly different time window to better match the listing rule changes time
period (for a time line, see Chhaochharia and Grinstein, 2007). The SEC first asked
the NYSE and NASDAQ to design new listing rules on 2/13/2002. NASDAQ
submitted its second round proposal for approval by the SEC on 10/9/2002. The SEC
did finally approve both exchanges’ listing rule changes on 11/3/2003. We show
event study tests using the window: February, 1, 2002 – November, 4, 2003. We use
this period to ask whether treated firms with financial hedging in 2002 outperform
treated firms without hedging in 200219. In order to control for simultaneous effects
that affect all hedging versus non-hedging firms, we subtract from this difference the
difference between control firms with hedging in 2002 and control firms without
hedging in 2002. We classify firms as hedgers if the ratio of CLMZ (HPS) words to
total words in the 10-K is above the sample median in 2002, or alternatively if the
firm reports cash flow hedges. The remaining firms are classified as non-hedgers.20
Since we only have one event window, we follow Schwert (1981), Campbell,
Lo, and MacKinlay (1997), Greenstone, Oyer and Vissing-Jorgensen (2006), and
Chhaochharia and Grinstein (2007), in address ing the problem of clustering by
grouping firms into portfolios.
18 Enron filed earnings restatements in November 2001 (bankruptcy 12/2/01). In October 2002, NASDAQ submitted its rule changes to the SEC. The period includes the signing of SOX (8/2002). 19 Inferences are unaffected whether we define hedgers based on fiscal year end 2001 or 2002 (not tabulated). 20 We do not show results where we split the sample using net notional-to-asset as a proxy for hedging because that sample of firms does not contain non-hedgers, by construction. However, splitting the sample among those hedgers, we find that treated firms with more hedging experience a higher abnormal return, but the return differences are generally insignificant with p-values around 0.2.
28
In a first test, we compute the difference in the following portfolio (PF) returns
each day:
Abnormal return = (PF[treated firm, hedging] – PF[treated firm, non-hedging]) (2)
– (PF[control firm, hedging] – PF[control firm, non-hedging]).
This mirrors the difference -in-difference methodology. We report the average
daily abnormal difference-in-difference abnormal returns in Table 11, panel A. The
standard errors and t-statistics are based on the time series variation of daily abnormal
returns. For each of the four portfolios used in the difference-in-difference estimate,
we estimate the abnormal return for each stock, each day as
ARi,t = Ri,t – E(Ri,t), (3)
where E(Ri,t) is based on either the market model, the Fama-French three factor
model, or a Fama-French-Carhart four factor model. The parameters of the factor
models are estimated using 252 days outside the event window and are held constant
during the event window.
Alternatively, we compute the abnormal return based on raw portfolio returns
according to equation 2. We weigh each observation by the inverse of the number of
stocks in the respective portfolio. This assures that the alpha of the long-short
portfolio is not affected by the risk-free rate. The intercept of these regressions
provide an estimate of the average daily abnormal return and its significance. We
report one, three, and four factor model results.
In panel A of Table 11, the difference-in-difference average daily abnormal
returns are all positive and most are statistically significant. We also report the event
window cumulative abnormal return by multiplying the average daily abnormal return
by 444. Using the market model, we find treated hedgers outperform cumulatively by
5.8% (CLMZ), 6.4% (HPS), and 3.5% (CFHedge), compared to treated non-hedgers
and the difference between hedgers and non-hedgers of the control firms. 21 The p-
value of the daily abnormal returns are 0.01, 0.00, and 0.09, respectively.
21 Note that these CAR estimates are not due to the board independence treatment, they are the additional return treated hedging firms get over non-hedgers. Chhaochharia and Grinstein (2007) find that the board independence treatment adds to shareholder value between 4% and 14% depending on the factor model used.
29
Cumulative abnormal return estimates using the three- or four factor models are
similar. However, the three- and four-factor model abnormal returns for the CFHedge
proxy are not statistically significant anymore.
In panel B of Table 11 we show the results of the one , three- and four -factor
regression results. Using the market model, the estimated cumulative abnormal
returns over the event period are 5.1% (CLMZ), 4.9% (HPS), 3.8% (CFHedge),
significant at the 5%, 5%, and 10% level, respectively. Again, using three- or four-
factor models, we find similar results, with only the abnormal returns in the three- and
four-factor models being insignificant when using the CFHedge proxy.
We interpret these positive and statistically mostly significant abnormal stock
returns as being inconsistent with H4. Thus, it is unlikely that the reduction in hedging
is predominantly due to a lack of knowledge as such a reduction in hedging would
have to be value reducing as well.
It is interesting to compare the economic magnitudes of our abnormal returns
(between 2.5% and 6.4%) to the average value premium of currency hedgers
estimated by Allayannis and Weston (2001) of 5%. Our findings suggest that the 5%
hedging value premium might be a downward biased estimate because some hedging
firms are not optimally hedging dragging down the average.
6. Conclusion
We provide some of the first evidence that suggests firms do not hedge
optimally. Agency problems led treated firms to hedge too much, and the newly
independent board, through better monitoring, reduced financial hedging which in
turn increased shareholder value.
Our findings add to Knopf, Nam, and Thornton (2002), Graham and Rogers
(2002), and Kumar and Rabinovitch (2012) by suggesting that the higher level of
hedging in firms with high CEO equity exposure is potentially value reducing.
Furthermore, the inferences from our analyses support the notion behind the SEC’s
2010 reporting requirement change about the role of the board in risk management.
We find that board governance significantly affects financial risk management in our
setting by better monitoring and cutting back on hedges that reduce idiosyncratic risk
to the benefit of CEOs, but at the expense of shareholders.
In addition, our finding that idiosyncratic volatility increases as a consequence
of the listing rule changes mandating majority independent boards adds to our

30
understanding of the determinants of volatility. Schwert (1989) shows that risk varies
through time and cannot only be explained by macroeconomic shocks. Bartram,
Brown and Stulz (2012) list five reasons why volatility is higher in the U.S. than in
other countries. Among the reasons is the quality of corporate governance (e.g.,
Ferreira and Laux, 2007). Our paper adds to this literature by using an exogenous
governance shock that had a significant effect on total and idiosyncratic volatility.
31
References
Allayannis, G., and J.W., Weston, 2001, The use of foreign currency derivatives and firm market value, The Review of Financial Studies 14 (1): 243-276.
Angrist, J. D., and J. Pischke, 2008, Mostly harmless econometrics: An empiricist’s
companion. Princeton University Press. 392p. Bartram, Söhnke M. , Gregory W. Brown, and Jennifer Conrad (2011). The Effects of
Derivatives on Firm Risk and Value. Journal of Financial and Quantitative Analysis 46, pp 967-999.
Bartram, S. M., Brown, G. and Stulz, R. M. (2012), Why Are U.S. Stocks More
Volatile?, The Journal of Finance 67: 1329–1370. Bebchuk, L. A., Grinstein, Y. and Peyer, U. (2010), Lucky CEOs and Lucky
Directors, The Journal of Finance 65: 2363–2401. Bodnar, Gordon M., Graham, John R., Harve y, Campbell R. and Marston, Richard C.,
2011, Managing Risk Management, Working Paper. Bollerslev, Tim, 1986, Generalized autoregressive conditional heteroskedasticity,
Journal of Econometrics 31, 307-327. Brandt, Michael W. and Qiang Kang, 2004, On the relationship between the
conditional mean and volatility of stock returns: A latent VAR approach, Journal of Financial Economics 72, 217–257.
Breeden, D., & Viswanathan, S. (1998). Why do firms hedge? An asymmetric
information model. Working Paper, Fuqua School of Business, Duke University. Campello, M., L in, C., Ma, Y. and Zou, H. (2011), The Real and Financial
Implications of Corporate Hedging. The Journal of Finance 66: 1615–1647. Campbell, John Leslie, 2009, The fair value of cash flow hedges, future profitability
and stock returns, Working Paper. Campbell, John Y., Andrew W. Lo, and A. Craig MacKinlay, 1997, The
Econometrics of Financial Markets (Princeton University Press, Princeton, NJ). Chen, X., Q., Cheng, and X., Wang, 2011, Does increased board independence reduce
earnings management? Evidence from recent regulatory reforms. Working paper.
Chhaochharia, V. and Grinstein , Y., 2007, Corporate Governance and Firm Value:
The Impact of the 2002 Governance Rules. The Journal of Finance 62, 1789–1825.
Chhaochharia, Vidhi, and Yaniv Grinstein , 2009, CEO compensation and board
structure, The Journal of Finance 64, 231–261.
32
Comiskey, Eugene E. and Mulford , Charles W., 2009, The Non-Designation of Derivatives as Hedges for Accounting Purposes, Journal of Applied Research in Accounting and Finance 3, p.3.
Cunat, and Garicano, 2010, “Did Good Cajas Extend Bad Loans? Governance, Human Capital and Loan Portfolios. - The Crisis of the Spanish Economy: Economic Analysis of the Great Recession. (Samuel Bentolila, Michele Boldrin, Javier Diaz-Gimenez and Juan J. Dolado eds) Fedea 2010.
De Marzo, P. and D. Duffie, 1991, Corporate Financial Hedging with Proprietary
Information, Journal of Economic Theory 53, 261-286, Engle, Robert F., 1982, Autoregressive Conditional Heteroscedasticity with Estimates
of the Variance of United Kingdom Inflation, Econometrica 50, 987-1007.
Ellul, Andrew, and Yerramilli, Vijay, 2012, Stronger Risk Controls, Lower Risk: Evidence from U.S. Bank Holding Companies, The Journal of Finance, forthcoming.
Ferreira , Miguel A., and Paul A. Laux, 2007, Corporate Governance, Idiosyncratic
Risk, and Information Flow, The Journal of Finance 62, 951-990. Froot, Kenneth A., David S. Scharfstein, and Jeremy C. Stein, 1993, R isk
Management: Coordinating Corporate Investment and Financing Policies, The Journal of Finance 48, 1629-1658.
Geczy, Christopher, Bernadette A. Milton and Catherine Schrand, 1997, Why firms
use currency derivatives, Journal of Finance 52, 1323-1354. Greenstone, Michael, Paul Oyer, and Annette Vissing-Jørgensen, 2006, Mandated
disclosure, stock returns, and the 1964 Securities Acts amendments, Quarterly Journal of Economics 121, 399-460.
Graham, John R., and Daniel A. Rogers, 2002, Do Firms Hedge in Response to Tax
Incentives?, Journal of Finance 57, 815-839. Guay, Wayne R., 1999, The impact of derivatives on firm risk: An empirical
examination of new derivative users, Journal of Accounting and Economics 26, 319-351.
Guay, W., and Kothari, S.P., 2003, How much do firms hedge with derivatives?,
Journal of Financial Economics 70,423-462. Guthrie, Katherine, Jan Sokolowsky and Kam-ming Wan, 2012, CEO compensation
and board structure revisited. The Journal of Finance 67, 1149-1168. Haushalter, David, 2000, Financing policy, basis risk, and corporate hedging:
Evidence from oil and gas producers, Journal of Finance 55, 107-152.
33
Loughran, T. and McDonald, B., 2011, When Is a Liability Not a Liability? Textual Analysis, Dictionaries, and 10-Ks, The Journal of Finance 66: 35–65.
Kim, Jae B., Benjamin Segal, Dan Segal and Yoonseok Za ng, 2012, The Triangular
Relationship Between Audit Committee Characteristics, Audit Inputs, and Financial Reporting Quality, SMU and INSEAD Working Paper .
Klein, April, 2002, Audit committee, board of director characteristics, and earnings
management, Journal of Accounting and Economics 33, 375-400. Knopf, John D., Jouahn Nam, and John H. Thornton Jr., 2002, The Volatility and
Price Sensitivities of Managerial Stock Option Portfolios and Corporate Hedging, The Journal of Finance, 57, 801-813.
Kumar, P, and Rabinovitch, R., (2012), "CEO Entrenchment and Corporate Hedging:
Evidence From the Oil and Gas Industry," Forthcoming: Journal of Financial and Quantitative Analysis.
Lins, Karl V., Servaes, Henri and Tamayo, Ane Miren, 2011, Does Fair Value
Reporting Affect Risk Management? International Survey Evidence, Financial Management, 525-551.
Minton, Bernadette A., Taillard, Jérôme and Williamson, Rohan G., 2012, Do
Independence and Financial Expertise of the Board Matter for Risk Taking and Performance? Fisher College of Business Working Paper No. 2010-03-014.
Morck, R., B. Yeung, and W. Yu. 2000. “The Information Content of Stock Markets:
Why Do Emerging Markets have Synchronous Stock Price Movements?” Journal of Financial Economics 58 (1–2): 215–60.
Morellec, M. and C. W. Smith, 2007, Agency Conflicts and Risk Management,
Review of Finance 11, 1-23. Rampini, A., A., Sufi, S., Vishwanathan, 2012, Dynamic risk management, Working
Paper. Rampini, A. and S., Vishwanathan, 2010, Collateral, risk management, and the
distribution of debt capacity, The Journal of Finance 65, 2293-2322. Schmid, Markus M., Sabato, Gabriele and Aebi, Vincent, 2011, Risk Management,
Corporate Governance, and Bank Performance in the Financial Crisis. Working Paper.
Schwert, William, 1981, Using financial data to measure effects of regulation, Journal
of Law and Economics 24, 121–158. Schwert, G William, 1989. " Why Does Stock Market Volatility Change over Time?,"
The Journal of Finance 44, 1115-53.
34
Smith, C. W. and R. M. Stulz, 1985, The determinants of firms’ hedging policies, Journal of Financial and Quantitative Analysis 20, 391-405.
Stein, Jeremy C., 1997, Internal Capital Markets and the Competition for Corporate
Resources, The Journal of Finance 52, 111-33. Stulz, Rene M., 1984, Optimal hedging policy, Journal of Financial and Quantitative
Analysis 19, 124-140. Stulz, Rene M., 1990, Managerial discretion and optimal financing policies, Journal
of Financial Economics 26, 3-27.
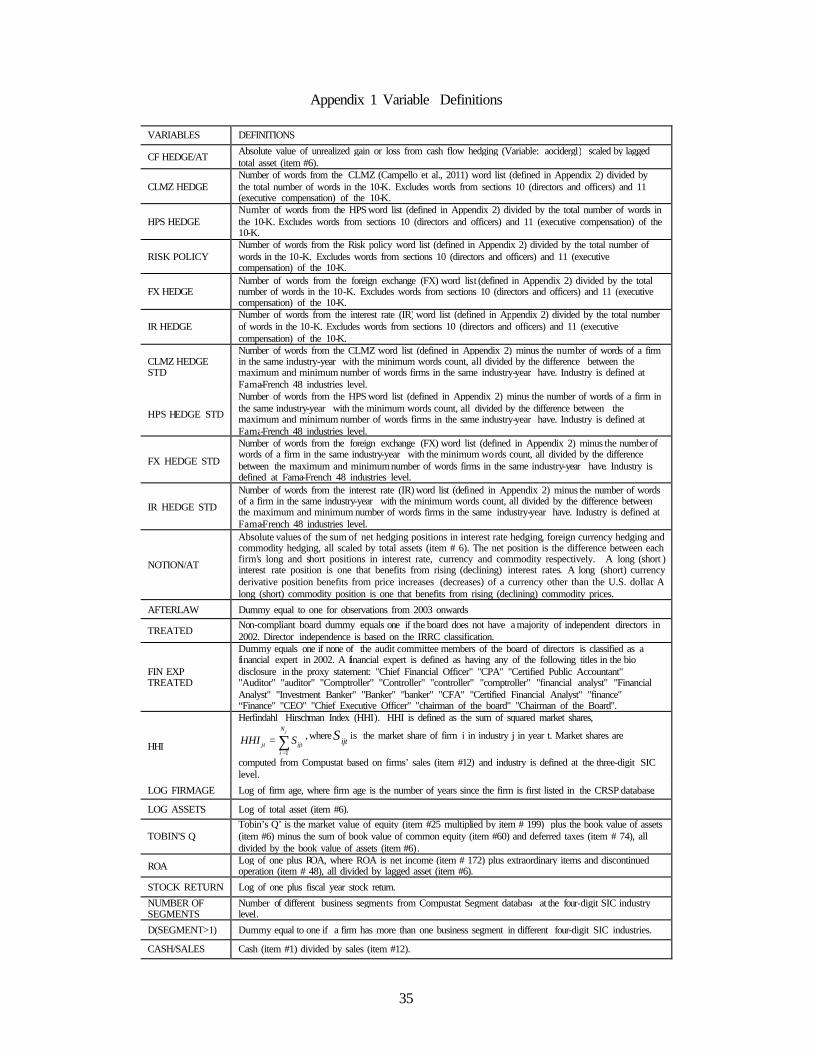
35
Appendix 1 Variable Definitions VARIABLES DEFINITIONS
CF HEDGE/AT Absolute value of unrealized gain or loss from cash flow hedging (Variable: aocidergl) scaled by lagged total asset (item #6).
CLMZ HEDGE Number of words from the CLMZ (Campello et al., 2011) word list (defined in Appendix 2) divided by the total number of words in the 10-K. Excludes words from sections 10 (directors and officers) and 11 (executive compensation) of the 10-K.
HPS HEDGE Number of words from the HPS word list (defined in Appendix 2) divided by the total number of words in the 10-K. Excludes words from sections 10 (directors and officers) and 11 (executive compensation) of the 10-K.
RISK POLICY Number of words from the Risk policy word list (defined in Appendix 2) divided by the total number of words in the 10-K. Excludes words from sections 10 (directors and officers) and 11 (executive compensation) of the 10-K.
FX HEDGE Number of words from the foreign exchange (FX) word list (defined in Appendix 2) divided by the total number of words in the 10-K. Excludes words from sections 10 (directors and officers) and 11 (executive compensation) of the 10-K.
IR HEDGE Number of words from the interest rate (IR) word list (defined in Appendix 2) divided by the total number of words in the 10-K. Excludes words from sections 10 (directors and officers) and 11 (executive compensation) of the 10-K.
CLMZ HEDGE STD
Number of words from the CLMZ word list (defined in Appendix 2) minus the number of words of a firm in the same industry-year with the minimum words count, all divided by the difference between the maximum and minimum number of words firms in the same industry-year have. Industry is defined at Fama-French 48 industries level.
HPS HEDGE STD
Number of words from the HPS word list (defined in Appendix 2) minus the number of words of a firm in the same industry-year with the minimum words count, all divided by the difference between the maximum and minimum number of words firms in the same industry-year have. Industry is defined at Fama-French 48 industries level.
FX HEDGE STD
Number of words from the foreign exchange (FX) word list (defined in Appendix 2) minus the number of words of a firm in the same industry-year with the minimum words count, all divided by the difference between the maximum and minimum number of words firms in the same industry-year have. Industry is defined at Fama-French 48 industries level.
IR HEDGE STD
Number of words from the interest rate (IR) word list (defined in Appendix 2) minus the number of words of a firm in the same industry-year with the minimum words count, all divided by the difference between the maximum and minimum number of words firms in the same industry-year have. Industry is defined at Fama-French 48 industries level.
NOTION/AT
Absolute values of the sum of net hedging positions in interest rate hedging, foreign currency hedging and commodity hedging, all scaled by total assets (item # 6). The net position is the difference between each firm's long and short positions in interest rate, currency and commodity respectively. A long (short ) interest rate position is one that benefits from rising (declining) interest rates. A long (short) currency derivative position benefits from price increases (decreases) of a currency other than the U.S. dollar. A long (short) commodity position is one that benefits from rising (declining) commodity prices.
AFTERLAW Dummy equal to one for observations from 2003 onwards
TREATED Non-compliant board dummy equals one if the board does not have a majority of independent directors in 2002. Director independence is based on the IRRC classification.
FIN EXP TREATED
Dummy equals one if none of the audit committee members of the board of directors is classified as a financial expert in 2002. A financial expert is defined as having any of the following titles in the bio disclosure in the proxy statement: "Chief Financial Officer" "CPA" "Certified Public Accountant" "Auditor" "auditor" "Comptroller" "Controller" "controller" "comptroller" "financial analyst" "Financial Analyst" "Investment Banker" "Banker" "banker" "CFA" "Certified Financial Analyst" "finance" “Finance" "CEO" "Chief Executive Officer" "chairman of the board" "Chairman of the Board".
HHI
Herfindahl Hirschman Index (HHI). HHI is defined as the sum of squared market shares,
1
jN
jt ijti
HHI S=
= ∑ , whereijtS is the market share of firm i in industry j in year t. Market shares are
computed from Compustat based on firms’ sales (item #12) and industry is defined at the three-digit SIC level.
LOG FIRMAGE Log of firm age, where firm age is the number of years since the firm is first listed in the CRSP database.
LOG ASSETS Log of total asset (item #6).
TOBIN'S Q Tobin’s Q’ is the market value of equity (item #25 multiplied by item # 199) plus the book value of assets (item #6) minus the sum of book value of common equity (item #60) and deferred taxes (item # 74), all divided by the book value of assets (item #6).
ROA Log of one plus ROA, where ROA is net income (item # 172) plus extraordinary items and discontinued operation (item # 48), all divided by lagged asset (item #6).
STOCK RETURN Log of one plus fiscal year stock return.
NUMBER OF SEGMENTS
Number of different business segments from Compustat Segment database at the four-digit SIC industry level.
D(SEGMENT>1) Dummy equal to one if a firm has more than one business segment in different four-digit SIC industries.
CASH/SALES Cash (item #1) divided by sales (item #12).
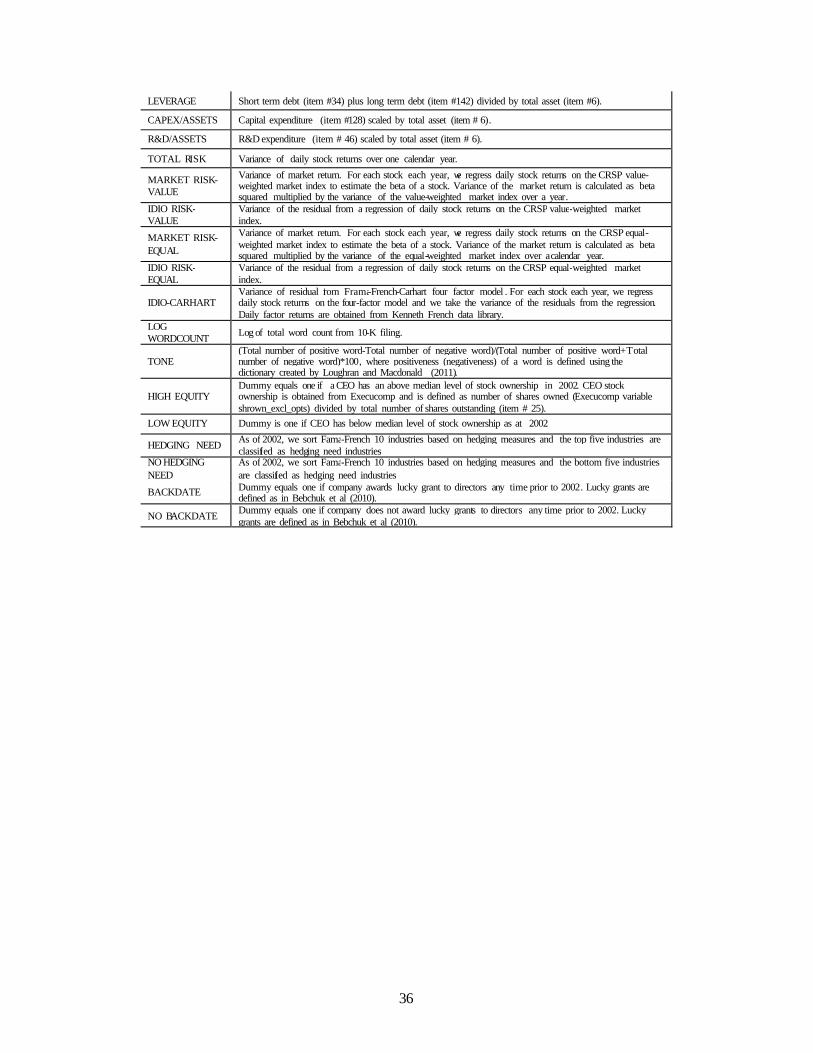
36
LEVERAGE Short term debt (item #34) plus long term debt (item #142) divided by total asset (item #6).
CAPEX/ASSETS Capital expenditure (item #128) scaled by total asset (item # 6).
R&D/ASSETS R&D expenditure (item # 46) scaled by total asset (item # 6).
TOTAL RISK Variance of daily stock returns over one calendar year.
MARKET RISK-VALUE
Variance of market return. For each stock each year, we regress daily stock returns on the CRSP value-weighted market index to estimate the beta of a stock. Variance of the market return is calculated as beta squared multiplied by the variance of the value-weighted market index over a year.
IDIO RISK-VALUE
Variance of the residual from a regression of daily stock returns on the CRSP value-weighted market index.
MARKET RISK-EQUAL
Variance of market return. For each stock each year, we regress daily stock returns on the CRSP equal-weighted market index to estimate the beta of a stock. Variance of the market return is calculated as beta squared multiplied by the variance of the equal-weighted market index over a calendar year.
IDIO RISK-EQUAL
Variance of the residual from a regression of daily stock returns on the CRSP equal-weighted market index.
IDIO-CARHART Variance of residual from Frama-French-Carhart four factor model . For each stock each year, we regress daily stock returns on the four-factor model and we take the variance of the residuals from the regression. Daily factor returns are obtained from Kenneth French data library.
LOG WORDCOUNT Log of total word count from 10-K filing.
TONE (Total number of positive word-Total number of negative word)/(Total number of positive word+Total number of negative word)*100, where positiveness (negativeness) of a word is defined using the dictionary created by Loughran and Macdonald (2011).
HIGH EQUITY Dummy equals one if a CEO has an above median level of stock ownership in 2002. CEO stock ownership is obtained from Execucomp and is defined as number of shares owned ( Execucomp variable shrown_excl_opts) divided by total number of shares outstanding (item # 25).
LOW EQUITY Dummy is one if CEO has below median level of stock ownership as at 2002
HEDGING NEED As of 2002, we sort Fama-French 10 industries based on hedging measures and the top five industries are classified as hedging need industries
NO HEDGING NEED
As of 2002, we sort Fama-French 10 industries based on hedging measures and the bottom five industries are classified as hedging need industries
BACKDATE Dummy equals one if company awards lucky grant to directors any time prior to 2002. Lucky grants are defined as in Bebchuk et al (2010).
NO BACKDATE Dummy equals one if company does not award lucky grants to directors any time prior to 2002. Lucky grants are defined as in Bebchuk et al (2010).

37
Appendix 2 Hedging Word Lists This appendix provides a list of hedging-related words we search in companies annual 10-K filings over our sample period.
HPS Hedging Word List CLMZ Hedging Word List American style derivative cash flow hedg hedg cashflow hedg financial instrument commodity price risk swap credit exposure market risk credit risk expos derivative futures derivative portfolio forward contract derivative positions forward exchange derivatives option contract documented hedging strategy risk management effectiveness of hedg notional European style expos Risk Policy Word List fair value risk hedge accounting fair value hedg hedge accounting treatment financial derivative hedging program financial instrument hedging strategy forward risk management forward contract risk management policy forward exchange risk officer futures risk committee hedg risk management officer hedge effectiveness risk management committee hedging activities Risk Oversight hedging effectiveness risk oversight function insurance against risk oversight function of the Board interest rate risk risk management program manage credit risk enterprise risk management manage market risk enterprise risk management program market price risk market risk Foreign Exchange Hedging Word List notional foreign exchange forward offsetting position forward foreign exchange option contract foreign exchange rate forward Reduce volatility currency forward risk exposure currency rate forward straddle foreign exchange option swap currency option swap agreements oreign exchange rate option swaps currency rate option underlying markets foreign exchange future currency future foreign exchange rate future Interest Rate Hedging Word List currency rate future interest rate swap foreign exchange swap interest rate cap currency swap interest rate collar foreign exchange rate swap interest rate floor currency rate swap interest rate forward foreign exchange cap interest rate option currency cap interest rate future foreign exchange rate cap currency rate cap foreign exchange collar currency collar Foreign exchange rate collar currency rate collar Foreign exchange floor currency floor Foreign exchange rate floor currency rate floor
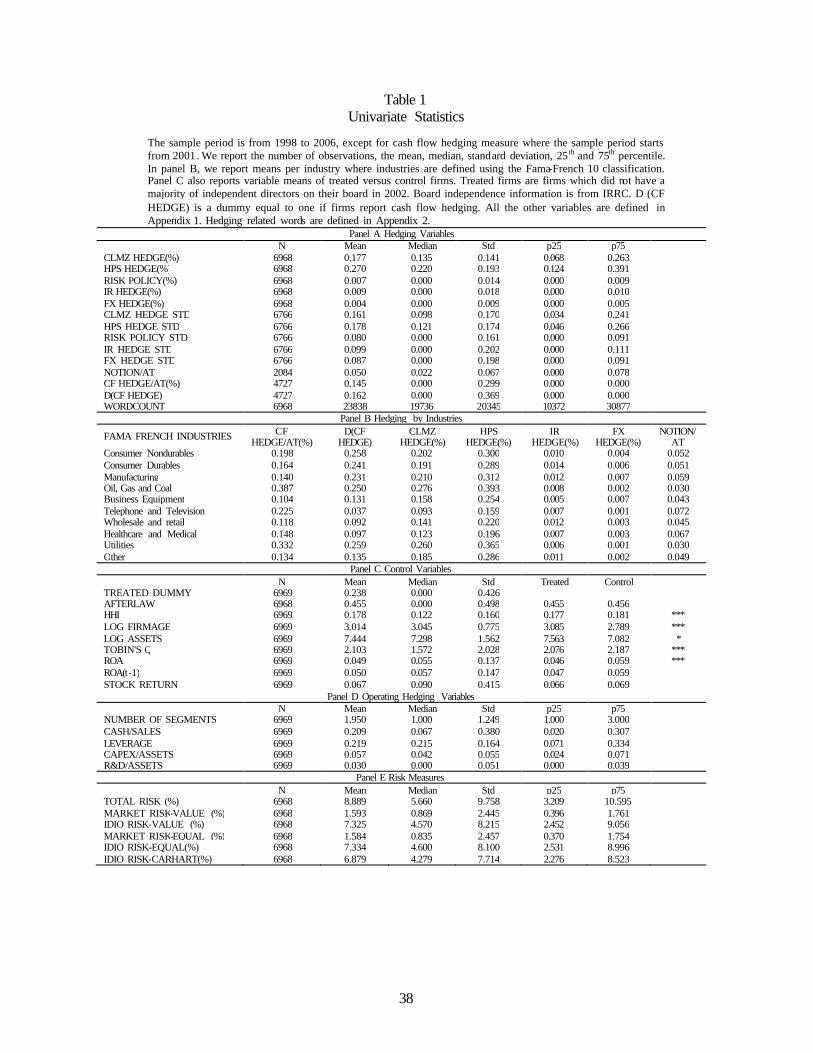
38
Table 1 Univariate Statistics
The sample period is from 1998 to 2006, except for cash flow hedging measure where the sample period starts from 2001. We report the number of observations, the mean, median, standard deviation, 25 th and 75th percentile. In panel B, we report means per industry where industries are defined using the Fama-French 10 classification. Panel C also reports variable means of treated versus control firms. Treated firms are firms which did not have a majority of independent directors on their board in 2002. Board independence information is from IRRC. D (CF HEDGE) is a dummy equal to one if firms report cash flow hedging. All the other variables are defined in Appendix 1. Hedging related words are defined in Appendix 2.
Panel A Hedging Variables
N Mean Median Std p25 p75 CLMZ HEDGE(%) 6968 0.177 0.135 0.141 0.068 0.263 HPS HEDGE(%) 6968 0.270 0.220 0.193 0.124 0.391 RISK POLICY(%) 6968 0.007 0.000 0.014 0.000 0.009 IR HEDGE(%) 6968 0.009 0.000 0.018 0.000 0.010 FX HEDGE(%) 6968 0.004 0.000 0.009 0.000 0.005 CLMZ HEDGE STD 6766 0.161 0.098 0.170 0.034 0.241 HPS HEDGE STD 6766 0.178 0.121 0.174 0.046 0.266 RISK POLICY STD 6766 0.080 0.000 0.161 0.000 0.091 IR HEDGE STD 6766 0.099 0.000 0.202 0.000 0.111 FX HEDGE STD 6766 0.087 0.000 0.198 0.000 0.091 NOTION/AT 2084 0.050 0.022 0.067 0.000 0.078 CF HEDGE/AT(%) 4727 0.145 0.000 0.299 0.000 0.000 D(CF HEDGE) 4727 0.162 0.000 0.369 0.000 0.000 WORDCOUNT 6968 23838 19736 20345 10372 30877 Panel B Hedging by Industries
FAMA FRENCH INDUSTRIES CF HEDGE/AT(%)
D(CF HEDGE)
CLMZ HEDGE(%)
HPS HEDGE(%)
IR HEDGE(%)
FX HEDGE(%)
NOTION/AT
Consumer Nondurables 0.198 0.258 0.202 0.300 0.010 0.004 0.052 Consumer Durables 0.164 0.241 0.191 0.289 0.014 0.006 0.051 Manufacturing 0.140 0.231 0.210 0.312 0.012 0.007 0.059 Oil, Gas and Coal 0.387 0.250 0.276 0.393 0.008 0.002 0.030 Business Equipment 0.104 0.131 0.158 0.254 0.005 0.007 0.043 Telephone and Television 0.225 0.037 0.093 0.159 0.007 0.001 0.072 Wholesale and retail 0.118 0.092 0.141 0.220 0.012 0.003 0.045 Healthcare and Medical 0.148 0.097 0.123 0.196 0.007 0.003 0.067 Utilities 0.332 0.259 0.260 0.365 0.006 0.001 0.030 Other 0.134 0.135 0.185 0.286 0.011 0.002 0.049
Panel C Control Variables
N Mean Median Std Treated Control TREATED DUMMY 6969 0.238 0.000 0.426 AFTERLAW 6968 0.455 0.000 0.498 0.455 0.456 HHI 6969 0.178 0.122 0.160 0.177 0.181 *** LOG FIRMAGE 6969 3.014 3.045 0.775 3.085 2.789 *** LOG ASSETS 6969 7.444 7.298 1.562 7.563 7.082 * TOBIN'S Q 6969 2.103 1.572 2.028 2.076 2.187 *** ROA 6969 0.049 0.055 0.137 0.046 0.059 *** ROA(t-1) 6969 0.050 0.057 0.147 0.047 0.059 STOCK RETURN 6969 0.067 0.090 0.415 0.066 0.069
Panel D Operating Hedging Variables
N Mean Median Std p25 p75 NUMBER OF SEGMENTS 6969 1.950 1.000 1.249 1.000 3.000 CASH/SALES 6969 0.209 0.067 0.380 0.020 0.307 LEVERAGE 6969 0.219 0.215 0.164 0.071 0.334 CAPEX/ASSETS 6969 0.057 0.042 0.055 0.024 0.071 R&D/ASSETS 6969 0.030 0.000 0.051 0.000 0.039 Panel E Risk Measures
N Mean Median Std p25 p75 TOTAL RISK (%) 6968 8.889 5.660 9.758 3.209 10.595 MARKET RISK-VALUE (%) 6968 1.593 0.869 2.445 0.396 1.761 IDIO RISK-VALUE (%) 6968 7.325 4.570 8.215 2.452 9.056 MARKET RISK-EQUAL (%) 6968 1.584 0.835 2.457 0.370 1.754 IDIO RISK-EQUAL(%) 6968 7.334 4.600 8.100 2.531 8.996 IDIO RISK-CARHART(%) 6968 6.879 4.279 7.714 2.276 8.523
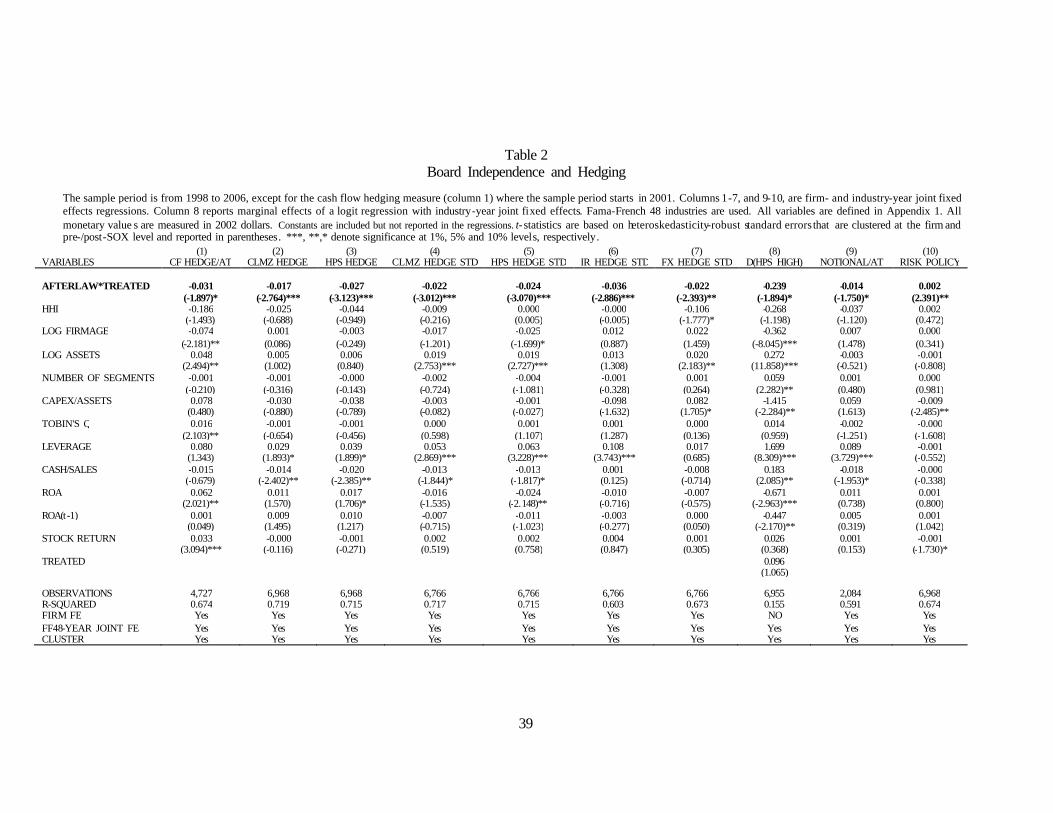
39
Table 2 Board Independence and Hedging
The sample period is from 1998 to 2006, except for the cash flow hedging measure (column 1) where the sample period starts in 2001. Columns 1-7, and 9-10, are firm- and industry-year joint fixed effects regressions. Column 8 reports marginal effects of a logit regression with industry-year joint fixed effects. Fama-French 48 industries are used. All variables are defined in Appendix 1. All monetary value s are measured in 2002 dollars. Constants are included but not reported in the regressions. t- statistics are based on heteroskedasticity-robust standard errors that are clustered at the firm and pre-/post-SOX level and reported in parentheses. ***, **,* denote significance at 1%, 5% and 10% levels, respectively.
(1) (2) (3) (4) (5) (6) (7) (8) (9) (10) VARIABLES CF HEDGE/AT CLMZ HEDGE HPS HEDGE CLMZ HEDGE STD HPS HEDGE STD IR HEDGE STD FX HEDGE STD D(HPS HIGH) NOTIONAL/AT RISK POLICY AFTERLAW*TREATED -0.031 -0.017 -0.027 -0.022 -0.024 -0.036 -0.022 -0.239 -0.014 0.002
(-1.897)* (-2.764)*** (-3.123)*** (-3.012)*** (-3.070)*** (-2.886)*** (-2.393)** (-1.894)* (-1.750)* (2.391)**
HHI -0.186 -0.025 -0.044 -0.009 0.000 -0.000 -0.106 -0.268 -0.037 0.002
(-1.493) (-0.688) (-0.949) (-0.216) (0.005) (-0.005) (-1.777)* (-1.198) (-1.120) (0.472)
LOG FIRMAGE -0.074 0.001 -0.003 -0.017 -0.025 0.012 0.022 -0.362 0.007 0.000
(-2.181)** (0.086) (-0.249) (-1.201) (-1.699)* (0.887) (1.459) (-8.045)*** (1.478) (0.341)
LOG ASSETS 0.048 0.005 0.006 0.019 0.019 0.013 0.020 0.272 -0.003 -0.001
(2.494)** (1.002) (0.840) (2.753)*** (2.727)*** (1.308) (2.183)** (11.858)*** (-0.521) (-0.808)
NUMBER OF SEGMENTS -0.001 -0.001 -0.000 -0.002 -0.004 -0.001 0.001 0.059 0.001 0.000 (-0.210) (-0.316) (-0.143) (-0.724) (-1.081) (-0.328) (0.264) (2.282)** (0.480) (0.981)
CAPEX/ASSETS 0.078 -0.030 -0.038 -0.003 -0.001 -0.098 0.082 -1.415 0.059 -0.009
(0.480) (-0.880) (-0.789) (-0.082) (-0.027) (-1.632) (1.705)* (-2.284)** (1.613) (-2.485)**
TOBIN'S Q 0.016 -0.001 -0.001 0.000 0.001 0.001 0.000 0.014 -0.002 -0.000 (2.103)** (-0.654) (-0.456) (0.598) (1.107) (1.287) (0.136) (0.959) (-1.251) (-1.608)
LEVERAGE 0.080 0.029 0.039 0.053 0.063 0.108 0.017 1.699 0.089 -0.001
(1.343) (1.893)* (1.899)* (2.869)*** (3.228)*** (3.743)*** (0.685) (8.309)*** (3.729)*** (-0.552)
CASH/SALES -0.015 -0.014 -0.020 -0.013 -0.013 0.001 -0.008 0.183 -0.018 -0.000 (-0.679) (-2.402)** (-2.385)** (-1.844)* (-1.817)* (0.125) (-0.714) (2.085)** (-1.953)* (-0.338)
ROA 0.062 0.011 0.017 -0.016 -0.024 -0.010 -0.007 -0.671 0.011 0.001
(2.021)** (1.570) (1.706)* (-1.535) (-2.148)** (-0.716) (-0.575) (-2.963)*** (0.738) (0.800)
ROA(t-1) 0.001 0.009 0.010 -0.007 -0.011 -0.003 0.000 -0.447 0.005 0.001 (0.049) (1.495) (1.217) (-0.715) (-1.023) (-0.277) (0.050) (-2.170)** (0.319) (1.042)
STOCK RETURN 0.033 -0.000 -0.001 0.002 0.002 0.004 0.001 0.026 0.001 -0.001
(3.094)*** (-0.116) (-0.271) (0.519) (0.758) (0.847) (0.305) (0.368) (0.153) (-1.730)*
TREATED
0.096 (1.065)
OBSERVATIONS 4,727 6,968 6,968 6,766 6,766 6,766 6,766 6,955 2,084 6,968 R-SQUARED 0.674 0.719 0.715 0.717 0.715 0.603 0.673 0.155 0.591 0.674 FIRM FE Yes Yes Yes Yes Yes Yes Yes NO Yes Yes FF48-YEAR JOINT FE Yes Yes Yes Yes Yes Yes Yes Yes Yes Yes CLUSTER Yes Yes Yes Yes Yes Yes Yes Yes Yes Yes
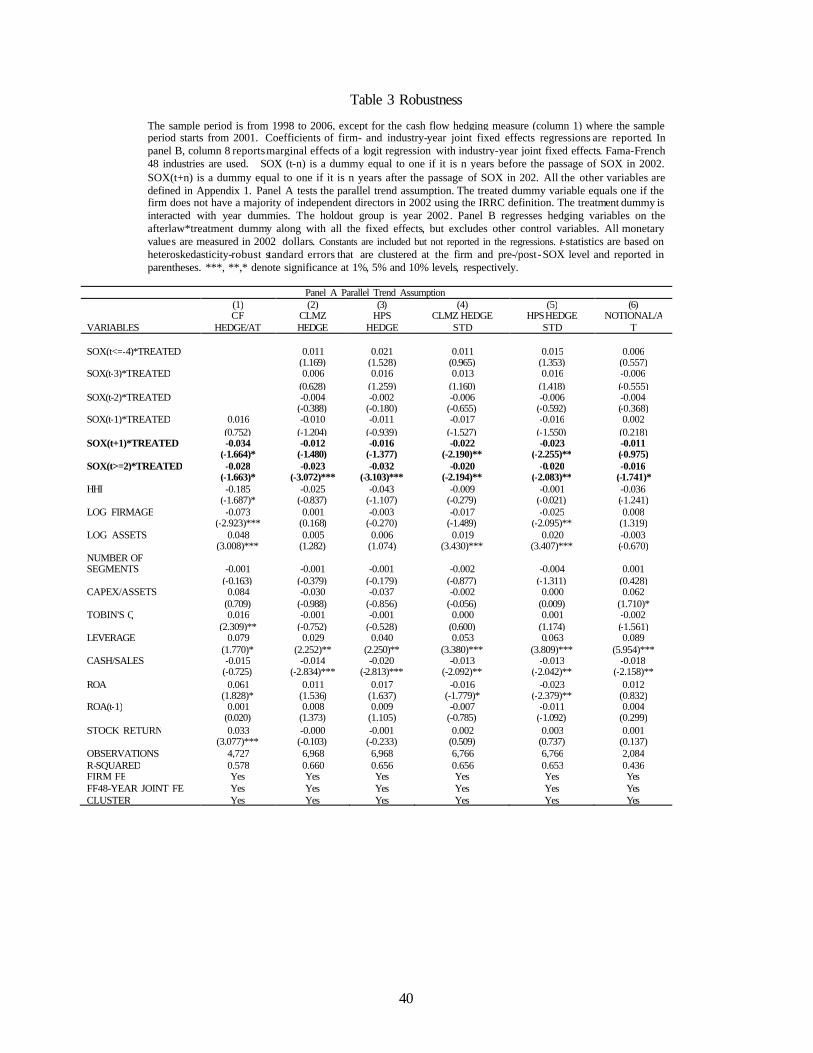
40
Table 3 Robustness The sample period is from 1998 to 2006, except for the cash flow hedging measure (column 1) where the sample period starts from 2001. Coefficients of firm- and industry-year joint fixed effects regressions are reported. In panel B, column 8 reports marginal effects of a logit regression with industry-year joint fixed effects. Fama-French 48 industries are used. SOX (t-n) is a dummy equal to one if it is n years before the passage of SOX in 2002. SOX(t+n) is a dummy equal to one if it is n years after the passage of SOX in 202. All the other variables are defined in Appendix 1. Panel A tests the parallel trend assumption. The treated dummy variable equals one if the firm does not have a majority of independent directors in 2002 using the IRRC definition. The treatment dummy is interacted with year dummies. The holdout group is year 2002. Panel B regresses hedging variables on the afterlaw*treatment dummy along with all the fixed effects, but excludes other control variables. All monetary values are measured in 2002 dollars. Constants are included but not reported in the regressions. t-statistics are based on heteroskedasticity-robust standard errors that are clustered at the firm and pre-/post-SOX level and reported in parentheses. ***, **,* denote significance at 1%, 5% and 10% levels, respectively.
Panel A Parallel Trend Assumption (1) (2) (3) (4) (5) (6)
VARIABLES CF
HEDGE/AT CLMZ HEDGE
HPS HEDGE
CLMZ HEDGE STD
HPS HEDGE STD
NOTIONAL/AT
SOX(t<=-4)*TREATED
0.011 0.021 0.011 0.015 0.006
(1.169) (1.528) (0.965) (1.353) (0.557)
SOX(t-3)*TREATED 0.006 0.016 0.013 0.016 -0.006 (0.628) (1.259) (1.160) (1.418) (-0.555)
SOX(t-2)*TREATED
-0.004 -0.002 -0.006 -0.006 -0.004
(-0.388) (-0.180) (-0.655) (-0.592) (-0.368)
SOX(t-1)*TREATED 0.016 -0.010 -0.011 -0.017 -0.016 0.002 (0.752) (-1.204) (-0.939) (-1.527) (-1.550) (0.218)
SOX(t+1)*TREATED -0.034 -0.012 -0.016 -0.022 -0.023 -0.011
(-1.664)* (-1.480) (-1.377) (-2.190)** (-2.255)** (-0.975)
SOX(t>=2)*TREATED -0.028 -0.023 -0.032 -0.020 -0.020 -0.016 (-1.663)* (-3.072)*** (-3.103)*** (-2.194)** (-2.083)** (-1.741)*
HHI -0.185 -0.025 -0.043 -0.009 -0.001 -0.036
(-1.687)* (-0.837) (-1.107) (-0.279) (-0.021) (-1.241)
LOG FIRMAGE -0.073 0.001 -0.003 -0.017 -0.025 0.008 (-2.923)*** (0.168) (-0.270) (-1.489) (-2.095)** (1.319)
LOG ASSETS 0.048 0.005 0.006 0.019 0.020 -0.003
(3.008)*** (1.282) (1.074) (3.430)*** (3.407)*** (-0.670)
NUMBER OF SEGMENTS -0.001 -0.001 -0.001 -0.002 -0.004 0.001
(-0.163) (-0.379) (-0.179) (-0.877) (-1.311) (0.428) CAPEX/ASSETS 0.084 -0.030 -0.037 -0.002 0.000 0.062
(0.709) (-0.988) (-0.856) (-0.056) (0.009) (1.710)*
TOBIN'S Q 0.016 -0.001 -0.001 0.000 0.001 -0.002 (2.309)** (-0.752) (-0.528) (0.600) (1.174) (-1.561)
LEVERAGE 0.079 0.029 0.040 0.053 0.063 0.089
(1.770)* (2.252)** (2.250)** (3.380)*** (3.809)*** (5.954)***
CASH/SALES -0.015 -0.014 -0.020 -0.013 -0.013 -0.018 (-0.725) (-2.834)*** (-2.813)*** (-2.092)** (-2.042)** (-2.158)**
ROA 0.061 0.011 0.017 -0.016 -0.023 0.012
(1.828)* (1.536) (1.637) (-1.779)* (-2.379)** (0.832)
ROA(t-1) 0.001 0.008 0.009 -0.007 -0.011 0.004 (0.020) (1.373) (1.105) (-0.785) (-1.092) (0.299)
STOCK RETURN 0.033 -0.000 -0.001 0.002 0.003 0.001
(3.077)*** (-0.103) (-0.233) (0.509) (0.737) (0.137)
OBSERVATIONS 4,727 6,968 6,968 6,766 6,766 2,084 R-SQUARED 0.578 0.660 0.656 0.656 0.653 0.436 FIRM FE Yes Yes Yes Yes Yes Yes FF48-YEAR JOINT FE Yes Yes Yes Yes Yes Yes CLUSTER Yes Yes Yes Yes Yes Yes
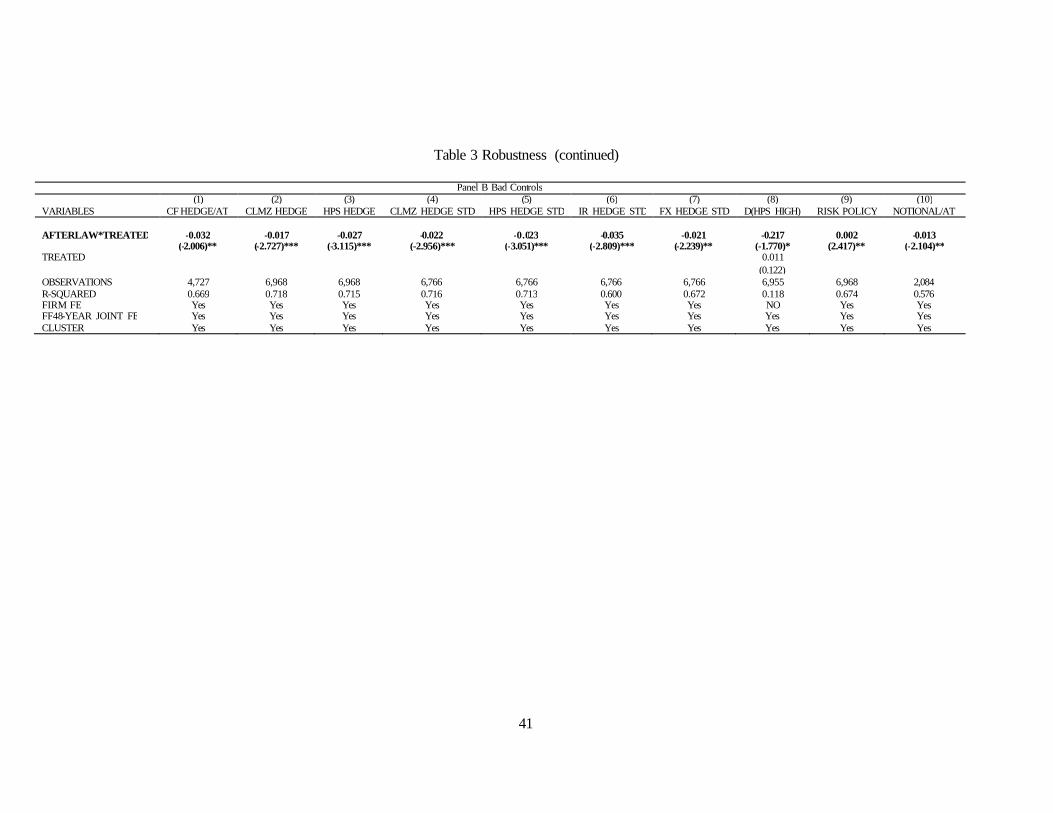
41
Table 3 Robustness (continued)
Panel B Bad Controls (1) (2) (3) (4) (5) (6) (7) (8) (9) (10) VARIABLES CF HEDGE/AT CLMZ HEDGE HPS HEDGE CLMZ HEDGE STD HPS HEDGE STD IR HEDGE STD FX HEDGE STD D(HPS HIGH) RISK POLICY NOTIONAL/AT
AFTERLAW*TREATED -0.032 -0.017 -0.027 -0.022 -0.023 -0.035 -0.021 -0.217 0.002 -0.013
(-2.006)** (-2.727)*** (-3.115)*** (-2.956)*** (-3.051)*** (-2.809)*** (-2.239)** (-1.770)* (2.417)** (-2.104)**
TREATED 0.011 (0.122)
OBSERVATIONS 4,727 6,968 6,968 6,766 6,766 6,766 6,766 6,955 6,968 2,084 R-SQUARED 0.669 0.718 0.715 0.716 0.713 0.600 0.672 0.118 0.674 0.576 FIRM FE Yes Yes Yes Yes Yes Yes Yes NO Yes Yes FF48-YEAR JOINT FE Yes Yes Yes Yes Yes Yes Yes Yes Yes Yes CLUSTER Yes Yes Yes Yes Yes Yes Yes Yes Yes Yes
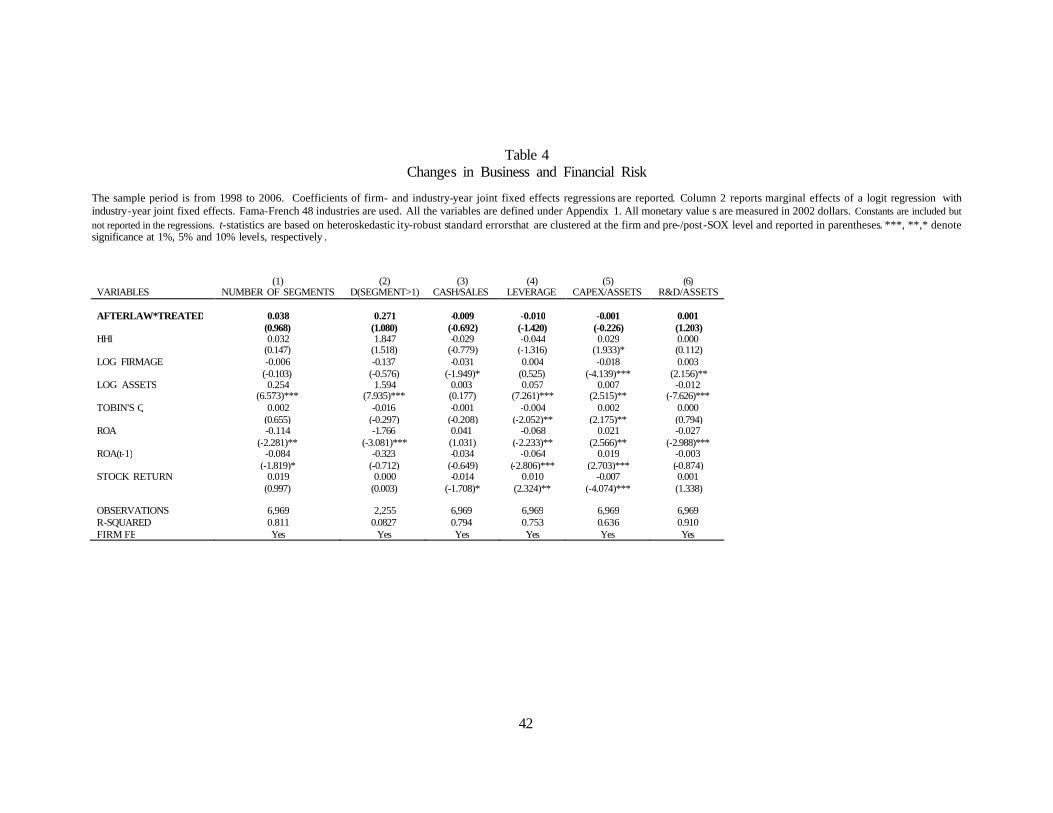
42
Table 4 Changes in Business and Financial Risk
The sample period is from 1998 to 2006. Coefficients of firm- and industry-year joint fixed effects regressions are reported. Column 2 reports marginal effects of a logit regression with industry-year joint fixed effects. Fama-French 48 industries are used. All the variables are defined under Appendix 1. All monetary value s are measured in 2002 dollars. Constants are included but not reported in the regressions. t-statistics are based on heteroskedastic ity-robust standard errors that are clustered at the firm and pre-/post-SOX level and reported in parentheses. ***, **,* denote significance at 1%, 5% and 10% levels, respectively . (1) (2) (3) (4) (5) (6) VARIABLES NUMBER OF SEGMENTS D(SEGMENT>1) CASH/SALES LEVERAGE CAPEX/ASSETS R&D/ASSETS AFTERLAW*TREATED 0.038 0.271 -0.009 -0.010 -0.001 0.001 (0.968) (1.080) (-0.692) (-1.420) (-0.226) (1.203) HHI 0.032 1.847 -0.029 -0.044 0.029 0.000 (0.147) (1.518) (-0.779) (-1.316) (1.933)* (0.112) LOG FIRMAGE -0.006 -0.137 -0.031 0.004 -0.018 0.003 (-0.103) (-0.576) (-1.949)* (0.525) (-4.139)*** (2.156)** LOG ASSETS 0.254 1.594 0.003 0.057 0.007 -0.012 (6.573)*** (7.935)*** (0.177) (7.261)*** (2.515)** (-7.626)*** TOBIN'S Q 0.002 -0.016 -0.001 -0.004 0.002 0.000 (0.655) (-0.297) (-0.208) (-2.052)** (2.175)** (0.794) ROA -0.114 -1.766 0.041 -0.068 0.021 -0.027 (-2.281)** (-3.081)*** (1.031) (-2.233)** (2.566)** (-2.988)*** ROA(t-1) -0.084 -0.323 -0.034 -0.064 0.019 -0.003 (-1.819)* (-0.712) (-0.649) (-2.806)*** (2.703)*** (-0.874) STOCK RETURN 0.019 0.000 -0.014 0.010 -0.007 0.001 (0.997) (0.003) (-1.708)* (2.324)** (-4.074)*** (1.338) OBSERVATIONS 6,969 2,255 6,969 6,969 6,969 6,969 R-SQUARED 0.811 0.0827 0.794 0.753 0.636 0.910 FIRM FE Yes Yes Yes Yes Yes Yes
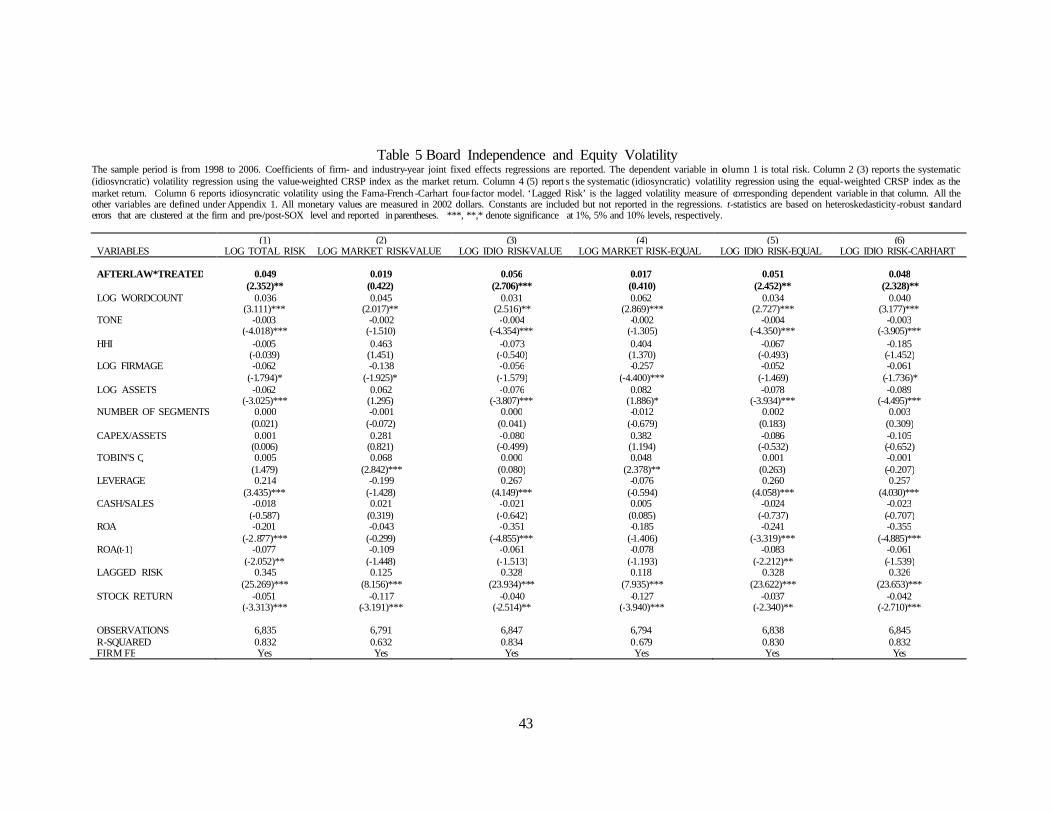
43
Table 5 Board Independence and Equity Volatility The sample period is from 1998 to 2006. Coefficients of firm- and industry-year joint fixed effects regressions are reported. The dependent variable in column 1 is total risk. Column 2 (3) reports the systematic (idiosyncratic) volatility regression using the value-weighted CRSP index as the market return. Column 4 (5) report s the systematic (idiosyncratic) volatility regression using the equal-weighted CRSP index as the market return. Column 6 reports idiosyncratic volatility using the Fama-French -Carhart four-factor model. ‘Lagged Risk’ is the lagged volatility measure of corresponding dependent variable in that column. All the other variables are defined under Appendix 1. All monetary values are measured in 2002 dollars. Constants are included but not reported in the regressions. t-statistics are based on heteroskedasticity-robust standard errors that are clustered at the firm and pre-/post-SOX level and reported in parentheses. ***, **,* denote significance at 1%, 5% and 10% levels, respectively. (1) (2) (3) (4) (5) (6) VARIABLES LOG TOTAL RISK LOG MARKET RISK-VALUE LOG IDIO RISK-VALUE LOG MARKET RISK-EQUAL LOG IDIO RISK-EQUAL LOG IDIO RISK-CARHART AFTERLAW*TREATED 0.049 0.019 0.056 0.017 0.051 0.048 (2.352)** (0.422) (2.706)*** (0.410) (2.452)** (2.328)** LOG WORDCOUNT 0.036 0.045 0.031 0.062 0.034 0.040 (3.111)*** (2.017)** (2.516)** (2.869)*** (2.727)*** (3.177)*** TONE -0.003 -0.002 -0.004 -0.002 -0.004 -0.003 (-4.018)*** (-1.510) (-4.354)*** (-1.305) (-4.350)*** (-3.905)*** HHI -0.005 0.463 -0.073 0.404 -0.067 -0.185 (-0.039) (1.451) (-0.540) (1.370) (-0.493) (-1.452) LOG FIRMAGE -0.062 -0.138 -0.056 -0.257 -0.052 -0.061 (-1.794)* (-1.925)* (-1.579) (-4.400)*** (-1.469) (-1.736)* LOG ASSETS -0.062 0.062 -0.076 0.082 -0.078 -0.089 (-3.025)*** (1.295) (-3.807)*** (1.886)* (-3.934)*** (-4.495)*** NUMBER OF SEGMENTS 0.000 -0.001 0.000 -0.012 0.002 0.003 (0.021) (-0.072) (0.041) (-0.679) (0.183) (0.309) CAPEX/ASSETS 0.001 0.281 -0.080 0.382 -0.086 -0.105 (0.006) (0.821) (-0.499) (1.194) (-0.532) (-0.652) TOBIN'S Q 0.005 0.068 0.000 0.048 0.001 -0.001 (1.479) (2.842)*** (0.080) (2.378)** (0.263) (-0.207) LEVERAGE 0.214 -0.199 0.267 -0.076 0.260 0.257 (3.435)*** (-1.428) (4.149)*** (-0.594) (4.058)*** (4.030)*** CASH/SALES -0.018 0.021 -0.021 0.005 -0.024 -0.023 (-0.587) (0.319) (-0.642) (0.085) (-0.737) (-0.707) ROA -0.201 -0.043 -0.351 -0.185 -0.241 -0.355 (-2.877)*** (-0.299) (-4.855)*** (-1.406) (-3.319)*** (-4.885)*** ROA(t-1) -0.077 -0.109 -0.061 -0.078 -0.083 -0.061 (-2.052)** (-1.448) (-1.513) (-1.193) (-2.212)** (-1.539) LAGGED RISK 0.345 0.125 0.328 0.118 0.328 0.326 (25.269)*** (8.156)*** (23.934)*** (7.935)*** (23.622)*** (23.653)*** STOCK RETURN -0.051 -0.117 -0.040 -0.127 -0.037 -0.042 (-3.313)*** (-3.191)*** (-2.514)** (-3.940)*** (-2.340)** (-2.710)*** OBSERVATIONS 6,835 6,791 6,847 6,794 6,838 6,845 R-SQUARED 0.832 0.632 0.834 0.679 0.830 0.832 FIRM FE Yes Yes Yes Yes Yes Yes
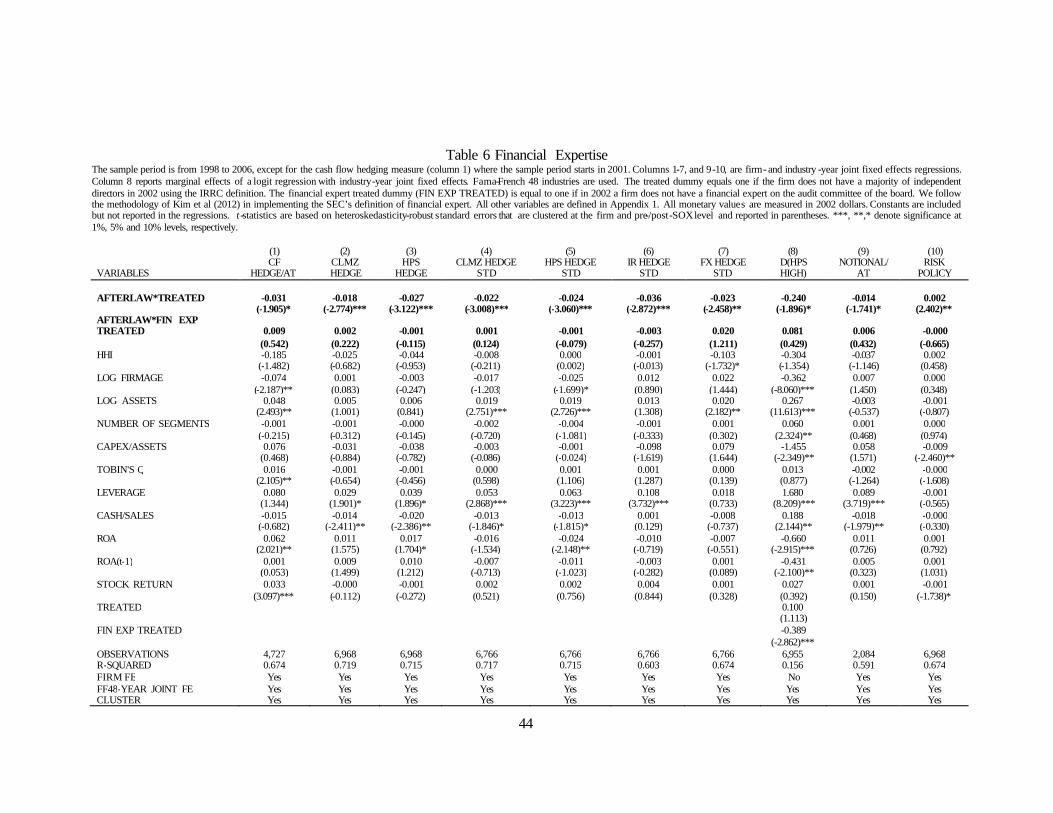
44
Table 6 Financial Expertise The sample period is from 1998 to 2006, except for the cash flow hedging measure (column 1) where the sample period starts in 2001. Columns 1-7, and 9-10, are firm- and industry -year joint fixed effects regressions. Column 8 reports marginal effects of a logit regression with industry-year joint fixed effects. Fama-French 48 industries are used. The treated dummy equals one if the firm does not have a majority of independent directors in 2002 using the IRRC definition. The financial expert treated dummy (FIN EXP TREATED) is equal to one if in 2002 a firm does not have a financial expert on the audit committee of the board. We follow the methodology of Kim et al (2012) in implementing the SEC’s definition of financial expert. All other variables are defined in Appendix 1. All monetary values are measured in 2002 dollars. Constants are included but not reported in the regressions. t -statistics are based on heteroskedasticity-robust standard errors that are clustered at the firm and pre-/post-SOX level and reported in parentheses. ***, **,* denote significance at 1%, 5% and 10% levels, respectively. (1) (2) (3) (4) (5) (6) (7) (8) (9) (10)
VARIABLES CF
HEDGE/AT CLMZ HEDGE
HPS HEDGE
CLMZ HEDGE STD
HPS HEDGE STD
IR HEDGE STD
FX HEDGE STD
D(HPS HIGH)
NOTIONAL/AT
RISK POLICY
AFTERLAW*TREATED -0.031 -0.018 -0.027 -0.022 -0.024 -0.036 -0.023 -0.240 -0.014 0.002
(-1.905)* (-2.774)*** (-3.122)*** (-3.008)*** (-3.060)*** (-2.872)*** (-2.458)** (-1.896)* (-1.741)* (2.402)**
AFTERLAW*FIN EXP TREATED 0.009 0.002 -0.001 0.001 -0.001 -0.003 0.020 0.081 0.006 -0.000
(0.542) (0.222) (-0.115) (0.124) (-0.079) (-0.257) (1.211) (0.429) (0.432) (-0.665)
HHI -0.185 -0.025 -0.044 -0.008 0.000 -0.001 -0.103 -0.304 -0.037 0.002
(-1.482) (-0.682) (-0.953) (-0.211) (0.002) (-0.013) (-1.732)* (-1.354) (-1.146) (0.458)
LOG FIRMAGE -0.074 0.001 -0.003 -0.017 -0.025 0.012 0.022 -0.362 0.007 0.000 (-2.187)** (0.083) (-0.247) (-1.203) (-1.699)* (0.890) (1.444) (-8.060)*** (1.450) (0.348)
LOG ASSETS 0.048 0.005 0.006 0.019 0.019 0.013 0.020 0.267 -0.003 -0.001
(2.493)** (1.001) (0.841) (2.751)*** (2.726)*** (1.308) (2.182)** (11.613)*** (-0.537) (-0.807)
NUMBER OF SEGMENTS -0.001 -0.001 -0.000 -0.002 -0.004 -0.001 0.001 0.060 0.001 0.000 (-0.215) (-0.312) (-0.145) (-0.720) (-1.081) (-0.333) (0.302) (2.324)** (0.468) (0.974)
CAPEX/ASSETS 0.076 -0.031 -0.038 -0.003 -0.001 -0.098 0.079 -1.455 0.058 -0.009
(0.468) (-0.884) (-0.782) (-0.086) (-0.024) (-1.619) (1.644) (-2.349)** (1.571) (-2.460)**
TOBIN'S Q 0.016 -0.001 -0.001 0.000 0.001 0.001 0.000 0.013 -0.002 -0.000 (2.105)** (-0.654) (-0.456) (0.598) (1.106) (1.287) (0.139) (0.877) (-1.264) (-1.608)
LEVERAGE 0.080 0.029 0.039 0.053 0.063 0.108 0.018 1.680 0.089 -0.001
(1.344) (1.901)* (1.896)* (2.868)*** (3.223)*** (3.732)*** (0.733) (8.209)*** (3.719)*** (-0.565)
CASH/SALES -0.015 -0.014 -0.020 -0.013 -0.013 0.001 -0.008 0.188 -0.018 -0.000 (-0.682) (-2.411)** (-2.386)** (-1.846)* (-1.815)* (0.129) (-0.737) (2.144)** (-1.979)** (-0.330)
ROA 0.062 0.011 0.017 -0.016 -0.024 -0.010 -0.007 -0.660 0.011 0.001
(2.021)** (1.575) (1.704)* (-1.534) (-2.148)** (-0.719) (-0.551) (-2.915)*** (0.726) (0.792)
ROA(t-1) 0.001 0.009 0.010 -0.007 -0.011 -0.003 0.001 -0.431 0.005 0.001 (0.053) (1.499) (1.212) (-0.713) (-1.023) (-0.282) (0.089) (-2.100)** (0.323) (1.031)
STOCK RETURN 0.033 -0.000 -0.001 0.002 0.002 0.004 0.001 0.027 0.001 -0.001
(3.097)*** (-0.112) (-0.272) (0.521) (0.756) (0.844) (0.328) (0.392) (0.150) (-1.738)*
TREATED
0.100 (1.113)
FIN EXP TREATED -0.389
(-2.862)***
OBSERVATIONS 4,727 6,968 6,968 6,766 6,766 6,766 6,766 6,955 2,084 6,968 R-SQUARED 0.674 0.719 0.715 0.717 0.715 0.603 0.674 0.156 0.591 0.674 FIRM FE Yes Yes Yes Yes Yes Yes Yes No Yes Yes FF48-YEAR JOINT FE Yes Yes Yes Yes Yes Yes Yes Yes Yes Yes CLUSTER Yes Yes Yes Yes Yes Yes Yes Yes Yes Yes
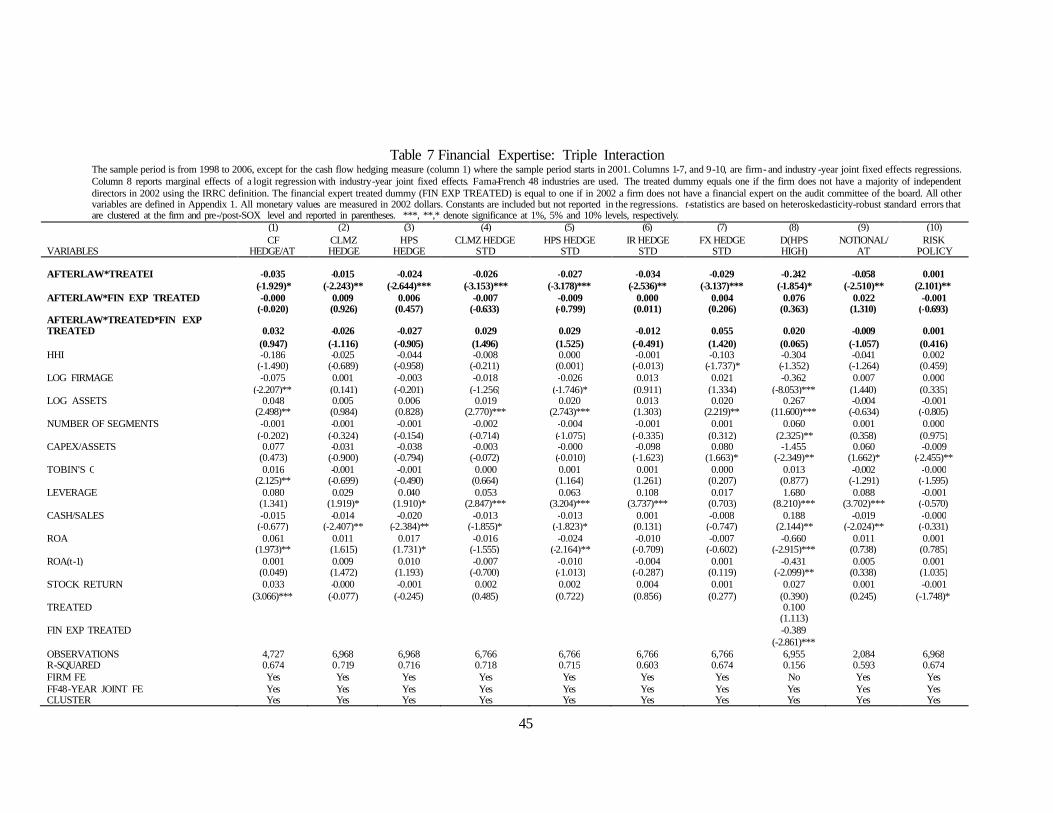
45
Table 7 Financial Expertise: Triple Interaction The sample period is from 1998 to 2006, except for the cash flow hedging measure (column 1) where the sample period starts in 2001. Columns 1-7, and 9-10, are firm- and industry -year joint fixed effects regressions. Column 8 reports marginal effects of a logit regression with industry-year joint fixed effects. Fama-French 48 industries are used. The treated dummy equals one if the firm does not have a majority of independent directors in 2002 using the IRRC definition. The financial expert treated dummy (FIN EXP TREATED) is equal to one if in 2002 a firm does not have a financial expert on the audit committee of the board. All other variables are defined in Appendix 1. All monetary values are measured in 2002 dollars. Constants are included but not reported in the regressions. t-statistics are based on heteroskedasticity-robust standard errors that are clustered at the firm and pre-/post-SOX level and reported in parentheses. ***, **,* denote significance at 1%, 5% and 10% levels, respectively.
(1) (2) (3) (4) (5) (6) (7) (8) (9) (10)
VARIABLES CF
HEDGE/AT CLMZ HEDGE
HPS HEDGE
CLMZ HEDGE STD
HPS HEDGE STD
IR HEDGE STD
FX HEDGE STD
D(HPS HIGH)
NOTIONAL/AT
RISK POLICY
AFTERLAW*TREATED -0.035 -0.015 -0.024 -0.026 -0.027 -0.034 -0.029 -0.242 -0.058 0.001
(-1.929)* (-2.243)** (-2.644)*** (-3.153)*** (-3.178)*** (-2.536)** (-3.137)*** (-1.854)* (-2.510)** (2.101)** AFTERLAW*FIN EXP TREATED -0.000 0.009 0.006 -0.007 -0.009 0.000 0.004 0.076 0.022 -0.001
(-0.020) (0.926) (0.457) (-0.633) (-0.799) (0.011) (0.206) (0.363) (1.310) (-0.693)
AFTERLAW*TREATED*FIN EXP TREATED 0.032 -0.026 -0.027 0.029 0.029 -0.012 0.055 0.020 -0.009 0.001
(0.947) (-1.116) (-0.905) (1.496) (1.525) (-0.491) (1.420) (0.065) (-1.057) (0.416)
HHI -0.186 -0.025 -0.044 -0.008 0.000 -0.001 -0.103 -0.304 -0.041 0.002
(-1.490) (-0.689) (-0.958) (-0.211) (0.001) (-0.013) (-1.737)* (-1.352) (-1.264) (0.459)
LOG FIRMAGE -0.075 0.001 -0.003 -0.018 -0.026 0.013 0.021 -0.362 0.007 0.000 (-2.207)** (0.141) (-0.201) (-1.256) (-1.746)* (0.911) (1.334) (-8.053)*** (1.440) (0.335)
LOG ASSETS 0.048 0.005 0.006 0.019 0.020 0.013 0.020 0.267 -0.004 -0.001
(2.498)** (0.984) (0.828) (2.770)*** (2.743)*** (1.303) (2.219)** (11.600)*** (-0.634) (-0.805)
NUMBER OF SEGMENTS -0.001 -0.001 -0.001 -0.002 -0.004 -0.001 0.001 0.060 0.001 0.000 (-0.202) (-0.324) (-0.154) (-0.714) (-1.075) (-0.335) (0.312) (2.325)** (0.358) (0.975)
CAPEX/ASSETS 0.077 -0.031 -0.038 -0.003 -0.000 -0.098 0.080 -1.455 0.060 -0.009
(0.473) (-0.900) (-0.794) (-0.072) (-0.010) (-1.623) (1.663)* (-2.349)** (1.662)* (-2.455)**
TOBIN'S Q 0.016 -0.001 -0.001 0.000 0.001 0.001 0.000 0.013 -0.002 -0.000 (2.125)** (-0.699) (-0.490) (0.664) (1.164) (1.261) (0.207) (0.877) (-1.291) (-1.595)
LEVERAGE 0.080 0.029 0.040 0.053 0.063 0.108 0.017 1.680 0.088 -0.001
(1.341) (1.919)* (1.910)* (2.847)*** (3.204)*** (3.737)*** (0.703) (8.210)*** (3.702)*** (-0.570)
CASH/SALES -0.015 -0.014 -0.020 -0.013 -0.013 0.001 -0.008 0.188 -0.019 -0.000 (-0.677) (-2.407)** (-2.384)** (-1.855)* (-1.823)* (0.131) (-0.747) (2.144)** (-2.024)** (-0.331)
ROA 0.061 0.011 0.017 -0.016 -0.024 -0.010 -0.007 -0.660 0.011 0.001
(1.973)** (1.615) (1.731)* (-1.555) (-2.164)** (-0.709) (-0.602) (-2.915)*** (0.738) (0.785)
ROA(t-1) 0.001 0.009 0.010 -0.007 -0.010 -0.004 0.001 -0.431 0.005 0.001 (0.049) (1.472) (1.193) (-0.700) (-1.013) (-0.287) (0.119) (-2.099)** (0.338) (1.035)
STOCK RETURN 0.033 -0.000 -0.001 0.002 0.002 0.004 0.001 0.027 0.001 -0.001
(3.066)*** (-0.077) (-0.245) (0.485) (0.722) (0.856) (0.277) (0.390) (0.245) (-1.748)*
TREATED
0.100 (1.113)
FIN EXP TREATED -0.389
(-2.861)***
OBSERVATIONS 4,727 6,968 6,968 6,766 6,766 6,766 6,766 6,955 2,084 6,968 R-SQUARED 0.674 0.719 0.716 0.718 0.715 0.603 0.674 0.156 0.593 0.674 FIRM FE Yes Yes Yes Yes Yes Yes Yes No Yes Yes FF48-YEAR JOINT FE Yes Yes Yes Yes Yes Yes Yes Yes Yes Yes CLUSTER Yes Yes Yes Yes Yes Yes Yes Yes Yes Yes
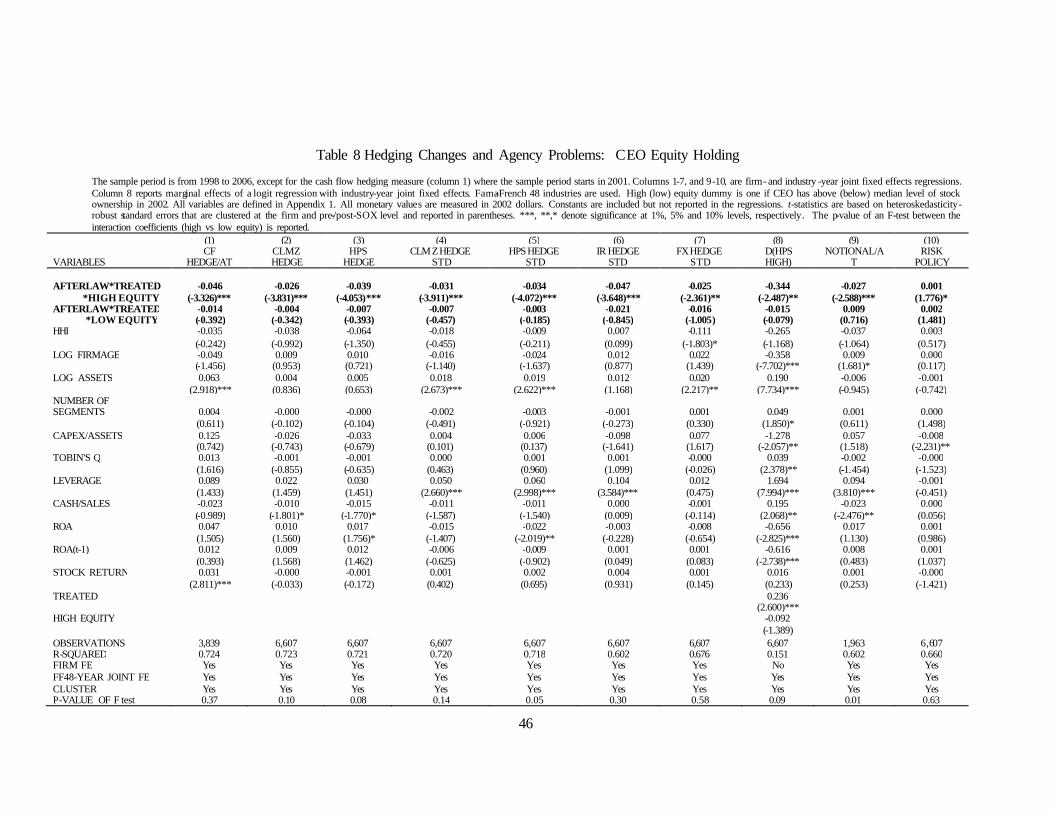
46
Table 8 Hedging Changes and Agency Problems: CEO Equity Holding The sample period is from 1998 to 2006, except for the cash flow hedging measure (column 1) where the sample period starts in 2001. Columns 1-7, and 9-10, are firm- and industry -year joint fixed effects regressions. Column 8 reports marginal effects of a logit regression with industry-year joint fixed effects. Fama-French 48 industries are used. High (low) equity dummy is one if CEO has above (below) median level of stock ownership in 2002. All variables are defined in Appendix 1. All monetary values are measured in 2002 dollars. Constants are included but not reported in the regressions. t-statistics are based on heteroskedasticity-robust standard errors that are clustered at the firm and pre-/post-SOX level and reported in parentheses. ***, **,* denote significance at 1%, 5% and 10% levels, respectively. The p-value of an F-test between the interaction coefficients (high vs low equity) is reported.
(1) (2) (3) (4) (5) (6) (7) (8) (9) (10)
VARIABLES CF
HEDGE/AT CLMZ HEDGE
HPS HEDGE
CLMZ HEDGE STD
HPS HEDGE STD
IR HEDGE STD
FX HEDGE STD
D(HPS HIGH)
NOTIONAL/AT
RISK POLICY
AFTERLAW*TREATED -0.046 -0.026 -0.039 -0.031 -0.034 -0.047 -0.025 -0.344 -0.027 0.001 *HIGH EQUITY (-3.326)*** (-3.831)*** (-4.053)*** (-3.911)*** (-4.072)*** (-3.648)*** (-2.361)** (-2.487)** (-2.588)*** (1.776)* AFTERLAW*TREATED -0.014 -0.004 -0.007 -0.007 -0.003 -0.021 -0.016 -0.015 0.009 0.002 *LOW EQUITY (-0.392) (-0.342) (-0.393) (-0.457) (-0.185) (-0.845) (-1.005) (-0.079) (0.716) (1.481) HHI -0.035 -0.038 -0.064 -0.018 -0.009 0.007 -0.111 -0.265 -0.037 0.003
(-0.242) (-0.992) (-1.350) (-0.455) (-0.211) (0.099) (-1.803)* (-1.168) (-1.064) (0.517)
LOG FIRMAGE -0.049 0.009 0.010 -0.016 -0.024 0.012 0.022 -0.358 0.009 0.000
(-1.456) (0.953) (0.721) (-1.140) (-1.637) (0.877) (1.439) (-7.702)*** (1.681)* (0.117)
LOG ASSETS 0.063 0.004 0.005 0.018 0.019 0.012 0.020 0.190 -0.006 -0.001 (2.918)*** (0.836) (0.653) (2.673)*** (2.622)*** (1.168) (2.217)** (7.734)*** (-0.945) (-0.742)
NUMBER OF SEGMENTS 0.004 -0.000 -0.000 -0.002 -0.003 -0.001 0.001 0.049 0.001 0.000
(0.611) (-0.102) (-0.104) (-0.491) (-0.921) (-0.273) (0.330) (1.850)* (0.611) (1.498) CAPEX/ASSETS 0.125 -0.026 -0.033 0.004 0.006 -0.098 0.077 -1.278 0.057 -0.008
(0.742) (-0.743) (-0.679) (0.101) (0.137) (-1.641) (1.617) (-2.057)** (1.518) (-2.231)**
TOBIN'S Q 0.013 -0.001 -0.001 0.000 0.001 0.001 -0.000 0.039 -0.002 -0.000
(1.616) (-0.855) (-0.635) (0.463) (0.960) (1.099) (-0.026) (2.378)** (-1.454) (-1.523)
LEVERAGE 0.089 0.022 0.030 0.050 0.060 0.104 0.012 1.694 0.094 -0.001
(1.433) (1.459) (1.451) (2.660)*** (2.998)*** (3.584)*** (0.475) (7.994)*** (3.810)*** (-0.451)
CASH/SALES -0.023 -0.010 -0.015 -0.011 -0.011 0.000 -0.001 0.195 -0.023 0.000
(-0.989) (-1.801)* (-1.770)* (-1.587) (-1.540) (0.009) (-0.114) (2.068)** (-2.476)** (0.056)
ROA 0.047 0.010 0.017 -0.015 -0.022 -0.003 -0.008 -0.656 0.017 0.001
(1.505) (1.560) (1.756)* (-1.407) (-2.019)** (-0.228) (-0.654) (-2.825)*** (1.130) (0.986)
ROA(t-1) 0.012 0.009 0.012 -0.006 -0.009 0.001 0.001 -0.616 0.008 0.001
(0.393) (1.568) (1.462) (-0.625) (-0.902) (0.049) (0.083) (-2.738)*** (0.483) (1.037)
STOCK RETURN 0.031 -0.000 -0.001 0.001 0.002 0.004 0.001 0.016 0.001 -0.000 (2.811)*** (-0.033) (-0.172) (0.402) (0.695) (0.931) (0.145) (0.233) (0.253) (-1.421)
TREATED
0.236
(2.600)***
HIGH EQUITY -0.092 (-1.389)
OBSERVATIONS 3,839 6,607 6,607 6,607 6,607 6,607 6,607 6,607 1,963 6,607 R-SQUARED 0.724 0.723 0.721 0.720 0.718 0.602 0.676 0.151 0.602 0.660 FIRM FE Yes Yes Yes Yes Yes Yes Yes No Yes Yes FF48-YEAR JOINT FE Yes Yes Yes Yes Yes Yes Yes Yes Yes Yes CLUSTER Yes Yes Yes Yes Yes Yes Yes Yes Yes Yes P-VALUE OF F test 0.37 0.10 0.08 0.14 0.05 0.30 0.58 0.09 0.01 0.63
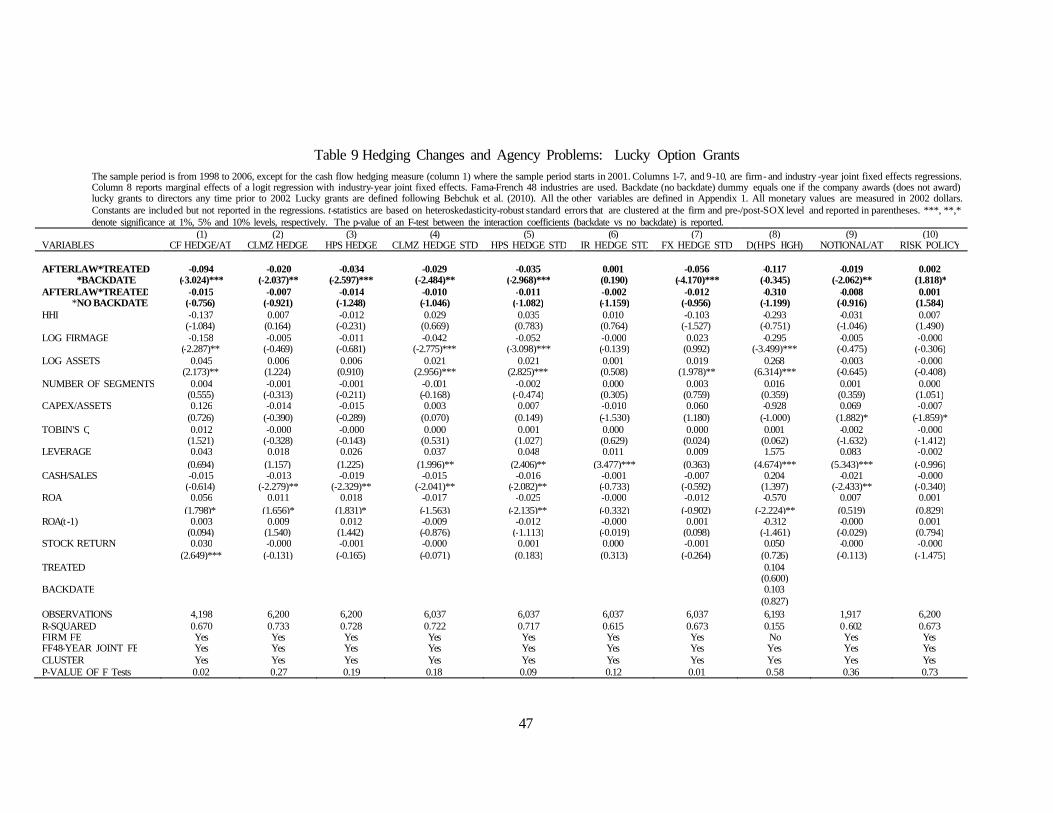
47
Table 9 Hedging Changes and Agency Problems: Lucky Option Grants
The sample period is from 1998 to 2006, except for the cash flow hedging measure (column 1) where the sample period starts in 2001. Columns 1-7, and 9-10, are firm- and industry -year joint fixed effects regressions. Column 8 reports marginal effects of a logit regression with industry-year joint fixed effects. Fama-French 48 industries are used. Backdate (no backdate) dummy equals one if the company awards (does not award) lucky grants to directors any time prior to 2002. Lucky grants are defined following Bebchuk et al. (2010). All the other variables are defined in Appendix 1. All monetary values are measured in 2002 dollars. Constants are included but not reported in the regressions. t-statistics are based on heteroskedasticity-robust standard errors that are clustered at the firm and pre-/post-SOX level and reported in parentheses. ***, **,* denote significance at 1%, 5% and 10% levels, respectively. The p-value of an F-test between the interaction coefficients (backdate vs no backdate) is reported.
(1) (2) (3) (4) (5) (6) (7) (8) (9) (10) VARIABLES CF HEDGE/AT CLMZ HEDGE HPS HEDGE CLMZ HEDGE STD HPS HEDGE STD IR HEDGE STD FX HEDGE STD D(HPS HIGH) NOTIONAL/AT RISK POLICY AFTERLAW*TREATED -0.094 -0.020 -0.034 -0.029 -0.035 0.001 -0.056 -0.117 -0.019 0.002 *BACKDATE (-3.024)*** (-2.037)** (-2.597)*** (-2.484)** (-2.968)*** (0.190) (-4.170)*** (-0.345) (-2.062)** (1.818)* AFTERLAW*TREATED -0.015 -0.007 -0.014 -0.010 -0.011 -0.002 -0.012 -0.310 -0.008 0.001 *NO BACKDATE (-0.756) (-0.921) (-1.248) (-1.046) (-1.082) (-1.159) (-0.956) (-1.199) (-0.916) (1.584) HHI -0.137 0.007 -0.012 0.029 0.035 0.010 -0.103 -0.293 -0.031 0.007
(-1.084) (0.164) (-0.231) (0.669) (0.783) (0.764) (-1.527) (-0.751) (-1.046) (1.490)
LOG FIRMAGE -0.158 -0.005 -0.011 -0.042 -0.052 -0.000 0.023 -0.295 -0.005 -0.000 (-2.287)** (-0.469) (-0.681) (-2.775)*** (-3.098)*** (-0.139) (0.992) (-3.499)*** (-0.475) (-0.306)
LOG ASSETS 0.045 0.006 0.006 0.021 0.021 0.001 0.019 0.268 -0.003 -0.000
(2.173)** (1.224) (0.910) (2.956)*** (2.825)*** (0.508) (1.978)** (6.314)*** (-0.645) (-0.408)
NUMBER OF SEGMENTS 0.004 -0.001 -0.001 -0.001 -0.002 0.000 0.003 0.016 0.001 0.000
(0.555) (-0.313) (-0.211) (-0.168) (-0.474) (0.305) (0.759) (0.359) (0.359) (1.051)
CAPEX/ASSETS 0.126 -0.014 -0.015 0.003 0.007 -0.010 0.060 -0.928 0.069 -0.007
(0.726) (-0.390) (-0.289) (0.070) (0.149) (-1.530) (1.180) (-1.000) (1.882)* (-1.859)*
TOBIN'S Q 0.012 -0.000 -0.000 0.000 0.001 0.000 0.000 0.001 -0.002 -0.000
(1.521) (-0.328) (-0.143) (0.531) (1.027) (0.629) (0.024) (0.062) (-1.632) (-1.412)
LEVERAGE 0.043 0.018 0.026 0.037 0.048 0.011 0.009 1.575 0.083 -0.002 (0.694) (1.157) (1.225) (1.996)** (2.406)** (3.477)*** (0.363) (4.674)*** (5.343)*** (-0.996)
CASH/SALES -0.015 -0.013 -0.019 -0.015 -0.016 -0.001 -0.007 0.204 -0.021 -0.000
(-0.614) (-2.279)** (-2.329)** (-2.041)** (-2.082)** (-0.733) (-0.592) (1.397) (-2.433)** (-0.340)
ROA 0.056 0.011 0.018 -0.017 -0.025 -0.000 -0.012 -0.570 0.007 0.001 (1.798)* (1.656)* (1.831)* (-1.563) (-2.135)** (-0.332) (-0.902) (-2.224)** (0.519) (0.829)
ROA(t-1) 0.003 0.009 0.012 -0.009 -0.012 -0.000 0.001 -0.312 -0.000 0.001
(0.094) (1.540) (1.442) (-0.876) (-1.113) (-0.019) (0.098) (-1.461) (-0.029) (0.794)
STOCK RETURN 0.030 -0.000 -0.001 -0.000 0.001 0.000 -0.001 0.050 -0.000 -0.000 (2.649)*** (-0.131) (-0.165) (-0.071) (0.183) (0.313) (-0.264) (0.726) (-0.113) (-1.475)
TREATED
0.104
(0.600)
BACKDATE
0.103 (0.827)
OBSERVATIONS 4,198 6,200 6,200 6,037 6,037 6,037 6,037 6,193 1,917 6,200 R-SQUARED 0.670 0.733 0.728 0.722 0.717 0.615 0.673 0.155 0.602 0.673 FIRM FE Yes Yes Yes Yes Yes Yes Yes No Yes Yes FF48-YEAR JOINT FE Yes Yes Yes Yes Yes Yes Yes Yes Yes Yes CLUSTER Yes Yes Yes Yes Yes Yes Yes Yes Yes Yes P-VALUE OF F Tests 0.02 0.27 0.19 0.18 0.09 0.12 0.01 0.58 0.36 0.73

48
Table 10 Hedging Changes and Agency Problems: Hedging Need
The sample period is from 1998 to 2006, except for the cash flow hedging measure (column 1) where the sample period starts in 2001. Columns 1-7, and 9-10, are firm- and industry -year joint fixed effects regressions. Column 8 reports marginal effects of a logit regression with industry-year joint fixed effects. Fama-French 48 industries are used. As of 2002, we sort Fama-French 10 industries based on hedging measures and the top (bottom) five industries are classi fied as hedging need (no hedging need) industries . All variables are defined in Appendix 1. All monetary values are measured in 2002 dollars. Constants are included but not reported in the regressions. t-statistics are based on heteroskedasticity-robust standard errors that are clustered at the firm and pre-/post-SOX level and reported in parentheses . ***, **,* denote significance at 1%, 5% and 10% levels, respectively. The p-value of an F-test between the interaction coefficients (hedging need vs no hedging need) is reported.
(1) (2) (3) (4) (5) (6) (7) (8) (9) (10) VARIABLES CF HEDGE/AT CLMZ HEDGE HPS HEDGE CLMZ HEDGE STD HPS HEDGE STD IR HEDGE STD FX HEDGE STD D(HPS HIGH) NOTIONAL/AT RISK POLICY
AFTERLAW*TREATED -0.020 -0.018 -0.025 -0.010 -0.015 -0.039 -0.018 -0.170 -0.007 0.002 *HEDGING NEED (-0.892) (-1.466) (-1.486) (-0.780) (-1.049) (-1.360) (-1.340) (-0.996) (-0.685) (1.526) AFTERLAW*TREATED -0.036 -0.017 -0.029 -0.029 -0.027 -0.033 -0.027 -0.288 -0.023 0.001 *NO HEDGING NEED (-1.708)* (-2.445)** (-2.895)*** (-3.153)*** (-3.015)*** (-1.600) (-2.175)** (-2.096)** (-1.881)* (1.739)* HHI -0.189 -0.025 -0.044 -0.012 -0.001 0.001 -0.107 -0.304 -0.033 0.002
(-1.521) (-0.688) (-0.964) (-0.298) (-0.029) (0.012) (-1.792)* (-1.598) (-0.989) (0.428) LOG FIRMAGE -0.074 0.001 -0.003 -0.017 -0.025 0.012 0.022 -0.337 0.007 0.000
(-2.183)** (0.085) (-0.248) (-1.206) (-1.705)* (0.680) (1.461) (-7.783)*** (1.429) (0.321)
LOG ASSETS 0.048 0.005 0.006 0.018 0.019 0.013 0.020 0.252 -0.003 -0.001 (2.479)** (0.999) (0.831) (2.684)*** (2.728)*** (1.010) (2.175)** (11.574)*** (-0.566) (-0.812)
NUMBER OF SEGMENTS -0.001 -0.001 -0.000 -0.003 -0.004 -0.001 0.001 0.065 0.001 0.000
(-0.220) (-0.315) (-0.146) (-0.751) (-1.107) (-0.266) (0.246) (2.681)*** (0.490) (0.981)
CAPEX/ASSETS 0.080 -0.031 -0.038 -0.002 -0.001 -0.098 0.082 -1.323 0.061 -0.009 (0.492) (-0.883) (-0.783) (-0.049) (-0.019) (-1.284) (1.708)* (-2.314)** (1.685)* (-2.479)**
TOBIN'S Q 0.016 -0.001 -0.001 0.000 0.001 0.001 0.000 0.000 -0.002 -0.000
(2.105)** (-0.653) (-0.459) (0.567) (1.100) (1.074) (0.136) (0.021) (-1.248) (-1.613)
LEVERAGE 0.080 0.029 0.039 0.053 0.063 0.108 0.017 1.704 0.088 -0.001
(1.340) (1.894)* (1.895)* (2.876)*** (3.218)*** (2.951)*** (0.682) (8.766)*** (3.751)*** (-0.547)
CASH/SALES -0.014 -0.014 -0.020 -0.013 -0.013 0.001 -0.008 0.156 -0.018 -0.000
(-0.670) (-2.406)** (-2.376)** (-1.787)* (-1.787)* (0.091) (-0.715) (1.890)* (-1.998)** (-0.310)
ROA 0.062 0.011 0.017 -0.016 -0.024 -0.010 -0.007 -0.618 0.011 0.001
(2.025)** (1.569) (1.706)* (-1.540) (-2.152)** (-0.690) (-0.584) (-2.777)*** (0.699) (0.797)
ROA(t-1) 0.001 0.009 0.010 -0.007 -0.011 -0.003 0.000 -0.425 0.004 0.001
(0.049) (1.495) (1.217) (-0.721) (-1.027) (-0.227) (0.044) (-2.079)** (0.276) (1.042)
STOCK RETURN 0.033 -0.000 -0.001 0.002 0.002 0.004 0.001 0.030 0.001 -0.001
(3.090)*** (-0.115) (-0.274) (0.479) (0.744) (0.727) (0.291) (0.433) (0.148) (-1.733)*
TREATED 0.105 (1.201)
HEDGING NEED
-0.278
(-2.177)**
OBSERVATIONS 4,727 6,968 6,968 6,766 6,766 6,766 6,766 6,968 2,084 6,968 R-SQUARED 0.674 0.719 0.715 0.718 0.715 0.603 0.673 0.137 0.591 0.674 FIRM FE Yes Yes Yes Yes Yes Yes Yes No Yes Yes FF48-YEAR JOINT FE Yes Yes Yes Yes Yes Yes Yes Yes Yes Yes CLUSTER Yes Yes Yes Yes Yes Yes Yes Yes Yes Yes P-VALUE OF F Tests 0.62 0.98 0.83 0.21 0.50 0.82 0.61 0.50 0.29 0.61
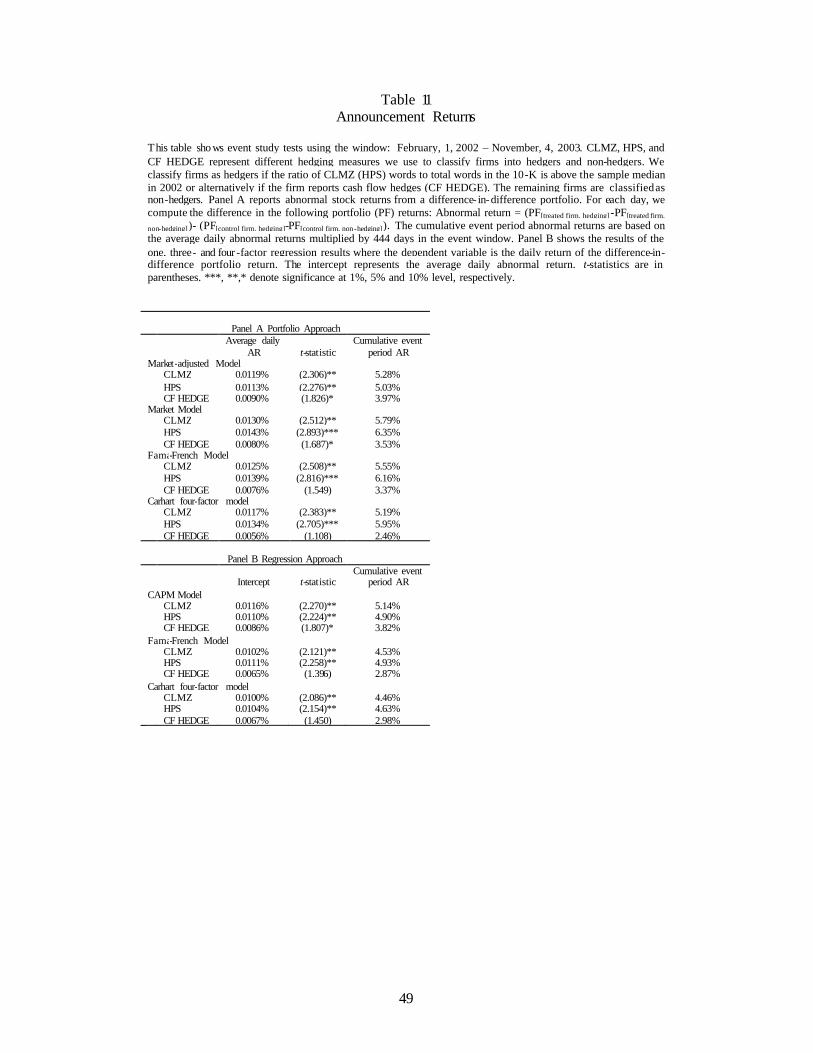
49
Table 11 Announcement Returns
This table sho ws event study tests using the window: February, 1, 2002 – November, 4, 2003. CLMZ, HPS, and CF HEDGE represent different hedging measures we use to classify firms into hedgers and non-hedgers. We classify firms as hedgers if the ratio of CLMZ (HPS) words to total words in the 10-K is above the sample median in 2002 or alternatively if the firm reports cash flow hedges (CF HEDGE). The remaining firms are classified as non-hedgers. Panel A reports abnormal stock returns from a difference- in-difference portfolio. For each day, we compute the difference in the following portfolio (PF) returns: Abnormal return = (PF[treated firm, hedging]-PF[treated firm,
non-hedging])- (PF[control firm, hedging]-PF[control firm, non -hedging]). The cumulative event period abnormal returns are based on the average daily abnormal returns multiplied by 444 days in the event window. Panel B shows the results of the one, three- and four -factor regression results where the dependent variable is the daily return of the difference-in-difference portfolio return. The intercept represents the average daily abnormal return. t-statistics are in parentheses. ***, **,* denote significance at 1%, 5% and 10% level, respectively.
Panel A Portfolio Approach
Average daily
AR t-statistic Cumulative event
period AR Market-adjusted Model CLMZ 0.0119% (2.306)** 5.28% HPS 0.0113% (2.276)** 5.03% CF HEDGE 0.0090% (1.826)* 3.97% Market Model CLMZ 0.0130% (2.512)** 5.79% HPS 0.0143% (2.893)*** 6.35% CF HEDGE 0.0080% (1.687)* 3.53% Fama-French Model CLMZ 0.0125% (2.508)** 5.55% HPS 0.0139% (2.816)*** 6.16% CF HEDGE 0.0076% (1.549) 3.37% Carhart four-factor model CLMZ 0.0117% (2.383)** 5.19% HPS 0.0134% (2.705)*** 5.95% CF HEDGE 0.0056% (1.108) 2.46%
Panel B Regression Approach
Intercept t-statistic Cumulative event
period AR CAPM Model CLMZ 0.0116% (2.270)** 5.14% HPS 0.0110% (2.224)** 4.90% CF HEDGE 0.0086% (1.807)* 3.82% Fama-French Model CLMZ 0.0102% (2.121)** 4.53% HPS 0.0111% (2.258)** 4.93% CF HEDGE 0.0065% (1.396) 2.87% Carhart four-factor model CLMZ 0.0100% (2.086)** 4.46% HPS 0.0104% (2.154)** 4.63% CF HEDGE 0.0067% (1.450) 2.98%