Embed Size (px)
Citation preview

Western Michigan University Western Michigan University
ScholarWorks at WMU ScholarWorks at WMU
Honors Theses Lee Honors College
4-17-2018
Do Global Diets Affect the Rate of Type 2 Diabetes? Do Global Diets Affect the Rate of Type 2 Diabetes?
Demetria Meyer Western Michigan University, [email protected]
Follow this and additional works at: https://scholarworks.wmich.edu/honors_theses
Part of the Endocrinology, Diabetes, and Metabolism Commons
Recommended Citation Recommended Citation Meyer, Demetria, "Do Global Diets Affect the Rate of Type 2 Diabetes?" (2018). Honors Theses. 3000. https://scholarworks.wmich.edu/honors_theses/3000
This Honors Thesis-Open Access is brought to you for free and open access by the Lee Honors College at ScholarWorks at WMU. It has been accepted for inclusion in Honors Theses by an authorized administrator of ScholarWorks at WMU. For more information, please contact [email protected].

1
1
Do Global Diets Affect the Rate of Type 2 Diabetes?
Demetria Meyer
Honors College Thesis
Western Michigan University

2
Abstract
The purpose of this study is to determine whether different global diets correlate with the
increase in type 2 diabetes rates. Type 2 diabetes is the main diabetes type being looked at due to
it being the one that can be maintained primarily by glycemic control, which is controlled by a
good diet. Five different countries from different regions will be examined: Brazil, China,
Micronesia, Nigeria, and the United States. The diets of these countries will be broken down into
smaller pieces, like calories consumed each day and the percentage of macronutrients that make
up the calories. Eleven food groups are also looked at by how many grams each country
consumes per day. Other factors within the countries will be discussed, such as access to health
care and genetics, to better determine if the diet is what is affecting the rate of diabetes. Then,
each of these components will be analyzed to determine if there is a correlation between global
diets and how they affect Type 2 diabetes (T2DM) rates.

3
Introduction
Diabetes is a major disease that affects approximately 8.5 percent of the global
population (World Health Organization, 2017). About 90-95 percent of diabetes cases are Type 2
(T2DM), which means a person’s body cannot correctly utilize the insulin that is produced, so
glucose builds up in the blood leading to high levels of blood glucose (sometimes referred to as
“sugar”) that can cause a variety of health problems. Two main causes of Type 2 diabetes are
obesity and diet. Being obese can worsen diabetes depending on where the fat is positioned on
the body. For example, someone with most of their body fat around their midsection is likely to
have higher insulin resistance than someone who has most of their body fat in other areas. This is
due to fat cells releasing inflammatory chemicals that can decrease the sensitivity of the body to
insulin, leading to insulin resistance (Diabetes.co.uk, 2017). In turn, diet can fuel obesity if a
person consumes energy-dense foods and does not exercise enough to work off the excess
calories consumed (Chatterjee, Khunti, & Davies, 2017). This leads to the body receiving more
calories than it needs, which can cause it to store the excess as fat, thereby leading to decreased
insulin sensitivity. Or the body will try to produce more insulin to keep up with the increase of
carbohydrates that need to be broken down, which can lead to stress on the pancreas to produce
more beta cells or on the body to try to utilize insulin (Chatterjee, Khunti, & Davies, 2017).
Consuming too many calories or foods containing glucose can lead to obesity that can lead a
person to cardiovascular diseases (CVD), which can then lead to a person having complications
with maintaining their diabetes (Chatterjee, Khunti, & Davies, 2017).
Glucose is a form of carbohydrate (CHO) and it is very important to maintain a healthy
balance of CHOs in the diet of those with diabetes. CHO is a term that groups together sugar,
starch, simple and complex carbs, and fiber. CHOs are necessary for the body to obtain energy,

4
along with proteins and fats, however, they do not produce as much energy as fats, but the body
is able to use them the fastest, so CHOs are used as the primary energy source (Daries, 2012).
When a person consumes a carbohydrate, it is broken down and enters the blood as glucose, so
the more CHOs a person eats, the more glucose they are building up in their blood (Daries,
2012). This can lead to their body needing to work overtime in producing insulin to help control
the amount of glucose in their blood by having cells take it up to be used as energy, or for the
liver to store it as glycogen (a compact form of glucose) (Newsholme & Dimitriadis, 2001).
There are several types of CHOs, such as, simple, complex, refined, and unrefined.
Simple CHOs are known as sugars, either 1 or 2 sugar molecules, and complex CHOs are known
as starches, which are chains of sugars (Jenkins, Jenkins, Wolever, Thompson, & Rao, 1986).
Refined carbohydrates are grains that have undergone some type of treatment, like white flour or
sweeteners, whereas unrefined carbohydrates are foods that have not been altered in any way,
like whole grain bread or raw vegetables, and unrefined carbohydrates are usually rich in fiber
(Venhaus & Chantelau, 1988). Unrefined CHOs can help the body regulate blood glucose levels
due to the dietary fiber they contain, so fiber in a diabetic’s diet would be beneficial (Daries,
2012). However, for refined carbohydrates, studies have shown that an increased consumption of
them correlates with an increase in T2DM due to this type of CHO lacking many essential
nutrients that unrefined CHOs have (Gross, Li, Ford, & Liu, 2004). Some foods that contain
carbohydrates are “vegetables, fruits, cereals, grains, legume-type food, as well as sugary foods
and drinks”, also some animal products, like milk, some cheeses, and yogurt (Daries, 2012).
Carbohydrates are the most important nutrient to monitor when preparing foods to eat as a
diabetic because they will break down into glucose in the body therefore requiring insulin to
utilize it.
5
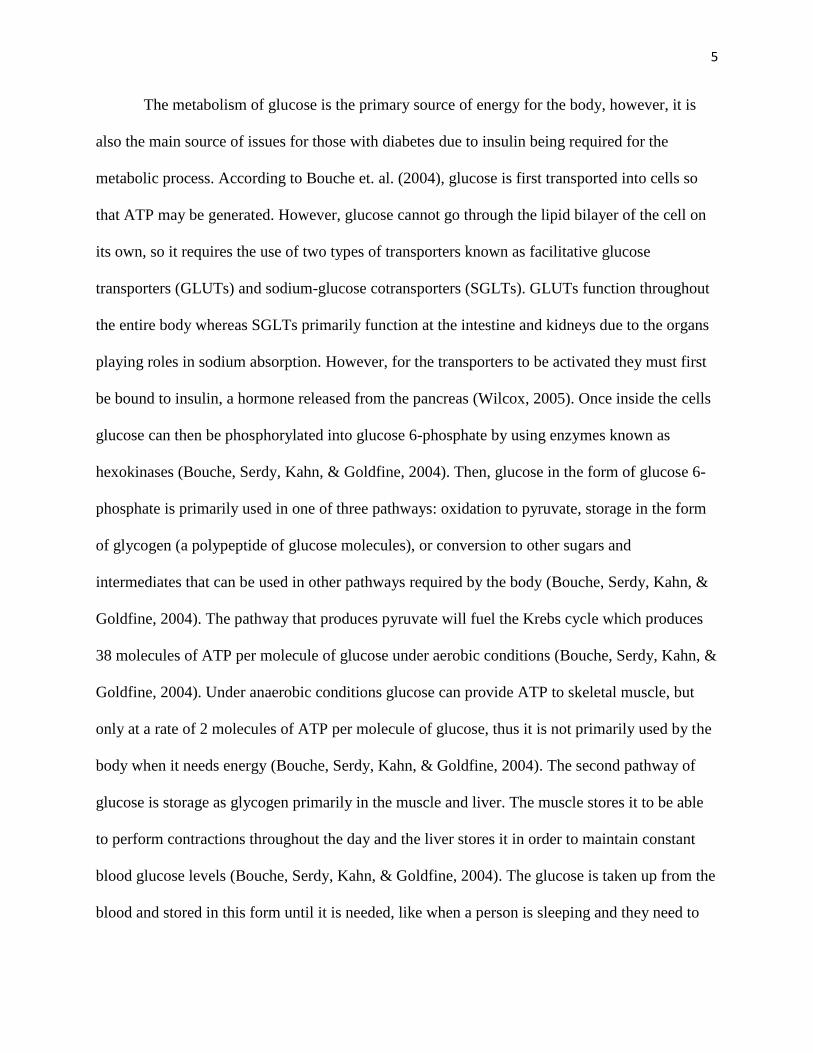
The metabolism of glucose is the primary source of energy for the body, however, it is
also the main source of issues for those with diabetes due to insulin being required for the
metabolic process. According to Bouche et. al. (2004), glucose is first transported into cells so
that ATP may be generated. However, glucose cannot go through the lipid bilayer of the cell on
its own, so it requires the use of two types of transporters known as facilitative glucose
transporters (GLUTs) and sodium-glucose cotransporters (SGLTs). GLUTs function throughout
the entire body whereas SGLTs primarily function at the intestine and kidneys due to the organs
playing roles in sodium absorption. However, for the transporters to be activated they must first
be bound to insulin, a hormone released from the pancreas (Wilcox, 2005). Once inside the cells
glucose can then be phosphorylated into glucose 6-phosphate by using enzymes known as
hexokinases (Bouche, Serdy, Kahn, & Goldfine, 2004). Then, glucose in the form of glucose 6-
phosphate is primarily used in one of three pathways: oxidation to pyruvate, storage in the form
of glycogen (a polypeptide of glucose molecules), or conversion to other sugars and
intermediates that can be used in other pathways required by the body (Bouche, Serdy, Kahn, &
Goldfine, 2004). The pathway that produces pyruvate will fuel the Krebs cycle which produces
38 molecules of ATP per molecule of glucose under aerobic conditions (Bouche, Serdy, Kahn, &
Goldfine, 2004). Under anaerobic conditions glucose can provide ATP to skeletal muscle, but
only at a rate of 2 molecules of ATP per molecule of glucose, thus it is not primarily used by the
body when it needs energy (Bouche, Serdy, Kahn, & Goldfine, 2004). The second pathway of
glucose is storage as glycogen primarily in the muscle and liver. The muscle stores it to be able
to perform contractions throughout the day and the liver stores it in order to maintain constant
blood glucose levels (Bouche, Serdy, Kahn, & Goldfine, 2004). The glucose is taken up from the
blood and stored in this form until it is needed, like when a person is sleeping and they need to

6
maintain a normal blood sugar level due to going without food for eight hours (Bouche, Serdy,
Kahn, & Goldfine, 2004). The third pathway is the conversion to other products the body can use
primarily in the form of glycolipids and glycoproteins. Glycolipids and glycoproteins are part of
the cell membrane and play a variety of roles, such as receptors, cell signaling, and stabilization
(Tauber, Reutter, & Gerok, 1987). The metabolism of glucose provides the body with energy,
stable blood sugar when there are periods of no eating, and other products that help the body’s
cells function normally.
Figure 1. Three pathways of glucose metabolism into glycogen, pyruvate, and other biosynthetic products from (Haukaas, Giskeodegard, Euceda, & Bathen, 2017).
7
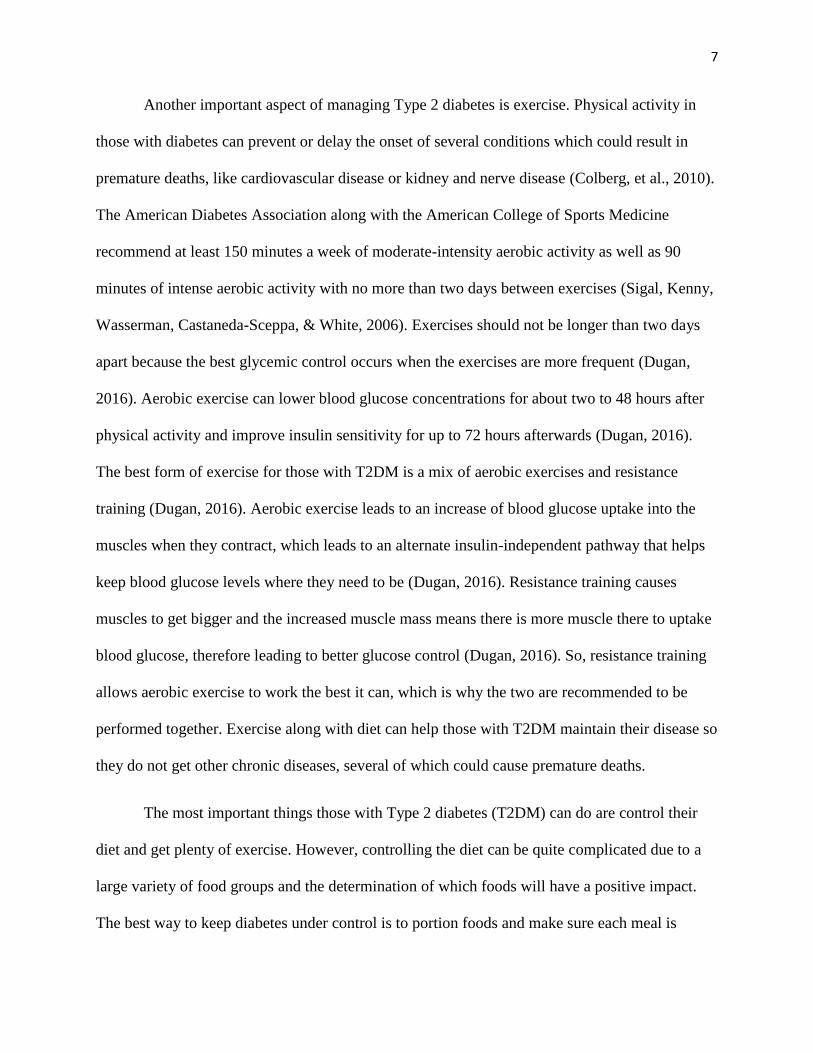
Another important aspect of managing Type 2 diabetes is exercise. Physical activity in
those with diabetes can prevent or delay the onset of several conditions which could result in
premature deaths, like cardiovascular disease or kidney and nerve disease (Colberg, et al., 2010).
The American Diabetes Association along with the American College of Sports Medicine
recommend at least 150 minutes a week of moderate-intensity aerobic activity as well as 90
minutes of intense aerobic activity with no more than two days between exercises (Sigal, Kenny,
Wasserman, Castaneda-Sceppa, & White, 2006). Exercises should not be longer than two days
apart because the best glycemic control occurs when the exercises are more frequent (Dugan,
2016). Aerobic exercise can lower blood glucose concentrations for about two to 48 hours after
physical activity and improve insulin sensitivity for up to 72 hours afterwards (Dugan, 2016).
The best form of exercise for those with T2DM is a mix of aerobic exercises and resistance
training (Dugan, 2016). Aerobic exercise leads to an increase of blood glucose uptake into the
muscles when they contract, which leads to an alternate insulin-independent pathway that helps
keep blood glucose levels where they need to be (Dugan, 2016). Resistance training causes
muscles to get bigger and the increased muscle mass means there is more muscle there to uptake
blood glucose, therefore leading to better glucose control (Dugan, 2016). So, resistance training
allows aerobic exercise to work the best it can, which is why the two are recommended to be
performed together. Exercise along with diet can help those with T2DM maintain their disease so
they do not get other chronic diseases, several of which could cause premature deaths.
The most important things those with Type 2 diabetes (T2DM) can do are control their
diet and get plenty of exercise. However, controlling the diet can be quite complicated due to a
large variety of food groups and the determination of which foods will have a positive impact.
The best way to keep diabetes under control is to portion foods and make sure each meal is

8
balanced with proteins, dairy, grains, fruits, and vegetables. By doing so, a person can ensure
they are getting all the proper nutrients they need, and they are able to keep their blood sugar at a
normal level (Deed, Barlow, Kawol, Kilov, & Sharma, 2015). But, different countries have
different foods, so their diets may be composed differently from one another. So, some countries
may end up having lower rates of diabetes than others. I will look at countries that have lower
and higher rates of diabetes and determine what they have in common and in what ways they
differ in terms of diet. By doing so, I may be able to determine what type of diet allows for the
best glycemic control. So, I will be looking at five different countries that have different types of
diets: Brazil, China, Micronesia, Nigeria, and the United States. These countries were chosen
because they are in different geographic, as well as agricultural, regions of the world, which will
change the composition of each diet and should give a more distinct answer as to which parts of
the diets, if any, affect diabetes rates. The five countries chosen also differ in terms of
development, for example, the United States is a first world country and Nigeria is a third world
country, so the types of foods as well as availability of health programs will be very different. I
will break down the diets of each country and then compare them to one another to determine
which components are different and which are similar to determine whether or not global diets
influence the rate of T2DM.
Literature Review
According to DeBruyne et al. (2016), there are many factors to consider when planning a
diet; macronutrient intake, total carbohydrate intake, glycemic index, sugars, whole grains and
fibers, dietary fat, protein, micronutrients, and body weight. Macronutrients are important in
controlling blood sugar levels and include carbohydrates, fats, and proteins. The daily
recommended intake for these nutrients are based on the suggested intake for the general

9
population and are measured in percent of total kilocalories. The suggested percent for
carbohydrates is 45-65%, fat is 20-35%, and protein is 10-35%. Total carbohydrate intake is the
biggest factor for maintaining proper blood sugar levels, so foods like whole grains, legumes,
vegetables, fruits, and milk products are favored, whereas, refined grains and added sugars
should be limited (DeBruyne, Pinna, & Whitney, 2016). Glycemic control is important in diets
because it allows those with diabetes to keep their blood glucose levels low by choosing foods
that are high in fiber and minimally processed. Sugars can still be ingested while having
diabetes, but in moderation. Some sugars that can be safely ingested are artificial sweeteners,
fructose, and sugar alcohols due to them having low or no glycemic effects. Whole-grain foods
provide plenty of fiber and are highly suggested for those with Type 2 diabetes because studies
have shown that high amounts of fiber have improved glycemic control. As for dietary fat,
monounsaturated fats are best along with omega-3 fatty acids, however, saturated and trans fats
should be limited. Protein intake is suggested to be 15% of total kilocalorie intake, which is the
same as the average population. Higher intakes have been suggested to improve glycemic control
but can be harmful to the kidneys. The suggested intake of micronutrients for people with T2DM
is the same as that of the general population, so there is no big impact of these nutrients on the
control of diabetes. Finally, body weight is important in controlling blood glucose levels because
an increase of body fat can lead to “insulin resistance, glycemic control,” increased blood lipid
levels, and increased blood pressure, all of which have negative impacts on the body (DeBruyne,
Pinna, & Whitney, 2016).
In Table 1 the daily intake of 11 food groups will be investigated along with the
percentage of total calories coming from carbohydrates, protein, and fats for each of the five
countries. The number of calories, percent of the population that is obese, and the percent of the

10
population that has diabetes will also be considered when comparing diets and their effects.
Some research will also be discussed since the cause of T2DM is based on a variety of factors
outside of diet, like ethnicity or the type of healthcare available in the country. Diets may affect
ethnicities differently due to their varying genetic makeup, so countries with similar diets may
have differences when it comes to the percent of the population with obesity and diabetes.
Table 1. Listed are the percentages of population that has diabetes as well as those who are obese. Calories per day with the percentage of those calories that come from carbohydrates, proteins, and fats. Grams of 11 different food groups that are consumed per day.
Brazil China Micronesia Nigeria United
States
% Diabetes 10.2 10.6 37.2 1.9 12.8
% Obesity 22.1 6.2 45.8 8.9 36.2
Calories per
Day
3,100 2,970 3,030 2,710 3,770
% Calories by
Carbohydrates
59 61 60 69 49
% Calories by
Protein
11 12 10 9 12
% Calories by
Fat
30 27 29 22 38
Processed
Meat (g)
21 4 18 6 35
Red Meat (g) 83 50 55 25 41
Sugared
Drinks (g)
117 13 139 72 274
Juice (g) 74 .2 29 2 96
Milk (g) 132 18 67 41 199
Fruit (g) 105 42 159 103 97
Vegetables (g) 56 257 217 118 87
Legumes (g) 188 17 2 82 19
Whole Grains
(g)
14 10 35 45 46
Nuts and
Seeds (g)
2 3 8 18 4
Seafood (g) 36 31 44 26 18 Note: Data for percent of population that has diabetes is from International Diabetes Federation (2017), percent of population
that is obese is from Central Intelligence Agency (2016), calories consumed per day and the percent of the calories that are from
11
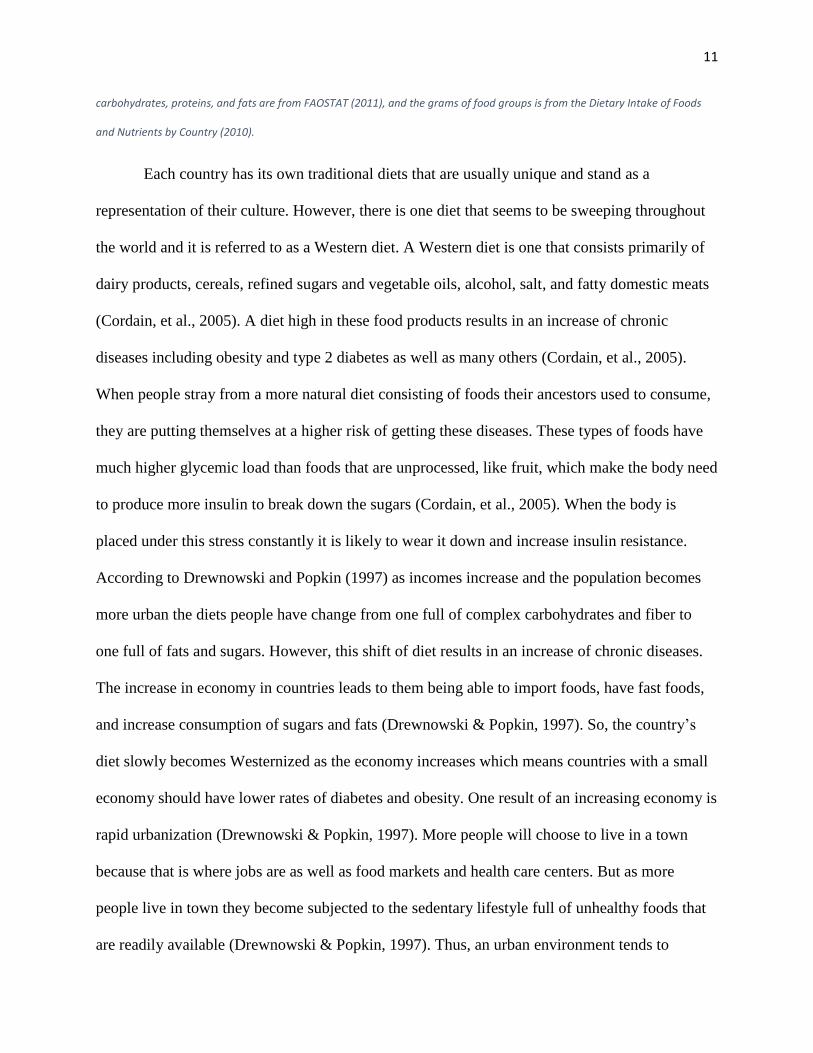
carbohydrates, proteins, and fats are from FAOSTAT (2011), and the grams of food groups is from the Dietary Intake of Foods
and Nutrients by Country (2010).
Each country has its own traditional diets that are usually unique and stand as a
representation of their culture. However, there is one diet that seems to be sweeping throughout
the world and it is referred to as a Western diet. A Western diet is one that consists primarily of
dairy products, cereals, refined sugars and vegetable oils, alcohol, salt, and fatty domestic meats
(Cordain, et al., 2005). A diet high in these food products results in an increase of chronic
diseases including obesity and type 2 diabetes as well as many others (Cordain, et al., 2005).
When people stray from a more natural diet consisting of foods their ancestors used to consume,
they are putting themselves at a higher risk of getting these diseases. These types of foods have
much higher glycemic load than foods that are unprocessed, like fruit, which make the body need
to produce more insulin to break down the sugars (Cordain, et al., 2005). When the body is
placed under this stress constantly it is likely to wear it down and increase insulin resistance.
According to Drewnowski and Popkin (1997) as incomes increase and the population becomes
more urban the diets people have change from one full of complex carbohydrates and fiber to
one full of fats and sugars. However, this shift of diet results in an increase of chronic diseases.
The increase in economy in countries leads to them being able to import foods, have fast foods,
and increase consumption of sugars and fats (Drewnowski & Popkin, 1997). So, the country’s
diet slowly becomes Westernized as the economy increases which means countries with a small
economy should have lower rates of diabetes and obesity. One result of an increasing economy is
rapid urbanization (Drewnowski & Popkin, 1997). More people will choose to live in a town
because that is where jobs are as well as food markets and health care centers. But as more
people live in town they become subjected to the sedentary lifestyle full of unhealthy foods that
are readily available (Drewnowski & Popkin, 1997). Thus, an urban environment tends to

12
produce a population with more chronic diseases than rural environments. Four out of the five
countries being researched are considered developing countries, the only developed one is the
United States. However, some countries are more developed than the others and are ranked
accordingly: United States is 10th, Brazil is 79th, China is 90th, Micronesia is 127th, and Nigeria is
152nd in the world (United Nations Development Programme, 2017).
Brazil
In Brazil, the northern region of the country is said to have 3.6-5.5% of the population
with diabetes and in the southern region 6.7-8.2% of the population has diabetes (Almeida-
Pititto, et al., 2015). The southern region is also the one that has a population with a higher
income, which would explain why they have a higher rate of diabetes, the population there can
afford to buy more food as well as food that is not necessarily healthy (Almeida-Pititto, et al.,
2015). According to Coutinho and Silva Jr. (2015), about 84.4% of the population in Brazil live
in urban areas and 42.6% live in the southern region. The populations that live in these areas are
at greater risk of getting T2DM due to being in an environment where everything is readily
available nearby, so they do not have to walk very far or farm for foods. As stated before, having
more money can also put a population at risk because they can afford more and less healthy
foods. About a third of those diagnosed with T2DM in Brazil were considered obese, about 40%
were considered overweight, and an estimated 41% of the population does not get enough
exercise to maintain proper (Coutinho & Silva Jr., 2015; Almeida-Pititto, et al., 2015). This
contributes to the theory that those with more money can eat more as well as those in urban areas
do not have to exercise as much, which is shown by Dugan (2016) to be an essential part in
helping maintain T2DM. The high intake of soft drinks, fatty or red meats, and the low intake of
fruits and vegetables account for the increase of body fat, which increases the body’s resistance
13
to insulin (Almeida-Pititto, et al., 2015). As for the health care for diabetes in Brazil, Almeida-
Pititto et. al. (2015) states that diabetes patients tend to be evaluated by primary care physicians,
however, these physicians feel as if they are not adequately trained to give education to patients
about how to care for their diabetes. Brazil does have a free health care system implemented and
it helps give those with diabetes the medical supplies needed to maintain their diabetes, but
sometimes it does not give them enough or meet the needs of the specific patient, so they have to
pay out of pocket for some treatment costs (Coutinho & Silva Jr. , 2015). This might prevent
patients from getting the proper treatments needed.
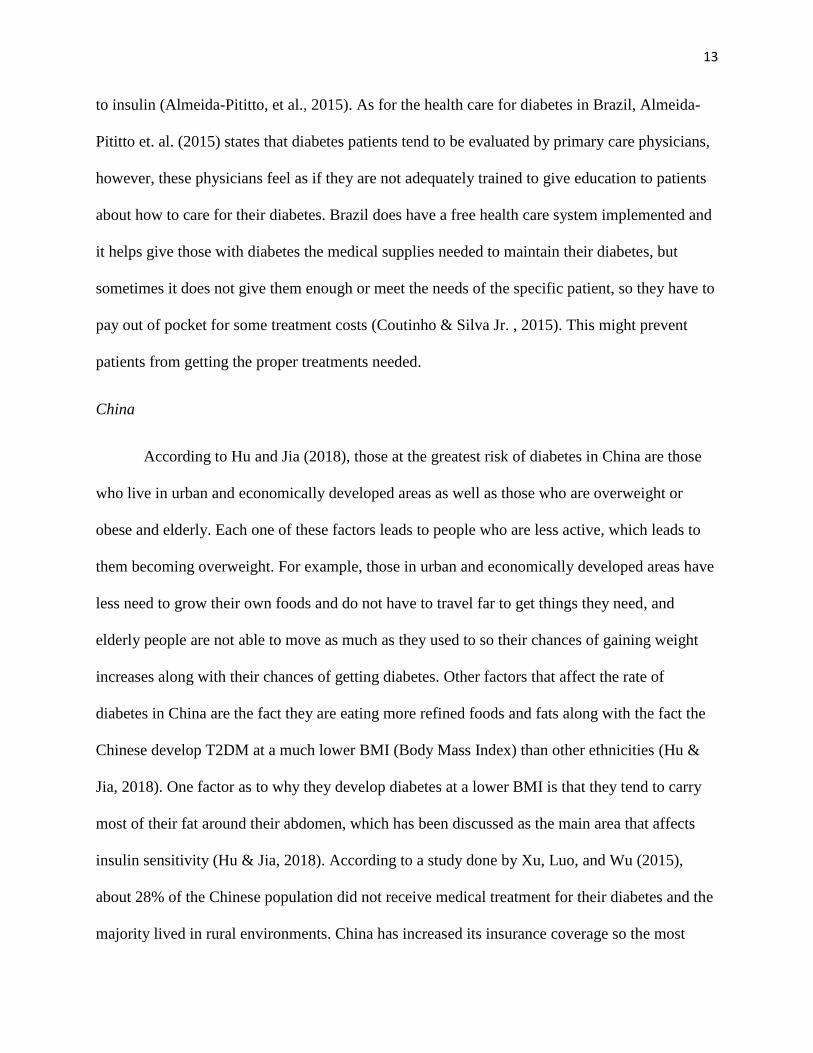
China
According to Hu and Jia (2018), those at the greatest risk of diabetes in China are those
who live in urban and economically developed areas as well as those who are overweight or
obese and elderly. Each one of these factors leads to people who are less active, which leads to
them becoming overweight. For example, those in urban and economically developed areas have
less need to grow their own foods and do not have to travel far to get things they need, and
elderly people are not able to move as much as they used to so their chances of gaining weight
increases along with their chances of getting diabetes. Other factors that affect the rate of
diabetes in China are the fact they are eating more refined foods and fats along with the fact the
Chinese develop T2DM at a much lower BMI (Body Mass Index) than other ethnicities (Hu &
Jia, 2018). One factor as to why they develop diabetes at a lower BMI is that they tend to carry
most of their fat around their abdomen, which has been discussed as the main area that affects
insulin sensitivity (Hu & Jia, 2018). According to a study done by Xu, Luo, and Wu (2015),
about 28% of the Chinese population did not receive medical treatment for their diabetes and the
majority lived in rural environments. China has increased its insurance coverage so the most

14
likely reason those in rural environments do not use diabetes treatments is due to the proximity
of health care centers (Xu, Luo, & Wu, 2015). However, the health care for diabetes in China is
poor, about 60% of those with diabetes go undiagnosed which is due to how large the Chinese
population is, the health care system cannot screen the entire population for prediabetes nor
identify high-risk groups systematically through blood glucose tests (Weng, et al., 2016). Since
the majority of the population can go without being diagnosed with prediabetes, they do not have
the opportunity to try to get it under control or reverse it, so it eventually turns into T2DM
(Weng, et al., 2016). The health care in general in China is good, but poor for diabetes, and this
is likely due to diabetes being a new epidemic they have not faced before in such a high
prevalence. The reason behind this epidemic is rapid economic development and the movement
of people from rural environments to urban ones (Hu & Jia, 2018).
Micronesia
Prior to World War II Micronesia was primarily a country that subsisted on fishing,
foraging, and some farming with little of the population being obese (Shmulewitz, et al., 2006).
However, after WWII the United States sent help in the form of westernized foods that were high
in fat and salt (Shmulewitz, et al., 2006). It was then after the Micronesian population started
consuming these foods that they became overweight and obese which lead to the prevalence of
diabetes increasing. Spain first colonized the country in 1886, and it has since been controlled by
other countries making it completely dependent on other countries for food and development
(Cassels, 2006). The United States has been helping them since WWII, but the foods being sent
are highly westernized which is not what the islanders’ bodies are used to consuming and the
development occurring has led to a more sedentary lifestyle in the population, both of which are
leading to the obesity epidemic in Micronesia as well as their high diabetes prevalence. Those

15
with lower incomes tend to consume the imported foods that are energy-dense, such as high-fat
meats and processed foods, and they cannot afford nutrient rich foods, like fish or complex
carbohydrates (Cassels, 2006). One issue with the health care system in Micronesia is there is no
link between health care centers (Ichiho, Anson, Keller, Lippwe, & Aitaoto, 2013). If a patient
were to switch to a different place to get treated, then the staff there would have no idea how the
patient was being treated at the other center which would cause difficulty with them deciding on
how to treat the patient. Another issue with their health care system is the limited number of
doctors on each island in ratio with the number of patients that need care (Post, 2010). The
doctors do not get enough time to counsel a patient properly, which could lead to patients with
diabetes not knowing how to properly care for their condition. Also, if a patient needs a more
specialized doctor or treatment, then they may have to travel to another island that has a health
care center that is more well equipped to treat them (Post, 2010). However, patients likely cannot
afford to do this, so they may go without treatments. Another problem is that the doctors are not
properly equipped to be able to diagnose patients, for example, they may be missing a
stethoscope or blood pressure machines (Post, 2010). Overall, the health care system in
Micronesia is not up to par with where it needs to be to treat the large number of cases of obesity
and diabetes.
Nigeria
Currently in Nigeria it is estimated that diabetes is prevalent in 1% of those living in rural
areas and 5-7% of those in urban areas (Ogbera & Ekpebegh, 2014). However, about half of the
total population lives in urban areas, so it seems the majority of diabetes cases in Nigeria will
occur in cities rather than out in the country (Ogbera & Ekpebegh, 2014). Inactivity can also
increase the number of cases since it can lead to obesity and this most often occurs in the urban

16
areas possibly because the people there do not have to work the land to grow their own foods to
survive, they can go to a store or merchant to buy foods (Azevedo & Alla, 2008). Some other
factors said to impact diabetes is whether a person is wealthy or poor. In Nigeria the wealthy
tend to have higher rates of diabetes, which is most likely due to the fact they can afford to buy
more food and food that is unhealthy, like desserts (Azevedo & Alla, 2008). The healthcare in
the country is sub-optimal since it is a developing country and as such the health insurance is not
fully set up, so the majority of the population will have to pay out of pocket to get medical help
(Ogbera & Ekpebegh, 2014). This may impact how often, or if at all, a person will receive
medical help for certain conditions, like diabetes, which may cause the conditions to become
worse and they may not receive the knowledge they need to care for their condition. According
to a study done by Tekola-Ayele, Adeyemo, and Rotimi (2013), a gene called PPARG contains
two alleles Pro12 and Ala12. The Ala12 allele is associated with increased insulin sensitivity
along with a lower BMI which protects against T2DM, however this allele is shown to be absent
or in very low amounts in Africans. The Pro12 allele is associated with increased receptor
activity which allows for a bigger fat storage and is found in Africans. The absence of Ala12 puts
Nigerians at risk of developing T2DM and the presence of Pro12 allows for them to survive
during periods of famine, however with the urbanization and westernization this allele is no
longer needed. Since the Pro12 allele is still present in the presence of abundant food sources
that are high in carbohydrates and fats, this leads to an increase in obesity and potentially
diabetes.
United States
In the United States some of the factors that affect rate of diabetes are the lack of physical
activity, increased consumption of sugar, and obesity, especially when the fat is mainly located

17
around the abdomen (Stokes & Preston, 2017). Other factors to consider are the rapidly
increasing senior population who cannot exercise as much as they used to and the wide range of
ethnicities that are part of the United States population. Some of these ethnicities, like African
Americans and Native Americans, are genetically more predisposed to getting diabetes so that
will impact the overall population percentage (Kulkarni, 2004). African Americans are almost
twice as likely to get T2DM than the rest of the United States population and part of that reason
is because of the foods they choose to eat (Kulkarni, 2004). These foods are referred to as “soul
foods” and are primarily consumed in the southern part of the country in rural and low-income
areas (Kulkarni, 2004). Examples of soul foods are deep fried meats, corn, starchy vegetables,
grains, and whole milk (Kulkarni, 2004). Each one of these foods are full of carbohydrates, fats,
cholesterol, and sodium all of which are not good for the body in excess amounts. Part of the
reason why patients will not stick to a diet health care plan is because the foods in the treatment
are unfamiliar to them (Kulkarni, 2004). Immigrants to the United States sometimes acclimate to
the culture here quickly and that includes the food. Rapidly changing from their traditional diet
to a more westernized one in the United States has led to an increased risk of chronic diseases
(Kulkarni, 2004). In the United States about 23% of people reported not having health insurance
and 17% reported not having had it for over a year (Casagrande & Cowie, 2012). Without health
insurance many people would not be able to afford going to the doctor, which could impact the
chances of those with diabetes getting the care they need (Casagrande & Cowie, 2012).
However, the ADA (American Diabetes Association) has placed a criteria list that requires
individuals who meet it to be tested for diabetes (Pratley, 2013). Some criteria on the list are
those who are overweight, family history of diabetes, ethnicity, signs of insulin resistance,
mother had gestational diabetes, or age at which puberty begins (Pratley, 2013). By testing

18
people who meet these criteria a physician may be able to diagnose them with prediabetes and
potentially stop the disease from progressing to diabetes. But sometimes the patients can remain
asymptomatic for a long time and so their prediabetes can turn into diabetes without them or
their doctor even knowing, so many people go undiagnosed (Pratley, 2013). As a result, almost a
quarter of the total diabetic population, or six million, are undiagnosed and the almost 60 million
people that are prediabetic may develop T2DM without realizing it (Colberg, et al., 2010).
Discussion
As shown in Figure 2, of the five countries examined, Nigeria has the lowest diabetes
rate, but China has the lowest obesity rate. However, China’s diabetes rate being higher than
their obesity rate may be due to the fact Chinese can get diabetes at lower BMIs because they
tend to carry their fat around their abdomen which decreases insulin sensitivity (Hu & Jia, 2018).
Micronesia has the highest diabetes and obesity rate, which is due to recent innovations of the
islands becoming westernized, leading to the islanders consuming foods that they did not have in
previous years, such as refined sugars and processed meats. This westernization, along with their
decreased physical activity, could be what is causing the increasing obesity rate of the country,
which is leading to more T2DM diabetes cases developing. Another factor that could affect them
having a higher rate of diabetes is because the country is comprised of many small islands, so it
is sometimes difficult to get properly diagnosed and treated for their condition. If they do not
have the proper medical center on their island, then they would have to travel by boat to another
island to get treated and many cannot afford to do this. In the countries studied, the United States
has the second highest percentage of diabetes cases and obesity rates, which is probably due to
the increasing senior population who cannot exercise like they used to, the increase of
immigrants who conform to the westernized foods, and the types of food widely available, like

19
fast food or “soul foods”. These foods are not the best due to them being heavy in fat, sodium,
and cholesterol of which could cause CVD (Kulkarni, 2004). Finally, China and Brazil are in the
middle with their percentages of diabetes being very close at 10.6% and 10.2%. China and Brazil
having similar percentages of those with diabetes could be due to them being close to each other
in terms of having high development. Micronesia has the second lowest development out of the
five countries, but they are dependent on the United States for many things, food included.
Because they depend on the United States for food, they are consuming foods that are highly
westernized and are high in fats and sugar. This new diet has caused the local population to
become obese very quickly and due to lack of proper health care diagnosing prediabetes more
diabetes cases occur. Whereas Nigeria is the lowest in terms of development, which could be
what is keeping their obesity and diabetes rates low. They have not been subjected to large
amounts of western food, except the wealthy, which could be why they tend to have higher rates
of diabetes compared to those in rural environments or who are poor.
Figure 2. Percent of the population that has diabetes and the percent that is obese.

20
Figure 3 shows that China and Brazil have quite similar calorie compositions, although
there are slight differences in percent of total calories coming from carbohydrates and fat.
However, the difference in calorie composition between China and Brazil is only by 1-3%,
unlike the United States and Nigeria which have a much higher caloric composition difference of
3-16%. This could be due to Nigeria not consuming as much western food, which is the staple
diet in the United States. Also, Nigeria is considered the least developed country out of the five
and the United States is the most developed, which will impact the foods available to the
population. The recommended levels of carbohydrates, fats, and protein are 45-65%, 20-35%,
and 10-35%, Nigeria consumes 4% more carbohydrates and 1% less protein than the
recommended amounts while consuming fat within the recommended range. However, the types
of carbohydrates Nigerians consume are most likely more complex rather than simple due to
them being a less developed country. Complex carbohydrates, like whole vegetables and fruit,
contain fiber which helps the body to slow down the spike in blood glucose levels after
consuming food, simple carbohydrates do not contain fiber. The other countries being more
developed likely have more simple carbohydrates in their diets, so even though they fall into the
guideline for daily carbohydrates, they are probably not consuming enough complex
carbohydrates the body requires. Nigeria consumes Even though the other four countries fall into
each of the guidelines for daily percentage of calories coming from carbohydrates, fat, and
protein, they are consuming more calories than Nigeria, so their daily percentages of calories
equates to a larger number of calories for each of the three groups. So, if the United States is
consuming 3,770 calories and 38% comes from fat, then they are consuming 1,433 calories of
fat. Whereas if Nigeria is consuming 2,710 calories and 22% comes from fat, they are consuming
only 596 calories of fat. The United States is consuming almost three times as much fat as

21
Nigeria, therefore the number of calories consumed per day can be very crucial to a diet,
especially when most of them come from unhealthy foods.
Protein and fat are the other two nutrients that the body can use for energy, however, it
prefers carbohydrates as the primary source because they are easier for the body to break down
and use. High amounts of fat in the diet are not good for the body because they will be stored in
the body, which can be harmful if primarily stored around the abdomen. High amounts of fat can
also circulate through the blood and can potentially lead to cardiovascular disease which is a risk
factor with T2DM (Battle, 2009). Figure 3 shows the United States consumes the highest amount
of fat with Micronesia and Brazil having the second most. The United States and Micronesia
have the highest rates of diabetes. While the United States is the most developed and Micronesia
is the second least they share the same diet due to Micronesia obtaining food from the United
States. Brazil is the second most developed, so they have more urban areas compared to
Micronesia, China, and Nigeria, which would allow the populations there to be less physically
active. The urban populations do not have to travel far to obtain food or get health care. Also, the
majority of the diabetes cases in Brazil tend to be in the southern region of the country where
most of the wealthy population lives. This will also affect the rate of diabetes and obesity
because the wealthy are able to buy more food that tends to be less healthy, whereas the poorer
population cannot afford those foods, usually only native foods which are better for them. China
consumes the second least amount of fat; however, the Chinese are genetically predisposed to
getting diabetes at lower BMIs. Nigerians consume the least amount of fats which would help
explain partly why they have the lowest rate of diabetes. They also have the least amount of
people living in urban areas, possibly due to them being less developed, which is shown to have
an increase of diabetes cases possibly due to people not having to travel far for food, food is

22
widely available, and health care is more accessible. Nigeria and Micronesia have the lowest
percentages of population living in urban areas at 49.4% and 22.5% respectively with the other
three countries having above 80% of their population in urban areas (Central Intelligence
Agency, 2017). Micronesia’s percentage is lower; however, they tend to eat more imported
western foods than Nigeria does.
Figure 3. Percent of calories that are consumed daily as protein, fat, or carbohydrates.
As seen in Figure 4, Brazil consumes the most red meats, whereas Nigeria consumes the
least. Studies have shown that an increased consumption of red meats has been linked to an
increased risk of T2DM (Micha, Michas, & Mozaffarian, 2012), so Nigeria consuming the least
amount could be one reason the number of diabetes cases is so low. As for processed meats, the
United States consumes the most and China consumes the least. Processed meats are also bad for
those with diabetes because when they are processed they gain a lot of salts or other substances,
like nitrates, that help prolong their shelf life (Micha, Michas, & Mozaffarian, 2012). Nitrates
used as preservatives have been shown to cause insulin resistance, so the presence of that in

23
processed meats would be harmful to populations at risk for diabetes (Micha, Michas, &
Mozaffarian, 2012). The large consumption of processed meats by Americans could explain why
their obesity and diabetes rates are higher than most. However, China also has a somewhat high
diabetes percentage, but they consume the least amount of processed meats. Nigeria is second
lowest, which correlates with their low diabetes and obesity rates. That would also mean,
however, that Micronesia should consume the most processed meats to correlate with their high
rates, but this does not appear to occur. But, Micronesia has just recently begun consuming
processed meats due to their dependence on the United States and most of the population
consumes these foods because they are cheaper. With most of the population consuming these
processed meats, there should then be an increase of diabetes cases to correlate.
Figure 4. Amount of red and processed meats consumed per day (g).
Figure 5 shows the daily consumption of drinks in each country and that they are
dramatically different due to different regulations, processing, and culture. Sugared drinks have
no nutritional value and only provide the body with simple carbohydrates and calories, which
need to be limited. Juice has some nutritional values, such as certain vitamins, but they mostly

24
contain simple carbohydrates and calories like sodas. Milk usually contains proteins, simple
carbohydrates, and sometimes fats. Dairy products have been linked to a lower risk of T2DM
and one of the main vitamins, vitamin D, has been shown to increase insulin secretion (Martini &
Wood, 2009). The United States consumes the most in all three categories of beverages, whereas
China consumes the least. Consuming the most sugared drinks and juice could be one reason the
United States has such high rates of T2DM but consuming the most milk should be good because
it promotes insulin secretion. Nigeria consumes the second least amount of sugared drinks,
which could be the reason their rates are lower. However, they consume some of the least
amounts of milk, yet they have lower diabetes cases than the other countries. So, these drinks
may not be a big contributing factor affecting the rate of diabetes.
Figure 5. Amount of sugared drinks, juice, and milk consumed per day (g).
Figure 6 shows that fruits, vegetables, and seafoods are consumed in varying amounts in
each country. Fruits are good to have in the diet as they provide the body with some fiber and
complex carbohydrates. Micronesia consumes the most fruit and China consumes the least. Since
fruit is a good food to consume, one would think Micronesia should have a lower diabetes rate

25
than the other countries, however, consuming large quantities of fruit can have a reverse effect
and cause a person’s diabetes to become worse. This is due to fruit containing fructose, which is
good for the body, but in excess can cause fructose to build up in the body and be broken down
to glucose, therefore leading to high blood sugar. Next is vegetables which provide the body with
fiber and carbohydrates. Both are good to have in a diet, although the amount and type of
carbohydrates should be monitored. China consumes the most vegetables with Brazil consuming
the least. China has one of the higher percentages of diabetes which does not correlate with high
consumption of vegetables because they are high in fiber. Fiber is good for those with diabetes
because it can help slow down the glycemic effects of glucose consumed. Brazil consumes less
vegetables which could be why they have higher rates of diabetes. Higher consumption of
vegetables should equate to a lower rate of diabetes in which case Nigeria should be the one with
the higher vegetable consumption and Micronesia with the lowest. Finally, seafood contains
large amounts of protein, which is essential in the diet for type 2 diabetics, so seafood should be
a good food to have in a diet. Micronesia consumes the most seafood and the United States
consumes the least. Studies have shown that a diet high in protein is beneficial to those with
T2DM because it can decrease the glucose concentration in the blood (Gannon, Nuttall, Saeed,
Jordan, & Hoover, 2003). If the diet is low in carbohydrates and high in proteins and fats, then
the person could potentially control their diabetes without medications. The large consumption
of seafood by Micronesia could be the cause of its higher rates because, as stated by DeBruyne,
protein is important to have in a diet, but in very high amounts it can be dangerous and cause
renal problems. However, the United States consumes the least amount of seafood, which could
be just as bad as consuming too much because they are not ingesting as much protein from
seafood as the other countries and that could be a reason they have the second highest rate

26
behind Micronesia. But, the United States was shown to have been in the appropriate range for
protein consumption, so their lack of seafood consumption is likely not significant enough to
contribute to their diabetes rate.
Figure 6. Amount of fruit, vegetables, and seafood consumed per day (g).
Figure 7 shows the last food groups are legumes, whole grains, and nuts and seeds.
Legumes tend to be high in complex carbohydrates, fiber, and protein, which are all important in
a diet. Brazil consumes the most legumes with Micronesia consuming the least. The low levels
of legume consumption could explain why Micronesia has a high diabetes rate because this
means they are not getting as much protein and fiber as the other countries from this food.
However, Micronesia is still receiving plenty of protein and fiber from other foods, like milk,
meat, and seafood. Whole grains are also important in a diet because they provide the body with
fiber and some protein. Fiber is shown to be important in glycemic control, so the number of
diabetes cases should decrease in countries with high fiber diets. The United States consumes the
most whole grains with Nigeria close to the same amount. China consumes the least whole
grains. For Nigeria, the large consumption of whole grains makes sense because an increase in

27
consumption should equal a decrease in diabetes cases. Although it does not make sense for the
United States because they also consume large quantities of whole grains, yet they have the
second highest rate. Nuts and seeds are also important in a diet because they are full of protein,
fiber, and unsaturated fats. Nigeria consumes the most nuts and seeds and Brazil consumes the
least. Consuming nuts and seeds could be another reason Nigeria has the lowest obesity and
diabetes rate out of the five countries discussed. Nuts contain fats; however, unsaturated fats
have been shown to increase insulin sensitivity especially when they take the place of saturated
fats (Riserus, Willett, & Hu, 2009).
Figure 7. Amount of legumes, whole grains, and nuts and seeds consumed per day (g).
Outside of diet another factor to consider when comparing diabetes between countries is
the access to health care. Each of the five countries has a health care program set in place,
however, the establishment of each of them is at varying levels. In Brazil there is a free health
care program set in place so that the people can get treated when needed. A physician is the first
person someone with suspected diabetes sees. But, the physicians do not feel well trained enough
to treat those with diabetes, so this may put some of the population at risk of either not getting

28
diagnosed with prediabetes early enough to maintain it or those who have diabetes not getting
proper treatment. Also, the health care program does not always cover the costs of treatments or
medical supplies needed (Coutinho & Silva Jr. , 2015). So, the people have to pay out of pocket
to cover it, which could possibly prevent some who are poor from getting the treatments needed
to maintain their health. In China the health care system is poor for those with diabetes, primarily
due to the vast size of the population. The country cannot systematically go through and screen
those at risk for T2DM and so those who have prediabetes may not even know it therefore
causing them to go into full diabetes (Weng, et al., 2016). If they were diagnosed earlier, then
they may have been able to prevent their diabetes through diet and exercise changes. Another
reason diabetes may be high in China is the access to their health care. Those who are in rural
areas have difficulty receiving treatment for their disease because most facilities are in urban
areas. Diabetes is also a new epidemic for those in China due to their increase in economic
development affording them access to Western foods (Hu & Jia, 2018). Also, since about 60% of
those with diabetes go undiagnosed the total percentage of the country could actually be much
higher than reported. This could change the results found and might allow for a more concrete
answer as to whether or not global diets impact diabetes rates. In Micronesia the health care
system is disorganized due to the country being comprised of many small islands. The health
care facilities are not linked from island to island, so if a patient switched to another facility on
another island the health care staff would not know what previous treatments they have had.
Also, there is a limited number of doctors on each island, so visits are very quick, so the doctors
can see as many patients as they can (Ichiho, Anson, Keller, Lippwe, & Aitaoto, 2013). This
prevents an in-depth discussion of a patient’s treatment plan and so many may not know how to
properly care for their diabetes, therefore causing their disease to progress. Location of facilities

29
is another issue. Some islands may not have a big enough facility trained to treat someone, so the
patient would have to travel to one of the other islands to receive proper treatment (Post, 2010).
However, the patients may not be able to afford to do so, which would also prevent them from
getting proper treatments and learning how to care for their condition. In Nigeria the health care
system is still being established due to the country being low in development. As a result, there is
no health insurance plan set in place, which will cause people to have to pay out of pocket for
treatments and medications (Ogbera & Ekpebegh, 2014). This alone would prevent many from
getting properly diagnosed, causing diabetes to progress in many people. Also, the introduction
of Westernized foods in Nigeria has lead to an increase in diabetes diagnoses. This is due to a
drastic change from their normal cultural diet because it is high in fat and sugar, also it is more
widely available, so they can eat more than what their ancestors were used to (Tekola-Ayele,
Adeyemo, & Rotimi, 2013). In the United States the health care system is fully established,
however, almost a quarter of the population does not have health insurance (Casagrande &
Cowie, 2012). This would prevent many from getting treatments when needed and if they have
diabetes, then they would have to pay out of pocket for their medication. With the price of
medication this is likely to prevent many from getting the proper medications needed to help
control their disease. The ADA has set several criteria for diabetes testing, and if a person meets
any of these criteria, then they get screened to see if they have the disease (Pratley, 2013).
However, this is flawed because many people remain asymptomatic for several years so by the
time the disease is caught it has already progressed from prediabetes to diabetes. So, the health
care in each of the countries has a big impact on the number of diabetes cases due to people not
getting properly diagnosed, not being able to access a proper facility, or not being able to afford
treatment.

30
Each of the five countries also have other factors that affect their diabetes rates. In Brazil,
most of the cases of diabetes occurs in the southern region of the country, which contains the
population with a higher income than the rest of the country. Most of the cases tend to occur in
urban areas, which is also seen in China and Nigeria. Each of the three countries have higher
rates of diabetes in urban cities and in those who are rich. This is most likely due to the people in
urban areas do not have to travel far to obtain food as well as they do not have to grow it, they
can go to a store or market and buy food. The reliance on public transportation and grocery
stores with imported foods has led to the population to become physically inactive and
overweight which can eventually lead to diabetes. The rich people having higher rates of
diabetes also makes sense because they are able to buy Western foods available as well as more
food in general. This change in diet can lead to an increase of fat storage in the body and when
stored around the abdomen can increase insulin resistance causing diabetes to occur. Micronesia
has been dependent on other countries since the Spanish first found it, which has caused a
dramatic change in their diets. This is especially true after WWII when the United States gave
aid in the form of Western foods that were high in fat and salts. Along with the development on
the island causing sedentary lifestyles, the islanders slowly became obese which eventually led to
diabetes to begin occurring. The split between rich and poor is also seen here. The poor tend to
consume energy-dense foods and cannot afford foods good for their diet, like fish or complex
carbohydrates. Factors that affect the rate of diabetes in the United States is the rapidly growing
population of senior citizens and sedentary people along with the number of immigrants. Senior
citizens cannot exercise like they used to, so they can be more predisposed to getting diabetes
and with the number of them growing it contributes to the increase in the percentage of diabetes.
Also, as technology progresses more people tend to stay indoors playing with the technology

31
rather than being outside moving around leading to younger people being able to develop this
disease (Nightingale, et al., 2017). This change in physical activity could be one of the reasons
for the high rate of diabetes in the United States. Immigrants coming to the United States affects
the rate of diabetes because they conform to the Western diet quickly leaving behind their
traditional diets. Changing from a traditional diet to one full of fats and sugars has been shown to
lead to an increase of chronic diseases, like diabetes. Another problem in several of the countries
is that some ethnicities are genetically more predisposed to getting diabetes. Chinese people will
get diabetes at much lower BMIs than those who are Caucasian, which is due to the Chinese
carrying most of their fat around their abdomen. Africans are also at higher risk of getting
diabetes when they stray from their traditional diet to a Western diet. This is due to their
ancestors not having access to a lot of food, so they did not eat often and now that today’s
Africans have more access to food they can eat more. As a result, their bodies may reject this
high caloric diet, therefore causing health problems possibly like diabetes.
After analyzing all the data there does not appear to be any definitive answer as to what
parts of the diets affect diabetes rates even though Micronesia’s percentage of diabetes is almost
20 times that of Nigeria. It must be due to how the different parts of the diets work with one
another and how much there is of each dietary component, as well as other factors, such as
physical activity, genetics, and obesity rates. There are some parts of diets that seem to have
clear differences between the countries with high rates and low rates, like the consumption of
nuts and seeds and red meats. So, it seems global diets do have an impact of diabetes rates,
however, the information I have found does not show a correlation between the diet of each
country and their percentage of diabetes. Other factors could explain why countries have varying
diabetes rates, like certain ethnic groups being more prone to getting diabetes due to genetics or a

32
sudden change in diet due to third world countries becoming modernized and adapting a western
diet. Also, in several of the countries health care is not the best and so many people may not be
able to get treated for their condition which may make the reported percentages to be skewed. As
a result, the percentages presented in this paper may be wrong and the answer as to whether or
not global diets affect diabetes rates might be able to be found, however we will not know this
until a more thorough survey is performed in the countries.
Conclusion
The main question throughout this paper was, “do global diets affect the rates of
diabetes?” This question remains unanswered due to there being no definitive answer based on
the research found. A few differences that were noticeable were the consumption of red meats,
seafood, and nuts and seeds in Nigeria, Micronesia, and Brazil. Micronesia has the highest rate
of diabetes along with the highest rate of obesity, which could be one of the causes for the
diabetes rate. Meanwhile, Nigeria has the lowest rate of diabetes. I looked at the number of
calories consumed each day, as well as the composition of the calories, like carbohydrates,
protein, and fats. I also looked at the consumption of 11 different food groups consumed per day
in grams. Something I could do in the future would be to compare the diets of these countries
from what they are today and what they used to be 100 years ago before most of them became
westernized or I could look at what the diets are like 20 years in the future and compare them to
now.

33
References Almeida-Pititto, B. d., Dias, M. L., Franco de Moraes, A. C., Ferreira, S. R., Franco, S. R., & Eliaschewitz, F.
G. (2015, January 5). Type 2 diabetes in Brazil: epidemiology and management. Diabetes,
Metabolic Syndrome and Obesity: Targets and Therapy, 8, 17-28. doi:10.2147/DMSO.S72542
Azevedo, M., & Alla, S. (2008, October-December). Diabetes in Sub-Saharan Africa: Kenya, Mali,
Mozambique, Nigeria, South Africa and Zambia. International Journal of Diabetes in Developing
Countries, 28(4), 101-108. doi:10.4103/0973-3930.45268
Battle, C. U. (2009). Essentials of Public Health Biology: A Guide for the Study of Pathophysiology. (R.
Riegelman, Ed.) Sudbury: Jones and Bartlett Publishers. Retrieved May 16, 2018, from
https://books.google.com/books?id=rvK9L_oXzdIC&pg=PA129&lpg=PA129&dq=fat+circulating+i
n+blood+cardiovascular+disease+diabetes&source=bl&ots=uPH29QY0oD&sig=PHB6sA9t1S9koC
zDEHZv0fR7SZw&hl=en&sa=X&ved=0ahUKEwiU_NiS34nbAhVIyoMKHczzDY84ChDoAQg5MAM#v
=onepage&q=
Bouche, C., Serdy, S., Kahn, C. R., & Goldfine, A. B. (2004, October 1). The Cellular Fate of Glucose and Its
Relevance in Type 2 Diabetes. Endocrine Reviews, 25(5), 807-830.
doi:https://doi.org/10.1210/er.2003-0026
Casagrande, S. S., & Cowie, C. C. (2012, November). Health Insurance Coverage Among People With and
Without Diabetes in the U.S. Adult Population. Diabetes Care, 35(11), 2243-2249.
doi:https://doi.org/10.2337/dc12-0257
Cassels, S. (2006, July 11). Overweight in the Pacific: links between foreign dependence, global food
trade, and obesity in the Federated States of Micronesia. Global Health, 2(10).
doi:10.1186/1744-8603-2-10

34
Central Intelligence Agency. (2017, January 1). The World Factbook: Urbanization. Retrieved May 16,
2018, from Central Intelligence Agency: https://www.cia.gov/library/publications/the-world-
factbook/fields/2212.html
Chatterjee, S., Khunti, K., & Davies, M. J. (2017, June). Type 2 Diabetes. The Lancet, 389(10085), 2239-
2251. doi:https://doi-org.libproxy.library.wmich.edu/10.1016/S0140-6736(17)30058-2
Colberg, S. R., Sigal, R. J., Fernhall, B., Regensteiner, J. G., Blissmer, B. J., Rubin, R. R., . . . Braun, B. (2010,
December). Exercise and Type 2 Diabetes. Diabetes Care, 33(12), 147-167. Retrieved May 12,
2018, from https://www.ncbi.nlm.nih.gov/pmc/articles/PMC2992225/pdf/zdce147.pdf
Cordain, L., Eaton, S. B., Sebastian, A., Mann, N., Lindeberg, S., Watkins, B. A., . . . Brand-Miller, J. (2005,
February). Origins and evolution of the Western diet: health implications for the 21st century.
The American Journal of Clinical Nutrition, 81(2), 341-354.
doi:https://doi.org/10.1093/ajcn.81.2.341
Country Comparison: Obesity. (2016). Retrieved from Central Intelligence Agency:
www.cia.gov/library/publications/the-world-factbook/rankorder/2228rank.html
Coutinho, W. F., & Silva Jr. , W. S. (2015). Diabetes Care in Brazil. Annals of Global Health, 81(6), 735-
741. doi:https://doi.org/10.1016/j.aogh.2015.12.010
Daries, H. (2012). Carbohydrates. In H. Daries, Nutrition for Sport and Exercise: A Practical Guide (pp. 58-
61). John Wiley & Sons, Inc. Retrieved March 5, 2018, from https://ebookcentral-proquest-
com.libproxy.library.wmich.edu/lib/wmichlib-ebooks/detail.action?docID=995966.
DeBruyne, L. K., Pinna, K., & Whitney, E. (2016). Nutrition and Diet Therapy. Boston: Cengage Learning.
Deed, G., Barlow, J., Kawol, D., Kilov, G., & Sharma, A. (2015, May). Diet and diabetes. Australian Family
Physician, 44(5), 288-292. Retrieved March 5, 2018, from https://search-proquest-

35
com.libproxy.library.wmich.edu/docview/1680425909/fulltextPDF/2B3B6470DB044027PQ/1?ac
countid=15099
Diabetes and Obesity. (2017). Retrieved from Diabetes.co.uk: www.diabetes.co.uk/diabetes-and-
obesity.html
Dietary Intake of Foods and Nutrients by Country. (2010). Retrieved from Global Nutrition and Policy
Consortium : http://www.globaldietarydatabase.org/dietary-data-by-country.html
Drewnowski, A., & Popkin, B. M. (1997, February). The Nutrition Transition: New Trends in the Global
Diet. Nutrition Reviews, 55(2), 31-43. Retrieved March 25, 2018, from https://onlinelibrary-
wiley-com.libproxy.library.wmich.edu/doi/epdf/10.1111/j.1753-4887.1997.tb01593.x
Dugan, J. A. (2016, January). Exercise recommendations for patients with type 2 diabetes. Journal of the
American Academy of Physician Assistants, 29(1), 13-18.
doi:10.1097/01.JAA.0000475460.77476.f6
FAOSTAT. (2011). Retrieved from Food and Agricultural Organization of the United Nations:
http://faostat.fao.org/
Food Composition Database. (2017). Retrieved from United States Department of Agriculture:
ndb.nal.usda.gov/ndb/search/list
Gannon, M. C., Nuttall, F. Q., Saeed, A., Jordan, K., & Hoover, H. (2003, October). An increase in dietary
protein improves the blood glucose response in persons with type 2 diabetes. The American
Journal of Clinical Nutrition, 78(4), 734-741. doi: https://doi.org/10.1093/ajcn/78.4.734
Gross, L. S., Li, L., Ford, E. S., & Liu, S. (2004, May 1). Increased consumption of refined carbohydrates
and the epidemic of type 2 diabetes in the United States: an ecologic assessment. The American
36
Journal of Clinical Nutrition, 79(5), 774-779. Retrieved March 5, 2018, from
https://academic.oup.com/ajcn/article/79/5/774/4690186
Haukaas, T., Giskeodegard, G. F., Euceda, L. R., & Bathen, T. F. (2017). Metabolic Portraits of Breast
Cancer by HR MAS MR Spectroscopy of Intact Tissue Samples. Metabolites, 7(18), 1-16.
doi:10.3390/metabo7020018
Hu, C., & Jia, W. (2018, January). Diabetes in China: Epidemiology and Genetic Risk Factors and Their
Clinical Utility in Personalized Medication. Diabetes, 67(1), 3-11.
doi:https://doi.org/10.2337/dbi17-0013
Ichiho, H. M., Anson, R., Keller, E., Lippwe, K., & Aitaoto, N. (2013, May). An Assessment of Non-
Communicable Diseases, Diabetes, and Related Risk Factors in the Federated States of
Micronesia, State of Pohnpei: A Systems Perspective. Hawai'i Journal of Medicine & Public
Health, 72(5), 49-56. Retrieved March 24, 2018, from
https://www.ncbi.nlm.nih.gov/pmc/articles/PMC3689464/pdf/hjmph7205_S1_0049.pdf
Jenkins, D. J., Jenkins, A. L., Wolever, T. M., Thompson, L. H., & Rao, A. V. (1986, February). Simple and
Complex Carbohydrates. Nutrition Reviews, 44(2), 44-49. Retrieved March 5, 2018
Kulkarni, K. D. (2004). Food, Culture, and Diabetes in the United States. Clinical Diabetes, 22(4), 190-192.
Retrieved March 24, 2018, from
http://citeseerx.ist.psu.edu/viewdoc/download?doi=10.1.1.523.1565&rep=rep1&type=pdf
Martini, L. A., & Wood, R. J. (2009). Milk intake and the risk of type 2 diabetes mellitus, hypertension
and prostate cancer. Arquivos Brazileiros de Endocrinologia & Metabologia, 53(5), 688-694.
Retrieved April 5, 2018, from
https://pdfs.semanticscholar.org/9e29/f51f8fea2193d0839973b767b97053ba085d.pdf

37
Micha, R., Michas, G., & Mozaffarian, D. (2012, December). Unprocessed Red and Processed Meats and
Risk of Coronary Artery Disease and Type 2 Diabetes - An Updated Review of the Evidence.
Current Atherosclerosis Reports, 14(6), 515-524. doi:10.1007/s11883-012-0282-8
Newsholme, E., & Dimitriadis, G. (2001). Integration of biochemical and physiologic effects of insulin on
glucose metabolism. Experimental and Clinical Endocrinology & Diabetes(109), 122-134.
doi:https://doi.org/10.1055/s-2001-18575
Nightingale, C. M., Rudnicka, A. R., Donin, A. S., Sattar, N., Cook, D. G., Whincup, P. H., & Owen, C. G.
(2017, March). Screen time is associated with adiposity and insulin resistance in children. BMJ,
1-5. doi:10.1136/archdischild-2016-312016
Ogbera, A. O., & Ekpebegh, C. (2014, December 15). Diabetes mellitus in Nigeria: The past, present and
future. World Journal of Diabetes, 5(6), 905-911. doi:10.4239/wjd.v5.i6.905
Post, D. C. (2010, April). A Perspective on Health Care Development in Micronesia. Pacific Health Dialog,
16(1), 181-184. Retrieved March 24, 2018, from
http://pacifichealthdialog.org.fj/volume16_no1/A20Perspective20on20Health20Care.pdf
Pratley, R. E. (2013, September). The Early Treatment of Type 2 Diabetes. The American Journal of
Medicine, 126(9), S2-S9. doi:https://doi.org/10.1016/j.amjmed.2013.06.007
Regions and Members. (2017). Retrieved from International Diabetes Federation: www.idf.org/our-
network/regions-members.html
Riserus, U., Willett, W. C., & Hu, F. B. (2009, January). Dietary fats and prevention of type 2 diabetes.
Progress in Lipid Research, 48(1), 44-51. doi:10.1016/j.plipres.2008.10.002
Shmulewitz, D., Heath, S. C., Blundell, M. L., Han, Z., Sharma, R., Salit, J., . . . Friedman, J. M. (2006,
March 7). Linkage analysis of quantitative traits for obesity, diabetes, hypertension, and

38
dyslipidemia on the island of Kosrae, Federated States of Micronesia. Proceedings of the
National Academy of Sciences of the United States of America, 103(10), 3502-3509.
doi:10.1073/pnas.0510156103
Sigal, R. J., Kenny, G. P., Wasserman, D. H., Castaneda-Sceppa, C., & White, R. D. (2006, June). Physical
Activity/Exercise and Type 2 Diabetes. Diabetes Care, 29(6), 1433-1438.
doi:https://doi.org/10.2337/dc06-9910
Stokes, A., & Preston, S. H. (2017, August). The contribution of rising adiposity to the increasing
prevalence of diabetes in the United States. Preventive Medicine, 101, 91-95.
doi:https://doi.org/10.1016/j.ypmed.2017.05.031
Tauber, R., Reutter, W., & Gerok, W. (1987). Roles of membrane glycoproteins in mediating trophic
responses. Gut, 28, 71-77. Retrieved May 14, 2018, from
https://www.ncbi.nlm.nih.gov/pmc/articles/PMC1434538/
Tekola-Ayele, F., Adeyemo, A. A., & Rotimi, C. N. (2013, November). Genetic epidemiology of type 2
diabetes and cardiovascular diseases in Africa. Progress in Cardiovascular Diseases, 56(3), 1-17.
doi:10.1016/j.pcad.2013.09.013
United Nations Development Programme. (2017, March 21). Human Development Reports. Retrieved
April 2, 2018, from United Nations Development Programme: http://hdr.undp.org/en/countries
Venhaus, A., & Chantelau, E. (1988, March). Self-selected unrefined and refined carbohydrate diets do
not affect metabolic control in pump-treated diabetic patients. Diabetologia, 31(3), 153-157.
Retrieved March 5, 2018, from https://link.springer.com/content/pdf/10.1007/BF00276848.pdf

39
Weng, J., Ji, L., Jia, W., Lu, J., Zhou, Z., Zou, D., . . . Yang, W. (2016, July). Standards of care for type 2
diabetes in China. Diabetes/Metabolism Research and Reviews, 32(5), 442-458.
doi:10.1002/dmrr.2827
Wilcox, G. (2005, May). Insulin and Insulin Resistance. The Clinical Biochemist Reviews, 26(2), 19-39.
Retrieved May 14, 2018, from https://www.ncbi.nlm.nih.gov/pmc/articles/PMC1204764/
World Health Organization. (2017, November). Diabetes. Retrieved from World Health Organization:
http://www.who.int/mediacentre/factsheets/fs312/en/
Xu, H., Luo, J., & Wu, B. (2015, March). Self-reported diabetes treatment among Chinese middle-aged
and older adults with diabetes: Comparison of urban residents, migrants in urban settings, and
rural residents. International Journal of Nursing Sciences, 2(1), 9-14.
doi:https://doi.org/10.1016/j.ijnss.2015.01.005