Embed Size (px)
Citation preview
ISSN: 1439-2305
Number 115– October 2010
Globalization, Economic Freedom and
Human Rights
Axel Dreher
Martin Gassebner
Lars-H. R. Siemers
Globalization, Economic Freedom and Human Rights
Axel Dreher a
Martin Gassebner b
Lars-H. R. Siemers c
October 2010 Abstract Using the KOF Index of Globalization and two indices of economic freedom, we empirically analyze whether globalization and economic liberalization affect governments’ respect for human rights using a panel of 106 countries over the 1981-2004 period. According to our results, physical integrity rights significantly and robustly increase with globalization and economic freedom, while empowerment rights are not robustly affected. Due to the lack of consensus about the appropriate level of empowerment rights as compared to the outright rejection of any violation of physical integrity rights, the global community is presumably less effective in promoting empowerment rights. Keywords: Human Rights, Globalization, Economic Freedom, Liberalization JEL-Codes: D78, F55, K10, P48 a Georg-August University Goettingen, Platz der Goettinger Sieben 3, 37073 Goettingen, Germany, KOF Swiss Economic Institute, Switzerland, CESifo, and IZA, Germany. E-mail: [email protected] b ETH Zurich, KOF Swiss Economic Institute, Weinbergstrasse 35, CH-8092 Zürich, Switzerland, CESifo, Germany. E-mail: [email protected] c RWI Essen – Institute for Economic Research, Hohenzollernstraße 1-3, 45128 Essen, Germany. E-mail: [email protected]
2
1. Introduction
At the beginning of the 21st century, governments’ disrespect for human rights is still
evident in all regions of the world. Human rights violations continue to be the norm
rather than the exception. According to Amnesty International (2006), millions of people
worldwide are still denied fundamental rights. That being said, governments’ respect for
human rights is higher in some countries than in others and over the last few decades
improvements have been visible in many of these countries. At the same time,
globalization and economic freedom has had dramatic consequences on policies and
outcomes around the world.1 In this paper, we argue that economic freedom and
globalization are important determinants of governments’ respect for human rights.
Competition between economies has become tougher and expanded to an unprecedented
worldwide level. Global investors in financial markets exploit even marginal differences
in the rates of return and thus generate pressure on local governments. This global
development is sometimes viewed as being responsible for disenfranchisement,
exploitation, and other forms of human rights abuses (e.g., Rabet 2009). On the other
hand, improvements in human rights are sometimes attributed to the spread of liberal
ideas, which is one of the key dimensions of globalization (e.g., Rosenau 2003).
We extend the theoretical perspective on the determinants of human rights
practice by Poe and Tate (1994) to include globalization and economic freedom. We then
empirically investigate whether these aspects actually affect governments’ respect for
human rights, as measured by the Cingranelli-Richards Human Rights Dataset (CIRI,
Cingranelli and Richards 2006).2 Our study thus connects to the empirical literature on
the determinants of human rights that has emerged through the availability of data on
human rights violations.
The question of whether economic globalization affects human rights has been
examined previously (Apodaca 2001; Evans 1999; Hafner-Burton 2005; Mitchell and
1 See Dreher et al. (2008) for a comprehensive overview. 2 The index divides human rights into 13 internationally recognized rights, aggregated to two sublevels—
basic human rights (so called physical integrity rights) and broader civil liberties (i.e., empowerment
rights). This allows us to identify the specific effects of these two different categories on human rights.
3
McCormick 1988; Poe and Tate 1994).3 However, in previous studies the influence of
globalization has been measured by the extent of capital controls, openness to trade, and
the amount of foreign direct investment. From a policy perspective, the influence of all
these individual elements of economic globalization on human rights is definitely
important. But most elements of economic globalization are highly correlated. Therefore,
it is not advisable to include them all independently in one regression. Omitting
dimensions on the other hand, causes biased coefficients. Due to a lack of data, the
literature has focused on single aspects of economic globalization and human rights,
instead of applying a comprehensive approach. Using aggregate indicators of
globalization is preferable, because single negative effects could be neutralized by other
positive effects, and it is the overall effect of economic globalization that is decisive for
an evaluation of its merits. Hence, only an aggregate measure of economic globalization
can be used to study the overall effect. We use the economic dimension of the KOF Index
of Globalization (Dreher 2006a; Dreher et al. 2008), which aggregates the individual
dimensions and allows us to provide the first comprehensive investigation of the effects
of economic globalization on human rights violations.
As the KOF Index of Globalization also separates the political and social
dimensions of globalization from the economic dimension, we are able to take an even
broader perspective and comprehensively analyze the impact of these three distinct
dimensions of globalization on human rights.
In addition to external integration and liberalization (globalization), internal
economic liberalization has also been discussed as a potentially important determinant of
human rights (e.g., Burkhart 2002; Huntington 1968; Marx 2002). Internal economic
freedom comprises, for instance, voluntary exchange, free competition, and protection of
persons and property within a national economy. Therefore, we also examine the impact
of economic freedom on human rights. Again it can be argued that correlation between
the variables of interest is important. Given the apparent correlation between economic
freedom and the three dimensions of globalization (Bjørnskov 2006), not controlling for
economic freedom when investigating the effect of globalization on human rights could
bias the results, and vice versa. 3 See also the discussion in Pollis (2004).
4
In summary, this paper provides the first comprehensive analysis of how
economic freedom and the three dimensions of globalization affect governments’ respect
for human rights. Our empirical analysis puts particular weight on gauging the robustness
of the empirical relationship between the variables of interest. Specifically, we employ
(variants of) the extreme bounds analysis (EBA), as proposed by Leamer (1983) and
Levine and Renelt (1992). We also investigate whether causality does indeed run from
globalization and economic freedom to human rights rather than the other way around.
We continue as follows. The next section motivates our control variables,
building on the model of Poe and Tate (1994). Section 3 then expands the model and
presents our main hypotheses. How we measure human rights, globalization, and
economic freedom is outlined in sections 4 and 5. Section 6 describes the method of
estimation and our covariates, while the results are shown in section 7. The final section
concludes the paper.
2. The Determinants of Human Rights
Our starting point for analyzing governments’ respect for human rights is the model of
Poe and Tate (1994: 855-859), according to which a government’s decision to respect
human rights is determined by ten variables in six areas: 4
(i) the level of democracy;
(ii) the level of economic development and its growth rate;
(iii) population size and its growth rate;
(iv) the prevalence of a military and/or leftist regime;
(v) British cultural influence, and
(vi) (recent) experience with international and/or civil war.
In Poe and Tate’s model, human rights repression is a tool for governments to solve
conflicts. If a government is threatened, it reacts by repressing human rights, for instance,
through imprisonment, torture or killings. Since in democracies, processes involve the
bargaining of parties, conflicts can be solved in a more peaceful manner compared to
4 Poe and Tate focus on the subset of human rights labeled ”integrity of person.“ However, their theory can
easily be generalized for all forms of human rights.
5
autocracies (Henderson 1991; Poe and Tate 1994). In democracies, repressive
governments can be ousted from office in elections. Moreover, the characteristic
freedoms in democracies allow citizens to publicize and decry abusive actions. Overall,
democracy is expected to improve governments’ respect for human rights (see also
Davenport and Armstrong 2004). We control for democracy by using the Polity IV index
(Marshall and Jaggers 2000).5
Regarding economic conditions, Poe and Tate argue that human rights abuses
should decrease with economic development, yet increase with economic growth. The
better the economic situation, measured by the quantity and quality of goods and services
available, the less scarce are goods. Consequently, the potential for conflict, and thus
repression, decreases (Mitchell and McCormick 1988; Henderson 1991). The effect of
economic growth is less obvious: Since economic growth is the engine of economic
development, it should improve human rights practices in a country. However, growth
usually involves winners and losers, and may, at least temporarily, increase inequality of
income and wealth (Kuznets 1955). As a consequence, social and political tensions rise
and the probability of abusive actions increases. To test these theoretical considerations,
we employ GDP per capita and GDP growth in our analysis.6
Holding resources constant, scarcity of goods (and thus the potential for conflict)
is higher in countries with larger populations (Henderson 1991; Poe and Tate 1994). Here
the issue of distributing resources fairly among citizens becomes more crucial (Burkhart
2002). Moreover, the number of occurrences of coercive action is likely to be higher in a
large population, simply as a matter of numbers. Population growth increases the scarcity
of products and resources. Furthermore, rapid population growth increases the percentage
of younger people in terms of the total population, which as a group is generally more
destabilizing (Poe and Tate 1994). Therefore, both population size and population growth
5 We further account for the level of democracy by controlling for the timing of elections, the age of the
state and its political actors, federal states and their representation as well as the presence of special interest
executive parties. 6 As additional variables measuring economic development and growth, we use the Human Development
Index, investment, education, proxies for a country’s debt level, life expectancy and decentralization
measures.
6
may increase the probability of repressive governmental actions. In addition to these two
variables, we incorporate a country’s area and urban population in order to control for
potential rural-urban differences.
It is more or less a tautology that the probability of repressive actions increases if
the country is governed by a repressive regime. Military regimes depend on the power of
the armed forces, and conflicts are frequently solved by military order and hierarchy.
Hence, military regimes are most likely to control a country through abusive actions and
disrespect of human rights whenever possible. Similarly, “leftist regimes,” which are
defined as socialist or communist governments that do “not allow effective electoral
competition with nonsocialist opposition” (Poe and Tate 1994: 858), which is based on
the Marxist-Leninist theory that there is a need for the dictatorship of the proletariat, are
most likely to show less respect for human rights. Mitchell and McCormick (1988), for
instance, provide clear evidence for both hypotheses. We therefore include dummies for
socialist legal origin, left-wing governments, and military dictators.
There is also some discussion surrounding the cultural influence of past colonial
powers. Mitchell and McCormick (1988) and Burkhart (2002) argue that the colonial
experience has prejudiced the shape of present postcolonial political culture, and that the
British colonial experience, in contrast to other experiences, was associated with
postcolonial development of democracy. British cultural influence in this sense is
therefore assumed to involve greater respect for human rights.
Finally, Poe and Tate point out that experience with external or internal war
increases the probability of human rights violations. As Burkhart (2002: 158) puts it, civil
liberties “disappear in even the most democratic of countries come wartime.” We
measure war experience with a dummy variable that is equal to 1 if, in a given year, 1000
battlefield casualties occurred as a result of a civil and/or international war.
In addition to these standard variables proposed by Poe and Tate, the current
literature has introduced a number of other potential determinants of human rights. The
colonial legacy aspect of their model is a potential effect of former globalization. Besides
the positive effect of British cultural influence, it can also be argued that Iberian (Spanish
and Portuguese) colonies were based on strict hierarchy, authority, absolutism, and two-
class systems, and may therefore be more likely to display a political culture that tolerates
7
political repression and human rights violations as a means of maintaining order today
(Inglehart 1988). Hence, we also include a variable controlling for Iberian cultural
influence.7
Another important aspect related to colonialism is religion. The potential
difference between Iberian and British influence—if it exists—could originate from
different religions. While Orthodox and Roman-Catholic churches have hierarchal and
authoritarian structures, these are much less pronounced in Protestant churches.
According to the “habituation explanation,” proposed by Gurr (1986) and Davenport
(1996), Protestant societies may be more tolerant as they have been suppressed by the
Catholic mainstream. Arruñada (2010: 895) argues that “Protestants show greater
concern for social interactions, in terms of at least social control, rule of law and
homogeneity of values.” Using survey data for 32 countries, he finds substantial evidence
supporting this “social ethic” hypothesis. Basically, all major religions (in principle)
teach peaceful and respectful human interaction. However, different ecclesiastic
organization and traditions could affect the average respect its members have for human
rights, especially in relation to followers of a different religion. Therefore, we test both
whether countries with one dominant religion tend to have more respect for human rights,
or if this respect is reduced when minorities are subject to repression.
An aspect which has not yet been directly considered is ethnic fractionalization,
as well as other types of societal division. As argued above, the likelihood of a society
being fractionalized increases with the size of its population. Moreover, it is obvious that
in multiethnic countries (especially when they have only been independent for a short
time), the probability of conflict is significantly higher. Illustrative examples are the
conflicts and human rights practices in former multiethnic states like the Soviet Union,
Yugoslavia, and Czechoslovakia. Divisions of any kind may increase the probability of
human rights violations.
Recently, the role of major international organizations and their effects on human
rights has come under scrutiny. Abouharb and Cingranelli (2006, 2009) examine the role
7 Besides being a former British colony, we also control for whether the legal origin is British, French,
German or Scandinavian. See La Porta et al. (2008) for a detailed summary of the economic consequences
of legal origin.
8
that World Bank and IMF programs play in human rights violations. On the one hand, if
the World Bank and the IMF improve economic performance, this could lead to better
human rights practices. On the other hand, the conditionality attached to loans from the
two institutions could cause hardships and higher levels of domestic conflict, which could
then reduce the level of respect for human rights. Abouharb and Cingranelli find that
World Bank and IMF involvements deteriorate the human rights situation in borrowing
countries.8
Huntington’s (1968: 41) finding that “[…] causes of violence in [... poor
countries] lay with the modernization process rather than with the backwardness itself”
addresses another important aspect related to the influence of the level of economic
development and growth discussed above, and a potential (indirect) link to economic
freedom. In times of transition (modernization), economic freedom increases and the
state is reorganized: “As social and economic change broadens, political participation
increases, and the demands [...] are greater.” Hence, traditional sources of political
authority are challenged. New political institutions are required to channel this newly
mobilized citizenry. While these new institutions develop, instability, disorder and
corresponding human rights abuses arise. Mitchell and McCormick (1988) assume that
both very poor and very rich countries are therefore less likely to have substantial levels
of human rights violations, but that those countries in the middle—due to the
modernization process they are moving through—are more likely to exhibit patterns of
human rights violations. Taking this into account, there should be a non-linear
relationship between wealth and respect for human rights. We come back to this in the
empirical analysis.
3. Hypotheses
On the basis of the previous theoretical and empirical literature, this section derives our
hypotheses regarding the link between liberal policies and governments’ respect for
8 We complement IMF and World Bank lending variables with the number of human rights NGOs present
in a country. Simmons and Danner (2010: 225) demonstrate how ratification of the International Criminal
Court (ICC) to prosecute war crimes is a useful step for “some governments to commit to ratchet down
violence and get on the road to peaceful negotiations.”
9
human rights. Our hypotheses comprise two dimensions of freedom, an internal
dimension covered by economic freedom within an economy, and an external dimension
covered by three dimensions of worldwide integration (globalization). To some extent,
both globalization and economic freedom imply a free domestic and a free world market.
3.1 Globalization and Human Rights Abuses
Economic, social and political integration can have different effects on the human rights
situation in a specific country. The two sub-categories of the human rights measure from
Cingranelli and Richards (2006)—physical integrity rights and empowerment rights—
might both be affected in different ways by the three types of globalization. If we neglect
this complexity, we will most likely end up with confusing or contradicting results.
As a matter of fact, the literature regarding the relationship between economic
globalization and human rights does yield contradicting results. On the one hand, Evans
(1999) argues that economic integration in trade and investment generates incentives for
governments to abuse poor and disenfranchised people, so that repression, exploitation
and human rights abuses arise. On the other hand, Apodaca (2001), Mitchell and
McCormick (1988), Poe and Tate (1994) as well as Rosenau (2003) argue that economic
integration produces economic wealth, the establishment of the rule of law and a higher
respect for human rights and (personal) freedom. Gelleny and McCoy (2001), as well as
Mitchell and McCormick (1988), also maintain that due to increased wealth and
modernization, global integration leads to a higher level of political stability, so that
governments are less tempted to violate human rights to maintain control. Similarly,
Richards et al. (2001) state that globalization forms a “middle-class,” which has the
power to demand (fundamental) human rights and freedom.
While globalization may increase the size of the pie, according to Rosenau (2003)
it may be distributed less equally. This may increase the potential for conflict and human
rights abuses. Indeed, Hafner-Burton (2005) does not find evidence that economic
integration (measured by total trade as a percentage of GDP) has a significant impact on
repression, but finds that in export-led countries, the probability of repression rises with
high levels of export flows.
Internal and external conflict, ethnic tension, law and order, and democratic
10
accountability of governments are among the indicators that are of the most significance
for the activities of multinational corporations (Busse and Hefeker 2007). If countries
become involved in an unanticipated war, the probability of receiving foreign direct
investment decreases, as does the magnitude of such investments (Li 2006). Hence,
human rights abuses should decrease with a country’s level of economic globalization.
Since economic globalization brings advantages for governments that participate in
economic integration (Dreher 2006a), regimes have an incentive to respect human rights.
There are theoretical arguments as well as empirical evidence that suggest trade or
economic globalization reduce conflict in a country, because “the possible loss of trade
reduces the willingness ... to fight” (Morrow 1999: 481; see also Li and Sacko 2002;
Iqbal and Zorn 2006).
Von Hayek (1960) argued that free trade and capital flows would lead to
economic development, fostering the demand for democracy. Eichengreen and Leblang
(2008) provide evidence for a mutual positive relationship between trade and democracy
(an exception being labor-scarce countries).9 In line with hypothesis (i) of Poe and Tate’s
model, this is another argument for economic globalization improving human rights
practices. These considerations lead to our first hypothesis:
Hypothesis 1: Economic globalization improves a country’s human rights
practice.
The success of companies operating globally is dependent on aspects like reputation,
which means that these companies also have an incentive to uphold international human
rights and basic labor standards if non-commitment is likely to become globally
transparent. As the social integration aspect of globalization proceeds—for instance via
the internet and other global communication media—the likelihood of human rights
violations being discovered increases, and the negative effect of being caught magnifies.
The skill revolution makes it easy to follow news about violations, however distant they
may be (Rosenau 2003). Moreover, due to an increasing worldwide network of NGOs
and other private groups (which is one aspect of social integration), the pressure on 9 For recent work on this topic see also Iqbal and Zorn (2006).
11
human rights violating regimes also rises.10 Hence, Rosenau (2003) points to the
increased ease of mobilizing human rights supporters as a consequence of social
globalization. Resistance against human rights violations can form more easily compared
to a world where news spread less quickly.11 As one part of social globalization,
international groups and networks are formed with the explicit goal of opposing
repressive regimes. Successful concepts can then easily be identified and copied.12
Social globalization can generate massive international pressure on a government
or enterprise. Hence, social globalization produces internationally recognized social
norms that give governments, politicians, and managers an incentive to follow (Akerlof
1980; Bernheim 1994). If a country is highly dependent on tourism, social globalization
offers a chance to attract tourists, but at the same time it incorporates the risk of losing
them due to the negative publicity of human rights abuses. Overall, the increased
visibility from social globalization can make governments all over the world feel more
obliged to publicly react to such violations. Thus, social globalization should function as
an incentive device against human rights abuses by increasing the ramifications of such
abuses. Moreover, Rosenau (2003) argues that another channel of social globalization is
the direct effect of immigration (and tourism) on the potential acceptance of different
lifestyles, be it the acceptance of different religions, ethnicity, gender or sexual
preferences. This reduces the potential for conflict and human rights abuses.
Hafner-Burton (2008), however, provides evidence that repressive governments
criticized by NGOs, news media and international organizations, often strategically
reduce particular forms of violations by offsetting this improvement with increased
violations in other areas. As Rosenau (2003) points out, the skill revolution enables
perpetrators, as well as victims, to respond to mobilizing powers: “It is worth recalling
10 One example for this is Nike, which has had numerous “issues” where it was claimed by various NGOs
that they were exploiting workers and using child labor in production. In 2001, Nike responded by
providing a “corporate responsibility report,” in which it admitted that child labor was used and promised
to stop this practice (Boggan 2001). 11 As one example, Rosenau (2003) points to NATO’s intervention in Kosovo, where media coverage
arguably played a role. 12 Rosenau (2003) proposes the example of land acquisition by the Inuit in Canada, which has been
facilitated by the adaptation of successful concepts from other parts of the world.
12
that a major consequence of the skill revolution is the growing capacity of people
everywhere to know when, where, and how to engage in collective action, a capacity that
can be just as easily put to the service of opposing as supporting what are regarded as
human rights violations” (322-323).13 Migration flows lead to negative reactions by
native citizens, in some countries giving rise to the success of right-wing parties and
repressive policies. Still, on balance, we expect the positive effects of social globalization
to dominate. We thus test the hypothesis:
Hypothesis 2: Social globalization improves a country’s human rights
practice.
Compliance with social norms originates from several sources—due to metanorms,
dominance, internalization, deterrence, social proof, membership, law, or reputation
(Axelrod 1986). Neighbor states and the international community could punish human
rights abuses, though this sword proved to be rather blunt in cases such as the Darfur
conflict. Membership in particular international organizations provides advantages that
member countries do not want to jeopardize by allowing human rights abuses to occur.
This leads us to the third dimension of globalization—political globalization.
The European integration process via the European Union (EU) is an example of
the positive role political integration can play in encouraging human rights. Potential new
members will only be affiliated, and win the substantial benefits of membership, if they
fulfill a number of preconditions. For instance, members have to sign the European
Convention for the Protection of Human Rights and Fundamental Freedoms,14 as well as
other standards. Human rights abuses are prosecuted by the European Court of Human
Rights. The sanctions imposed by the UN Security Council and other supra-national
organizations to punish human rights violations are further instances where political
globalization might, at least to a small extent, affect human rights. Regarding prosecution
13 Rosenau (2003) points to the example of General Pinochet’s custody in the United Kingdom, where
Chilean crowds demonstrated both in favor and against his detention. 14 The states of South- and Middle-America have also developed an American Convention of Human
Rights.
13
of genocide, war crimes and crimes against humanity, the UN established the
International Criminal Court (ICC); for Ex-Yugoslavia and Ruanda there were extra
courts established to punish the culprits. Hence, political integration should improve a
government’s respect for human rights.
An opposing view, first expressed by Chomsky and Herman (1979), and still
being discussed today, argues that the amount of human rights violations would rise with
the degree of economic association with power blocks like the United States or the
European Union (Mitchell and McCormick 1988). According to this line of argument,
developed economies further their own interests, for example through reforms at the
World Trade Organization (WTO) or regional trade unions like the NAFTA (Stiglitz
2006). The formation of international organizations such as the WTO, NAFTA and the
European Union, improve these nations’ ability to build beneficial asymmetric global
trade relations and other forms of power policy. As world markets are increasingly
controlled by these power blocks, investment conditions are altered to the disadvantage
of poorer nations, with persistent unemployment rising as a result (Stiglitz 2006). This
power policy may prolong the impoverishment of countries in a stage of transition or
backwardness (Stiglitz 2006). Following Poe and Tate (1994), this would impair human
rights practices.
Though both arguments appear to be correct in practice,15 we assume that, on
average, political globalization improves human rights practices:
Hypothesis 3: Political globalization improves human rights practice.
Thus, overall, we expect all three dimensions of globalization to improve governments’
respect for human rights (on average). We next turn to the impact of economic freedom
on human rights.
3.2 Economic Freedom and Human Rights Abuses
Economic freedom refers to the internal liberalization of economic rights, such as the
“freedom to engage in economic transactions, without government interference but with 15 Stiglitz (2006) discusses both arguments in a broader context.
14
government support of the institutions necessary for that freedom, including rule of law,
sound money, and open markets” (Deardorff's Glossary of International Economics16).
Economic freedom is therefore the “degree to which a market economy is in place, where
the central components are voluntary exchange, free competition, and protection of
persons and property” (Berggren 2003: 193; see also Gwartney and Lawson 2002) and a
limited degree of interventionism in the form of government ownership, regulations, and
taxes.17 There is clear evidence that economic freedom fosters growth-enhancing
incentives (Berggren 2003; de Haan and Sturm 2003). Economic freedom promotes high
returns on productive efforts, and it enables individuals to allocate their talent and capital
where it generates the highest value (Murphy et al. 1991). It is a precondition for
(economic) globalization because it promotes foreign capital investment and the flow of
trade towards preference satisfaction and highest return. Based on hypothesis (ii) of Poe
and Tate’s model, economic freedom should reduce human rights abuses.
As outlined above, a particular number of freedoms characterize democracies.
Hence, there is a direct link to the literature on economic freedom and democracy (e.g.,
de Haan and Sturm 2003): While economic freedom promotes free markets, political
freedom promotes democracy, so that both types of freedom are part of the same story. If
economic freedom is significantly correlated with democracy, then hypothesis (i) of Poe
and Tate’s model suggests that an indirect nexus exists between economic freedom and
regard for human rights via its common link to democracy.18
However, when looking back at the industrial revolution in Europe, we find a
potentially negative effect of economic freedom on human rights. Entrepreneurs more or
less had the right to treat their laborers in whichever way they saw fit. Political and
economic leaders’ interests went hand in hand, and economic freedom was exclusively
developed towards the advantage of citizens owning property. As large parts of society
were poor, exploitation and further impoverishment of complete swathes of land
16 http://www-personal.umich.edu/~alandear/glossary/e.html (September 6, 2010). 17 Economic freedom differs from political freedom (equal participation in political process, competition
for political power, free and fair elections) and civil freedom (protection against unreasonable visitation,
access to fair trials, freedom of assembly, freedom of religion, freedom of speech) (Berggren 2003: 194). 18 Burkhart (2002) assumes a similar (indirect) effect of capitalism and human rights through democracy.
15
occurred. Laborers had to work under degrading conditions, child labor was widespread,
and laborers were disenfranchised (Marx 2002).19
Today, in the countries where the industrial revolution originated, economic
freedom is still comparably high, but Europe is nevertheless well known for a markedly
good human rights record. Marx’s (1950) hypothesis that private property and a
capitalistic system inevitably lead to disaster has not been proven to be true, arguably
because the countries developed social security systems and labor protection standards,
and the like, which reduced economic freedom but ensured greater respect for human
rights. However, globalization might now spread a system of (pure) capitalism all over
the world, so Marx’s suspicion concerning economic freedom is indeed topical again. We
thus test the following hypothesis:
Hypothesis 4: Economic freedom improves a country’s human rights
practice.
In the following we outline our measures of human rights and globalization, and confront
our hypotheses with data.
4. Measuring Human Rights
Our definition of citizens’ human rights follows Cingranelli and Richards (1999). Their
Human Rights Dataset (CIRI, Cingranelli and Richards 2006) was specifically designed
to allow for the testing of theories about causes and consequences of human rights
violations and is widely used to do so.20 It provides quantitative information on
governments’ respect for various internationally recognized human rights, on an annual
basis and for almost all countries around the world.21
19 For example, Marx (2002: 239-240) cites a Justice of the Peace in Nottingham, who labels the working
conditions in England in 1860 as ‘slavery in social, bodily, ethically and mental respect’. 20 See, e.g., Richards (1999), Abouharb and Cingranelli (2006, 2009), Goodlifee and Hawkins (2006),
United Nations (2006), Blume and Voigt (2007), or Dreher et al. (2010). 21 Note that we therefore do not investigate human rights violations from non-governmental actors. See
Ferguson and Mansbach (2004) for a discussion.
16
The CIRI measure draws from two sources, the U.S. Department of State’s
Country Reports on Human Rights Practices, and from Amnesty International’s (AI)
Annual Reports. Both offer detailed descriptions of human rights practices for most
countries in the world. They are analyzed by country experts who code the human rights
situation in a particular country and year on an ordinal scale. Each country is evaluated
by at least two trained experts, following a very detailed set of instructions.22 Note that
Cingranelli and Richards focus on actual human rights-related actions of governments,
including all government agencies, such as police and military. In particular, the CIRI
data refer to extrajudicial killings, people who have disappeared for political reasons,
torture, political imprisonment, freedom of speech, freedom of religion, freedom of
movement, political participation, and worker’s rights. Each variable is coded on an
ordinal scale, ranging between 0-2 and, depending on the variable considered, 0-4, where
higher values reflect a better rating in the respective human rights dimension.23
In this paper we focus on two composite indicators provided by Cingranelli and
Richards (1999) and Richards et al. (2001). The first composite index refers to physical
integrity rights, which measures the absence of torture, extrajudicial killings, political
imprisonments, and disappearance, on a scale of 0-8. The second composite refers to
empowerment rights and comprises the freedom of movement, freedom of speech,
workers’ rights, political participation, and freedom of religion, ranging from 0-10.24
22 The detailed coding rules are fixed in a coding manual and available from the CIRI Human Rights Data
Project (http://ciri.binghamton.edu/documentation.asp, accessed April 15, 2008). 23 The scoring of the ordinal indices rests on events-based criteria. While the exact description of how the
individual dimensions are coded is not reproduced here due to space restraints, consider political or
extrajudicial killings as an example. “Practically frequent” killings are coded as “zero,” when more than 50
people have been killed in a particular year and country. “Practices occasionally” is coded as “one” when
between 1-49 people have been killed, while a value of “two” is assigned when no killing occurred. As
Cingranelli and Richards (1999) and Richards et al. (2001) show employing Mokken Scale Analysis, the
government’s decision to violate the individual rights is unidimensional. They can thus be aggregated to
overall indices. 24 The correlation between the physical integrity index and the empowerment index is 0.51. Thus, the two
indicators seem to be covering different aspects of human rights.
17
Higher values represent better human rights practices. Appendix B gives a more detailed
description of these components.25
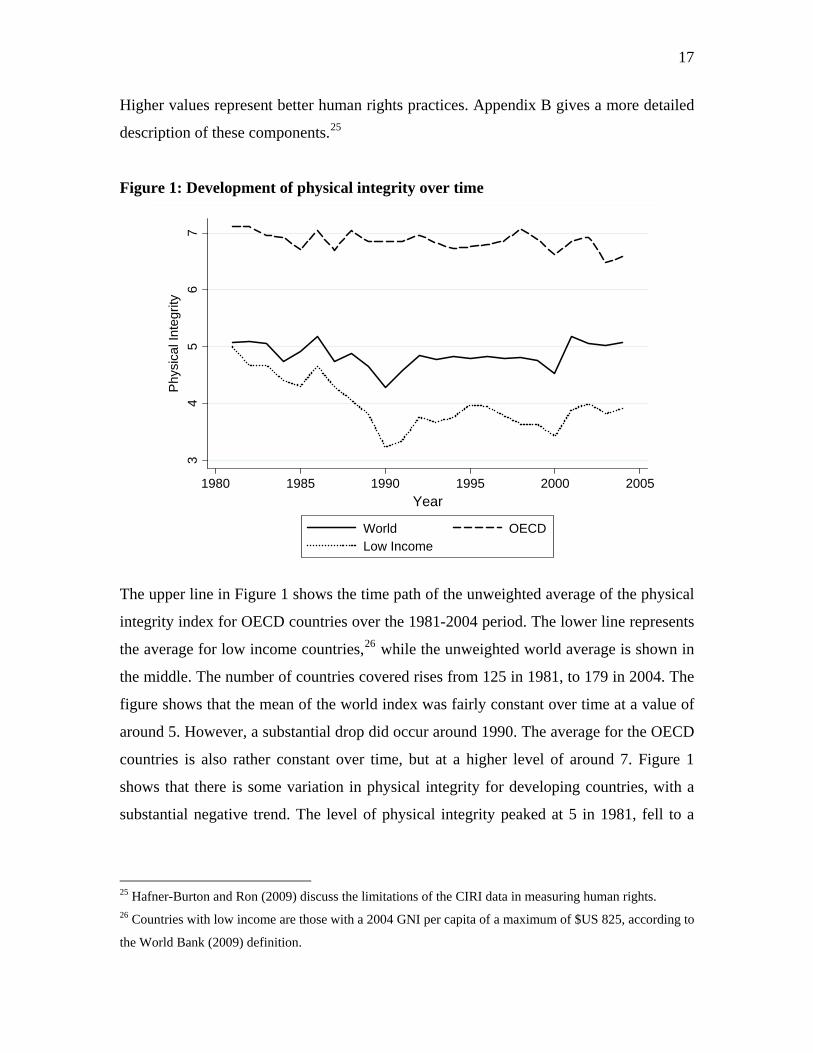
Figure 1: Development of physical integrity over time 3
45
67
1980 1985 1990 1995 2000 2005
World OECDLow Income
Phy
sica
l Int
egrit
y
Year
The upper line in Figure 1 shows the time path of the unweighted average of the physical
integrity index for OECD countries over the 1981-2004 period. The lower line represents
the average for low income countries,26 while the unweighted world average is shown in
the middle. The number of countries covered rises from 125 in 1981, to 179 in 2004. The
figure shows that the mean of the world index was fairly constant over time at a value of
around 5. However, a substantial drop did occur around 1990. The average for the OECD
countries is also rather constant over time, but at a higher level of around 7. Figure 1
shows that there is some variation in physical integrity for developing countries, with a
substantial negative trend. The level of physical integrity peaked at 5 in 1981, fell to a
25 Hafner-Burton and Ron (2009) discuss the limitations of the CIRI data in measuring human rights. 26 Countries with low income are those with a 2004 GNI per capita of a maximum of $US 825, according to
the World Bank (2009) definition.
18
low point of 3.2 in 1990, rose to 4 in 1995, and after declining again until 2000, was
slightly below 4 in 2004.
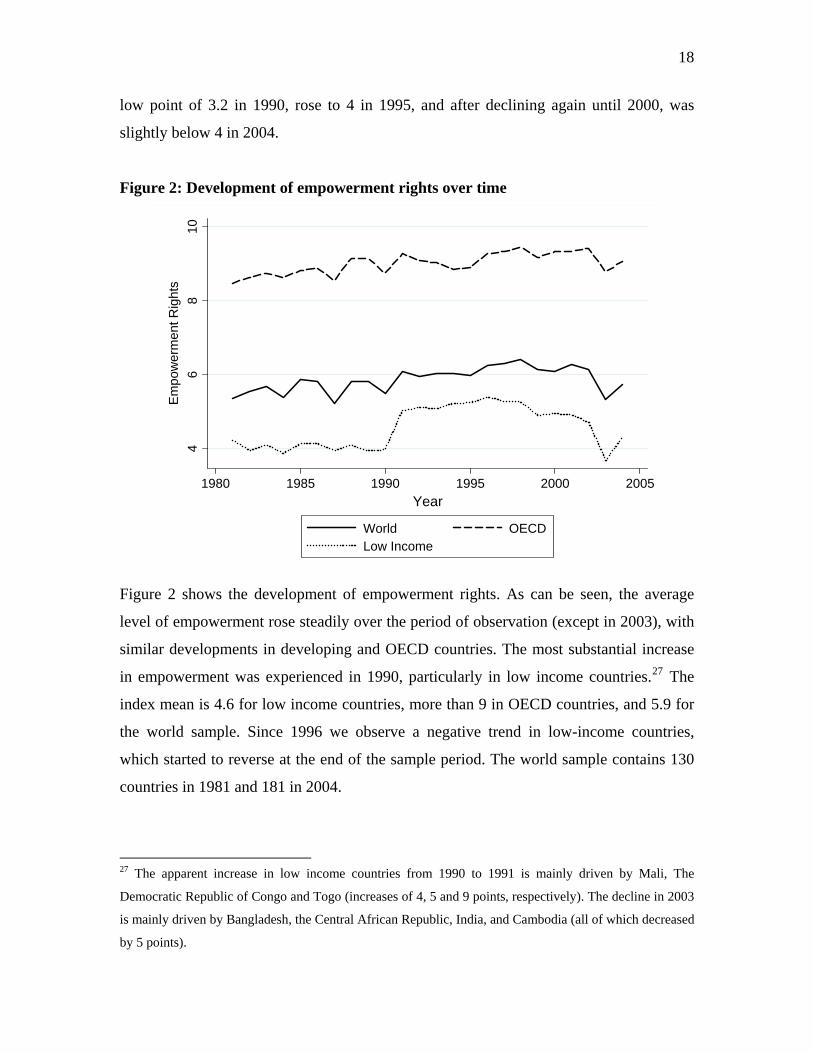
Figure 2: Development of empowerment rights over time 4
68
10
1980 1985 1990 1995 2000 2005
World OECDLow Income
Em
pow
erm
ent R
ight
s
Year
Figure 2 shows the development of empowerment rights. As can be seen, the average
level of empowerment rose steadily over the period of observation (except in 2003), with
similar developments in developing and OECD countries. The most substantial increase
in empowerment was experienced in 1990, particularly in low income countries.27 The
index mean is 4.6 for low income countries, more than 9 in OECD countries, and 5.9 for
the world sample. Since 1996 we observe a negative trend in low-income countries,
which started to reverse at the end of the sample period. The world sample contains 130
countries in 1981 and 181 in 2004.
27 The apparent increase in low income countries from 1990 to 1991 is mainly driven by Mali, The
Democratic Republic of Congo and Togo (increases of 4, 5 and 9 points, respectively). The decline in 2003
is mainly driven by Bangladesh, the Central African Republic, India, and Cambodia (all of which decreased
by 5 points).
19
5. Measures of Economic Freedom and Globalization
The measure of globalization that we employ is the KOF Index of Globalization
developed in Dreher (2006a).28 It is based on 24 variables that relate to different
dimensions of globalization. These dimensions are combined into three sub-indices—
economic, political and social globalization—and one overall index of globalization.
More specifically, economic globalization is defined to have two dimensions.
First, actual economic flows are taken to be measures of globalization. Second, as the
economic literature usually employs proxies for restrictions on trade and capital, a second
index captures this dimension. The sub-index on actual economic flows includes data on
trade, flows and stocks of FDI, and portfolio investment. While these variables are
straight-forward measures of globalization, income payments to foreign nationals and
capital are also included to proxy for the extent to which a country employs foreign
people and capital in its production processes.
The second sub-index refers to restrictions on trade and capital flows, using
hidden import barriers, mean tariff rates, taxes on international trade and an index of
capital controls. Given a certain level of trade, a country with higher revenues from tariffs
is less globalized. To proxy restrictions on the capital account, an index constructed by
Gwartney and Lawson (2002) is employed. Mean tariff rates are obtained from various
sources. Gwartney and Lawson allocate a rating of 10 to countries that do not impose any
tariffs. As the mean tariff rate increases, countries are assigned lower ratings. The rating
declines toward zero as the mean tariff rate approaches 50 percent (a threshold not
generally exceeded by most countries in their sample).
The KOF index classifies social globalization in three categories.29 The first
covers personal contacts, the second includes data on information flows and the third
measures cultural proximity. The personal contacts index is intended to capture the direct
interaction among people living in different countries. It includes international telecom
traffic (outgoing traffic in minutes per subscriber), international letters sent and received,
28 We use the 2009 version of this index as documented in Dreher et al. (2008) which is available at
http://globalization.kof.ethz.ch/. 29 Similar proxies for globalization are used elsewhere (e.g., Iqbal and Zorn 2006). See Dreher et al. (2008)
for a survey.
20
and the degree of tourism (incoming and outgoing) a country’s population is exposed to.
Government and workers’ transfers received and paid (as a percentage of GDP) measure
whether, and to what extent, countries interact, while the stock of foreign population is
included to capture existing interactions with people from other countries. The number of
international letters sent and received measure direct interaction among people living in
different countries.
While personal contact data are meant to capture measurable interactions among
people from different countries, the sub-index on information flows is meant to measure
the potential flow of ideas and images. It includes the number of internet users, cable
television subscribers, number of radios and daily newspapers traded. To some extent, all
these variables proxy people’s potential for receiving news from other countries – they
thus contribute to the global spread of ideas and events.
Cultural proximity is arguably the dimension of globalization which is most
difficult to grasp. According to Saich (2000), cultural globalization in large part refers to
the domination of U.S. cultural products. Arguably, the United States is the trendsetter in
much of the global socio-cultural realm (Rosendorf 2000). As proxy for cultural
proximity, the number of McDonald’s restaurants located in a country is included. For
many people, the global spread of McDonald’s is synonymous with globalization itself.
However, the number of IKEA (per capita) located in a country is also included.
Imported and exported books (relative to GDP) are used to proxy the extent to which
beliefs and values move across national borders.
To proxy the degree of political globalization, the number of embassies and high
commissions in a country, the number of international organizations in which the country
is a member, the number of international treaties ratified, and the number of UN peace
missions a country participated in are used.
In constructing the indices of globalization, each of the variables is transformed to
an index on a scale of one to one hundred, where one hundred is the maximum value for
a specific variable and one is the minimum value. Higher values denote greater
globalization. The data are transformed according to the percentiles of the original
distribution. The weights for calculating the sub-indices are determined using principal
components analysis for the entire sample of countries and years.
21
Appendix A1 reports the individual components. As can be seen, economic,
political and social integration carry roughly equal weights. The index is widely used as
proxy for globalization in the recent literature.30
Turning to our measure of economic freedom, we employ the index provided by
the Fraser Institute (Gwartney and Lawson 2008). The data is available in five year-
intervals over the period 1970-2000, and on a yearly basis thereafter. It covers five broad
categories of market-oriented policies and institutions: Size of Government (Area 1),
Legal Structure and Security of Property Rights (Area 2), Access to Sound Money (Area
3), Exchange with Foreigners (Area 4), and Regulation of Credit, Labor and Business
(Area 5). Each index ranges from 0-10, with 10 indicating the highest level of economic
freedom. Appendix A2 contains the individual sub-components. As an alternative, we
employ a second standard measure of economic freedom, that being the index developed
by the Heritage Foundation and the Wall Street Journal (see Miller and Holmes 2009).
Their Index of Economic Freedom is measured on a scale of 0 to 100 and is calculated as
the mean of ten sub-components, which are measured on the same scale. The areas
covered are Business, Trade, Money, Government, Fiscal Policy, Property Rights,
Investment, Financial Freedom, Corruption, and Labor, where higher values indicate an
economic environment or set of policies more conducive to economic freedom. Appendix
A3 shows the individual components with their definitions.
6. Data and Method
We estimate pooled time-series cross-section (panel data) regressions. The yearly data
extend to a maximum of 106 countries and cover the 1981-2004 period. Since some of
the data are not available for all countries or years, the panel data are unbalanced and the
number of observations depends on the choice of explanatory variables.
To test our hypotheses we estimate equations of the following form:
itttitiit uZRIGHTSRIGHTS +++= − μαα ,21,1 , (1)
where RIGHTSit represents our measure of human rights in country i at year t, and
Z is a vector containing the variables testing for our hypotheses, as introduced below.
30 See http://globalization.kof.ethz.ch/papers/ for an extensive list of articles using the index.
22
Finally, μt are time fixed effects and uit is a well behaved error term. Note that we also
include the lagged dependent variable, as human rights develop only slowly over time.
Following the previous literature, we estimate our model employing ordered probit, with
standard errors clustered at the country level. As a consequence, we cannot control for
fixed country effects, as the resulting estimates would be biased due to the incidental
parameter problem.
Before turning to the specific variables employed to test our hypotheses, we have
to set up a baseline specification. As discussed above, the model of Poe and Tate (1994)
gives guidance to what the core determinants of human rights are. Besides these,
however, there is little consensus on what the additional determinants are, if any. Hence,
we face the challenge of coming up with a robust empirical model. We tackle this
problem by employing (variants of) the extreme bounds analysis (EBA), as proposed by
Leamer (1983) and Levine and Renelt (1992). EBA enables us to examine whether the
proposed variables are indeed robust determinants of human rights, independent of which
additional variables are also included in the set of control variables.
To conduct an EBA, equations of the following general form are estimated:
υβββ +++= ZFMRIGHTS ZFM , (2)
where RIGHTS is the measure of human rights, M is a vector of “commonly accepted”
explanatory variables and F is a vector containing the variables of interest. The vector Z
contains up to three possible additional explanatory variables (as in Levine and Renelt
1992), which, according to the broader literature, are related to the dependent variable.
The error term is υ. The EBA-test for a variable in F states that if the lower extreme
bound for βF—i.e., the lowest value for βF minus two standard deviations—is negative,
while the upper extreme bound for βF—i.e., the highest value for βF plus two standard
deviations—is positive, the variable F is not robustly related to RIGHTS.
Sala-i-Martin (1997) argues that this criterion is far too strong for any variable to
pass. If the distribution of the parameter of interest has both positive and negative
support, then a researcher is bound to find at least one regression model for which the
estimated coefficient changes sign if enough regressions are run. Consequently, in what
follows, not only do we report the extreme bounds, but also the percentage of the
23
regressions in which the coefficient of the variable F is statistically different from zero at
the five percent level.
Moreover, instead of analyzing only the extreme bounds of the estimates of the
coefficient for a particular variable, we follow Sala-i-Martin’s (1997) recommended
procedure and analyze the entire distribution. Accordingly, we also report the unweighted
parameter estimate of βF and its standard error, as well as the unweighted cumulative
distribution function, CDF(0). The latter represents the proportion of the cumulative
distribution function lying on each side of zero. CDF(0) indicates the larger of the areas
under the density function either above or below zero. So CDF(0) always lies between
0.5 and 1.0. However, in contrast to Sala-i-Martin, we use the unweighted, instead of the
weighted, CDF(0).31
As we follow Poe and Tate (1994), our M vector consists of the following
variables: A proxy for democracy (Polity IV), population size, GDP per capita, a set of
dummy variables controlling for legal origin, plus a dummy variable indicating the
presence of a civil and/or international war (and the lagged dependent variable).
As detailed in section 2, we have collected a total of 52 variables potentially
influencing the level of human rights to test competing theoretical and empirical findings.
All variables and their sources are listed in Appendix B. After evaluating the robustness
of the baseline specification, including these variables in all possible combinations of up
to three, each of these variables is included in the base vector singularly (i.e., represents
the variable in the F vector), while the remaining 51 variables are used in the Z vector.
Thus, the first part of the analysis evaluates whether the variables in the base model are
robustly related to human rights practice. The second part shows whether additional
31 Sala-i-Martin (1997) proposes using the integrated likelihood to construct a weighted CDF(0). However,
missing observations for some of the variables pose a problem. Sturm and de Haan (2002) show that the
goodness-of-fit measure may not be a good indicator of the probability that a model is the true model and
that the weights constructed in this way are not invariant to linear transformations of the dependent
variable. Hence, changing scales could result in different outcomes and conclusions. We therefore employ
the unweighted version. Furthermore, due to our unbalanced panel setup, we are unable to use the extension
of the EBA called Bayesian Averaging of Classical Estimates (BACE) as introduced by Sala-i-Martin et al.
(2004).
24
variables should be among the explanatory variables when testing for the impact of
globalization and economic freedom on human rights practice.32
The next section reports the results for the EBA; results for our specific
hypotheses follow below.
7. Findings
7.1 EBA Results
The results for the EBA baseline models are presented in Table 1, while results for the
additional variables are presented in Appendix C. In order to take account of the two-
sided nature of the test, we follow Sturm and de Haan’s (2005) proposal to use a CDF(0)
value of 0.95 as a threshold for which variables we consider to be robust. The upper panel
of Table 1 shows the results for physical integrity rights, while the lower panel reports
those for empowerment rights. As can be seen from both panels, the lagged dependent
variable is clearly a robust determinant of current levels, with both CDF(0)s being equal
to one. The results also show that all additional variables included in the baseline model
are robust determinants of physical integrity rights. In line with Poe and Tate, less
populous and more democratic countries have higher levels of human rights. Protection
of physical integrity rights is also more pronounced in wealthier countries, measured by
per capita GDP. Wars robustly reduce governments’ respect for physical integrity rights.
In terms of legal origin, the four dummies are also robust determinants of physical
integrity rights. When calculating F-tests for their joint significance, the average p-value
amounts to 0.02, indicating the joint significance of the legal origin dummies. We find
that relative to Scandinavian legal origin (the omitted benchmark category) all other
country groups show less respect for physical integrity rights.
While the results imply that the baseline variables chosen for the M-vector on
theoretical grounds are well matched to the data for physical integrity rights, the lower
part of Table 1 shows that this holds to a lesser extent for empowerment rights. All
coefficients are of the same sign as for physical integrity rights. However, only
democracy exceeds the threshold of a CDF(0) of 0.95 and can therefore be considered as
32 Note that multicollinearity is not a major concern. Out of the 1771 pairwise correlations of the variables
in the EBA, only 8 show a correlation of greater than 0.8.
25
a robust determinant of empowerment rights. Population, per capita GDP, and war
experiences are no robust determinants of empowerment rights. The legal origin dummies
are, at least individually, also not robust. Note, however, that the average p-value for their
joint significance is 0.08, indicating the joint significance of these dummies.
The results reported in appendix C show that the bulk of the remaining 52 control
variables are not robust predictors of human rights. In fact, regarding physical integrity
rights, none of the 52 variables passes the strict threshold of 0.95. Six variables pass the
lower threshold of a CDF(0) of 0.90 suggested by Sala-i-Martin (1997), however. All of
them have the expected signs. Older democracies and states with a longer history of
independence show greater respect for human rights. More FDI inflows, as proxy for one
area of globalization, are associated with less human rights violations, as are the years the
chief executive is in office and the number of government tiers. The latter two results
imply that political stability and checks and balances promote human rights. In line with
theory, human rights violations are more frequent in former Iberian colonies.
With respect to empowerment rights, the share of Protestants turns out to be a
robust determinant according to the stricter threshold. As described in section 2,
Protestants seem to be more tolerant and thus show greater respect for human rights. Four
additional variables come close to our threshold: Population growth, the number of
human rights NGOs, the share of the dominant religion and the dummy for left-wing
governments. Population growth and a high share of a dominant religion seem to be
detrimental to human rights practice, while human rights organizations and left-wing
governments seem to be associated with less human rights violations. The latter finding
might seem at odds with Poe and Tate (1994), but our dummy of left-wing governments
typically refers to (social) democrats rather than socialists.
When testing our specific hypotheses below, we include all variables with a
CDF(0) exceeding 0.95 to avoid the possibility of omitted variable bias. We tested for the
robustness of our results, including those variables exceeding the lower threshold of 0.90
as well.33
33 All our results reported in Tables 2 and 3 remain qualitatively unchanged. The additional results are
available on request.
26
7.2 Hypotheses Tests
Table 2 shows the results for physical integrity rights, based on more than 2000
observations. Note that a potentially non-linear effect of GDP per capita could not be
tested in the EBA framework, as in a non-linear model such as ordered probit a simple t-
test on the squared term is meaningless (Ai and Norton 2003). One way of testing for the
statistical significance of the squared GDP per capita term is via a likelihood-ratio test
(Greene 2010). However, this cannot be done in a meaningful way in the EBA. We
therefore present two sets of results here: One with, and one without the squared term.
For all models, likelihood-ratio tests provide evidence for a better fit when including the
squared term at the one percent level of significance. For the non-linear models, we also
report the turning point in terms of GDP per capita (PPP adjusted). As reported at the
bottom of the table, the turning point fluctuates between US$ 2800-4800.
Turning to our variables of interest, we start by including one dimension of
integration at a time and then include them jointly. Column 1-9 report the results
excluding GDP per capita squared, while columns 10-18 include the squared term.
According to column 1, governments’ respect for physical integrity rights increases with
economic integration, at the one percent level of significance. This is line with
Hypothesis 1. The same holds true when we substitute economic globalization for social
globalization (in column 2) or political globalization (column 3). Therefore, Hypotheses
2 and 3 are also supported by the data. Column 4 includes the overall KOF Index of
Globalization instead, which is significant at the one percent level, with a positive
coefficient, as expected.
With respect to economic freedom, we find evidence for Hypothesis 4. Column 5
includes the Fraser index. The result shows that, at the five percent level of significance,
governments’ respect for physical integrity rights increases with greater freedom. Note
however, that the number of observations is reduced to 611, due to missing data on
economic freedom for many years. Column 6 therefore includes the same index, but
linearly interpolates the data in the years with missing observations. The result confirms
the previous finding, at the one percent level of significance.34 When using the index
34 When interpolating the data, we have to correct the standard errors to account for this. We do so by
bootstrapping the standard errors with 1000 repetitions.
27
provided by Heritage as an alternative (column 7), the coefficient is marginally
insignificant.
As argued above, not accounting for all dimensions of integration might lead to an
omitted variable bias. Therefore, we include all three indices of globalization jointly with
the (interpolated) Fraser index. As can be seen, economic globalization is no longer
significant at conventional levels, which might be due to multicollinearity. When we
enter the KOF Index of Globalization jointly with the Fraser index, both are significant at
the one percent level.
The results are very similar when squared per capita GDP is also included. The
exception is that economic freedom measured by the Heritage index is now significant at
the ten percent level (in column 16), and that social globalization becomes marginally
insignificant when included jointly with the two other dimensions of globalization and
the Fraser index.
Interestingly, the political dimension of globalization seems to dominate the
economic and social dimensions. If this were true, human rights policy should
concentrate on pushing political integration. However, we do not know whether the
economic and social dimensions are really irrelevant to human rights, or whether
multicollinearity exists among the individual dimensions, which does not allow us to
identify their effect. Overall, we conclude that the data support our hypotheses well, even
if some ambiguity regarding the relevance of the economic and social dimensions
remains.
Table 3 replicates the analysis focusing on empowerment rights. In line with the
results for the EBA above, population and per capita GDP are not significant at
conventional levels in most specifications (when GDP per capita squared is excluded).
The same holds for war experiences and the dummies for legal origin. The dummies are,
however, jointly significant at the five percent level in all specifications, except those
shown in columns 7 and 16. Note that according to the likelihood-ratio test, the model
including GDP per capita squared again fits the data better. The implied turning point is
similar to the one above, between US$ 3100-6000.
The results show that social globalization seems to be the only dimension of
globalization which is robustly related to empowerment rights. The overall index of
28
globalization is significant at the five percent level when GDP per capita squared is
excluded (in column 5), but not significant at conventional levels with its inclusion
(columns 13 and 18). To some extent, this could be explained by the fact that, in contrast
to physical integrity rights, empowerment rights are not guaranteed to the same degree by
international treaties (Hafner-Burton and Ron 2009). There is no clear consensus in the
global community as to how these rights are exactly defined. Hence, the effect of liberal
policies is likely to be more heterogeneous on empowerment, as compared to physical
integrity rights, which makes it difficult to find statistically significant effects. Due to a
lack of consensus, even the Western democracies prefer to focus on the more important
physical integrity rights, neglecting fuzzy empowerment rights at the political stage. For
similar reasons, economic integration may not bear a significant effect.
With respect to economic freedom, the Fraser index is significant at the five
percent level throughout, with a positive coefficient, while the Heritage index is not.
Overall, the data thus support hypotheses 2 and 4, but not 1 and 3 concerning
empowerment rights.
Our next step is to test for the robustness of our main results. We therefore
replicate the EBA reported above including our measures of globalization and economic
freedom. However, to reduce clutter, we do not report the results in tables. With respect
to physical integrity, we focus on column 18 in Table 2 and include all additional
variables in all possible combinations, as above. According to the results, the KOF Index
of Globalization and the Fraser index are clearly robust determinants of physical integrity
rights, with the CDF(0) being greater than 0.95 for both variables. Regarding
empowerment rights, we focus on column 17 (of Table 3) given that the overall KOF
index was not significant at conventional levels in column 18 in the first place. Our
results show that neither globalization nor economic freedom are robust determinants of
empowerment rights.35 Therefore, as outlined above, the incentives to respect human
rights due to globalization and economic freedom are too weak to affect empowerment
rights. The lack of consensus over what is the appropriate level of empowerment rights
might lead the “global community” at the social and political level into believing that
complaining about a lack of empowerment rights in other countries, when compared to 35 Note that the CDF(0) for both variables is even below 0.90.
29
their own rights at home, represents an inadequate outside interference in national issues:
While physical integrity rights involve violations of basic human rights which are
considered as inacceptable, empowerment rights involve markedly less strong human
rights violations, and thus might be more acceptable to international observers.
Finally, we address the question whether causality indeed runs from globalization
and economic freedom to human rights practice. Arguably, greater human rights might
also lead to more liberalization. Table 4 runs Granger causality tests to address the issue.
Causality, as defined by Granger (1969), implies that a variable x is Granger-causing a
variable y if past values of x help to explain y, once the past influence of y has been
accounted for.
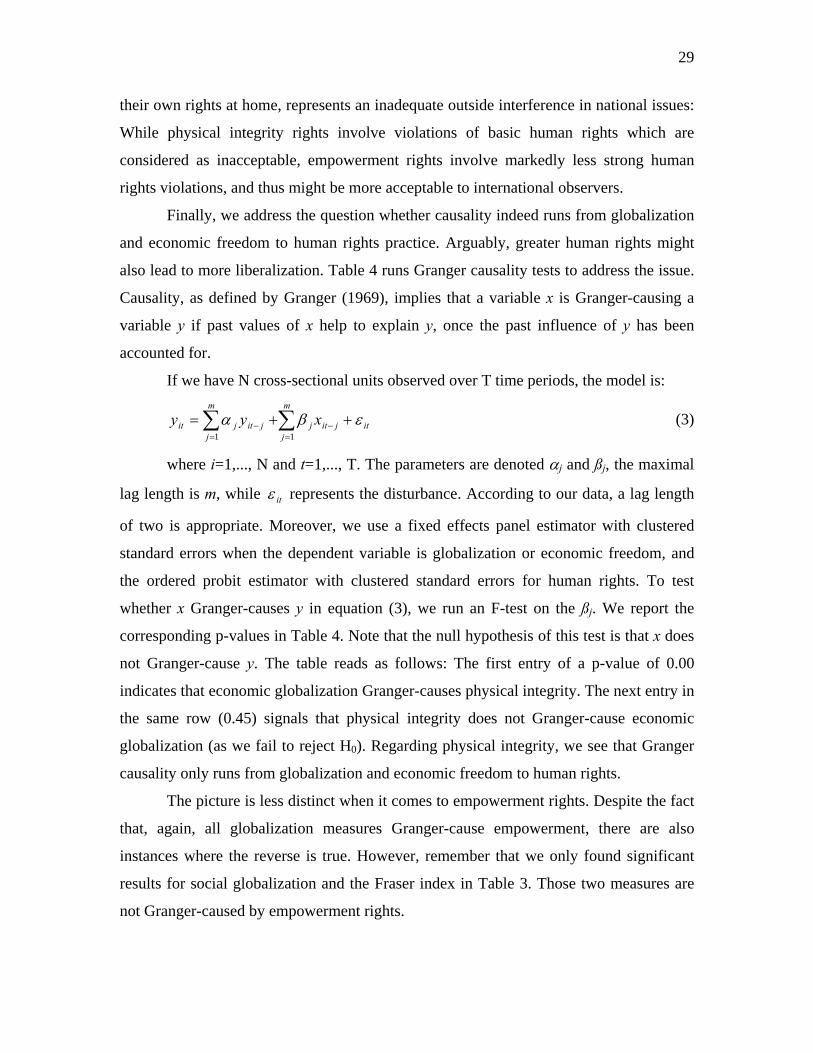
If we have N cross-sectional units observed over T time periods, the model is:
∑∑=
−=
− ++=m
jitjitj
m
jjitjit xyy
11
εβα (3)
where i=1,..., N and t=1,..., T. The parameters are denoted αj and ßj, the maximal
lag length is m, while itε represents the disturbance. According to our data, a lag length
of two is appropriate. Moreover, we use a fixed effects panel estimator with clustered
standard errors when the dependent variable is globalization or economic freedom, and
the ordered probit estimator with clustered standard errors for human rights. To test
whether x Granger-causes y in equation (3), we run an F-test on the ßj. We report the
corresponding p-values in Table 4. Note that the null hypothesis of this test is that x does
not Granger-cause y. The table reads as follows: The first entry of a p-value of 0.00
indicates that economic globalization Granger-causes physical integrity. The next entry in
the same row (0.45) signals that physical integrity does not Granger-cause economic
globalization (as we fail to reject H0). Regarding physical integrity, we see that Granger
causality only runs from globalization and economic freedom to human rights.
The picture is less distinct when it comes to empowerment rights. Despite the fact
that, again, all globalization measures Granger-cause empowerment, there are also
instances where the reverse is true. However, remember that we only found significant
results for social globalization and the Fraser index in Table 3. Those two measures are
not Granger-caused by empowerment rights.
30
To get a feeling for the magnitude of the estimated effects, we calculate the
marginal effects at the mean of all significant variables and report them in Table 5. Note,
however, that in the ordered probit model the marginal effects are not straightforward to
interpret. We therefore calculate the estimated probabilities before and after a shock of
one standard deviation on all of our physical integrity rights variables of interest. This is
reported in Figure 1. According to the figure, the social component of globalization and
the KOF Index of Globalization seem to have the largest impact on physical integrity.
The estimated probability of observing the values of 3 and 4 are (at the means of all
variables) 6.1% and 19.1%, respectively, while values 6 and 7 occur with a predicted
probability of 26.6% and 14.9%. After an increase in the KOF Index of Globalization by
one standard deviation, these predictions get substantially lower for low values, namely
3.1% and 13.5% for values 3 and 4, while they increase for the high values 6 and 7 to
30.8% and 21.0%, respectively. We conclude that these effects are not only statistically
significant, but also quantitatively important.
How does this compare to the other covariates for physical integrity rights? A
shock of one standard deviation in the (log) population size increases the probability of
observing a human rights value of 4 by 5.0%, while it decreases the probability of
observing the value of 7 by 5.6%. An increase in democracy by one standard deviation
decreases (increases) the probability of observing an index value of 4 (7) by 4.4% (4.9%).
Relative to Scandinavian legal origin, other countries have a probability of observing an
index value of 4 which is between 12% to 17% higher, while the chance of observing a
value of 7 is lower by 12% to 22%. Finally, a civil and/or international war increases the
likelihood of lower human rights by 6.7% and decreases the probability of high human
rights by 6.9%. As compared to the other variables that can be directly influenced by
policy, population size and level of democracy, the influence of internal and external
economic liberalization is at least as large, if not larger.
8. Conclusion
This paper extends the model of Poe and Tate (1994) to include economic freedom and
three dimensions of globalization. We use the KOF Index of Globalization and two
indices of economic freedom to empirically analyze whether globalization and
31
liberalization affect human rights practice in a panel of 106 countries over the 1981-2004
period. We extend the literature in three important ways: (i) we provide the first
comprehensive analysis of the effects of economic globalization on human rights practice
that includes all dimensions of economic globalization; (ii) we additionally investigate
the specific effects of social and political globalization; and (iii) at the same time, we
analyze the effects of economic freedom on human rights. Investigating all these issues
with the same data allows a comprehensive insight into the link between liberal policies
and respect for human rights. While the main control variables have been derived based
on theoretical considerations from the previous literature, we also provide extensive
robustness tests using more than 50 additional variables in an Extreme Bounds Analysis.
Our results show that physical integrity rights significantly increase with
economic freedom as well as political, social, and economic globalization (when we
include these variables separately). When we include them together, we find that only
economic freedom and political globalization remain significant. However, we do not
know whether this is due to multicollinearity or rather the actual irrelevance of the
insignificant dimensions.36 In any case, the overall KOF Index of Globalization turns out
to be a highly robust determinant of physical integrity rights, as is economic freedom.
These results are important extensions to the model of Poe and Tate (1994).
Consider the case of Croatia. Physical integrity increased from 2 in 1995 to 7 in 1996.
While the levels of democracy, population, and GDP per capita remained more or less
constant, the KOF Index of Globalization increased by 7 points (i.e., 15 percent) and the
economic freedom index by roughly 10 percent. One year later physical integrity reached
its maximum value of 8 as both globalization and economic freedom continued to grow.
Similar examples are Morocco 1990-1991, South Africa 1994-1995, and Kenya 1992-
1993, among many others. As the increase in physical integrity rights cannot be
explained by the model of Poe and Tate alone, adding our variables of main interest adds
explanatory power.
36 Our result regarding economic globalization is in line with Hafner-Burton (2005). Hafner-Burton uses a
more traditional measure of globalization—trade—and does not find a significant effect of economic
globalization on human rights.
32
Interestingly, we do not find similarly robust effects of economic freedom and
globalization on empowerment rights. While we find that empowerment rights rise with
social globalization and economic freedom, these results are not robust to the choice of
control variables, as indicated by the Extreme Bounds Analysis.
Overall, we conclude that the hypothesized incentives to respect human rights
provided by globalization mainly work for narrow basic human rights (“physical integrity
rights”), but not for the broader “empowerment rights.” This may be the case because (i)
there is a lack of international consensus about what precisely comprises these
empowerment rights and (ii) given that these are “weaker” human rights, violations are
more readily accepted by international observers. The combination of lack of consensus
and lower importance may therefore cause empowerment rights violations to be
considered as internal national affairs.
33
References
Abouharb, M. Rodwan, and David L. Cingranelli. 2006. The human rights effects of
World Bank structural adjustment lending, 1981–2000. International Studies
Quarterly 50 (2): 233-62.
Abouharb, M. Rodwan, and David L. Cingranelli. 2009. IMF programs and human rights,
1981-2003. Review of International Organizations 4 (1): 47-72.
Ai, Chunrong, and Edward C. Norton. 2003. Interaction terms in logit and probit models.
Economics Letters 80 (1): 123-29.
Akerlof, George A. 1980. A theory of social custom, of which unemployment may be one
consequence. Quarterly Journal of Economics 94 (4): 749-75.
Alesina, Alberto, William Easterly, Arnaud Devleeschauwer, Sergio Kurlat, and Romain
Wacziarg. 2003. Fractionalization. Journal of Economic Growth 8 (2): 155-94.
Amnesty International. 2006. Amnesty International Report 2006. London: Amnesty
International. http://web.amnesty.org/report2006/index-eng (accessed January 10,
2007).
Apodaca, Claire. 2001. Global economic patterns and personal integrity rights after the
Cold War. International Studies Quarterly 45 (4): 587-602.
Arruñada, Benito. 2010. Protestants and Catholics: Similar work ethic, different social
ethic. Economic Journal 120 (547): 890-918.
Axelrod, Robert. 1986. An evolutionary approach to norms. American Political Science
Review 80 (4): 1095-111.
Barro, Robert J., and Jong-Wha Lee. 2000. International data on educational attainment:
Updates and implications. CID Working Paper No. 42.
Beck, Thorsten, George Clarke, Alberto Groff, Philip Keefer, and Patrick Walsh. 2001.
New tools in comparative political economy: The database of political
institutions. World Bank Economic Review 15 (1): 165-76.
Berggren, Niclas. 2003. The benefits of economic freedom. A survey. The Independent
Review 8 (2): 193-211.
Bernheim, B. Douglas. 1994. A theory of conformity. Journal of Political Economy 102
(5): 841-77.
34
Bjørnskov, Christian. 2006. Globalization and economic freedom: New evidence using
the Dreher indices. mimeo.
Blume, Lorenz, and Stefan Voigt. 2007. The economic effects of human rights. Kyklos 60
(4): 509-38.
Boggan, Steve. 2001. Nike admits to mistakes over child labor. The Independent, October
20.
Boockmann, Bernhard, and Axel Dreher. 2003. The contribution of the IMF and the
World Bank to economic freedom. European Journal of Political Economy 19
(3): 633-49.
Burkhart, Ross E. 2002. The Capitalist Political Economy and Human Rights: Cross-
National Evidence. Social Science Journal 39, 2: 155-70.
Busse, Matthias, and Carsten Hefeker. 2007. Political risk, institutions and foreign direct
investment. European Journal of Political Economy 23 (2): 397-415.
Cheibub, José Antonio, Jennifer Gandhi, and James Raymond Vreeland. 2010.
Democracy and dictatorship revisited. Public Choice 143 (1-2): 67-101.
Chomsky, Noam, and Edward S. Herman. 1979. The political economy of human rights:
The Washington connection and third world fascism. Boston: South End Press.
CEPII. 2010. Distances database. http://www.cepii.fr/anglaisgraph/bdd/distances.htm
(accessed April 10, 2010).
Cingranelli, David L., and David L. Richards. 1999. Measuring the level, pattern, and
sequence of government respect for physical integrity rights. International Studies
Quarterly 43 (2): 407-18.
Cingranelli, David L., and David L. Richards. 2006. The Cingranelli-Richards (CIRI)
human rights dataset 2006. http://www.humanrightsdata.org/ (accessed September
27, 2006).
Davenport, Christian. 1996. The weight of the past: Exploring lagged determinants of
political repression. Political Research Quarterly 49 (2): 377-403.
Davenport, Christian, and David A. Armstrong II. 2004. Democracy and the violation of
human rights: A statistical analysis from 1976 to 1996. American Journal of
Political Science 48 (3): 538-54.
35
De Haan, Jakob, and Jan-Egbert Sturm. 2003. Does more democracy lead to greater
economic freedom? New evidence for developing countries. European Journal of
Political Economy 19 (3): 547-63.
Dreher, Axel. 2006a. Does globalization affect growth? Evidence from a new index of
globalization. Applied Economics 38 (10): 1091-110.
Dreher, Axel. 2006b. IMF and economic growth: The effects of programs, loans, and
compliance with conditionality. World Development 34 (5): 769-88.
Dreher, Axel, Martin Gassebner, and Lars-H. Siemers. 2010. Does terror threaten human
rights? Evidence from panel data. Journal of Law and Economics 53, (1): 65-93.
Dreher, Axel, Noel Gaston, and Pim Martens. 2008. measuring globalisation – gauging
its consequences. New York: Springer.
Dreher, Axel, and Roland Vaubel. 2009. Foreign exchange intervention and the political
business cycle: A panel data analysis. Journal of International Money and
Finance 28 (5): 755-75.
Easterly, William, and Mirvat Sewadeh. 2001. Global development network growth
database. World Bank, Economic and Development Research Group.
Eichengreen, Barry, and David Leblang. 2008. Democracy and globalization, Economics
and Politics 20 (3): 289-334.
Evans, Tony. 1999. Trading human rights. In Global trade and global social issues,
edited by A. Taylor and C. Thomas, 31-52. London et al.: Routledge.
Ferguson, Yale H., and Richard W. Mansbach. 2004. Remapping global politics –
history’s revenge and future shock. Cambridge: Cambridge University Press.
Gallup, John L., Andrew D. Mellinger, and Jeffrey D. Sachs. 2001. Geography datasets.
http://www.cid.harvard.edu/ (accessed September 12, 2006).
Gelleny, Ronal D., and Matthew McCoy. 2001. Globalization and government policy
independence: The issue of taxation. Political Research Quarterly 54 (3): 509-29.
Gleditsch, Nils. P., Peter Wallensteen, Mikael Eriksson, Margareta Sollenberg, and
Håvard Strand. 2002. Armed conflict 1946–2001: A new dataset. Journal of
Peace Research 39 (5): 615-37.
Goodlifee, Jay, and Darren G. Hawkins. 2006. Explaining commitment: States and the
convention against torture. Journal of Politics 68 (2): 358-71.
36
Granger, Clive W.J. 1969. Testing for causality and feedback. Econometrica 37 (3): 424-
38.
Greene, W. 2010. Testing hypotheses about interaction terms in nonlinear models.
Economics Letters 107 (2): 291-96.
Gurr, Ted Robert. 1986. Persisting patterns of repression and rebellion: Foundations for a
general theory of political coercion. In Persistent patterns and emergent
structures in a waning century, edited by M. Karns, 149-68. New York: Praeger.
Gwartney, James G., and Robert A. Lawson. 2002. Economic freedom of the world: 2002
annual report. Vancouver: Fraser Institute.
Gwartney, James G., and Robert A. Lawson. 2008. Economic freedom of the world: 2008
annual report. Vancouver: Fraser Institute.
Hafner-Burton, Emilie M. 2005. Right or robust? The sensitive nature of repression to
globalization. Journal of Peace Research 42 (6): 679-98.
Hafner-Burton, Emilie M. 2008. Sticks and stones: Naming and shaming the human
rights enforcement problem. International Organization 62 (4): 689-716.
Hafner-Burton, Emilie M., and James Ron. 2009. Seeing double – human rights impact
through qualitative and quantitative eyes. World Politics 61 (2): 360-401.
Henderson, Conway W. 1991. Conditions affecting the use of political repression.
Journal of Conflict Resolution 35 (1): 120-42.
Huntington, Samuel. 1968. Political order in changing societies. New Haven: Yale
University Press.
Inglehart, Ronald. 1988. The renaissance of political culture. American Political Science
Review 82 (4): 1203-230.
Iqbal, Zaryab, and Christopher Zorn. 2006. The two faces of globalization. mimeo.
Kuznets, Simon. 1955. Economic growth and income inequality. American Economic
Review 45 (1): 1-28.
La Porta, Rafael, Florencio Lopez-de-Silanes, and Andrei Shleifer. 2008. The economic
consequences of legal origins. Journal of Economic Literature 46 (2): 285-332.
Leamer, Edward E. 1983. Let’s take the con out of econometrics. American Economic
Review 73 (1): 31-43.
37
Levine, Ross, and David Renelt. 1992. A sensitivity analysis of cross-county growth
regressions. American Economic Review 82 (4): 942-63.
Li, Quan. 2006. Political violence and foreign direct investment. In Research in global
strategic management, Vol. 12, Regional Economic Integration, edited by M.
Fratianni and A.M. Rugman, 231-55. Oxford: Elsevier.
Li, Quan, and David Sacko. 2002. The (ir)relevance of militarized interstate disputes for
international trade. International Studies Quarterly 46 (1): 11-43.
Marshall, Monty G., and Keith Jaggers. 2000. Polity IV project: Political regime
characteristics and transitions, 1800-2000.
http://www.cidcm.umd.edu/inscr/polity/ (accessed September 15, 2006).
Marx, Karl. 1950[1844]. Nationalökonomie und Philosophie. Cologne and Berlin: Verlag
Gustav Kiepenheuer.
Marx, Karl. 2002[1872, 2nd ed.]. Das Kapital, 3rd ed. Cologne: Parkland Verlag.
Miller, Terry, and Kim R. Holmes. 2009. Index of economic freedom. The link between
economic opportunity and prosperity. Washington, DC: Heritage Foundation.
Mitchell, Neil, and John McCormick. 1988. Economic and political explanations of
human rights violations. World Politics 40 (4): 476-98.
Morrow, James D. 1999. How could trade affect conflict? Journal of Peace Research 36
(4): 481-89.
Murphy, Kevin M., Andrei Shleifer, and Robert W. Vishny. 1991. The allocation of
talent: implications for growth. Quarterly Journal of Economics 106 (2): 503-30.
Norris, Pippa. 2009. Democracy time-series dataset. Release 3.0.
http://www.hks.harvard.edu/fs/pnorris/Data/Data.htm (accessed July 01, 2010).
Persson, Thorsten, and Guido Tabellini. 2003. The economic effect of constitutions: What
do the data say? Cambridge, MA: MIT Press.
Poe, Steven, and C. Neal Tate. 1994. Repression of human rights to personal integrity in
the 1980s: A global analysis. American Political Science Review 88 (4): 853-72.
Pollis, Admantia. 2004. Human rights and globalization. Journal of Human Rights 3 (3):
343-58.
38
Rabet, Delphine. 2009. Human rights and globalization: The myth of corporate social
responsibility? Journal of Alternative Perspectives in the Social Sciences 1 (2):
463-75.
Richards, David L. 1999. Perilous proxy: Human rights and the presence of national
elections. Social Science Quarterly 80 (4): 648-65.
Richards, David L., Ronald Gelleny, and David Sacko. 2001. Money with a mean streak?
Foreign economic penetration and government respect for human rights in
developing countries. International Studies Quarterly 45 (2): 219-39.
Rosenau, James N. 2003. Distant proximities: Dynamics beyond globalization. Princeton:
Princeton University Press.
Rosendorf, Neal M. 2000. Social and cultural globalization: Concepts, history and
America's role. In Governance in a globalizing world, edited by J.S. Nye and J.D.
Donahue, 109-34. Washington, DC: Brookings Institution Press.
Sala-i-Martin, Xavier. 1997. I just ran two million regressions. American Economic
Review 87 (2): 178-83.
Sala-i-Martin, Xavier, Gernot Doppelhofer, and Ronald I. Miller. 2004. Determinants of
long-term growth: A Bayesian averaging of classical estimates (BACE) approach.
American Economic Review 94 (4): 813-35.
Saich, Tony. 2000. Globalization, governance, and the authoritarian state: China. In
Governance in a globalizing world, edited by J.S. Nye and J.D. Donahue, 208-28.
Washington, DC: Brookings Institution Press.
Simmons, Beth, and Allison Danner. 2010. Credible commitments and the International
Criminal Court. International Organization 64 (2): 225-56.
Stiglitz, Joseph E. 2006. Making globalization work. New York: W. W. Norton &
Company.
Sturm, Jan-Egbert, and Jakob de Haan. 2002. How robust is Sala-i-Martin’s robustness
analysis? mimeo.
Sturm, Jan-Egbert, and Jakob de Haan. 2005. Determinants of long-term growth: New
results applying robust estimation and extreme bounds analysis. Empirical
Economics 30 (3): 597-617.
Treisman, Daniel. 2000. Decentralization and the quality of government. mimeo.
39
Union of International Associations. 2000. Yearbook of international organizations.
Munich: Thomson.
United Nations. 2005. Human development report – international cooperation at a
crossroads: Aid, trade and security in an unequal world. New York: United
Nations Development Programme.
United Nations. 2006. Indicators for human rights-based approaches to development in
UNDP programming. New York: United Nations Development Programme.
von Hayek, Friedrich August. 1960. The constitution of liberty. Chicago: University of
Chicago Press.
World Bank. 2009. World development indicators, CD-Rom. Washington, D.C.
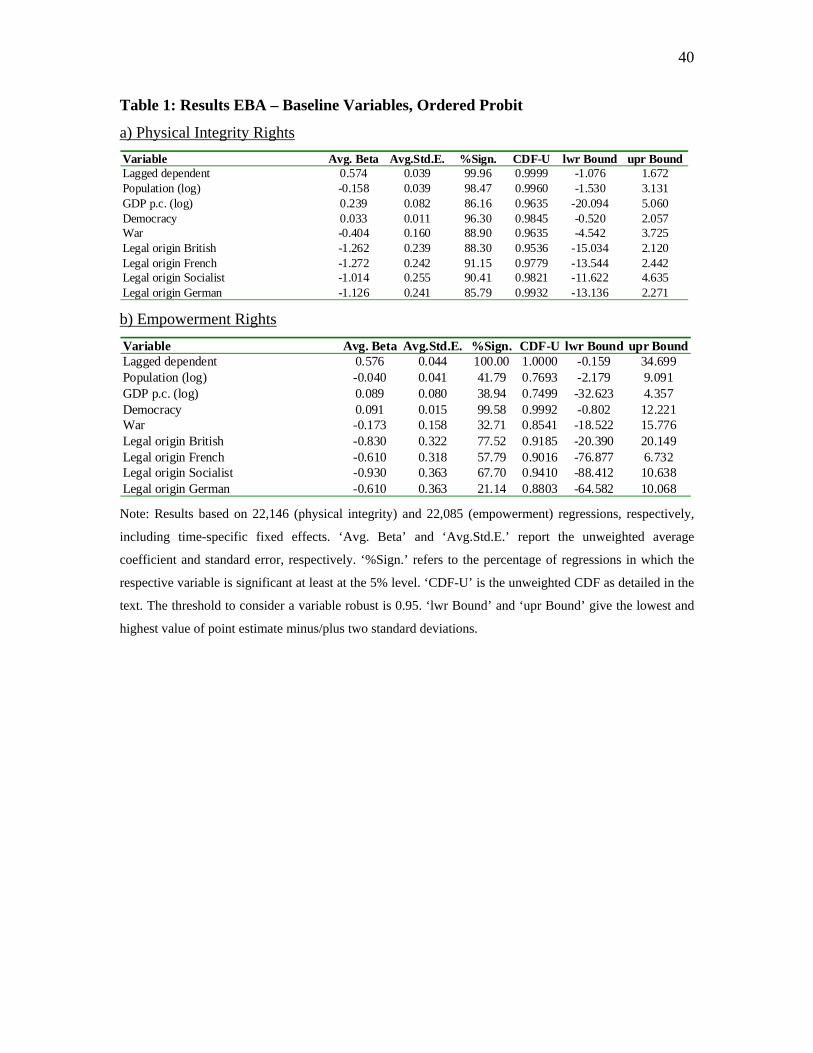
40
Table 1: Results EBA – Baseline Variables, Ordered Probit
a) Physical Integrity Rights Variable Avg. Beta Avg.Std.E. %Sign. CDF-U lwr Bound upr BoundLagged dependent 0.574 0.039 99.96 0.9999 -1.076 1.672Population (log) -0.158 0.039 98.47 0.9960 -1.530 3.131GDP p.c. (log) 0.239 0.082 86.16 0.9635 -20.094 5.060Democracy 0.033 0.011 96.30 0.9845 -0.520 2.057War -0.404 0.160 88.90 0.9635 -4.542 3.725Legal origin British -1.262 0.239 88.30 0.9536 -15.034 2.120Legal origin French -1.272 0.242 91.15 0.9779 -13.544 2.442Legal origin Socialist -1.014 0.255 90.41 0.9821 -11.622 4.635Legal origin German -1.126 0.241 85.79 0.9932 -13.136 2.271 b) Empowerment Rights Variable Avg. Beta Avg.Std.E. %Sign. CDF-U lwr Bound upr BoundLagged dependent 0.576 0.044 100.00 1.0000 -0.159 34.699Population (log) -0.040 0.041 41.79 0.7693 -2.179 9.091GDP p.c. (log) 0.089 0.080 38.94 0.7499 -32.623 4.357Democracy 0.091 0.015 99.58 0.9992 -0.802 12.221War -0.173 0.158 32.71 0.8541 -18.522 15.776Legal origin British -0.830 0.322 77.52 0.9185 -20.390 20.149Legal origin French -0.610 0.318 57.79 0.9016 -76.877 6.732Legal origin Socialist -0.930 0.363 67.70 0.9410 -88.412 10.638Legal origin German -0.610 0.363 21.14 0.8803 -64.582 10.068
Note: Results based on 22,146 (physical integrity) and 22,085 (empowerment) regressions, respectively,
including time-specific fixed effects. ‘Avg. Beta’ and ‘Avg.Std.E.’ report the unweighted average
coefficient and standard error, respectively. ‘%Sign.’ refers to the percentage of regressions in which the
respective variable is significant at least at the 5% level. ‘CDF-U’ is the unweighted CDF as detailed in the
text. The threshold to consider a variable robust is 0.95. ‘lwr Bound’ and ‘upr Bound’ give the lowest and
highest value of point estimate minus/plus two standard deviations.
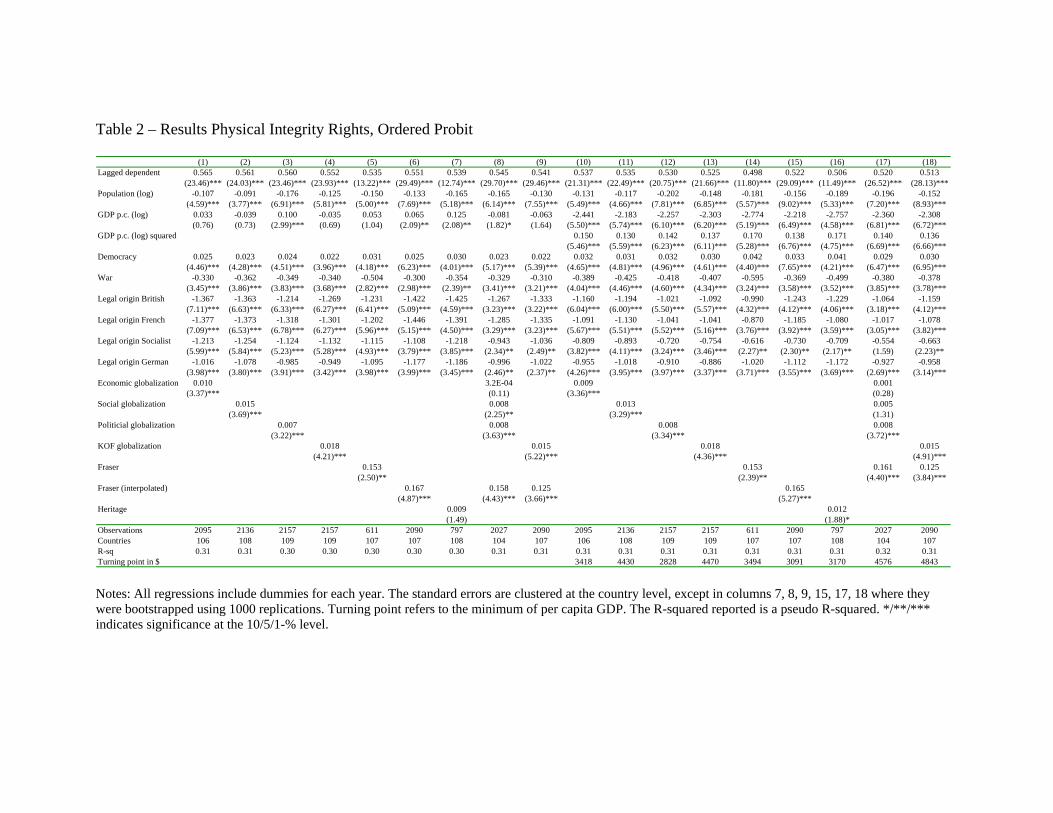
Table 2 – Results Physical Integrity Rights, Ordered Probit
(1) (2) (3) (4) (5) (6) (7) (8) (9) (10) (11) (12) (13) (14) (15) (16) (17) (18)Lagged dependent 0.565 0.561 0.560 0.552 0.535 0.551 0.539 0.545 0.541 0.537 0.535 0.530 0.525 0.498 0.522 0.506 0.520 0.513
(23.46)*** (24.03)*** (23.46)*** (23.93)*** (13.22)*** (29.49)*** (12.74)*** (29.70)*** (29.46)*** (21.31)*** (22.49)*** (20.75)*** (21.66)*** (11.80)*** (29.09)*** (11.49)*** (26.52)*** (28.13)***Population (log) -0.107 -0.091 -0.176 -0.125 -0.150 -0.133 -0.165 -0.165 -0.130 -0.131 -0.117 -0.202 -0.148 -0.181 -0.156 -0.189 -0.196 -0.152
(4.59)*** (3.77)*** (6.91)*** (5.81)*** (5.00)*** (7.69)*** (5.18)*** (6.14)*** (7.55)*** (5.49)*** (4.66)*** (7.81)*** (6.85)*** (5.57)*** (9.02)*** (5.33)*** (7.20)*** (8.93)***GDP p.c. (log) 0.033 -0.039 0.100 -0.035 0.053 0.065 0.125 -0.081 -0.063 -2.441 -2.183 -2.257 -2.303 -2.774 -2.218 -2.757 -2.360 -2.308
(0.76) (0.73) (2.99)*** (0.69) (1.04) (2.09)** (2.08)** (1.82)* (1.64) (5.50)*** (5.74)*** (6.10)*** (6.20)*** (5.19)*** (6.49)*** (4.58)*** (6.81)*** (6.72)***GDP p.c. (log) squared 0.150 0.130 0.142 0.137 0.170 0.138 0.171 0.140 0.136
(5.46)*** (5.59)*** (6.23)*** (6.11)*** (5.28)*** (6.76)*** (4.75)*** (6.69)*** (6.66)***Democracy 0.025 0.023 0.024 0.022 0.031 0.025 0.030 0.023 0.022 0.032 0.031 0.032 0.030 0.042 0.033 0.041 0.029 0.030
(4.46)*** (4.28)*** (4.51)*** (3.96)*** (4.18)*** (6.23)*** (4.01)*** (5.17)*** (5.39)*** (4.65)*** (4.81)*** (4.96)*** (4.61)*** (4.40)*** (7.65)*** (4.21)*** (6.47)*** (6.95)***War -0.330 -0.362 -0.349 -0.340 -0.504 -0.300 -0.354 -0.329 -0.310 -0.389 -0.425 -0.418 -0.407 -0.595 -0.369 -0.499 -0.380 -0.378
(3.45)*** (3.86)*** (3.83)*** (3.68)*** (2.82)*** (2.98)*** (2.39)** (3.41)*** (3.21)*** (4.04)*** (4.46)*** (4.60)*** (4.34)*** (3.24)*** (3.58)*** (3.52)*** (3.85)*** (3.78)***Legal origin British -1.367 -1.363 -1.214 -1.269 -1.231 -1.422 -1.425 -1.267 -1.333 -1.160 -1.194 -1.021 -1.092 -0.990 -1.243 -1.229 -1.064 -1.159
(7.11)*** (6.63)*** (6.33)*** (6.27)*** (6.41)*** (5.09)*** (4.59)*** (3.23)*** (3.22)*** (6.04)*** (6.00)*** (5.50)*** (5.57)*** (4.32)*** (4.12)*** (4.06)*** (3.18)*** (4.12)***Legal origin French -1.377 -1.373 -1.318 -1.301 -1.202 -1.446 -1.391 -1.285 -1.335 -1.091 -1.130 -1.041 -1.041 -0.870 -1.185 -1.080 -1.017 -1.078
(7.09)*** (6.53)*** (6.78)*** (6.27)*** (5.96)*** (5.15)*** (4.50)*** (3.29)*** (3.23)*** (5.67)*** (5.51)*** (5.52)*** (5.16)*** (3.76)*** (3.92)*** (3.59)*** (3.05)*** (3.82)***Legal origin Socialist -1.213 -1.254 -1.124 -1.132 -1.115 -1.108 -1.218 -0.943 -1.036 -0.809 -0.893 -0.720 -0.754 -0.616 -0.730 -0.709 -0.554 -0.663
(5.99)*** (5.84)*** (5.23)*** (5.28)*** (4.93)*** (3.79)*** (3.85)*** (2.34)** (2.49)** (3.82)*** (4.11)*** (3.24)*** (3.46)*** (2.27)** (2.30)** (2.17)** (1.59) (2.23)**Legal origin German -1.016 -1.078 -0.985 -0.949 -1.095 -1.177 -1.186 -0.996 -1.022 -0.955 -1.018 -0.910 -0.886 -1.020 -1.112 -1.172 -0.927 -0.958
(3.98)*** (3.80)*** (3.91)*** (3.42)*** (3.98)*** (3.99)*** (3.45)*** (2.46)** (2.37)** (4.26)*** (3.95)*** (3.97)*** (3.37)*** (3.71)*** (3.55)*** (3.69)*** (2.69)*** (3.14)***Economic globalization 0.010 3.2E-04 0.009 0.001
(3.37)*** (0.11) (3.36)*** (0.28)Social globalization 0.015 0.008 0.013 0.005
(3.69)*** (2.25)** (3.29)*** (1.31)Politicial globalization 0.007 0.008 0.008 0.008
(3.22)*** (3.63)*** (3.34)*** (3.72)***KOF globalization 0.018 0.015 0.018 0.015
(4.21)*** (5.22)*** (4.36)*** (4.91)***Fraser 0.153 0.153 0.161 0.125
(2.50)** (2.39)** (4.40)*** (3.84)***Fraser (interpolated) 0.167 0.158 0.125 0.165
(4.87)*** (4.43)*** (3.66)*** (5.27)***Heritage 0.009 0.012
(1.49) (1.88)*Observations 2095 2136 2157 2157 611 2090 797 2027 2090 2095 2136 2157 2157 611 2090 797 2027 2090Countries 106 108 109 109 107 107 108 104 107 106 108 109 109 107 107 108 104 107R-sq 0.31 0.31 0.30 0.30 0.30 0.30 0.30 0.31 0.31 0.31 0.31 0.31 0.31 0.31 0.31 0.31 0.32 0.31Turning point in $ 3418 4430 2828 4470 3494 3091 3170 4576 4843 Notes: All regressions include dummies for each year. The standard errors are clustered at the country level, except in columns 7, 8, 9, 15, 17, 18 where they were bootstrapped using 1000 replications. Turning point refers to the minimum of per capita GDP. The R-squared reported is a pseudo R-squared. */**/*** indicates significance at the 10/5/1-% level.
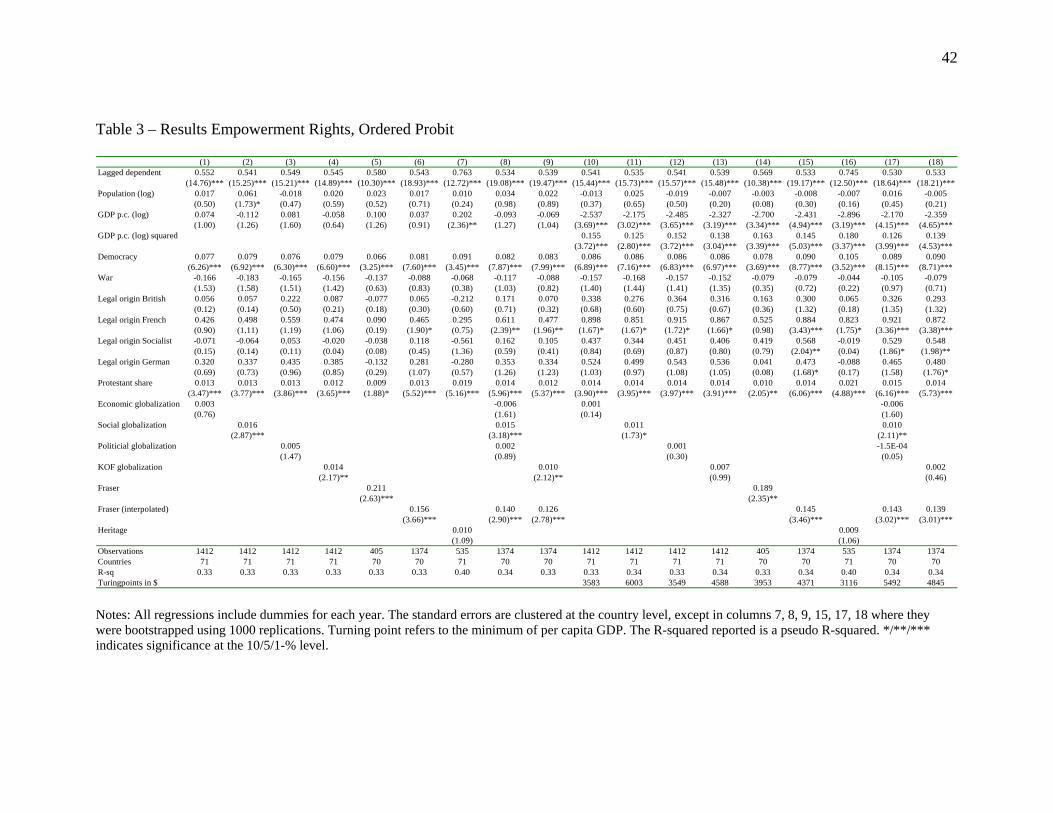
42
Table 3 – Results Empowerment Rights, Ordered Probit
(1) (2) (3) (4) (5) (6) (7) (8) (9) (10) (11) (12) (13) (14) (15) (16) (17) (18)Lagged dependent 0.552 0.541 0.549 0.545 0.580 0.543 0.763 0.534 0.539 0.541 0.535 0.541 0.539 0.569 0.533 0.745 0.530 0.533
(14.76)*** (15.25)*** (15.21)*** (14.89)*** (10.30)*** (18.93)*** (12.72)*** (19.08)*** (19.47)*** (15.44)*** (15.73)*** (15.57)*** (15.48)*** (10.38)*** (19.17)*** (12.50)*** (18.64)*** (18.21)***Population (log) 0.017 0.061 -0.018 0.020 0.023 0.017 0.010 0.034 0.022 -0.013 0.025 -0.019 -0.007 -0.003 -0.008 -0.007 0.016 -0.005
(0.50) (1.73)* (0.47) (0.59) (0.52) (0.71) (0.24) (0.98) (0.89) (0.37) (0.65) (0.50) (0.20) (0.08) (0.30) (0.16) (0.45) (0.21)GDP p.c. (log) 0.074 -0.112 0.081 -0.058 0.100 0.037 0.202 -0.093 -0.069 -2.537 -2.175 -2.485 -2.327 -2.700 -2.431 -2.896 -2.170 -2.359
(1.00) (1.26) (1.60) (0.64) (1.26) (0.91) (2.36)** (1.27) (1.04) (3.69)*** (3.02)*** (3.65)*** (3.19)*** (3.34)*** (4.94)*** (3.19)*** (4.15)*** (4.65)***GDP p.c. (log) squared 0.155 0.125 0.152 0.138 0.163 0.145 0.180 0.126 0.139
(3.72)*** (2.80)*** (3.72)*** (3.04)*** (3.39)*** (5.03)*** (3.37)*** (3.99)*** (4.53)***Democracy 0.077 0.079 0.076 0.079 0.066 0.081 0.091 0.082 0.083 0.086 0.086 0.086 0.086 0.078 0.090 0.105 0.089 0.090
(6.26)*** (6.92)*** (6.30)*** (6.60)*** (3.25)*** (7.60)*** (3.45)*** (7.87)*** (7.99)*** (6.89)*** (7.16)*** (6.83)*** (6.97)*** (3.69)*** (8.77)*** (3.52)*** (8.15)*** (8.71)***War -0.166 -0.183 -0.165 -0.156 -0.137 -0.088 -0.068 -0.117 -0.088 -0.157 -0.168 -0.157 -0.152 -0.079 -0.079 -0.044 -0.105 -0.079
(1.53) (1.58) (1.51) (1.42) (0.63) (0.83) (0.38) (1.03) (0.82) (1.40) (1.44) (1.41) (1.35) (0.35) (0.72) (0.22) (0.97) (0.71)Legal origin British 0.056 0.057 0.222 0.087 -0.077 0.065 -0.212 0.171 0.070 0.338 0.276 0.364 0.316 0.163 0.300 0.065 0.326 0.293
(0.12) (0.14) (0.50) (0.21) (0.18) (0.30) (0.60) (0.71) (0.32) (0.68) (0.60) (0.75) (0.67) (0.36) (1.32) (0.18) (1.35) (1.32)Legal origin French 0.426 0.498 0.559 0.474 0.090 0.465 0.295 0.611 0.477 0.898 0.851 0.915 0.867 0.525 0.884 0.823 0.921 0.872
(0.90) (1.11) (1.19) (1.06) (0.19) (1.90)* (0.75) (2.39)** (1.96)** (1.67)* (1.67)* (1.72)* (1.66)* (0.98) (3.43)*** (1.75)* (3.36)*** (3.38)***Legal origin Socialist -0.071 -0.064 0.053 -0.020 -0.038 0.118 -0.561 0.162 0.105 0.437 0.344 0.451 0.406 0.419 0.568 -0.019 0.529 0.548
(0.15) (0.14) (0.11) (0.04) (0.08) (0.45) (1.36) (0.59) (0.41) (0.84) (0.69) (0.87) (0.80) (0.79) (2.04)** (0.04) (1.86)* (1.98)**Legal origin German 0.320 0.337 0.435 0.385 -0.132 0.281 -0.280 0.353 0.334 0.524 0.499 0.543 0.536 0.041 0.473 -0.088 0.465 0.480
(0.69) (0.73) (0.96) (0.85) (0.29) (1.07) (0.57) (1.26) (1.23) (1.03) (0.97) (1.08) (1.05) (0.08) (1.68)* (0.17) (1.58) (1.76)*Protestant share 0.013 0.013 0.013 0.012 0.009 0.013 0.019 0.014 0.012 0.014 0.014 0.014 0.014 0.010 0.014 0.021 0.015 0.014
(3.47)*** (3.77)*** (3.86)*** (3.65)*** (1.88)* (5.52)*** (5.16)*** (5.96)*** (5.37)*** (3.90)*** (3.95)*** (3.97)*** (3.91)*** (2.05)** (6.06)*** (4.88)*** (6.16)*** (5.73)***Economic globalization 0.003 -0.006 0.001 -0.006
(0.76) (1.61) (0.14) (1.60)Social globalization 0.016 0.015 0.011 0.010
(2.87)*** (3.18)*** (1.73)* (2.11)**Politicial globalization 0.005 0.002 0.001 -1.5E-04
(1.47) (0.89) (0.30) (0.05)KOF globalization 0.014 0.010 0.007 0.002
(2.17)** (2.12)** (0.99) (0.46)Fraser 0.211 0.189
(2.63)*** (2.35)**Fraser (interpolated) 0.156 0.140 0.126 0.145 0.143 0.139
(3.66)*** (2.90)*** (2.78)*** (3.46)*** (3.02)*** (3.01)***Heritage 0.010 0.009
(1.09) (1.06)Observations 1412 1412 1412 1412 405 1374 535 1374 1374 1412 1412 1412 1412 405 1374 535 1374 1374Countries 71 71 71 71 70 70 71 70 70 71 71 71 71 70 70 71 70 70R-sq 0.33 0.33 0.33 0.33 0.33 0.33 0.40 0.34 0.33 0.33 0.34 0.33 0.34 0.33 0.34 0.40 0.34 0.34Turingpoints in $ 3583 6003 3549 4588 3953 4371 3116 5492 4845 Notes: All regressions include dummies for each year. The standard errors are clustered at the country level, except in columns 7, 8, 9, 15, 17, 18 where they were bootstrapped using 1000 replications. Turning point refers to the minimum of per capita GDP. The R-squared reported is a pseudo R-squared. */**/*** indicates significance at the 10/5/1-% level.

Table 4 – Granger Causality Tests
[.. .] Granger-causes [...] is Granger-caused by [...] Granger-causes [...] is Granger-caused by
Economic globalization 0.00 0.45 0.00 0.05Social globalization 0.00 0.85 0.00 0.16Politicial globalization 0.00 0.98 0.00 0.00KOF globalization 0.00 0.70 0.00 0.00Fraser 0.00 0.53 0.00 0.85Heritage 0.00 0.32 0.00 0.12
Physical Integrity Rights Empowerment Rights
Notes: The table reports p-values for Granger causality tests using two lags. The H0 is that variable A does not Granger-cause B. Therefore, the first two entries indicate that economic globalization Granger-causes physical integrity while physical integrity does not Granger-cause economic globalization. Table 5 – Marginal Effects Index value 0 1 2 3 4 5 6 7 8 9 10 E[y
Physical IntegritySample Frequency 0.043 0.051 0.074 0.091 0.132 0.137 0.140 0.168 0.164 5.014Probability at mean 2.7E-04 0.003 0.018 0.061 0.191 0.293 0.266 0.149 0.020 5.246
Economic globalization -9.2E-06 -7.7E-05 -3.7E-04 -0.001 -0.002 -5.6E-04 0.001 0.002 4.4E-04 0.011p-value 0.14 0.08 0.07 0.08 0.08 0.09 0.08 0.07 0.09 0.07
Social globalization -1.2E-05 -1.0E-04 -4.9E-04 -0.001 -0.002 -8.3E-04 0.002 0.003 6.4E-04 0.016p-value 0.02 0.00 0.00 0.00 0.00 0.00 0.00 0.00 0.00 0.00
Political globalization -8.5E-06 -6.7E-05 -3.1E-04 -0.001 -0.001 -4.6E-04 0.001 0.002 3.9E-04 0.010p-value 0.04 0.01 0.00 0.00 0.00 0.01 0.00 0.00 0.00 0.00
KOF globalization -1.9E-05 -1.5E-04 -6.9E-04 -0.002 -0.003 -1.1E-03 0.003 0.004 8.5E-04 0.022p-value 0.02 0.00 0.00 0.00 0.00 0.00 0.00 0.00 0.00 0.00
Fraser -8.7E-05 -0.001 -0.008 -0.014 -0.029 -0.006 0.022 0.031 0.006 0.190p-value 0.17 0.04 0.03 0.03 0.02 0.12 0.03 0.02 0.02 0.02
Fraser (interpolated) -1.9E-04 -0.001 -0.006 -0.016 -0.030 -0.011 0.023 0.034 0.008 0.204p-value 0.00 0.00 0.00 0.00 0.00 0.00 0.00 0.00 0.00 0.00
Heritage -8.1E-06 -8.5E-05 -0.001 -0.001 -0.002 0.000 0.002 0.003 3.1E-04 0.015p-value 0.21 0.13 0.09 0.07 0.07 0.13 0.06 0.07 0.11 0.06
EmpowermentSample Frequency 0.005 0.007 0.017 0.036 0.042 0.063 0.062 0.105 0.159 0.216 0.288 7.831Probability at mean 1.6E-09 1.2E-07 5.8E-06 2.2E-04 0.002 0.019 0.056 0.174 0.334 0.319 0.095 8.158
Social globalization -1.1E-10 -7.0E-09 -2.9E-07 -9.1E-06 -7.5E-05 -4.8E-04 -0.001 -0.002 -7.8E-04 2.4E-03 1.9E-03 0.012p-value 0.54 0.47 0.42 0.25 0.19 0.10 0.08 0.09 0.11 0.10 0.08 0.08
Fraser -2.2E-08 -2.6E-06 -6.3E-05 -0.001 -0.006 -0.018 -0.034 -0.016 0.044 0.031 0.196p-value 0.58 0.47 0.33 0.21 0.05 0.03 0.03 0.05 0.03 0.02 0.02
Fraser (interpolated) -1.8E-09 -6.8E-08 -3.6E-06 -1.1E-04 -0.001 -0.006 -0.013 -0.025 -0.011 0.032 0.025 0.156p-value 0.53 0.41 0.22 0.03 0.01 0.00 0.00 0.00 0.00 0.001 0.001 0.00
]
Notes: The table reports the marginal effects corresponding to Tables 2 and 3 by index values. The row ‘sample frequency’ reports the observed frequency in the sample, while ‘probability at mean’ yields the probability for observing a given index value according to the estimated model.
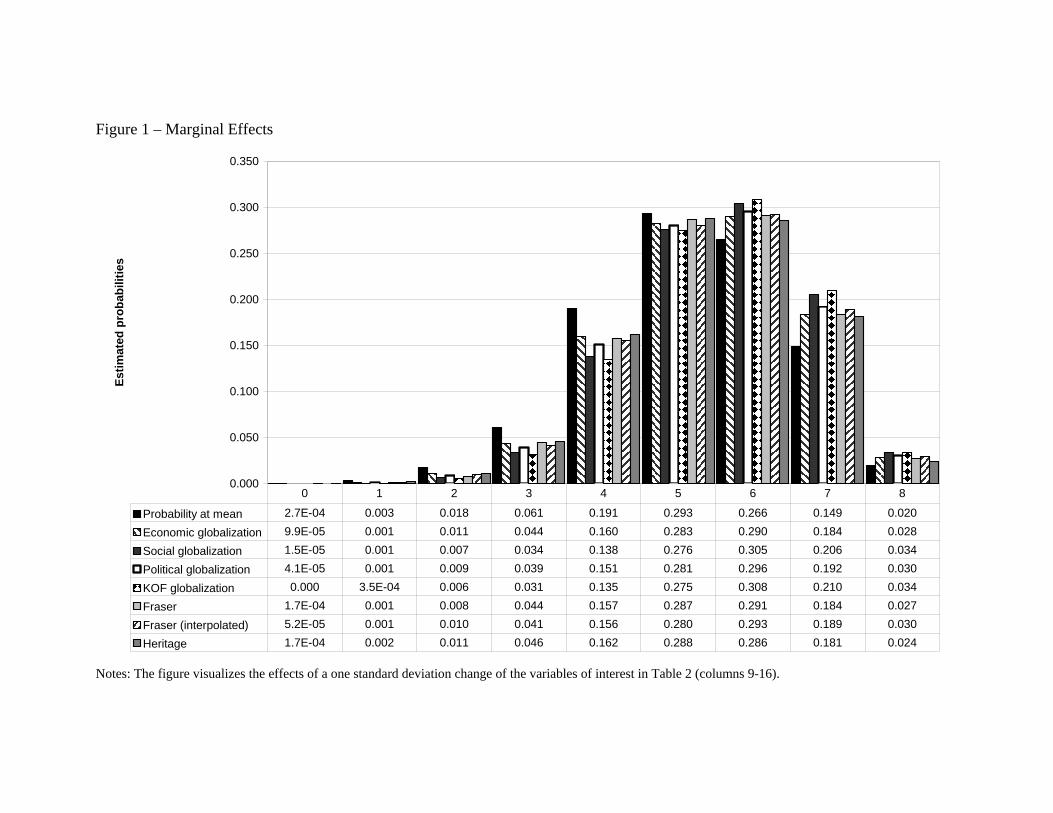
Figure 1 – Marginal Effects
0.000
0.050
0.100
0.150
0.200
0.250
0.300
0.350
Estim
ated
pro
babi
litie
s
Probability at mean 2.7E-04 0.003 0.018 0.061 0.191 0.293 0.266 0.149 0.020
Economic globalization 9.9E-05 0.001 0.011 0.044 0.160 0.283 0.290 0.184 0.028
Social globalization 1.5E-05 0.001 0.007 0.034 0.138 0.276 0.305 0.206 0.034
Political globalization 4.1E-05 0.001 0.009 0.039 0.151 0.281 0.296 0.192 0.030
KOF globalization 0.000 3.5E-04 0.006 0.031 0.135 0.275 0.308 0.210 0.034
Fraser 1.7E-04 0.001 0.008 0.044 0.157 0.287 0.291 0.184 0.027
Fraser (interpolated) 5.2E-05 0.001 0.010 0.041 0.156 0.280 0.293 0.189 0.030
Heritage 1.7E-04 0.002 0.011 0.046 0.162 0.288 0.286 0.181 0.024
0 1 2 3 4 5 6 7 8
Notes: The figure visualizes the effects of a one standard deviation change of the variables of interest in Table 2 (columns 9-16).
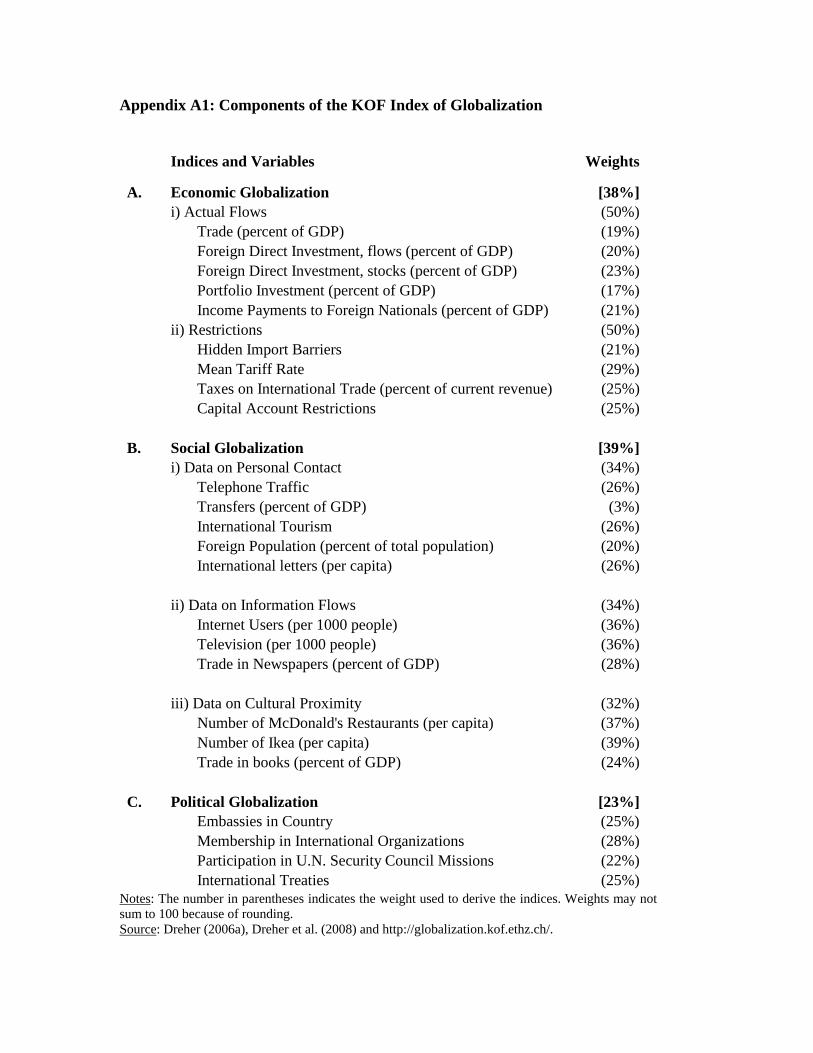
Appendix A1: Components of the KOF Index of Globalization
Indices and Variables Weights
A. Economic Globalization [38%]i) Actual Flows (50%)
Trade (percent of GDP) (19%)Foreign Direct Investment, flows (percent of GDP) (20%)Foreign Direct Investment, stocks (percent of GDP) (23%)Portfolio Investment (percent of GDP) (17%)Income Payments to Foreign Nationals (percent of GDP) (21%)
ii) Restrictions (50%)Hidden Import Barriers (21%)Mean Tariff Rate (29%)Taxes on International Trade (percent of current revenue) (25%)Capital Account Restrictions (25%)
B. Social Globalization [39%]i) Data on Personal Contact (34%)
Telephone Traffic (26%)Transfers (percent of GDP) (3%)International Tourism (26%)Foreign Population (percent of total population) (20%)International letters (per capita) (26%)
ii) Data on Information Flows (34%)Internet Users (per 1000 people) (36%)Television (per 1000 people) (36%)Trade in Newspapers (percent of GDP) (28%)
iii) Data on Cultural Proximity (32%)Number of McDonald's Restaurants (per capita) (37%)Number of Ikea (per capita) (39%)Trade in books (percent of GDP) (24%)
C. Political Globalization [23%]Embassies in Country (25%)Membership in International Organizations (28%)Participation in U.N. Security Council Missions (22%)International Treaties (25%)
Notes: The number in parentheses indicates the weight used to derive the indices. Weights may not sum to 100 because of rounding. Source: Dreher (2006a), Dreher et al. (2008) and http://globalization.kof.ethz.ch/.
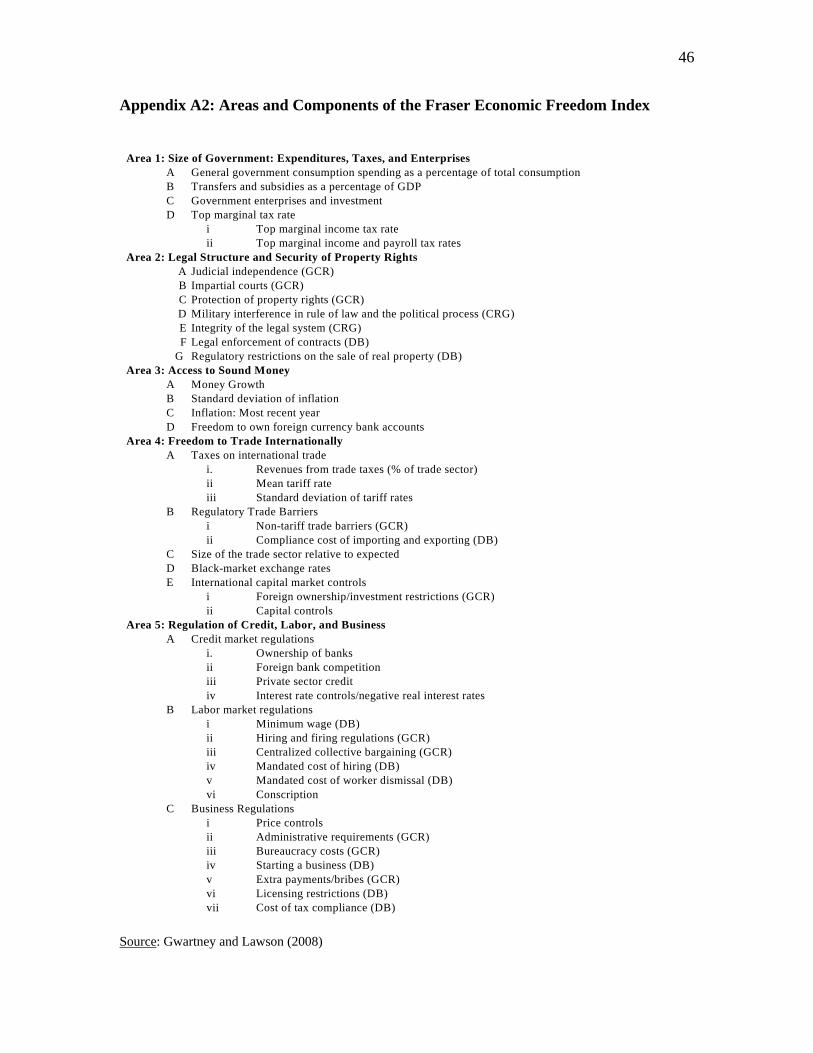
46
Appendix A2: Areas and Components of the Fraser Economic Freedom Index
Area 1: Size of Government: Expenditures, Taxes, and EnterprisesA General government consumption spending as a percentage of total consumptionB Transfers and subsidies as a percentage of GDPC Government enterprises and investment D Top marginal tax rate
i Top marginal income tax rateii Top marginal income and payroll tax rates
Area 2: Legal Structure and Security of Property RightsA Judicial independence (GCR)B Impartial courts (GCR)C Protection of property rights (GCR)D Military interference in rule of law and the political process (CRG)E Integrity of the legal system (CRG)F Legal enforcement of contracts (DB)
G Regulatory restrictions on the sale of real property (DB)Area 3: Access to Sound Money
A Money GrowthB Standard deviation of inflationC Inflation: Most recent yearD Freedom to own foreign currency bank accounts
Area 4: Freedom to Trade InternationallyA Taxes on international trade
i. Revenues from trade taxes (% of trade sector)ii Mean tariff rateiii Standard deviation of tariff rates
B Regulatory Trade Barriersi Non-tariff trade barriers (GCR)ii Compliance cost of importing and exporting (DB)
C Size of the trade sector relative to expectedD Black-market exchange ratesE International capital market controls
i Foreign ownership/investment restrictions (GCR)ii Capital controls
Area 5: Regulation of Credit, Labor, and BusinessA Credit market regulations
i. Ownership of banksii Foreign bank competitioniii Private sector creditiv Interest rate controls/negative real interest rates
B Labor market regulationsi Minimum wage (DB)ii Hiring and firing regulations (GCR)iii Centralized collective bargaining (GCR)iv Mandated cost of hiring (DB)v Mandated cost of worker dismissal (DB)vi Conscription
C Business Regulationsi Price controlsii Administrative requirements (GCR)iii Bureaucracy costs (GCR)iv Starting a business (DB)v Extra payments/bribes (GCR)vi Licensing restrictions (DB)vii Cost of tax compliance (DB)
Source: Gwartney and Lawson (2008)
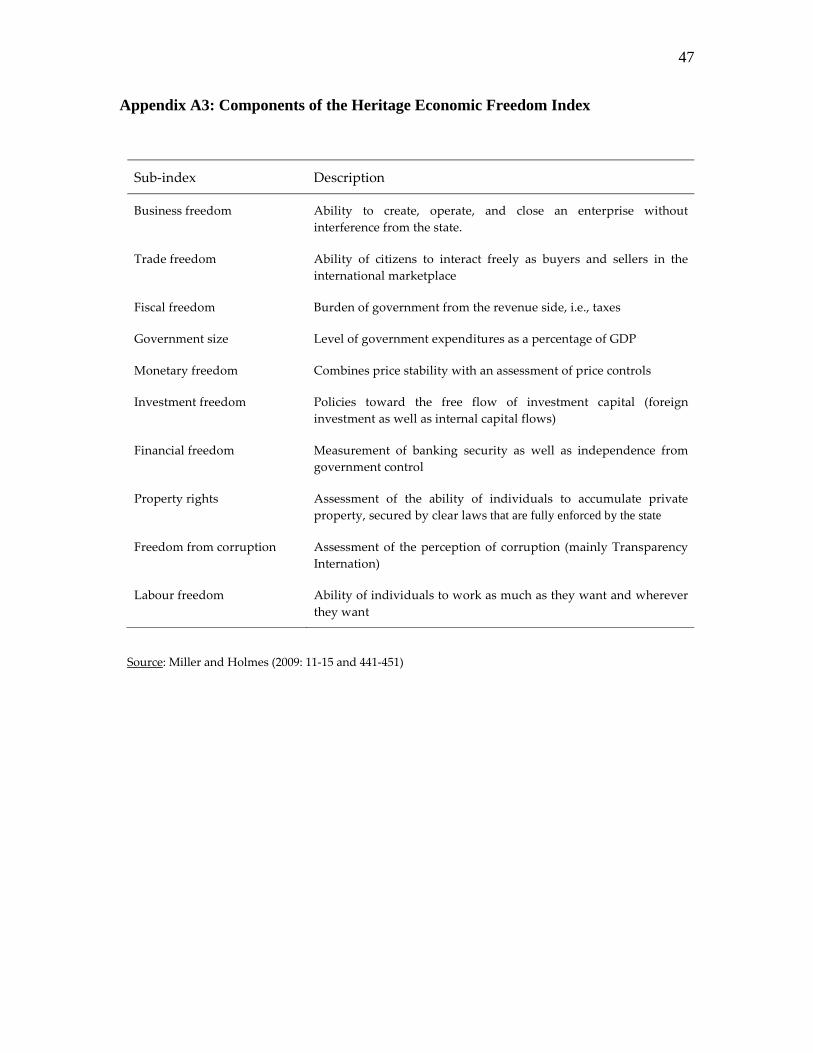
47
Appendix A3: Components of the Heritage Economic Freedom Index
Sub‐index Description
Business freedom Ability to create, operate, and close an enterprise without interference from the state.
Trade freedom Ability of citizens to interact freely as buyers and sellers in the international marketplace
Fiscal freedom Burden of government from the revenue side, i.e., taxes
Government size Level of government expenditures as a percentage of GDP
Monetary freedom Combines price stability with an assessment of price controls
Investment freedom Policies toward the free flow of investment capital (foreign investment as well as internal capital flows)
Financial freedom Measurement of banking security as well as independence from government control
Property rights Assessment of the ability of individuals to accumulate private property, secured by clear laws that are fully enforced by the state
Freedom from corruption Assessment of the perception of corruption (mainly Transparency Internation)
Labour freedom Ability of individuals to work as much as they want and wherever they want
Source: Miller and Holmes (2009: 11‐15 and 441‐451)
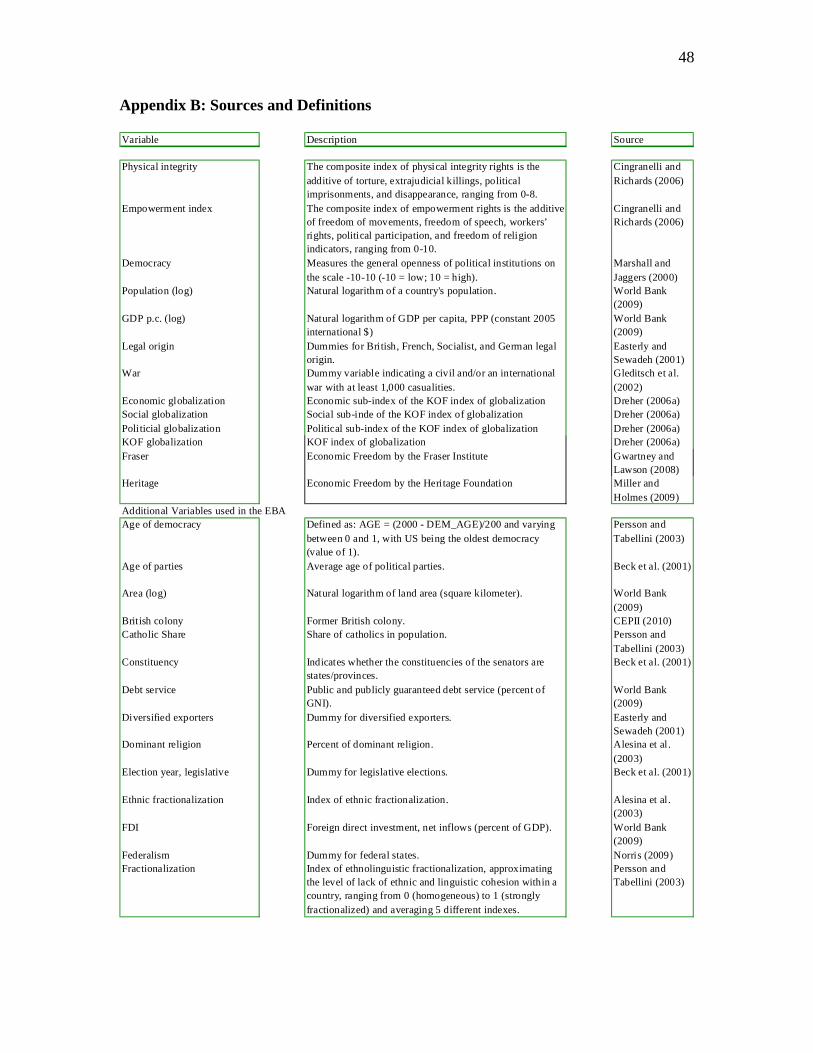
48
Appendix B: Sources and Definitions
Variable Description Source
Physical integrity The composite index of physical integrity rights is the additive of torture, extrajudicial killings, political imprisonments, and disappearance, ranging from 0-8.
Cingranelli and Richards (2006)
Empowerment index The composite index of empowerment rights is the additive of freedom of movements, freedom of speech, workers’ rights, political participation, and freedom of religion indicators, ranging from 0-10.
Cingranelli and Richards (2006)
Democracy Measures the general openness of political institutions on the scale -10-10 (-10 = low; 10 = high).
Marshall and Jaggers (2000)
Population (log) Natural logarithm of a country's population. World Bank (2009)
GDP p.c. (log) Natural logarithm of GDP per capita, PPP (constant 2005 international $)
World Bank (2009)
Legal origin Dummies for British, French, Socialist, and German legal origin.
Easterly and Sewadeh (2001)
War Dummy variable indicating a civil and/or an international war with at least 1,000 casualities.
Gleditsch et al. (2002)
Economic globalization Economic sub-index of the KOF index of globalization Dreher (2006a)Social globalization Social sub-inde of the KOF index of globalization Dreher (2006a)Politicial globalization Political sub-index of the KOF index of globalization Dreher (2006a)KOF globalization KOF index of globalization Dreher (2006a)Fraser Economic Freedom by the Fraser Institute Gwartney and
Lawson (2008)Heritage Economic Freedom by the Heritage Foundation Miller and
Holmes (2009)Additional Variables used in the EBAAge of democracy Defined as: AGE = (2000 - DEM_AGE)/200 and varying
between 0 and 1, with US being the oldest democracy (value of 1).
Persson and Tabellini (2003)
Age of parties Average age of political parties. Beck et al. (2001)
Area (log) Natural logarithm of land area (square kilometer). World Bank (2009)
British colony Former British colony. CEPII (2010)Catholic Share Share of catholics in population. Persson and
Tabellini (2003)Constituency Indicates whether the constituencies of the senators are
states/provinces.Beck et al. (2001)
Debt service Public and publicly guaranteed debt service (percent of GNI).
World Bank (2009)
Diversified exporters Dummy for diversified exporters. Easterly and Sewadeh (2001)
Dominant religion Percent of dominant religion. Alesina et al. (2003)
Election year, legislative Dummy for legislative elections. Beck et al. (2001)
Ethnic fractionalization Index of ethnic fractionalization. Alesina et al. (2003)
FDI Foreign direct investment, net inflows (percent of GDP). World Bank (2009)
Federalism Dummy for federal states. Norris (2009)Fractionalization Index of ethnolinguistic fractionalization, approximating
the level of lack of ethnic and linguistic cohesion within a country, ranging from 0 (homogeneous) to 1 (strongly fractionalized) and averaging 5 different indexes.
Persson and Tabellini (2003)
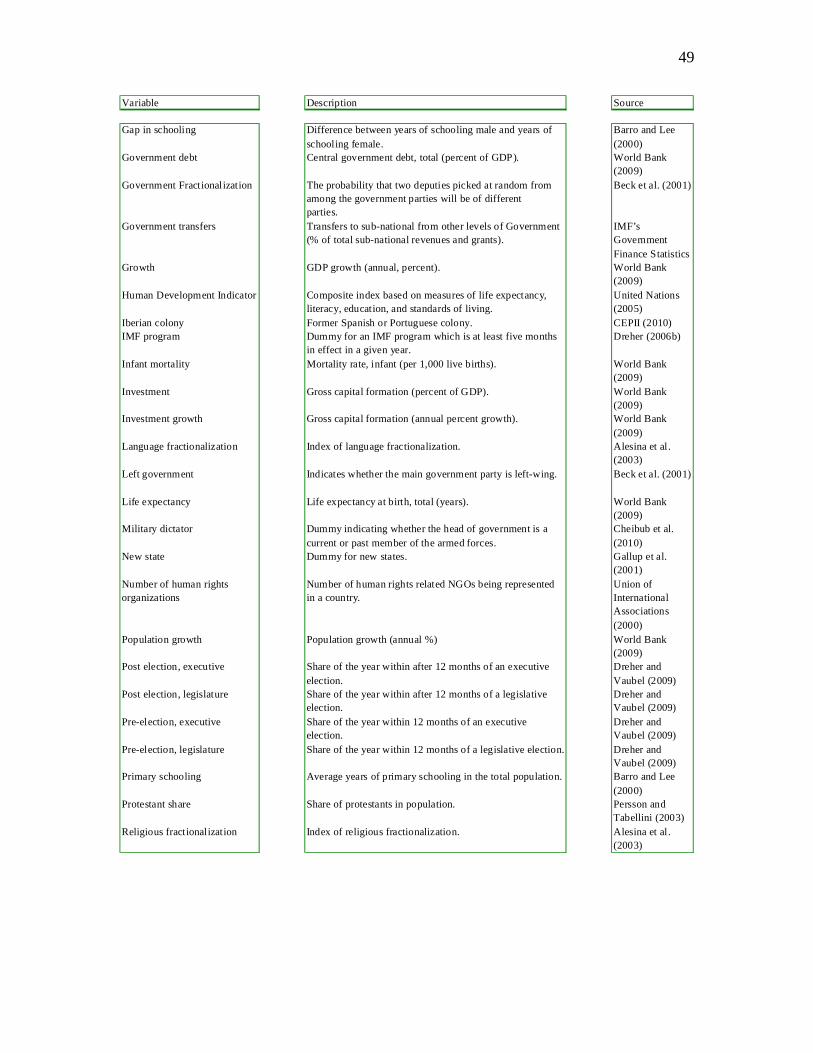
49
Variable Description Source
Gap in schooling Difference between years of schooling male and years of schooling female.
Barro and Lee (2000)
Government debt Central government debt, total (percent of GDP). World Bank (2009)
Government Fractionalization The probability that two deputies picked at random from among the government parties will be of differentparties.
Beck et al. (2001)
Government transfers Transfers to sub-national from other levels of Government (% of total sub-national revenues and grants).
IMF’s Government Finance Statistics
Growth GDP growth (annual, percent). World Bank (2009)
Human Development Indicator Composite index based on measures of life expectancy, literacy, education, and standards of living.
United Nations (2005)
Iberian colony Former Spanish or Portuguese colony. CEPII (2010)IMF program Dummy for an IMF program which is at least five months
in effect in a given year.Dreher (2006b)
Infant mortality Mortality rate, infant (per 1,000 live births). World Bank (2009)
Investment Gross capital formation (percent of GDP). World Bank (2009)
Investment growth Gross capital formation (annual percent growth). World Bank (2009)
Language fractionalization Index of language fractionalization. Alesina et al. (2003)
Left government Indicates whether the main government party is left-wing. Beck et al. (2001)
Life expectancy Life expectancy at birth, total (years). World Bank (2009)
Military dictator Dummy indicating whether the head of government is a current or past member of the armed forces.
Cheibub et al. (2010)
New state Dummy for new states. Gallup et al. (2001)
Number of human rights organizations
Number of human rights related NGOs being represented in a country.
Union of International Associations (2000)
Population growth Population growth (annual %) World Bank (2009)
Post election, executive Share of the year within after 12 months of an executive election.
Dreher and Vaubel (2009)
Post election, legislature Share of the year within after 12 months of a legislative election.
Dreher and Vaubel (2009)
Pre-election, executive Share of the year within 12 months of an executive election.
Dreher and Vaubel (2009)
Pre-election, legislature Share of the year within 12 months of a legislative election. Dreher and Vaubel (2009)
Primary schooling Average years of primary schooling in the total population. Barro and Lee (2000)
Protestant share Share of protestants in population. Persson and Tabellini (2003)
Religious fractionalization Index of religious fractionalization. Alesina et al. (2003)
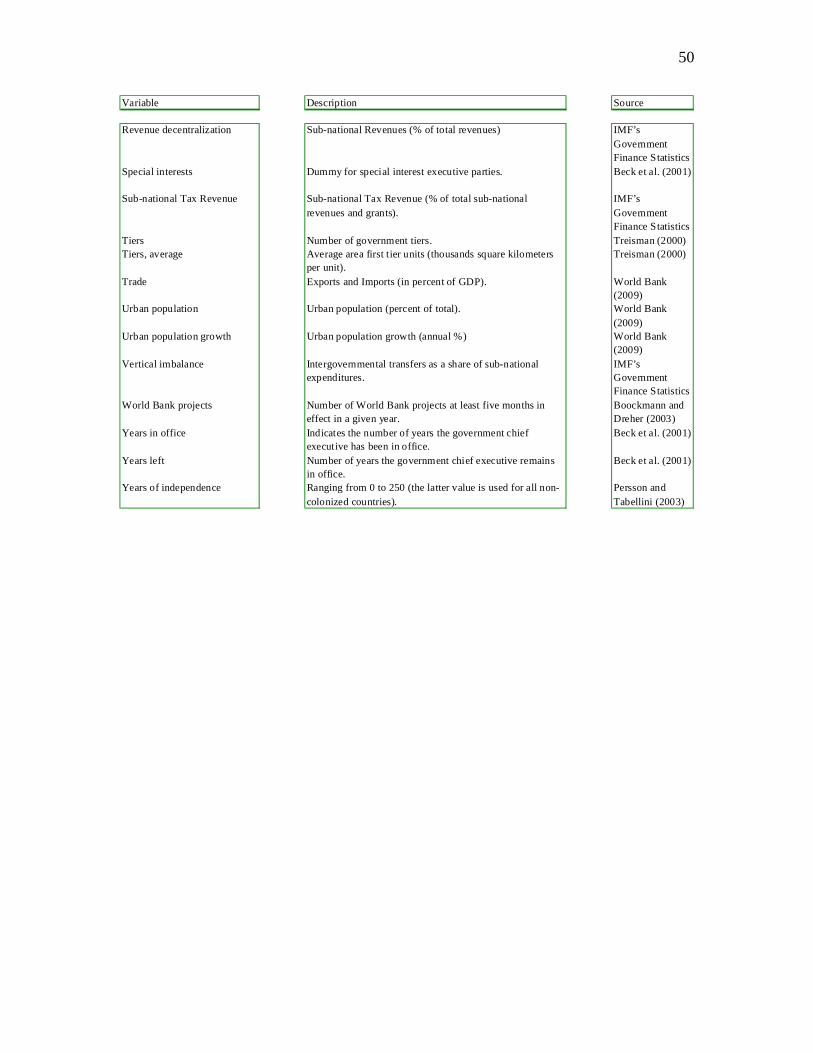
50
Variable Description Source
Revenue decentralization Sub-national Revenues (% of total revenues) IMF’s Government Finance Statistics
Special interests Dummy for special interest executive parties. Beck et al. (2001)
Sub-national Tax Revenue Sub-national Tax Revenue (% of total sub-national revenues and grants).
IMF’s Government Finance Statistics
Tiers Number of government tiers. Treisman (2000)Tiers, average Average area first tier units (thousands square kilometers
per unit).Treisman (2000)
Trade Exports and Imports (in percent of GDP). World Bank (2009)
Urban population Urban population (percent of total). World Bank (2009)
Urban population growth Urban population growth (annual %) World Bank (2009)
Vertical imbalance Intergovernmental transfers as a share of sub-national expenditures.
IMF’s Government Finance Statistics
World Bank projects Number of World Bank projects at least five months in effect in a given year.
Boockmann and Dreher (2003)
Years in office Indicates the number of years the government chief executive has been in office.
Beck et al. (2001)
Years left Number of years the government chief executive remains in office.
Beck et al. (2001)
Years of independence Ranging from 0 to 250 (the latter value is used for all non-colonized countries).
Persson and Tabellini (2003)
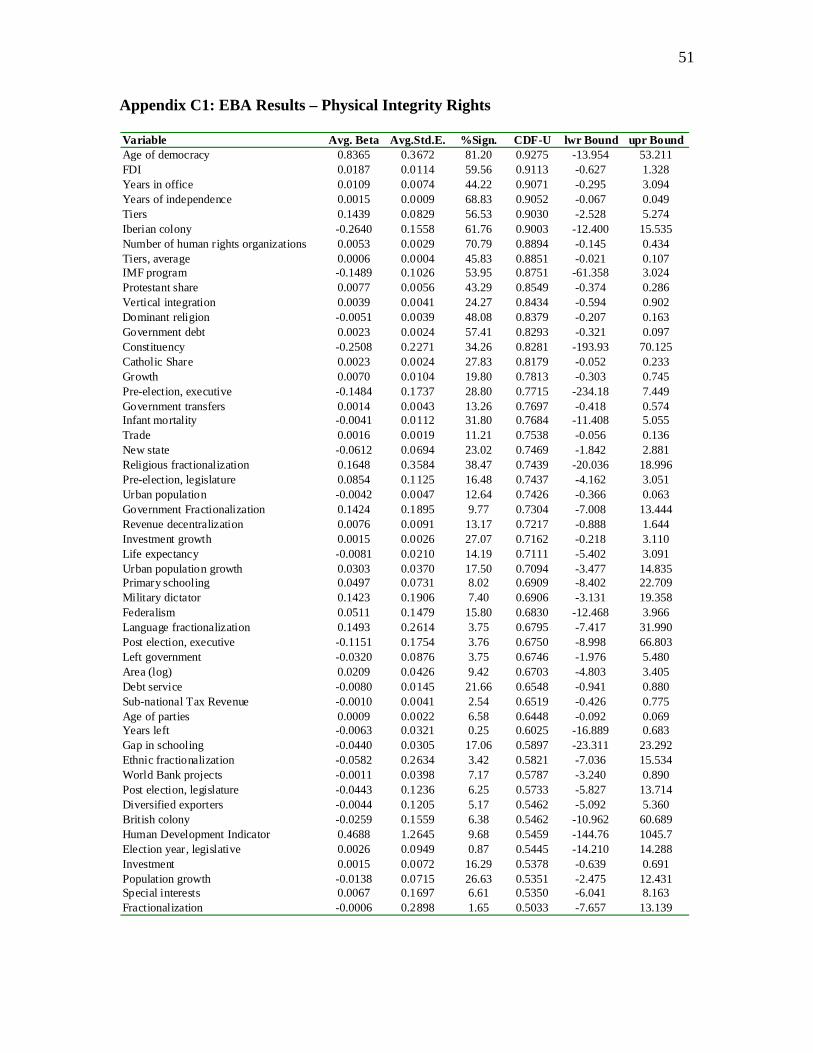
51
Appendix C1: EBA Results – Physical Integrity Rights
Variable Avg. Beta Avg.Std.E. %Sign. CDF-U lwr Bound upr BoundAge of democracy 0.8365 0.3672 81.20 0.9275 -13.954 53.211FDI 0.0187 0.0114 59.56 0.9113 -0.627 1.328Years in office 0.0109 0.0074 44.22 0.9071 -0.295 3.094Years of independence 0.0015 0.0009 68.83 0.9052 -0.067 0.049Tiers 0.1439 0.0829 56.53 0.9030 -2.528 5.274Iberian colony -0.2640 0.1558 61.76 0.9003 -12.400 15.535Number of human rights organizations 0.0053 0.0029 70.79 0.8894 -0.145 0.434Tiers, average 0.0006 0.0004 45.83 0.8851 -0.021 0.107IMF program -0.1489 0.1026 53.95 0.8751 -61.358 3.024Protestant share 0.0077 0.0056 43.29 0.8549 -0.374 0.286Vertical integration 0.0039 0.0041 24.27 0.8434 -0.594 0.902Dominant religion -0.0051 0.0039 48.08 0.8379 -0.207 0.163Government debt 0.0023 0.0024 57.41 0.8293 -0.321 0.097Constituency -0.2508 0.2271 34.26 0.8281 -193.93 70.125Catholic Share 0.0023 0.0024 27.83 0.8179 -0.052 0.233Growth 0.0070 0.0104 19.80 0.7813 -0.303 0.745Pre-election, executive -0.1484 0.1737 28.80 0.7715 -234.18 7.449Government transfers 0.0014 0.0043 13.26 0.7697 -0.418 0.574Infant mortality -0.0041 0.0112 31.80 0.7684 -11.408 5.055Trade 0.0016 0.0019 11.21 0.7538 -0.056 0.136New state -0.0612 0.0694 23.02 0.7469 -1.842 2.881Religious fractionalization 0.1648 0.3584 38.47 0.7439 -20.036 18.996Pre-election, legislature 0.0854 0.1125 16.48 0.7437 -4.162 3.051Urban population -0.0042 0.0047 12.64 0.7426 -0.366 0.063Government Fractionalization 0.1424 0.1895 9.77 0.7304 -7.008 13.444Revenue decentralization 0.0076 0.0091 13.17 0.7217 -0.888 1.644Investment growth 0.0015 0.0026 27.07 0.7162 -0.218 3.110Life expectancy -0.0081 0.0210 14.19 0.7111 -5.402 3.091Urban population growth 0.0303 0.0370 17.50 0.7094 -3.477 14.835Primary schooling 0.0497 0.0731 8.02 0.6909 -8.402 22.709Military dictator 0.1423 0.1906 7.40 0.6906 -3.131 19.358Federalism 0.0511 0.1479 15.80 0.6830 -12.468 3.966Language fractionalization 0.1493 0.2614 3.75 0.6795 -7.417 31.990Post election, executive -0.1151 0.1754 3.76 0.6750 -8.998 66.803Left government -0.0320 0.0876 3.75 0.6746 -1.976 5.480Area (log) 0.0209 0.0426 9.42 0.6703 -4.803 3.405Debt service -0.0080 0.0145 21.66 0.6548 -0.941 0.880Sub-national Tax Revenue -0.0010 0.0041 2.54 0.6519 -0.426 0.775Age of parties 0.0009 0.0022 6.58 0.6448 -0.092 0.069Years left -0.0063 0.0321 0.25 0.6025 -16.889 0.683Gap in schooling -0.0440 0.0305 17.06 0.5897 -23.311 23.292Ethnic fractionalization -0.0582 0.2634 3.42 0.5821 -7.036 15.534World Bank projects -0.0011 0.0398 7.17 0.5787 -3.240 0.890Post election, legislature -0.0443 0.1236 6.25 0.5733 -5.827 13.714Diversified exporters -0.0044 0.1205 5.17 0.5462 -5.092 5.360British colony -0.0259 0.1559 6.38 0.5462 -10.962 60.689Human Development Indicator 0.4688 1.2645 9.68 0.5459 -144.76 1045.7Election year, legislative 0.0026 0.0949 0.87 0.5445 -14.210 14.288Investment 0.0015 0.0072 16.29 0.5378 -0.639 0.691Population growth -0.0138 0.0715 26.63 0.5351 -2.475 12.431Special interests 0.0067 0.1697 6.61 0.5350 -6.041 8.163Fractionalization -0.0006 0.2898 1.65 0.5033 -7.657 13.139
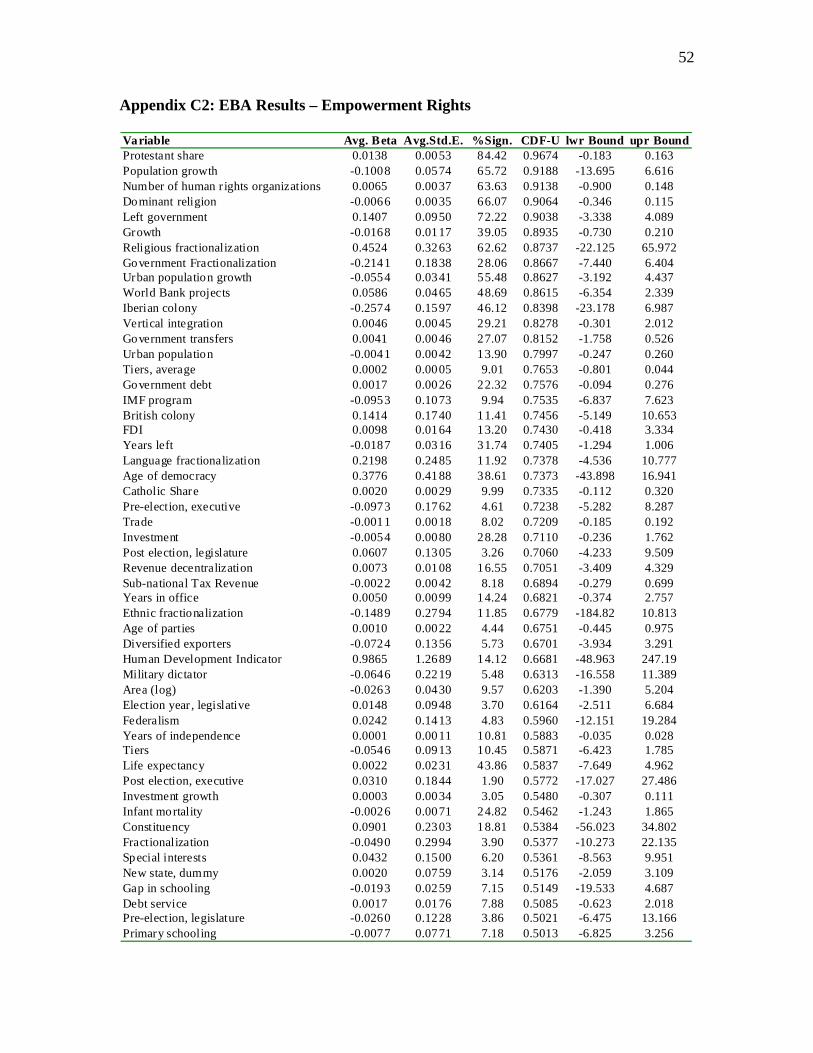
52
Appendix C2: EBA Results – Empowerment Rights
Variable Avg. Beta Avg.Std.E. %Sign. CDF-U lwr Bound upr BoundProtestant share 0.0138 0.0053 84.42 0.9674 -0.183 0.163Population growth -0.1008 0.0574 65.72 0.9188 -13.695 6.616Number of human r ights organizations 0.0065 0.0037 63.63 0.9138 -0.900 0.148Dominant religion -0.0066 0.0035 66.07 0.9064 -0.346 0.115Left government 0.1407 0.0950 72.22 0.9038 -3.338 4.089Growth -0.0168 0.0117 39.05 0.8935 -0.730 0.210Religious fractionalization 0.4524 0.3263 62.62 0.8737 -22.125 65.972Government Fractionalization -0.2141 0.1838 28.06 0.8667 -7.440 6.404Urban population growth -0.0554 0.0341 55.48 0.8627 -3.192 4.437World Bank projects 0.0586 0.0465 48.69 0.8615 -6.354 2.339Iberian colony -0.2574 0.1597 46.12 0.8398 -23.178 6.987Vertical integration 0.0046 0.0045 29.21 0.8278 -0.301 2.012Government transfers 0.0041 0.0046 27.07 0.8152 -1.758 0.526Urban population -0.0041 0.0042 13.90 0.7997 -0.247 0.260Tiers, average 0.0002 0.0005 9.01 0.7653 -0.801 0.044Government debt 0.0017 0.0026 22.32 0.7576 -0.094 0.276IMF program -0.0953 0.1073 9.94 0.7535 -6.837 7.623British colony 0.1414 0.1740 11.41 0.7456 -5.149 10.653FDI 0.0098 0.0164 13.20 0.7430 -0.418 3.334Years left -0.0187 0.0316 31.74 0.7405 -1.294 1.006Language fractionalization 0.2198 0.2485 11.92 0.7378 -4.536 10.777Age of democracy 0.3776 0.4188 38.61 0.7373 -43.898 16.941Catholic Share 0.0020 0.0029 9.99 0.7335 -0.112 0.320Pre-election, executive -0.0973 0.1762 4.61 0.7238 -5.282 8.287Trade -0.0011 0.0018 8.02 0.7209 -0.185 0.192Investment -0.0054 0.0080 28.28 0.7110 -0.236 1.762Post election, legislature 0.0607 0.1305 3.26 0.7060 -4.233 9.509Revenue decentralization 0.0073 0.0108 16.55 0.7051 -3.409 4.329Sub-national Tax Revenue -0.0022 0.0042 8.18 0.6894 -0.279 0.699Years in office 0.0050 0.0099 14.24 0.6821 -0.374 2.757Ethnic fractionalization -0.1489 0.2794 11.85 0.6779 -184.82 10.813Age of parties 0.0010 0.0022 4.44 0.6751 -0.445 0.975Diversified exporters -0.0724 0.1356 5.73 0.6701 -3.934 3.291Human Development Indicator 0.9865 1.2689 14.12 0.6681 -48.963 247.19Military dictator -0.0646 0.2219 5.48 0.6313 -16.558 11.389Area (log) -0.0263 0.0430 9.57 0.6203 -1.390 5.204Election year , legislative 0.0148 0.0948 3.70 0.6164 -2.511 6.684Federalism 0.0242 0.1413 4.83 0.5960 -12.151 19.284Years of independence 0.0001 0.0011 10.81 0.5883 -0.035 0.028Tiers -0.0546 0.0913 10.45 0.5871 -6.423 1.785Life expectancy 0.0022 0.0231 43.86 0.5837 -7.649 4.962Post election, executive 0.0310 0.1844 1.90 0.5772 -17.027 27.486Investment growth 0.0003 0.0034 3.05 0.5480 -0.307 0.111Infant mortality -0.0026 0.0071 24.82 0.5462 -1.243 1.865Constituency 0.0901 0.2303 18.81 0.5384 -56.023 34.802Fractionalization -0.0490 0.2994 3.90 0.5377 -10.273 22.135Special interests 0.0432 0.1500 6.20 0.5361 -8.563 9.951New state, dummy 0.0020 0.0759 3.14 0.5176 -2.059 3.109Gap in schooling -0.0193 0.0259 7.15 0.5149 -19.533 4.687Debt service 0.0017 0.0176 7.88 0.5085 -0.623 2.018Pre-election, legislature -0.0260 0.1228 3.86 0.5021 -6.475 13.166Primary schooling -0.0077 0.0771 7.18 0.5013 -6.825 3.256
Bisher erschienene Diskussionspapiere Nr. 115: Dreher, Axel; Gassebner, Martin; Siemers, Lars-H. R.: Globalization, Economic Freedom
and Human Rights, Oktober 2010 Nr. 114: Dreher, Axel; Mikosch, Heiner; Voigt, Stefan: Membership has its Privileges – The Effect
of Membership in International Organizations on FDI, Oktober 2010 Nr. 113: Fuchs, Andreas; Klann, Nils-Hendrik: Paying a Visit: The Dalai Lama Effect on
International Trade, Oktober 2010 Nr. 112: Freitag, Stephan: Choosing an Anchor Currency for the Pacific, Oktober 2010 Nr. 111: Nunnenkamp, Peter; Öhler, Hannes: Throwing Foreign Aid at HIV/AIDS in Developing
Countries: Missing the Target?, August 2010 Nr. 110: Ohr, Renate; Zeddies, Götz: „Geschäftsmodell Deutschland“ und außenwirtschaftliche
Ungleichgewichte in der EU, Juli 2010 Nr. 109: Nunnenkamp, Peter; Öhler, Hannes: Funding, Competition and the Efficiency of NGOs:
An Empirical Analysis of Non-charitable Expenditure of US NGOs Engaged in Foreign Aid, Juli 2010
Nr. 108: Krenz, Astrid: La Distinction reloaded: Returns to Education, Family Background, Cultural and Social Capital in Germany, Juli 2010
Nr. 107: Krenz, Astrid: Services sectors' agglomeration and its interdependence with industrial agglomeration in the European Union, Juli 2010
Nr. 106: Krenz, Astrid; Rübel, Gerhard: Industrial Localization and Countries' Specialization in the European Union: An Empirical Investigation, Juli 2010
Nr. 105: Schinke, Jan Christian: Follow the Sun! How investments in solar power plants in Sicily can generate high returns of investments and help to prevent global warming, Juni 2010
Nr. 104: Dreher, Axel; Sturm, Jan-Egbert; Vreeland, James Raymon: Does membership on the Security Council influence IMF conditionality?, Juni 2010
Nr. 103: Öhler, Hannes; Nunnenkamp, Peter; Dreher, Axel: Does Conditionality Work? A Test for an Innovative US Aid Scheme, Juni 2010
Nr. 102: Gehringer, Agnieszka: Pecuniary Knowledge Externalities in a New Taxonomy: Knowledge Interactions in a Vertically Integrated System, Juni 2010
Nr. 101: Gehringer, Agnieszka: Pecuniary Knowledge Externalities across European Countries – are there leading Sectors?, Juni 2010
Nr. 100: Gehringer, Agnieszka: Pecuniary Knowledge Externalities and Innovation: Intersectoral Linkages and their Effects beyond Technological Spillovers, Juni 2010
Nr. 99: Dreher, Axel; Nunnenkamp, Peter; Öhler, Hannes: Why it pays for aid recipients to take note of the Millennium Challenge Corporation: Other donors do!, April 2010
Nr. 98: Baumgarten, Daniel; Geishecker, Ingo; Görg, Holger: Offshoring, tasks, and the skill-wage pattern, März 2010
Nr. 97: Dreher, Axel; Klasen, Stephan; Raymond, James; Werker, Eric: The costs of favoritism: Is politically-driven aid less effective?, März 2010
Nr. 96: Dreher, Axel; Nunnenkamp, Peter; Thiele, Rainer: Are ‘New’ Donors Different? Comparing the Allocation of Bilateral Aid between Non-DAC and DAC Donor Countries, März 2010
Nr. 95: Lurweg, Maren; Westermeier, Andreas: Jobs Gained and Lost through Trade – The Case of Germany, März 2010
Nr. 94: Bernauer, Thomas; Kalbhenn, Anna; Koubi, Vally; Ruoff, Gabi: On Commitment Levels and Compliance Mechanisms – Determinants of Participation in Global Environmental Agreements, Januar 2010
Nr. 93: Cho, Seo-Young: International Human Rights Treaty to Change Social Patterns – The Convention on the Elimination of All Forms of Discrimination against Women, Januar 2010
Nr. 92: Dreher, Axel; Nunnenkamp, Peter; Thiel, Susann; Thiele, Rainer: Aid Allocation by German NGOs: Does the Degree of Public Refinancing Matter?, Januar 2010
Nr. 91: Bjørnskov, Christian; Dreher, Axel; Fischer, Justina A. V.; Schnellenbach, Jan: On the relation between income inequality and happiness: Do fairness perceptions matter?, Dezember 2009
Nr. 90: Geishecker, Ingo: Perceived Job Insecurity and Well-Being Revisited: Towards Conceptual Clarity, Dezember 2009
Nr. 89: Kühl, Michael: Excess Comovements between the Euro/US dollar and British pound/US dollar exchange rates, November 2009
Nr. 88: Mourmouras, Alex, Russel, Steven H.: Financial Crises, Capital Liquidation and the Demand for International Reserves, November 2009
Nr. 87: Goerke, Laszlo, Pannenberg, Markus: An Analysis of Dismissal Legislation: Determinants of Severance Pay in West Germany, November 2009
Nr. 86: Marchesi, Silvia, Sabani, Laura, Dreher, Axel: Read my lips: the role of information transmission in multilateral reform design, Juni 2009
Nr. 85: Heinig, Hans Michael: Sind Referenden eine Antwort auf das Demokratiedilemma der EU?, Juni 2009
Nr. 84: El-Shagi, Makram: The Impact of Fixed Exchange Rates on Fiscal Discipline, Juni 2009 Nr. 83: Schneider, Friedrich: Is a Federal European Constitution for an Enlarged European Union
Necessary? Some Preliminary Suggestions using Public Choice Analysis, Mai 2009 Nr. 82: Vaubel, Roland: Nie sollst Du mich befragen? Weshalb Referenden in bestimmten
Politikbereichen – auch in der Europapolitik – möglich sein sollten, Mai 2009 Nr. 81: Williamson, Jeffrey G.: History without Evidence: Latin American Inequality since 1491,
Mai 2009 Nr. 80: Erdogan, Burcu: How does the European Integration affect the European Stock Markets?,
April 2009 Nr. 79: Oelgemöller, Jens; Westermeier, Andreas: RCAs within Western Europe, März 2009 Nr. 78: Blonski, Matthias; Lilienfeld-Toal, Ulf von: Excess Returns and the Distinguished Player
Paradox, Oktober 2008 Nr. 77: Lechner, Susanne; Ohr, Renate: The Right of Withdrawal in the Treaty of Lisbon: A game
theoretic reflection on different decision processes in the EU, Oktober 2008 Nr. 76: Kühl, Michael: Strong comovements of exchange rates: Theoretical and empirical cases
when currencies become the same asset, Juli 2008 Nr. 75: Höhenberger, Nicole; Schmiedeberg, Claudia: Structural Convergence of European
Countries, Juli 2008 Nr. 74: Nowak-Lehmann D., Felicitas; Vollmer, Sebastian; Martinez-Zarzoso, Inmaculada: Does
Comparative Advantage Make Countries Competitive? A Comparison of China and Mexico, Juli 2008
Nr. 73: Fendel, Ralf; Lis, Eliza M.; Rülke, Jan-Christoph: Does the Financial Market Believe in the Phillips Curve? – Evidence from the G7 countries, Mai 2008
Nr. 72: Hafner, Kurt A.: Agglomeration Economies and Clustering – Evidence from German Firms, Mai 2008
Nr. 71: Pegels, Anna: Die Rolle des Humankapitals bei der Technologieübertragung in Entwicklungsländer, April 2008
Nr. 70: Grimm, Michael; Klasen, Stephan: Geography vs. Institutions at the Village Level, Februar 2008
Nr. 69: Van der Berg, Servaas: How effective are poor schools? Poverty and educational outcomes in South Africa, Januar 2008
Nr. 68: Kühl, Michael: Cointegration in the Foreign Exchange Market and Market Efficiency since the Introduction of the Euro: Evidence based on bivariate Cointegration Analyses, Oktober 2007
Nr. 67: Hess, Sebastian; Cramon-Taubadel, Stephan von: Assessing General and Partial Equilibrium Simulations of Doha Round Outcomes using Meta-Analysis, August 2007
Nr. 66: Eckel, Carsten: International Trade and Retailing: Diversity versus Accessibility and the Creation of “Retail Deserts”, August 2007
Nr. 65: Stoschek, Barbara: The Political Economy of Enviromental Regulations and Industry Compensation, Juni 2007
Nr. 64: Martinez-Zarzoso, Inmaculada; Nowak-Lehmann D., Felicitas; Vollmer, Sebastian: The Log of Gravity Revisited, Juni 2007
Nr. 63: Gundel, Sebastian: Declining Export Prices due to Increased Competition from NIC – Evidence from Germany and the CEEC, April 2007
Nr. 62: Wilckens, Sebastian: Should WTO Dispute Settlement Be Subsidized?, April 2007 Nr. 61: Schöller, Deborah: Service Offshoring: A Challenge for Employment? Evidence from
Germany, April 2007 Nr. 60: Janeba, Eckhard: Exports, Unemployment and the Welfare State, März 2007 Nr. 59: Lambsdoff, Johann Graf; Nell, Mathias: Fighting Corruption with Asymmetric Penalties and
Leniency, Februar 2007 Nr. 58: Köller, Mareike: Unterschiedliche Direktinvestitionen in Irland – Eine theoriegestützte
Analyse, August 2006 Nr. 57: Entorf, Horst; Lauk, Martina: Peer Effects, Social Multipliers and Migrants at School: An
International Comparison, März 2007 (revidierte Fassung von Juli 2006) Nr. 56: Görlich, Dennis; Trebesch, Christoph: Mass Migration and Seasonality Evidence on
Moldova’s Labour Exodus, Mai 2006 Nr. 55: Brandmeier, Michael: Reasons for Real Appreciation in Central Europe, Mai 2006 Nr. 54: Martínez-Zarzoso, Inmaculada; Nowak-Lehmann D., Felicitas: Is Distance a Good Proxy
for Transport Costs? The Case of Competing Transport Modes, Mai 2006 Nr. 53: Ahrens, Joachim; Ohr, Renate; Zeddies, Götz: Enhanced Cooperation in an Enlarged EU,
April 2006 Nr. 52: Stöwhase, Sven: Discrete Investment and Tax Competition when Firms shift Profits, April
2006 Nr. 51: Pelzer, Gesa: Darstellung der Beschäftigungseffekte von Exporten anhand einer Input-
Output-Analyse, April 2006 Nr. 50: Elschner, Christina; Schwager, Robert: A Simulation Method to Measure the Tax Burden on
Highly Skilled Manpower, März 2006 Nr. 49: Gaertner, Wulf; Xu, Yongsheng: A New Measure of the Standard of Living Based on
Functionings, Oktober 2005 Nr. 48: Rincke, Johannes; Schwager, Robert: Skills, Social Mobility, and the Support for the
Welfare State, September 2005 Nr. 47: Bose, Niloy; Neumann, Rebecca: Explaining the Trend and the Diversity in the Evolution of
the Stock Market, Juli 2005
Nr. 46: Kleinert, Jörn; Toubal, Farid: Gravity for FDI, Juni 2005 Nr. 45: Eckel, Carsten: International Trade, Flexible Manufacturing and Outsourcing, Mai 2005 Nr. 44: Hafner, Kurt A.: International Patent Pattern and Technology Diffusion, Mai 2005 Nr. 43: Nowak-Lehmann D., Felicitas; Herzer, Dierk; Martínez-Zarzoso, Inmaculada; Vollmer,
Sebastian: Turkey and the Ankara Treaty of 1963: What can Trade Integration Do for Turkish Exports, Mai 2005
Nr. 42: Südekum, Jens: Does the Home Market Effect Arise in a Three-Country Model?, April 2005 Nr. 41: Carlberg, Michael: International Monetary Policy Coordination, April 2005 Nr. 40: Herzog, Bodo: Why do bigger countries have more problems with the Stability and Growth
Pact?, April 2005 Nr. 39: Marouani, Mohamed A.: The Impact of the Mulitfiber Agreement Phaseout on
Unemployment in Tunisia: a Prospective Dynamic Analysis, Januar 2005 Nr. 38: Bauer, Philipp; Riphahn, Regina T.: Heterogeneity in the Intergenerational Transmission of
Educational Attainment: Evidence from Switzerland on Natives and Second Generation Immigrants, Januar 2005
Nr. 37: Büttner, Thiess: The Incentive Effect of Fiscal Equalization Transfers on Tax Policy, Januar 2005
Nr. 36: Feuerstein, Switgard; Grimm, Oliver: On the Credibility of Currency Boards, Oktober 2004 Nr. 35: Michaelis, Jochen; Minich, Heike: Inflationsdifferenzen im Euroraum – eine
Bestandsaufnahme, Oktober 2004 Nr. 34: Neary, J. Peter: Cross-Border Mergers as Instruments of Comparative Advantage, Juli 2004 Nr. 33: Bjorvatn, Kjetil; Cappelen, Alexander W.: Globalisation, inequality and redistribution, Juli
2004 Nr. 32: Stremmel, Dennis: Geistige Eigentumsrechte im Welthandel: Stellt das TRIPs-Abkommen
ein Protektionsinstrument der Industrieländer dar?, Juli 2004 Nr. 31: Hafner, Kurt: Industrial Agglomeration and Economic Development, Juni 2004 Nr. 30: Martinez-Zarzoso, Inmaculada; Nowak-Lehmann D., Felicitas: MERCOSUR-European
Union Trade: How Important is EU Trade Liberalisation for MERCOSUR’s Exports?, Juni 2004
Nr. 29: Birk, Angela; Michaelis, Jochen: Employment- and Growth Effects of Tax Reforms, Juni 2004
Nr. 28: Broll, Udo; Hansen, Sabine: Labour Demand and Exchange Rate Volatility, Juni 2004 Nr. 27: Bofinger, Peter; Mayer, Eric: Monetary and Fiscal Policy Interaction in the Euro Area with
different assumptions on the Phillips curve, Juni 2004 Nr. 26: Torlak, Elvisa: Foreign Direct Investment, Technology Transfer and Productivity Growth in
Transition Countries, Juni 2004 Nr. 25: Lorz, Oliver; Willmann, Gerald: On the Endogenous Allocation of Decision Powers in
Federal Structures, Juni 2004 Nr. 24: Felbermayr, Gabriel J.: Specialization on a Technologically Stagnant Sector Need Not Be
Bad for Growth, Juni 2004 Nr. 23: Carlberg, Michael: Monetary and Fiscal Policy Interactions in the Euro Area, Juni 2004 Nr. 22: Stähler, Frank: Market Entry and Foreign Direct Investment, Januar 2004 Nr. 21: Bester, Helmut; Konrad, Kai A.: Easy Targets and the Timing of Conflict, Dezember 2003 Nr. 20: Eckel, Carsten: Does globalization lead to specialization, November 2003
Nr. 19: Ohr, Renate; Schmidt, André: Der Stabilitäts- und Wachstumspakt im Zielkonflikt zwischen fiskalischer Flexibilität und Glaubwürdigkeit: Ein Reform-ansatz unter Berücksichtigung konstitutionen- und institutionenökonomischer Aspekte, August 2003
Nr. 18: Ruehmann, Peter: Der deutsche Arbeitsmarkt: Fehlentwicklungen, Ursachen und Reformansätze, August 2003
Nr. 17: Suedekum, Jens: Subsidizing Education in the Economic Periphery: Another Pitfall of Regional Policies?, Januar 2003
Nr. 16: Graf Lambsdorff, Johann; Schinke, Michael: Non-Benevolent Central Banks, Dezember 2002
Nr. 15: Ziltener, Patrick: Wirtschaftliche Effekte des EU-Binnenmarktprogramms, November 2002 Nr. 14: Haufler, Andreas; Wooton, Ian: Regional Tax Coordination and Foreign Direct Investment,
November 2001 Nr. 13: Schmidt, André: Non-Competition Factors in the European Competition Policy: The
Necessity of Institutional Reforms, August 2001 Nr. 12: Lewis, Mervyn K.: Risk Management in Public Private Partnerships, Juni 2001 Nr. 11: Haaland, Jan I.; Wooton, Ian: Multinational Firms: Easy Come, Easy Go?, Mai 2001 Nr. 10: Wilkens, Ingrid: Flexibilisierung der Arbeit in den Niederlanden: Die Entwicklung
atypischer Beschäftigung unter Berücksichtigung der Frauenerwerbstätigkeit, Januar 2001 Nr. 9: Graf Lambsdorff, Johann: How Corruption in Government Affects Public Welfare – A
Review of Theories, Januar 2001 Nr. 8: Angermüller, Niels-Olaf: Währungskrisenmodelle aus neuerer Sicht, Oktober 2000 Nr. 7: Nowak-Lehmann, Felicitas: Was there Endogenous Growth in Chile (1960-1998)? A Test of
the AK model, Oktober 2000 Nr. 6: Lunn, John; Steen, Todd P.: The Heterogeneity of Self-Employment: The Example of Asians
in the United States, Juli 2000 Nr. 5: Güßefeldt, Jörg; Streit, Clemens: Disparitäten regionalwirtschaftlicher Entwicklung in der
EU, Mai 2000 Nr. 4: Haufler, Andreas: Corporate Taxation, Profit Shifting, and the Efficiency of Public Input
Provision, 1999 Nr. 3: Rühmann, Peter: European Monetary Union and National Labour Markets,
September 1999 Nr. 2: Jarchow, Hans-Joachim: Eine offene Volkswirtschaft unter Berücksichtigung des
Aktienmarktes, 1999 Nr. 1: Padoa-Schioppa, Tommaso: Reflections on the Globalization and the Europeanization of the
Economy, Juni 1999 Alle bisher erschienenen Diskussionspapiere zum Download finden Sie im Internet unter: http://www.uni-goettingen.de/de/60920.html.


![Globalization Globalization - The External Pressures.[2001.ISBN0471499382]](https://img.pdfslide.net/doc/110x75/54e9c2e54a795910478b4905/globalization-globalization-the-external-pressures2001isbn0471499382.jpg)
