Embed Size (px)
Citation preview

Do Greater School Autonomy and Accountability Make a Difference?
Evidence from the Random Assignment of Students into Private and Public
High Schools in Seoul
Youjin Hahn, Liang Choon Wang, and Hee-Seung Yang
October 2013
Abstract
We show that private high school students outperform public high school
students in Seoul, South Korea, where secondary school students are
randomly assigned into schools within school districts. Both private and
public schools in Seoul must admit students randomly assigned to them,
charge the same fees, and use the same curricula under the so-called
‘equalization policy’, but private schools enjoy greater autonomy in hiring
and other staffing decisions and their principals and teachers face stronger
incentives to deliver good students’ performance. Our findings suggest that
providing schools greater autonomy in their personnel and resource
allocation decisions while keeping school principals accountable can be
effective in improving students’ outcomes.
Keywords: Private schools; Charter schools; Public schools; Academic
performance; Randomization; Korea.
JEL codes: J210, I220
Affiliation: Department of Economics, Monash University. Contact: [email protected],
[email protected], and [email protected].
For helpful comments, we are grateful to Tiffany Chou, Hisam Kim, and seminar and conference participants at
Monash University, University of Melbourne, the Econometrics Society Australasian Meeting 2012, the Labour
Econometrics Workshop 2012, Monash-Warwick Workshop, University of Adelaide, and the Asian Meeting of
the Econometric Society 2013. JoonHo Yeo and Lucy EunJu Kim provided excellent research assistance. We
are also grateful to Seoul Metropolitan Office of Education and Yeo Bok Yun for facilitating us in conducting
the principal survey. This project would not have been possible without the financial support from the
Department of Economics at Monash University and data provided by the Korea Institute for Curriculum and
Evaluation (KICE), Korea Education and Research Information Service (KERIS), and the Ministry of Education,
Science and Technology of the Republic of Korea.

1
I. Introduction
A large body of literature in economics, education, and sociology has shown that students
attending private schools outperform students attending traditional public schools in a wide
range of outcomes. Since a common feature of private schools is their autonomy from school
district offices, these findings strengthen initiatives to improve outcomes of public schools
students through the establishment of charter public schools in the United States, free schools
in the United Kingdom, independent public schools in Australia, and community-managed
schools in many developing countries. However, it is often unclear whether private and
independent public schools causally improve student outcomes and even if they do, which
characteristics drive such improvements.
Studies attempting to identify the effects of private or charter schooling and to
disentangle the various causal mechanisms face two major challenges. First, it is difficult to
identify the causal effects of independent public or private schooling on students’ outcomes
on the basis of most observational data available because unobserved selection bias is
pervasive and challenging to address (Altonji et al. 2005a). Although recent experimental
evidence based on the random assignment of private school vouchers or oversubscribed
charter school slots to low-income applicants shows significant positive effects of these
schools on student outcomes, it is still difficult to learn precisely which aspects of these
schools explain the differences in outcomes.1 When these studies compare the outcomes
between the randomly selected receivers (treatment group) and non-receivers (control group)
of private school vouchers or charter school slots, the estimated effects of private or charter
schooling capture the overall differences in peer quality and other dimensions of school and
teacher quality between the highly sought-after schools and the default traditional public
schools. In some cases, the newly-introduced randomization programs would also put
competitive pressures on existing public schools in which the control groups enroll, and
hence would change the outcome trajectories of the control groups and bias the estimates. As
1 For examples of experimental evidence, see Peterson et al. (2003), Angrist et al. (2002), Angrist et al. (2006)
and Hoxby and Murarka (2009). Earlier observational studies, such as Coleman et al. (1982), Alexander and
Pallas (1985), and Coleman and Hoffer (1987) found that private schooling in the U.S. is more effective in
raising student achievement (test score) than public schooling, even after controlling for the factors that jointly
influence private school choice and achievement. More recent observational studies by Figlio and Stone (1999),
Vandenberghe and Robin (2004), Altonji et al. (2005a, 2005b), however, show mixed results regarding the
effect of private schooling on achievement. On the other hand, observational studies focusing on the effects of
private or Catholic schooling on high school completion and college attendance, such as Evans and Schwab
(1995), Neal (1997), Altonji et al. (2005a), Le and Miller (2003), and Vella (1999) consistently show positive
effects of private schooling.
2
applicants may differ from the general student population, it is also unclear whether the
effects will be similar if these programs are scaled up.
The objectives of this study are two folds. First, using a unique randomized natural
experiment in Seoul, South Korea (hereafter Korea), we show that private high schools are
more effective than public high schools in generating positive educational outcomes. Since
the 1970s and until recently, the Korean government had implemented the so-called
‘equalization policy’ in several major metropolitan areas, where students were randomly
assigned to different high schools within school districts of their residence. The random
assignment in Seoul indicates that, although motivated parents may choose to live in a
neighborhood with high-quality schools, they do not have controls over which schools—
private, public, single-sex or coeducational schools—their children attend within the school
district. This randomization process allows us to identify the causal effects of attending
private high schools by removing unobserved selection bias that may be present otherwise.
We use administrative school-level and individual-level data to examine the effects of private
schooling on the likelihood of dropping out, the likelihood of college attendance, test scores,
and violent behavior. These outcomes are not only important predictors of individual
earnings and productivity, but also measures of school quality to which parents and policy
makers pay attention.2
Second, we examine the mechanisms through which private schooling may benefit
students. As in many other countries, private schools in Seoul are privately owned and have
significant autonomy from the local school district. However, Korean private schools are
subject to many of the same government regulations as public schools, such as adopting a
similar curriculum, tuition, and base salaries for teachers. As the randomization process
removes differences in entering students’ quality across schools, as well as the incentives for
schools to compete for students and funding, private and public schools in Seoul are similar
in many dimensions. This feature of the Korean school system provides a useful setting to
help pinpoint whether decentralizing decision making from school district offices and
providing greater discretion to individual schools – a key component shared across the
charter public, independent, and community managed school movements in many countries –
lead to better outcomes.
2 For example, as a part of the annual evaluation of schools, New York City school surveys ask parents about
their perception and satisfaction on how the schools handle disciplinary problems and absenteeism of their
children.
3
We find that private school students are no more likely than public school students to
drop out of and graduate from high school, but they are more likely to attend colleges and
less likely to be involved in violent incidents. In particular, the increase in college attendance
rates is primarily driven by the increase in four-year college attendance rates, rather than two-
year junior college attendance rates. The test score distribution of the College Scholastic
Aptitude Test (CSAT), a standardized test for most college admissions in South Korea,
indicates that private schools are more effective in improving test scores of students in the
lower end of the distribution and hence placing a greater proportion of high school seniors
into colleges. We also find that private school students perform better in the National
Assessment of Educational Achievement (NAEA) test, a national standardized examination
administered to students in their second year of high school (i.e., equivalent to the eleventh
graders in other countries). Private school students are more likely to be present on the day of
the NAEA test, suggesting lower student absenteeism in private schools. Because of the
potential non-random selection into test taking, we use Lee’s (2009) sharp-bound estimators
to estimate the causal effects of private schooling on test scores. Findings indicate that private
school students outperform public school students in all NAEA subjects, namely Korean,
Mathematics, and English by at least 0.06 to 0.08 standard deviations.
The equalization policy removes channels that are commonly associated with the
relatively superior performance of private schools in other countries, such as the differences
in resources, curricula, peer quality, and incentives to compete for students. We further rule
out single-sex schooling, religious affiliation of private schools, ability-tracking, private
tutoring, and school infrastructures as explanations for the private school effects.
We argue that the relative effectiveness of private schooling is mainly driven by (1)
the autonomy that private school principals have over their personnel and resource allocation
decisions, and (2) the more stringent accountability measures and incentives that private
school principals face. In particular, the board of directors of a private school hires the school
principal, and the principal in turn decides school policies, makes other personnel decisions,
and allocates the budget. In contrast, public school principals and teachers in Seoul rotate
from school to school every several years and the Seoul Metropolitan Office of Education has
the ultimate control over personnel decisions of all public schools, like the school districts
and ministries of education in many other countries (Kim et al. 2007). Survey data that we
independently collected indicate that private school principals face less job security and place
a higher emphasis on students’ academic performance than public school principals. The
greater autonomy in hiring teachers and setting school policies means that private school
4
principals can better select teachers and design the school environment to deliver their
desired outcomes. Despite having similar level of resources per student, the data show that
private school principals tend to encourage innovative teaching and allocate their limited
resources differently from public schools, especially in personnel decisions. Our results
suggest that giving schools greater autonomy while keeping principals accountable for their
performance can lead to better student outcomes, even when there are no differences in
student quality, additional resources, or curricula and in the absence of competition between
schools.
II. Background: Secondary Schools in Korea
Concerned about the adverse effects of competitive high school entrance exams, private
tutoring, corruption, and large differences in peer quality across schools, the Korean
government first implemented the ‘equalization policy’ among high schools in Seoul and
Pusan in 1974. The equalization policy removed the competitive high school entrance
examination and introduced random assignment of students across schools within school
districts.
With the introduction of the equalization policy in 1970s, all private schools were
added into the existing system of centralized public school finance in Korea. Uniform and
centralized policies over fees and tuition, curriculum, and teachers’ qualification were
introduced.3 As private schools are not allowed to charge higher tuition, they are heavily
subsidized by the government. Teachers must instruct students in accordance with the unified
national curriculum, based on designated or certified textbooks (Kim et al. 2007). Both
private and public school teachers are guaranteed with equivalent salary schedules based on
their experiences and qualifications. High school teachers must be graduates from teacher’s
college or fulfil specific course requirements for teachers, but public teachers must also pass
the national teachers’ employment examination as they are considered as government
employees.
Although both public and private high schools are heavily regulated, some differences
exist between the two. All school principals in Seoul are selected among those with a
certificate for principal eligibility. Principals of public schools in Seoul are appointed by
Seoul Metropolitan Office of Education while those of private schools are appointed by the
3According to the legislation on school tuition fee and admission fee, the annual tuition in 2009 for both public
and private high schools was set at about 1300 USD (1.45 million KRW). Admission fee was 14,100 KRW,
which is less than 15 USD (Source: http://www.law.go.kr).
5
individual school’s board of directors. The board of directors determines the appointment and
promotion of principals.4 Private school principals decide whom they hire as teachers and the
length of the teachers’ contracts (i.e. short-term teachers or regular teachers). Public school
principals and teachers are government employees and they must rotate to different schools
every four years. Also, public school principals can work as regular teachers after their term
as a principal ends (i.e., guaranteed employment although at a lower level), but private school
principals are not guaranteed a position after their term ends. Thus, private school principals
and teachers generally face less job security comparing to public school principals and
teachers.
Principals at both public and private schools have control over their daily operations
and how they allocate their overall budget and resources, though public school principals
have little control over how they spend on personnel and staffing. For example, principals can
decide how they provide financial assistance to students and how they organize their
classrooms and teachers. The difference in outcomes between public and private may appear
along these dimensions especially if private schools make a more efficient use of educational
inputs.
III. Data
A. Description
The data used in this paper are drawn from several sources. First, we use publicly disclosed
school-level information pertaining to enrollment, dropouts, transfers, graduates’ destinations,
number of teachers, number of classrooms, incidents of violence, and student achievements.5
Second, we obtain data on individual eleventh graders’ performance in the National
Assessment of Educational Achievement (NAEA), surveys of principals and test takers
participating in NAEA, as well as individual twelfth graders’ test scores in the College
Scholastic Aptitude Test (CSAT) from the Korea Institute for Curriculum and Evaluation
(KICE). In 2010, Korean eleventh graders were given the NAEA test. Unlike the CSAT,
which is a national standardized test used for college admission, the NAEA is a relatively
low-stakes test designed by the KICE to identify factors affecting student achievements.6 The
NAEA data also provide some student and school information which is useful for our
4 Private School Law, Korea Ministry of Government Legislation (Source: http://www.law.go.kr).
5 The data are available at www.schoolinfo.go.kr, the Ministry of Education, Technology and Science’s website.
We also verify the data with those collected by the Korea Education and Research Information Service
(http://edudata.keris.or.kr). 6 Source: http://www.kice.re.kr.
6
analysis. Third, we surveyed 173 high school principals in Seoul in 2013 to obtain
information about differences in the management and governance styles, as well as the
perceptions regarding differences between public and private schools.7 Except for our own
survey data, all data used in this paper are administrative data, so we have information for the
universe of schools (school-level data) and test-takers (student-level data) in Seoul.
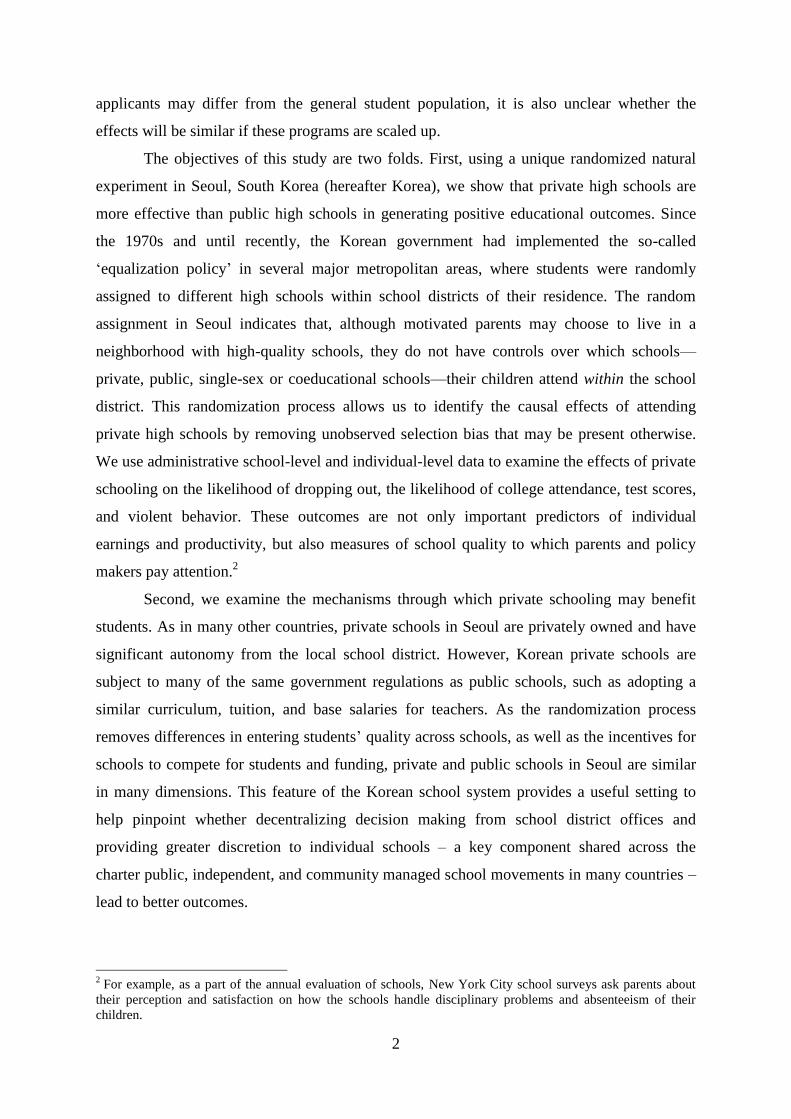
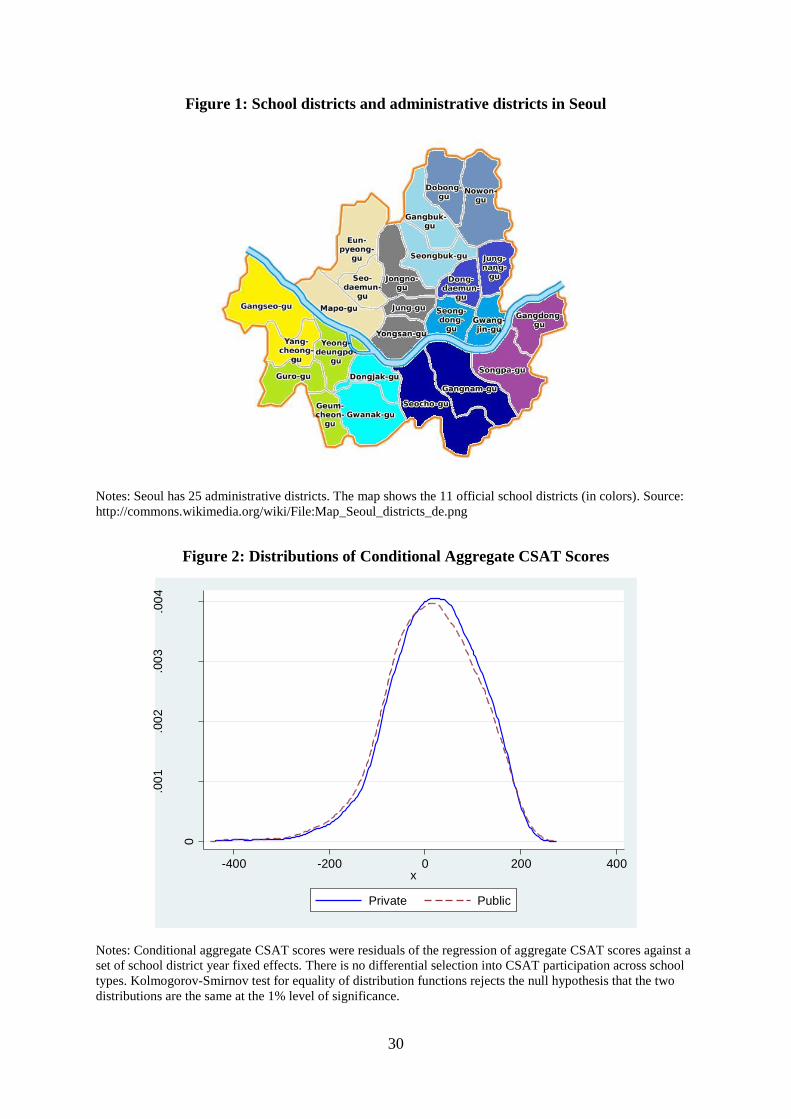
In 2008, middle school graduates (aged 16) in Seoul were randomly assigned into
roughly 200 high schools within its 11 school districts illustrated in Figure 1.8 These high
schools can be public or private, as well as single-sex or coeducational. The private schools
are either religiously affiliated or secular. Religiously affiliated private schools are
predominantly Christian. Students who entered high schools in Seoul prior to 2010 were
randomly assigned into schools unconditional on any potential school preferences they have
within school districts. We focus on outcomes of students entering into high schools in
20Among the universe of high schools in Seoul, we focus on 195 schools which have data
available for all of the key outcome variables between 2008 and 2010. 9
Table 1 provides
summary statistics of the variables used. The first four binary variables concern school types.
Nearly two-thirds of the high schools are privately owned and about 30 percent of the private
schools are religiously affiliated. Coeducational, all-boys, and all-girls schools are roughly
one-third each.
The second set of variables in Table 1 includes predetermined school-level
information. We briefly summarize some of the key variables of interest here. Transferring
and dropping out are fairly uncommon in Seoul; less than two percent on average. Violent
incidents are rare; one incident per 1000 students annually. The schools on average have
approximately two-thirds of all seniors entering into colleges. Among those attending
colleges, about two-thirds are in four-year colleges. The average class size in Seoul is about
39 students and the average student-teacher ratio is 18. Approximately 40 percent of teachers
have a masters’ degree. On average, four percent of high school students came from families
7 Out of the 194 high schools sampled in this paper, we excluded schools which changed their school type from
general academic to autonomous school between 2010 and 2013. 8 In Korea, primary schooling spans six grade levels, and secondary schooling composes of three years of
middle schools and three years of high schools. Most students start their primary schooling at age 6. 9 There are roughly 20 highly selective high schools in Seoul, often specialized in arts, science and foreign
languages, exempted from the randomization process and have priority over all other schools in their student
selection process. These students and schools are not part of our sample. We also exclude the schools that
changed their gender or academic types between 2008 and 2010. In addition, one school district made up by
Jongno-gu, Jung-gu, and Yongsan-gu administrative districts practices conditional randomization as they are
located in the central area of Seoul and there are few residents within the district. The results reported in this
paper are not sensitive to dropping this school district and the results are available upon request.
7
on governmental welfare support. 12 percent of students receive free lunch support from the
government. Ethnic minority students are rare; 0.1 percent of the student population.
Finally, Table 1 summarizes student-level data of the NAEA test takers in 2010. Out
of the 88,406 students expected to take the NAEA tests in 2010, about three percent missed
some of the tests. We normalize the NAEA test scores, which range between 100 and 300, to
have mean zero and standard deviation 1.
B. Verification of Random Assignment
If randomization is strictly enforced in the high schools in Seoul, then the final school
assignments should not be correlated with any predetermined characteristics of students and
parents. We verify random assignment by examining whether private and public schools have
similar student characteristics within school districts in the following regression equation:
, (1)
where represents the average characteristics of students in school j of school district k in
year t. Privatejk is an indicator for whether a school is privately owned or not. The term
represents 11 school district fixed effects or 33 school-district-year fixed effects depending
on whether one year or three years of data are used. School district fixed effects are included
because randomization is implemented within districts. There are only a small set of
predetermined student characteristics available. These variables include the percentage of
students living in families participating in public welfare program, the percentage of students
from ethnic minority groups, and the percentage of students on lunch support (a proxy for
poverty). Although transferring is uncommon (less than two percent) and the students who
transfer to another school district are subject to random assignment again, we also examine
whether the percentage of students transferring to another school is different between private
and public schools.10
If randomization is strictly enforced, the coefficient should not be
statistically different from zero, indicating that private and public schools tend to have similar
student characteristics and transfer rate.
10
The information of student transfers and percent of students on lunch support came from the school-level data
for 2008-2010 available at www.schoolinfo.go.kr, while other information of the average student characteristics
of each school is sourced from the principal survey accompanying the 2010 National Assessment of Educational
Achievement.
8
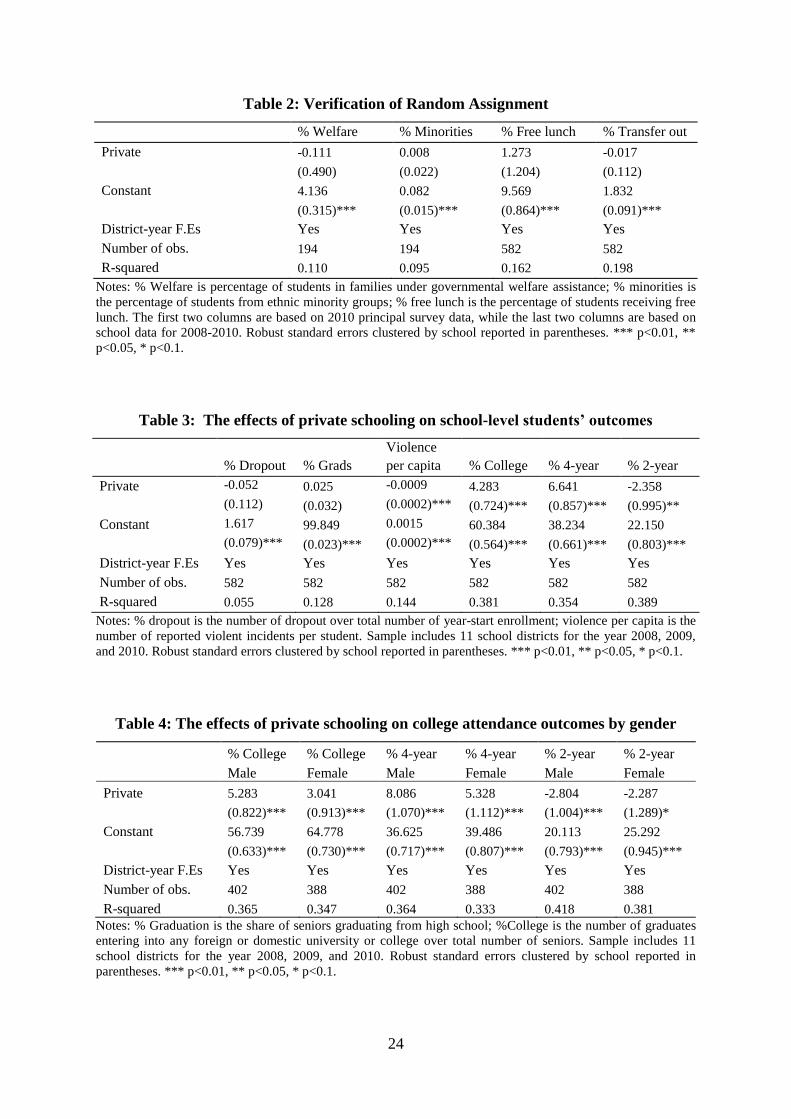
Columns 1 to 3 in Table 2 show that there are no statistically significant differences
between the average characteristics of students that private and public schools admitted.
Column 4 also indicates that students do not selectively transfer out to other schools. The
coefficient estimates of Private in all cases are close to zero, consistent with what the
randomized allocations would imply.
[Insert Table 2]
IV. Impacts of Private Schooling on Student Outcomes
A. Drop Out, Graduation, Violence, and College Attendance
We exploit the random assignment of students into schools within school districts to identify
the causal effects of private schooling on student outcomes using the following regression
specification:
, (2)
where denotes an outcome of students in school j of school district k in year t. The
school-level outcome variables include (1) the percentage of students dropping out of high
school, (2) the percentage of high school seniors graduating, (3) the number of violent
incidents reported per student, (4) the percentage of high school seniors attending any college,
(5) the percentage of high school seniors attending two-year colleges, and (6) the percentage
of high school seniors attending four-year colleges. is an indicator for whether
school j is privately owned or not. represents a set of school district-year fixed effects.
When we have only one year of data, includes 11 school district fixed effects; when we
have three years of data, includes 33 school district-year fixed effects. As students are
randomly assigned into schools within a district, the inclusion of ensures that the
selection into school districts is controlled for and that the coefficient of interest captures
the causal effect of attending a private school on student outcomes. The term denotes all
other unobserved influences of the outcomes.
We report the estimated effects of private schooling on school-level student outcomes
in Table 3. The first two columns in Table 3 indicate that private school students and public
school students are equally likely to drop out of and graduate from high school. As high

9
school dropout rate is very low at 1.6 percent and graduation rate is close to 100 percent in
Seoul,11
there is not much room for improvement in these outcomes.
Column 3 in Table 3 shows that private school students are less likely to be involved
in violent incidents. In particular, private schooling reduces average violent incidents per
student by approximately one per 1000 students.12
Comparing to the average violent incidents
per student in public schools, which is 1.5 incidents per 1000 students, private schooling
reduces violent incidents per student by almost 60 percent. This estimate is comparable to the
finding by Cullen et al. (2006), which shows that self-reported arrest rates are reduced by
nearly 60 percent among the students who win lotteries to attend high-achieving schools
compared to those who do not. Violence is an extreme form of behavioral problems and is
fairly rare in Korean high schools. Having more violent incidents will likely mean that other
forms of behavioral problems are also pervasive. The fact that private schools have fewer
violent incidents per student than public schools suggests that students in private schools tend
to have lower level of other behavioral issues and enjoy safer school environment.
Column 4 reports that private schooling significantly increases high school seniors’
college attendance rates. The effect is estimated to be 4.3 percentage points or 7 percent
higher than public schools, where roughly 60 percent of public high school seniors enter
colleges. Columns 5 and 6 indicate that private schooling significantly raises the likelihood of
four-year college attendance and reduces the likelihood of two-year college attendance. In
sum, our findings show that private high school students are less likely to be involved in
violent incidents, and more likely to pursue higher education. In particular, private schooling
increases college attendance rates of high school seniors by moving them into four-year
universities and away from two-year junior colleges and other options.
[Insert Table 3]
Since the school-level data of four-year and two-year college attendance of high
school seniors are also available by gender, we report the estimated effects on college
attendance rates by gender in Table 4. Overall, the evidence suggests that private schooling
significantly increases the probability to attend any college considerably more for boys than
for girls (columns 1 and 2). Interestingly, the constants are higher for female students than
11
In 2010, the dropout rate of high school students in the United States is 7.4 percent (Source:
http://nces.ed.gov/fastfacts/display.asp?id=16, accessed August 2013). 12
Schools may underreport the number of violent incidents, but the measurement errors are likely orthogonal to
the school ownership type.
10
male students, meaning that girls in public school tend to do better than boys. Also, the size
of the coefficients means that private schools help boys close the gap somewhat, but not
enough to catch the educational performance of girls. Columns 3 and 4 show that private
schooling increases the likelihood of high school seniors to attend four-year colleges by 8.1
percentage points for males and by 5.3 percentage points for females, respectively. Columns
5 and 6 show that private schooling reduces the likelihood of high school seniors to attend
two-year colleges by 2.8 percentage points for males and by 2.3 percentage points for females,
respectively. Thus, higher overall college attendance rate among boys in private schools are
mostly driven by increased likelihood of attending 4-year colleges.
[Insert Table 4]
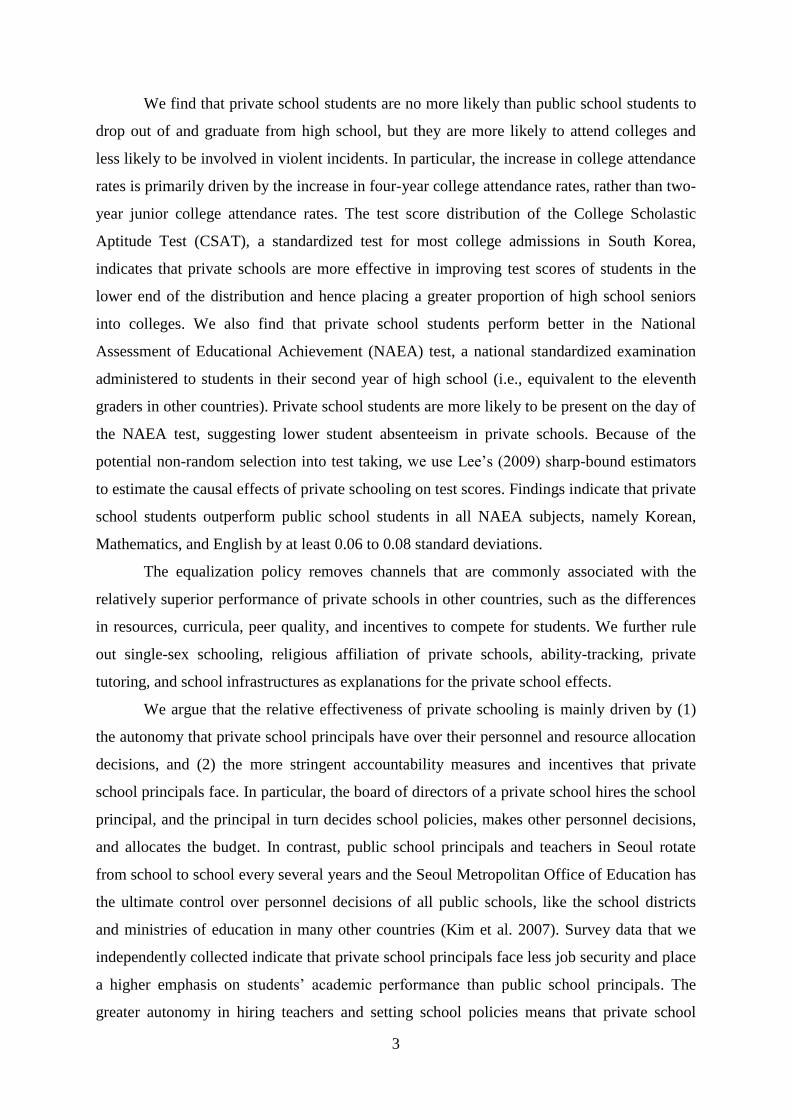
Because a student’s performance in the College Scholastic Aptitude Test (CSAT)
predominantly determines whether the admission requirements of a desired college and major
are met, differences in the distributions of CSAT scores (conditional on school district fixed
effects) across school types should correspond to the differences in college attendance rates
and four-year college attendance rates across school types.13
Figure 2 shows that private
schooling shifts the entire CSAT score distribution to the right with the exception of high-
achieving students and reduces the share of students falling in the bottom tail of the test score
distribution.
[Insert Figure 2]
B. Impacts on Test Taking and Test Scores
We use individual eleventh graders’ test scores in the National Assessment of Educational
Achievement (NAEA) to assess the effects of private schooling on high school students’
achievement. Because the NAEA is relatively low-stakes and students cannot strategically
select subjects the way they would do for the CSAT, the NAEA test scores can more
appropriately reveal whether private schooling improves students’ learning. We estimate the
effects of private schooling on individual students’ test scores using the following regression
equation:
13
Students must take 7 subjects in CSAT. Korean and English tests are the same for all students, but other tests
depend on students’ track and their choice of mathematics and electives.
11
, (3)
where measures the test score of student i in the subject of Korean, mathematics, or
English in 2010. As before, the coefficient of interest is β and δk represents a set of school
district fixed effects. Before estimating the effects of private schooling on test scores, we also
check whether private school students and public school students are equally likely to take
each test to ensure that the estimates do not suffer from any selection bias. For example, if
private schools are more effective in making academically-inclined students take the test,
then the estimated effects of private schooling on test score will be biased upward.
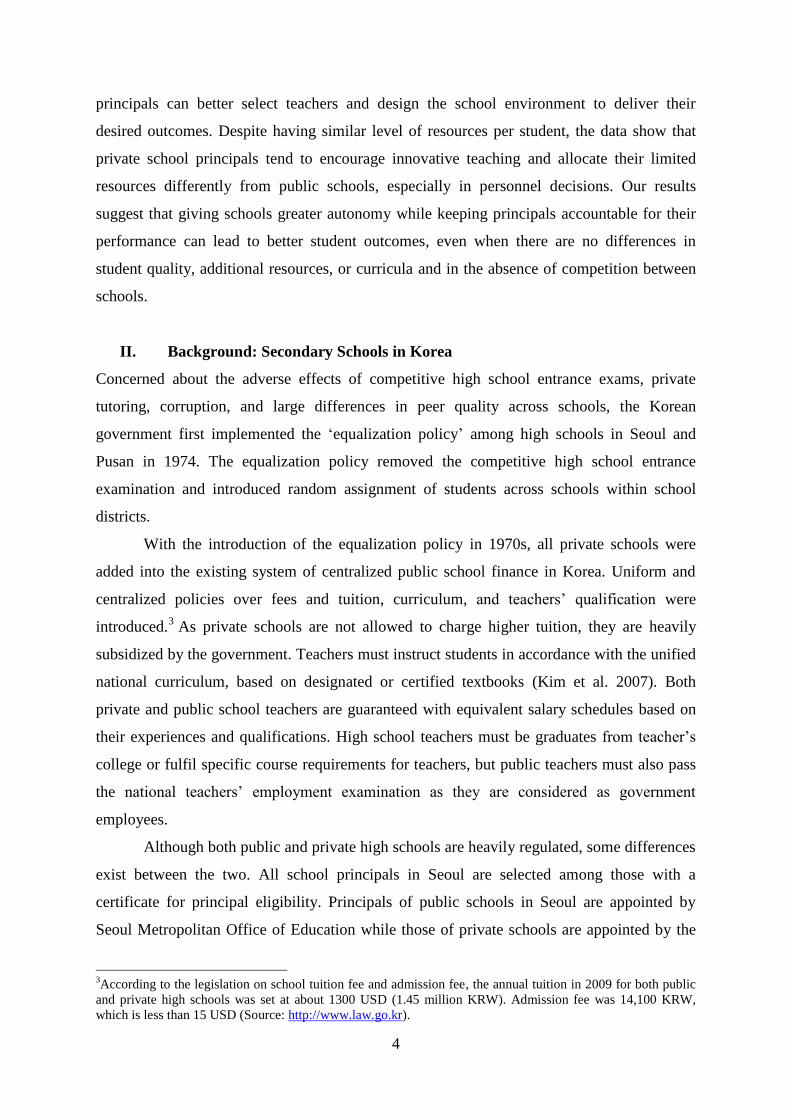
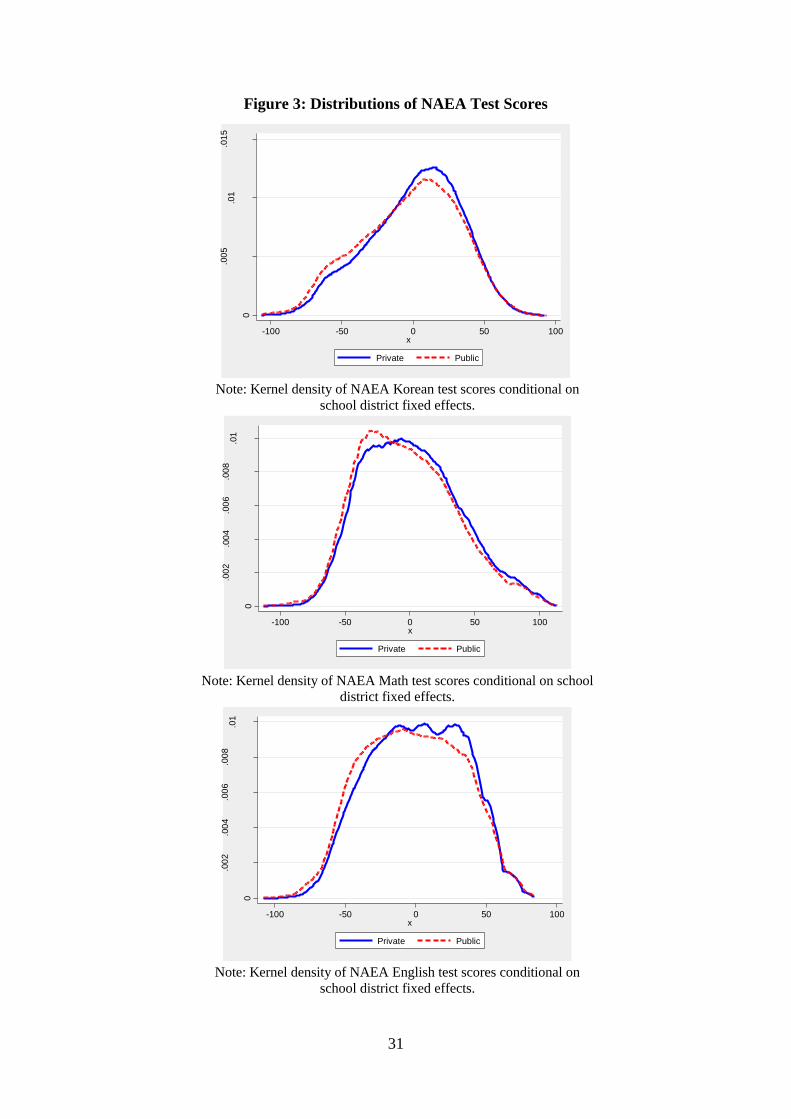
The test score distribution for each test by type of school (conditional on school
district fixed effects) is shown in Figure 3. The top panel shows the test score distributions
for Korean; the middle panel shows the test score distributions for math; and the bottom
panel shows the test score distributions for English. Figure 3 illustrates that the distributions
of private school students’ test scores are to the right of the distributions of public school
students’ test scores. More importantly, the figure shows that private schooling not only
increases the mean test scores, but also reduces the fraction of students falling into the bottom
tails of the distributions.
[Insert Figure 3]
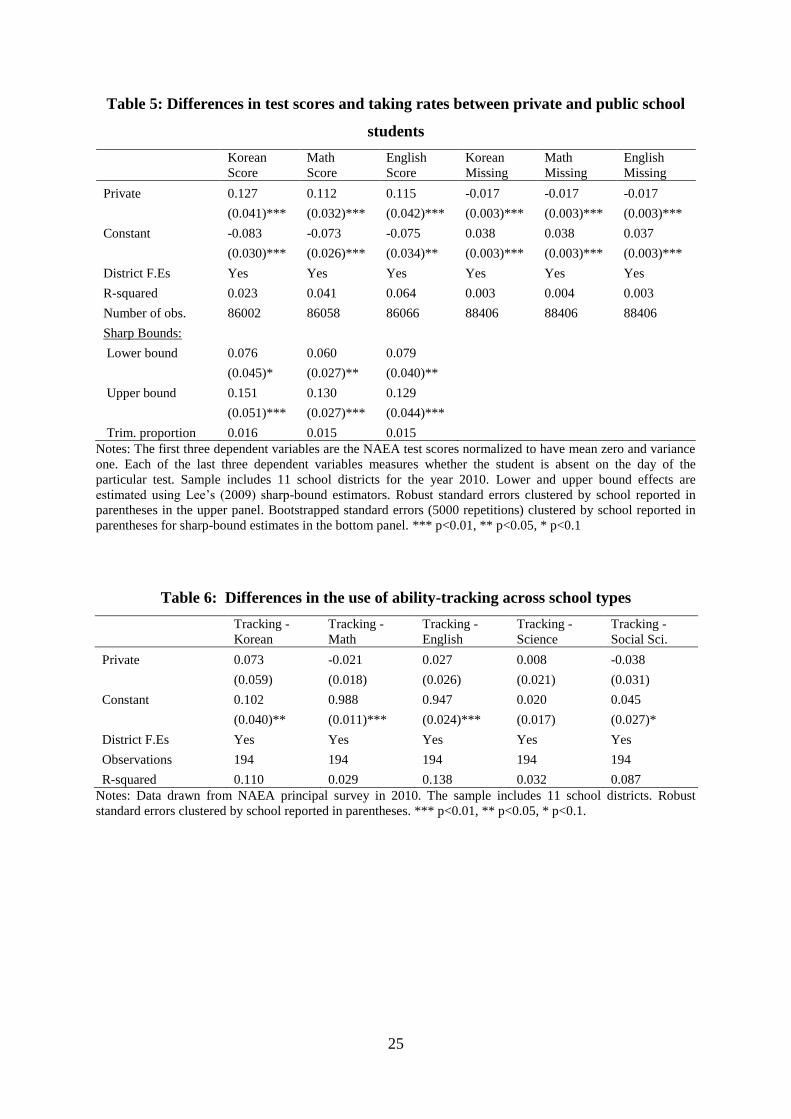
The OLS estimates support the patterns shown in Figure 3. Specifically, columns 1 to
3 in Table 5 indicate that private school students significantly outperform public school
students in Korean, mathematics, and English. The estimated effect of private schooling on
test score is 0.12 standard deviations for Korean and 0.11 standard deviations for Math and
English. However, columns 4 to 6 show that private school students are less likely to miss the
NAEA tests by 2 percentage points, indicating higher absenteeism on the test date among the
students in public schools. If there are non-random differences in the selection into test taking
between private and public school students, the estimated effects of private schooling based
on equation (3) will suffer from non-random selection bias. To address this concern, we use
Lee’s (2009) sharp-bound estimators to bind the effects of private schooling on test scores.
The sharp-bound estimators trim the private school sample on the basis of the selection rate
(i.e., the probability of missing the test) of the public school sample relative to that of the
private school sample, so that the private school sample is comparable to the public school

12
sample. When the upper tail of private school test scores is trimmed, the remaining sample of
test takers in private schools is comparable to the sample of test takers in public schools,
assuming high performers of the public schools miss the test. The lower-bound estimate of
the private school effect is then the difference between the average test score of public school
test takers and the average test score of the trimmed sample of private school test takers.
Similarly, the upper-bound estimate of the private school effect is obtained from trimming the
lower tail of the private school test score distribution and then taking the difference between
the average test scores of public test takers and trimmed private school test takers.
[Insert Table 5]
The bottom panel in Table 5 reports the lower-bound and upper-bound estimates of
the effects of private schooling on Korean, Math, and English test scores. The lower sharp
bound estimates are greater than zero, indicating that even in the worst case scenario, where
the brightest public school students are selected out of test taking, the estimated effect of
private schooling on test performance is positive. If the worst-performing public school
students miss the NAEA tests, then the estimated effect of private schooling on test score is
as large as 0.15 standard deviations for Korean and 0.13 for Math and English. This is a
sizable effect, considering that one standard-deviation increase in teacher quality (i.e.,
measured by teacher fixed effects) is found to increase student test score by 0.1 standard
deviations (Rockoff 2004). This effect size is also roughly three-quarters of what Angrist et al.
(2002) found for the random assignment of private school vouchers in Colombia. It is not
surprising that the estimates are smaller than those reported in Angrist et al. (2002). Unlike
the situation in Colombia, private and public high schools in Seoul must admit similar
students, use the same curricula, and charge similar fees, so there are fewer factors to
influence outcomes. Nevertheless, the private school effects are sizable. The findings call for
further investigation into the factors that explain the private school effects in the next section.
V. What Factors Explain the Private School Effects?
The randomization of students into schools and the equalization policy imply that many
factors typically attributed to the effects of private schooling are absent in Seoul. The
randomization of students into schools removes peer quality differences among newly
admitted students, as well as the incentives for schools to compete for students and revenues.
The implementation of the equalization policy also means that fees charged and curricula
13
used are similar in private and public schools. This unique setting allows us to eliminate some
of the frequently discussed channels through which private and charter schooling may
improve student outcomes.
Our own investigation of the channels indicates that: (1) greater autonomy given to
private schools, together with (2) the more stringent accountability system placed on private
schools are likely the main drivers of the better outcomes for private high school students in
Seoul. This section is devoted to present how we come to this conclusion. We first show how
various other factors are ruled out as likely channels due to insufficient evidence on the
differences between public and private schools. We then corroborate the two likely channels
using principal survey data that we conducted in 2013.
A. Factors that Do Not Explain the Private School Effects
We examine the common inputs in the education production function that might be correlated
with private schooling and have independent effects on student outcomes. These inputs
include effective school practices, inputs of students and parents, and school-level resources.
We discuss the channels relevant to the differences between private and public schools in the
order of: (1) tracking practice; (2) single-sex schooling; (3) religious affiliation; (4) private
tutoring; and (5) resources.
First, the private school effects may be attributable to the greater use of ability-
tracking, as a recent experimental study by Duflo et al. (2011) shows that tracking students
by ability leads to improved achievement of all students. If the likelihood of tracking students
into different classrooms on the basis of ability differs between private and public schools,
then it is possible that the private school effects are attributable to the greater use of tracking.
Table 6 shows no significant differences in the likelihood of ability-tracking students by
subject between private and public schools.
[Insert Table 6]
Second, private schools in Seoul are more likely to be single-sex. It is possible that
the estimated private school effects also capture the effects of single-sex schooling. We
estimate equations (2) and (3) separately for students attending single-sex schools and
coeducational schools to disentangle the effects of private schooling from the effects of
single-sex schooling. If the private school effects are present within each gender type of
schools, then it is unlikely that the effects are driven by single-sex schooling. The analysis is
14
pertinent given recent findings by Park et al. (2012) and Hahn and Wang (2012) showing that
students in single-sex high schools outperform those in coeducational high schools in some
outcomes, depending on the gender of students and the ownership type of the schools.
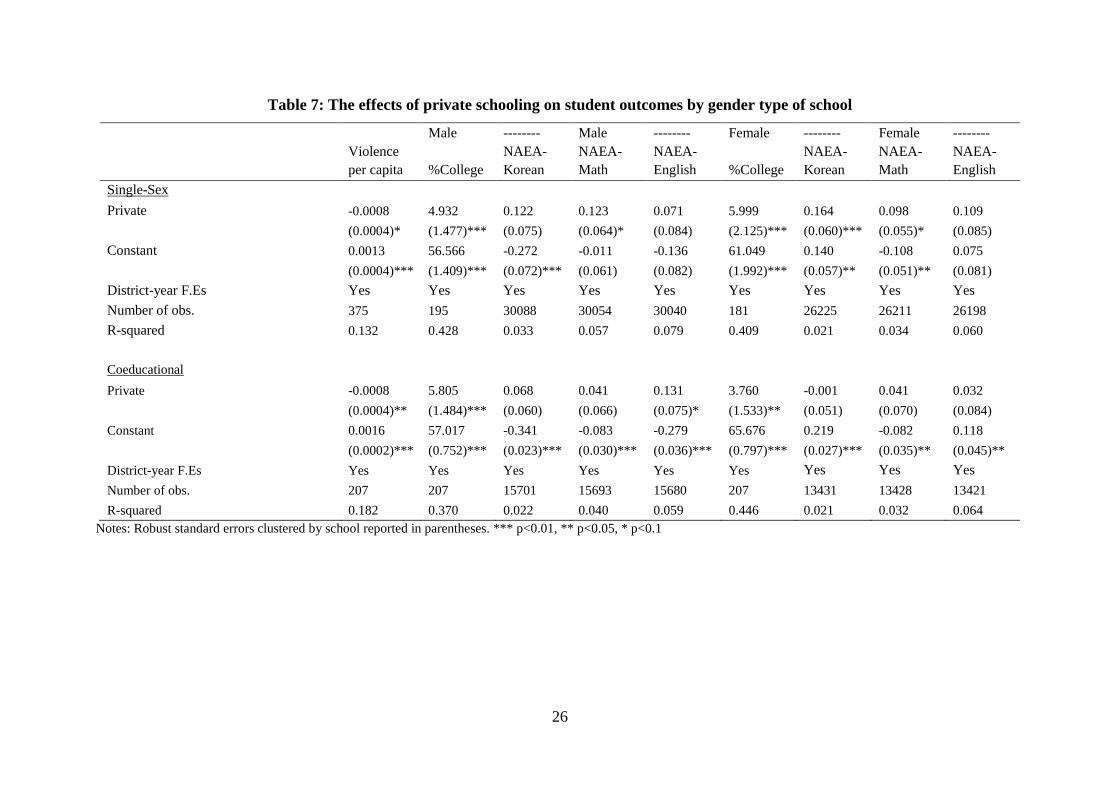
Table 7 reports the estimated effects of private schooling by gender of student and
gender type of school. For simplicity, we only report the OLS estimates but not Lee’s (2009)
sharp-bound estimates for the NAEA test scores. Similar to the results reported earlier,
private schooling reduces the likelihood of in violent incidents and increases the probability
of attending college across all gender types of schools. However, the estimated effects of
private schooling on test scores are much noisier when we split the sample by the gender type
of school. Overall, students attending private schools still show higher test scores than
students attending public schools, but the effects are not precisely estimated. In particular, the
effects are insignificant for female students attending coeducational schools, even though the
magnitudes are generally modest and positive. Thus, the effects of private schooling on
college outcomes and violent incidents are unlikely driven by single-sex schooling, but
private schools’ tendency to be single-sex may partially contribute to their higher average test
scores.
[Insert Table 7]
Next, we examine whether the religious affiliation of schools drives the private school
effects. Only private schools can be religiously affiliated, and about 30 percent of private
schools in Seoul are religious schools, with the majority of them being Christian private
schools. Past studies in other countries, such as the U.S. and Australia, have shown
significant benefits associated with Catholic private schooling on individuals (e.g., Evans and
Schwab 1995; Neal 1997; Vella 1999; Altonji et al. 2005a, 2005b; Le and Miller 2003). It is
possible that religious affiliation of private schools, rather than the ownership type per se,
explains the outcome differences across school types in Seoul. When we run regressions for
each outcome variable against a religious affiliation dummy for the sample of private schools,
the estimates show no differences between religiously affiliated private schools and secular
private schools (Table 8). Thus, the religious affiliation of schools does not explain the
outcome differences.
[Insert Table 8]
15
The channels examined thus far have focused on the possible differences in school
practices between private and public schools. However, students’ and their parents’ inputs
may also respond differently according to their school type, even if the school practices are
similar across school type. One such input is the level of private tutoring, given that South
Korea has one of the largest and most active private tutoring markets in the world (Bray
2009). On the one hand, it is possible that private schooling is complementary to private
tutoring, thus it may increase the likelihood of students taking up private tutoring outside
school hours. The positive effects of private schooling on outcomes then would reflect the
differential likelihood in private tutoring across school types. On the other hand, students in
public schools may not be satisfied with their school quality and in response increase private
tutoring. In either case, the effect of private schooling might not be precisely captured.
To test whether private schooling leads to differential responses in private tutoring,
we use student survey information available in the NAEA dataset where students report their
frequency of private tutoring. Table 9 shows the results from the OLS regressions where the
dependent variables include various degrees of private tutoring. There is no significant
difference in the likelihood and extent to which students take private tutoring lessons across
school types.14
If anything, private schooling tends to decrease the likelihood of having
intensive private tutoring, but the estimate is still insignificant.
[Insert Table 9]
Lastly, we examine whether resources available differ across school types. Although
under the equalization policy, each school receives similar funding per student from the
government, private schools may find other sources of funding. Column 1 in Table 10
confirms that resources per student available to private and public schools are comparable, as
teacher salary expenses per student are similar across school types. As some studies indicate
that school infrastructures may make a difference to student outcomes (Branham 2004, Uline
and Tschannen-Moran 2008, and Glewwe et al. 2011), we also investigate whether private
schools have better infrastructure using information about school land size and ground size.
These measures capture only the quantitative aspects of infrastructure but they should provide
some indications regarding the influence of school infrastructures on student outcomes.
14
We also estimate an ordered logit model and the estimated effects of private schooling are not statistically
significant at the 10% level.
16
Columns 2 to 4 in Table 10 show that there are no differences between private and public
schools in terms of infrastructure available per student.
[Insert Table 10]
B. Autonomy and Accountability
We have ruled out ability-tracking, single-sex schooling, religious affiliation, private tutoring,
and school resources as the likely factors explaining the private school effects in Seoul. What
are the underlying mechanisms, then, that make private schools more conducive to better
student outcomes? We argue that the underlying forces behind the success of private schools
are: (1) the greater autonomy in personnel decisions, together with (2) the more stringent
accountability measure associated with less job security for private school principals and
teachers.
Private school boards are fully responsible for hiring their school principals among
eligible candidates, so private school principals are not public servants and their continued
employment depends on their performance. In contrast, public school principals in Seoul are
appointed by the Seoul Metropolitan Office of Education. They rotate to different schools
every few years, are less likely to lose their jobs, and may continue to be public school
teachers after finishing their terms as principals. Our survey data show that principals’
perception about the relative job security by school type is consistent with this fact (question1
in Table 11): 62.7% of school principals answered that public schools provide principals with
higher job security than private schools do. The survey data also show that there is a stronger
incentive to produce good academic performance in private schools than in public schools
(questions 3, 4 and 7 in Table 11). In line with job insecurity and incentives, private school
principals generally place a greater emphasis on students’ success in entering into colleges
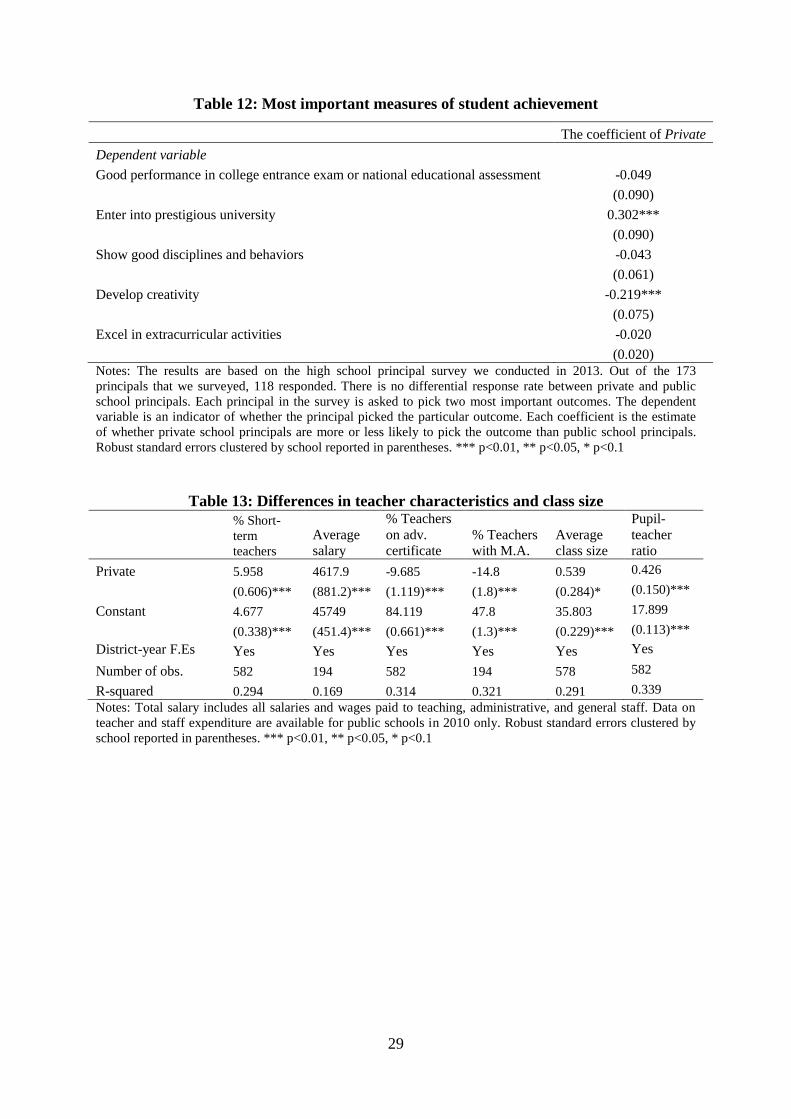
and academic achievement (Table 12) than public school principals.15
The greater emphasis
on college admission rate among private school principals is observed with diminished efforts
on encouraging students’ creativity.16
Thus, private school principals focus on delivering
good academic outcomes as well as facing stronger incentives to do so.
15
While there is significant difference in picking the entrance rate into prestigious university as the most
important measure of student achievement, there is no significant difference in the good performance between
private and public school principals. The reason can be that the survey question asked principals to pick one of
two most important measures, and private principals did not pick the latter as a second choice in the case of their
choosing the former first since the two choices seem to be similar. 16
The survey results do not imply that creativity is considered not important in private schools. Instead, private
principals place more emphasis on entrance into prestigious university than on developing creativity of students.
17
[Insert Table 11]
[Insert Table 12]
Private school principals have a lot of controls over whom they recruit as teachers and
can set teachers incentives to be more aligned with their objectives (questions 6 and 7 in
Table 11), while public school principals have almost no control over recruitment. For
example, private school principals may screen their teachers on the basis of characteristics
less observables to researchers, which past studies have shown to be more reflective of
teacher quality. In order to test whether private schools tend to hire better quality teachers,
ideally, we would need matched student-teacher level data that allow us to estimate teacher
fixed effects, which are a common measure of teacher quality (Hanushek and Rivkin 2006).
Although we lack data that directly measure teacher quality, if private and public schools
differ in observable school-level teacher characteristics, it is likely that their teachers also
differ in other unobservable dimensions that lead to outcome differences.
We find that private schools and public schools have different compositions of teacher
types and compensate their teachers differently. First, column 1 in Table 13 shows that
private schools employ a larger fraction of their teachers on short-term contracts. Teachers on
short-term contracts face less job security so they have incentives to perform better, but short-
term teachers in private schools face even greater incentives as they have an opportunity for
continued employment. In public schools, short-term teachers have to leave when their
contracts are over, whereas in private schools, short-term teachers can be promoted to be
regular teachers depending on their performance.17
As a result, short-term teachers in private
schools have stronger incentives to deliver better student outcomes, and regular teachers in
private schools are more likely a selected group of teachers who have proven themselves.
Second, column 2 in Table 13 shows that private schools tend to pay their teachers much
higher financial compensation package on average. Since private and public schools are
required to follow a pay-scale schedule and pay the same base salary to teachers with the
same years of teaching and credentials, the higher average financial compensation package
17
Short term teachers in public schools can be promoted to permanent teachers after passing the teacher’s exam.
18
means that private school teachers also receive other forms of compensations in addition to
the base salary. The additional compensation can incentivize teachers to work harder.
[Insert Table 13]
Since private schools and public schools receive similar resources per student, private
school principals must have allocated their limited resources differently to pay for the higher
average financial compensation to their teachers. Hiring a larger fraction of short-term
teachers is one of the ways. Other ways include hiring less experienced teachers who do not
possess an advanced teaching certificate (column 3 in Table 13), hiring less educated teachers
who do not hold a graduate degree (column 4 in Table 13), hiring fewer teachers per student
(column 5 in Table 13), and running larger class size (column 6 in Table 13). Without teacher
incentives, these cost-saving ways adopted by private schools, such as hiring seemingly less
qualified teachers and running larger class size, would have probably worsened student
outcomes as some studies indicate.18
Thus, unobservable teacher characteristics probably play
a larger role in explaining the results.
Although we cannot identify all the observable and unobservable factors that are
directly responsible for the superior performance of private school students, we show
evidence that private school principals allocate the limited resources differently from public
school principals, and that private school principals and teachers face less job security.
Combining the incentives private school principals face and the staffing autonomy they enjoy,
it appears that private school principals are able to deliver the outcomes they care about.
VI. Conclusions
This paper answers some of the key questions on the relative effectiveness of private or
charter to public schooling that past papers were unable to satisfactorily answer. We exploit
the random assignment of students into private and public high schools within school districts
in Seoul to show that private schooling causally improves student outcomes. Private
schooling leads to a greater likelihood of four-year college attendance, lower likelihood of
two-year college attendance, and fewer violent incidents per student. However, private
schooling has no significant effect on dropout rates and high school seniors’ graduation rates.
18
The findings about class size and teacher credentials are mixed (see Hanushek (2006) for a review of the
evidence). More recently, Dobbie and Fryer (2013) show that conventional input measures—class size, per pupil
expenditure, the fraction of teachers with no teaching certification, and the fraction of teachers with an advanced
degree—are not positively correlated with school effectiveness using data on charter schools in New York City.
19
We also show that private school students are more likely to be present on the day of national
standardized tests, suggesting that private schools have lower students’ absenteeism. Our
estimates indicate that private school students outperform public school students in Korean,
English, and mathematics standardized tests even after taking into consideration the potential
non-random selection into test taking.
Because of the equalization policy and the randomization of students into schools,
many factors commonly attributed to the effects of private schooling, such as peer quality,
resources, incentives for schools to compete for students and revenues, and curricula
differences, are absent in Seoul. We also present evidence that the benefits of private
schooling on student outcomes in Seoul are not driven by the use of tracking, single-sex
schooling, religious affiliation of private schools, and greater use of private tutoring. We
argue that the explanations for the differential outcomes are likely due to the way private
schools are organized. In particular, because private school principals must be directly
accountable to the school boards and have greater autonomy over their staffing decisions,
whereas public school principals and teachers rotate to different public schools every four
years without much threat of losing their jobs, principals and teachers in private schools face
stronger incentives to deliver good student outcomes.
Since one of the key arguments for why private and charter schooling can improve
outcomes lies in their potential to increase competition, it is important to note that our
findings do not imply that other countries should also adopt a policy that randomizes students
across schools and eliminates the incentives for schools to compete for students. The
randomized natural experiment in Seoul mainly provides a unique opportunity for us to learn
the benefits of giving greater autonomy to individual schools, while keeping school principals
accountable, on student outcomes. An important caveat worth pointing out is that the findings
in Korea may not readily extend to other economies, as Hanushek et al. (2013) use panel
observational data to show that greater school autonomy leads to improved student
achievement in developed countries, but not in developing countries where accountability
measures are lacking. More evidence from field or natural experiments is needed to improve
our understanding of whether greater school autonomy or corporatization leads to better
student outcomes.
20
References
Alexander, Karl L., and Aaron M. Pallas. 1983. “Private Schools and Public Policy: New
Evidence on Cognitive Achievement in Public and Private Schools.” Sociology of
Education, vol.56: 170-81.
Altonji, Joseph G., Todd E. Elder, and Christopher R. Taber. 2005a. “An Evaluation of
Instrumental Variable Strategies for Estimating the Effects of Catholic Schools.”
Journal of Human Resources, vol.40: 791-821.
Altonji, Joseph G., Todd E. Elder, and Christopher R. Taber. 2005b. “Selection on Observed
and Unobserved Variables: Assessing the Effectiveness of Catholic Schools.” Journal
of Political Economy, vol.113: 151-184.
Angrist, Joshua, Eric Bettinger, Erik Bloom, Elizabeth King, and Michael Kremer. 2002.
“Vouchers for Private Schooling in Colombia: Evidence from a Randomized Natural
Experiment.” American Economic Review, vol.92(5): 1535-1558.
Angrist, Joshua, Eric Bettinger, and Michael Kremer. 2006. “Long-Term Educational
Consequences of Secondary School Vouchers: Evidence from Administrative Records
in Colombia.” American Economic Review, vol.96 (3): 847-862.
Branham, David. 2004. “The Wise Man Builds His House Upon the Rock: The Effects of
Inadequate School Building Infrastructure on Student Attendance.” Social Science
Quarterly, vol.85 (5): 1112-1128.
Bray, Mark. 2009. Confronting the Shadow Education System: What Government Policies for
What Private Tutoring? International Institute for Educational Planning, Paris.
Coleman, James, Thomas Hoffer, and Sally Kilgore. 1982. High School Achievement: Public,
Catholic and Private Schools Compared. Basic Books, NY.
Coleman, James, and Thomas Hoffer. 1987. Public and Private Schools: The Impacts of
Communities. New York: Basic Books.
Cullen, Julie Berry, Brian A. Jacob and Steven Levitt. 2006. “The Effect of School Choice on
Participants: Evidence from Randomized Lotteries.” Econometrica, vol.74(5): 1191-
1230.
Dobbie, Will and Roland G. Fryer, Jr. 2013. “Getting Beneath the Veil of Effective Schools:
Evidence from New York City.” American Economic Journal: Applied Economics
vol.5(4): 28-60.
21
Duflo, Esther, Pascaline Dupas and Michael Kremer. 2011. “Peer Effects and the Impacts of
Tracking: Evidence from a Randomized Evaluation in Kenya”, American Economic
Review, 101(5):1739-74.
Evans, William, and Robert Schwab. 1995. “Finishing High School and Starting College: Do
Catholic Schools Make a Difference?” Quarterly Journal of Economics, vol.110: 947-
974.
Figlio, David, and Joe A. Stone. 1999. “School Choice and Student Performance: Are Private
Schools Really Better?” Research in Labor Economics, vol.18: 115-140.
Glewwe, Paul W., Eric A. Hanushek, Sarah D. Humpage and Renato Ravina. 2011. “School
Resources and Educational Outcomes in Developing Countries: A Review of the
Literature from 1990 to 2010,” NBER Working Paper 17554, October.
Hahn, Youjin, and Liang Choon Wang. 2012. “Causal Effects of Single-Sex Schools on
College Entrance Exams and College Attendance: Random Assignment in Seoul High
Schools: Comment.” Available at SSRN: http://ssrn.com/abstract=2194336
Hanushek, Eric A. 2006. “School Resources.” Handbook of the Economics of Education, 2,
865-908.
Hanushek, Eric. A., and Steven G. Rivkin. 2006. “Teacher quality.” Handbook of the
Economics of Education, 2, 1051-1078.Hanushek, Eric A., Susanne Link, and Ludger
Woessmann. 2013. “Does School Autonomy Make Sense Everywhere? Panel Estimates
from PISA.” Journal of Development Economics, vol.104: 212-232.
Hoxby, Caroline M., and Sonali Murarka. Charter schools in New York City: Who enrolls
and how they affect their students' achievement. No. w14852. National Bureau of
Economic Research, 2009.
Kim, E. G., Kim, K. S., Kim, D. K., & Kim, E. Y. 2007. Improving School Leadership:
Country Background Report for Korea.
Le, Anh T., and Paul W. Miller. 2003. “Choice of School in Australia: Determinants and
Consequences.” Australian Economic Review, vol.36: 55-78.
Lee, David S. 2009. “Training, Wages, and Sample Selection: Estimating Sharp Bounds on
Treatment Effects.” Review of Economic Studies.
Neal, Derek. 1997. “The Effect of Catholic Secondary Schooling on Educational
Attainment.” Journal of Labor Economics, vol.15: 98-123.
Park, Hyunjoon, Jere R. Behrman, and Jaesung Choi. 2012. “Causal Effects of Single-Sex
Schools on College Attendance: Random Assignment in Korean High Schools.”
Demography.
22
Rockoff, Jonah. 2004. “The Impact of Individual Teachers on Student Achievement:
Evidence from Panel Data,” American Economic Review, Papers and Proceedings,
vol.94: 247-252
Uline, Cynthia, and Megan Tschannen-Moran. 2008. “The Walls Speak: The Interplay of
Quality Facilities, School Climate, and Student Achievement.” Journal of Educational
Administration, vol. 46 (1): 55-73.
Vanderberghe, Vincent, and Stephane R. Robin. 2004. “Evaluating the Effectiveness of
Private Education Across Countries: A Comparison of Methods.” Labour Economics,
vol.11: 487-506.
Vella, Francis. 1999. “Do Catholic Schools Make a Difference? Evidence from Australia.”
Journal of Human Resources, vol.34: 208-224.

23
Table 1: Summary Statistics of Variables
Variable Obs. Mean Std. Dev. Min Max
School level data
Private 582 0.644 0.479 0.000 1.000
Coeducational 582 0.359 0.479 0.000 1.000
All boys 582 0.333 0.472 0.000 1.000
All girls 582 0.308 0.462 0.000 1.000
Religious 582 0.180 0.385 0.000 1.000
% Welfare 194 4.064 3.882 0.447 33.87
% Minorities 194 0.087 0.141 0.000 0.978
% Lunch support 582 10.39 12.83 0.000 100
% Transfer out 582 1.821 0.807 0.240 6.563
% Dropout 582 1.583 1.328 0.000 18.806
% Graduation 582 99.87 0.333 96.457 100
Violence incidents per student 582 0.001 0.001 0.000 0.013
% College 582 63.14 8.054 41.404 86.61
% 4-year college 582 42.51 8.333 13.992 73.13
% 2-year college 582 20.63 8.786 1.183 53.68
Teacher salary per student 194 3,214 460.8 0.000 5,002
Students per ground area 531 0.133 0.340 0.000 7.857
Students per school area 579 0.075 0.048 0.001 0.430
Students per total area 579 0.080 0.051 0.007 0.531
Average teacher compensation 582 48,724 6,328 0.000 61,919
% Teachers with advanced certificates 582 77.88 10.15 44.26 97.92
% Teachers on short- term contracts 582 8.516 5.836 0.000 27.40
% Teachers with M.A. 194 38.25 14.36 2.041 77.66
Students per teacher 582 18.17 1.398 13.48 24.23
Tracking – Korean 194 0.149 0.357 0.000 1.000
Tracking – Math 194 0.974 0.159 0.000 1.000
Tracking – English 194 0.964 0.187 0.000 1.000
Tracking – Science 194 0.026 0.159 0.000 1.000
Tracking – Social science 194 0.021 0.142 0.000 1.000
Student level data
Missed NAEA Korean 88406 0.027 0.163 0.000 1.000
Missed NAEA Math 88406 0.027 0.161 0.000 1.000
Missed NAEA English 88406 0.026 0.161 0.000 1.000
NAEA Korean (standardized) 86002 0.000 1.000 -2.972 3.041
NAEA Math (standardized) 86058 0.000 1.000 -2.624 2.704
NAEA English (standardized) 86066 0.000 1.000 -2.651 2.049
Notes: School level data are mostly for years 2008, 2009, 2010, with some exceptions; for example, variables
for percentage of teachers with masters degrees, percentage of students from families on public welfare,
percentage of students of ethnic minorities, and percentage of students on free lunch are available for 2010 only.
Student level data are NAEA test score data for eleventh graders in 2010.
24
Table 2: Verification of Random Assignment
% Welfare % Minorities % Free lunch % Transfer out
Private -0.111 0.008 1.273 -0.017
(0.490) (0.022) (1.204) (0.112)
Constant 4.136 0.082 9.569 1.832
(0.315)*** (0.015)*** (0.864)*** (0.091)***
District-year F.Es Yes Yes Yes Yes
Number of obs. 194 194 582 582
R-squared 0.110 0.095 0.162 0.198
Notes: % Welfare is percentage of students in families under governmental welfare assistance; % minorities is
the percentage of students from ethnic minority groups; % free lunch is the percentage of students receiving free
lunch. The first two columns are based on 2010 principal survey data, while the last two columns are based on
school data for 2008-2010. Robust standard errors clustered by school reported in parentheses. *** p<0.01, **
p<0.05, * p<0.1.
Table 3: The effects of private schooling on school-level students’ outcomes
% Dropout % Grads
Violence
per capita % College % 4-year % 2-year
Private -0.052 0.025 -0.0009 4.283 6.641 -2.358
(0.112) (0.032) (0.0002)*** (0.724)*** (0.857)*** (0.995)**
Constant 1.617 99.849 0.0015 60.384 38.234 22.150
(0.079)*** (0.023)*** (0.0002)*** (0.564)*** (0.661)*** (0.803)***
District-year F.Es Yes Yes Yes Yes Yes Yes
Number of obs. 582 582 582 582 582 582
R-squared 0.055 0.128 0.144 0.381 0.354 0.389
Notes: % dropout is the number of dropout over total number of year-start enrollment; violence per capita is the
number of reported violent incidents per student. Sample includes 11 school districts for the year 2008, 2009,
and 2010. Robust standard errors clustered by school reported in parentheses. *** p<0.01, ** p<0.05, * p<0.1.
Table 4: The effects of private schooling on college attendance outcomes by gender
% College % College % 4-year % 4-year % 2-year % 2-year
Male Female Male Female Male Female
Private 5.283 3.041 8.086 5.328 -2.804 -2.287
(0.822)*** (0.913)*** (1.070)*** (1.112)*** (1.004)*** (1.289)*
Constant 56.739 64.778 36.625 39.486 20.113 25.292
(0.633)*** (0.730)*** (0.717)*** (0.807)*** (0.793)*** (0.945)***
District-year F.Es Yes Yes Yes Yes Yes Yes
Number of obs. 402 388 402 388 402 388
R-squared 0.365 0.347 0.364 0.333 0.418 0.381
Notes: % Graduation is the share of seniors graduating from high school; %College is the number of graduates
entering into any foreign or domestic university or college over total number of seniors. Sample includes 11
school districts for the year 2008, 2009, and 2010. Robust standard errors clustered by school reported in
parentheses. *** p<0.01, ** p<0.05, * p<0.1.
25
Table 5: Differences in test scores and taking rates between private and public school
students
Korean
Score
Math
Score
English
Score
Korean
Missing
Math
Missing
English
Missing
Private 0.127 0.112 0.115 -0.017 -0.017 -0.017
(0.041)*** (0.032)*** (0.042)*** (0.003)*** (0.003)*** (0.003)***
Constant -0.083 -0.073 -0.075 0.038 0.038 0.037
(0.030)*** (0.026)*** (0.034)** (0.003)*** (0.003)*** (0.003)***
District F.Es Yes Yes Yes Yes Yes Yes
R-squared 0.023 0.041 0.064 0.003 0.004 0.003
Number of obs. 86002 86058 86066 88406 88406 88406
Sharp Bounds:
Lower bound 0.076 0.060 0.079
(0.045)* (0.027)** (0.040)**
Upper bound 0.151 0.130 0.129
(0.051)*** (0.027)*** (0.044)***
Trim. proportion 0.016 0.015 0.015
Notes: The first three dependent variables are the NAEA test scores normalized to have mean zero and variance
one. Each of the last three dependent variables measures whether the student is absent on the day of the
particular test. Sample includes 11 school districts for the year 2010. Lower and upper bound effects are
estimated using Lee’s (2009) sharp-bound estimators. Robust standard errors clustered by school reported in
parentheses in the upper panel. Bootstrapped standard errors (5000 repetitions) clustered by school reported in
parentheses for sharp-bound estimates in the bottom panel. *** p<0.01, ** p<0.05, * p<0.1
Table 6: Differences in the use of ability-tracking across school types
Tracking -
Korean
Tracking -
Math
Tracking -
English
Tracking -
Science
Tracking -
Social Sci.
Private 0.073 -0.021 0.027 0.008 -0.038
(0.059) (0.018) (0.026) (0.021) (0.031)
Constant 0.102 0.988 0.947 0.020 0.045
(0.040)** (0.011)*** (0.024)*** (0.017) (0.027)*
District F.Es Yes Yes Yes Yes Yes
Observations 194 194 194 194 194
R-squared 0.110 0.029 0.138 0.032 0.087
Notes: Data drawn from NAEA principal survey in 2010. The sample includes 11 school districts. Robust
standard errors clustered by school reported in parentheses. *** p<0.01, ** p<0.05, * p<0.1.
26
Table 7: The effects of private schooling on student outcomes by gender type of school
Male -------- Male -------- Female -------- Female --------
Violence
per capita %College
NAEA-
Korean
NAEA-
Math
NAEA-
English %College
NAEA-
Korean
NAEA-
Math
NAEA-
English
Single-Sex
Private -0.0008 4.932 0.122 0.123 0.071 5.999 0.164 0.098 0.109
(0.0004)* (1.477)*** (0.075) (0.064)* (0.084) (2.125)*** (0.060)*** (0.055)* (0.085)
Constant 0.0013 56.566 -0.272 -0.011 -0.136 61.049 0.140 -0.108 0.075
(0.0004)*** (1.409)*** (0.072)*** (0.061) (0.082) (1.992)*** (0.057)** (0.051)** (0.081)
District-year F.Es Yes Yes Yes Yes Yes Yes Yes Yes Yes
Number of obs. 375 195 30088 30054 30040 181 26225 26211 26198
R-squared 0.132 0.428 0.033 0.057 0.079 0.409 0.021 0.034 0.060
Coeducational
Private -0.0008 5.805 0.068 0.041 0.131 3.760 -0.001 0.041 0.032
(0.0004)** (1.484)*** (0.060) (0.066) (0.075)* (1.533)** (0.051) (0.070) (0.084)
Constant 0.0016 57.017 -0.341 -0.083 -0.279 65.676 0.219 -0.082 0.118
(0.0002)*** (0.752)*** (0.023)*** (0.030)*** (0.036)*** (0.797)*** (0.027)*** (0.035)** (0.045)**
District-year F.Es Yes Yes Yes Yes Yes Yes Yes Yes Yes
Number of obs. 207 207 15701 15693 15680 207 13431 13428 13421
R-squared 0.182 0.370 0.022 0.040 0.059 0.446 0.021 0.032 0.064
Notes: Robust standard errors clustered by school reported in parentheses. *** p<0.01, ** p<0.05, * p<0.1
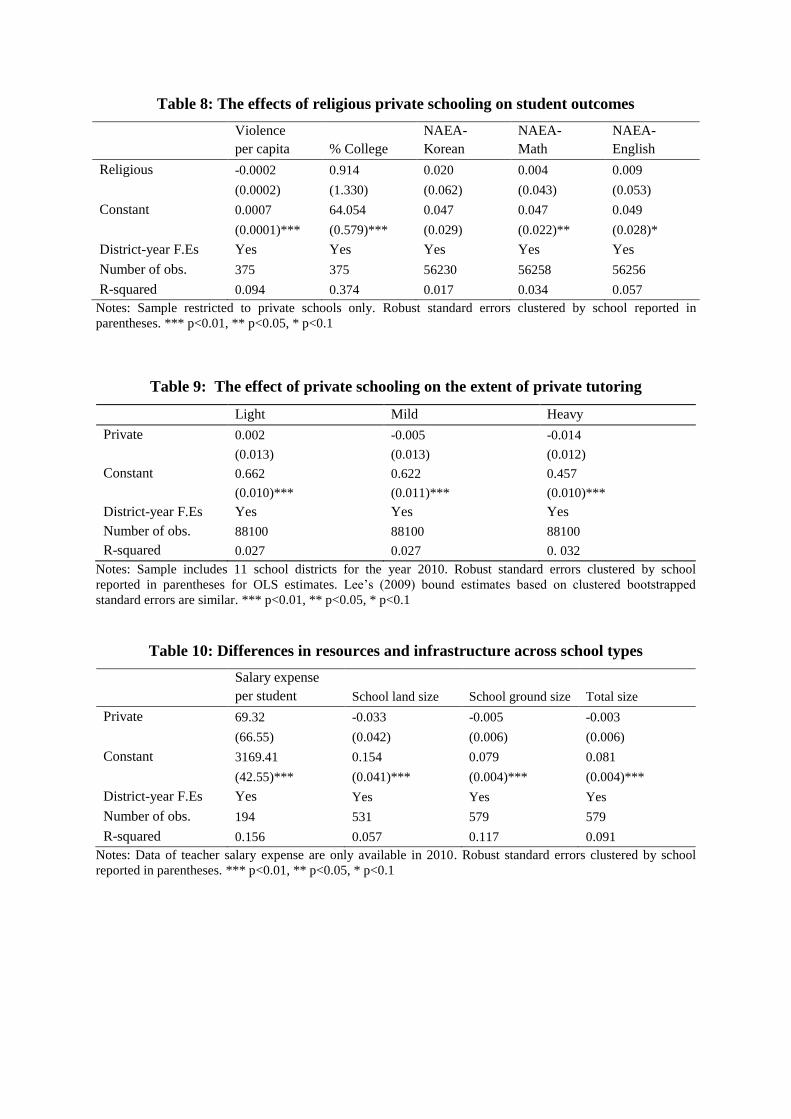
Table 8: The effects of religious private schooling on student outcomes
Violence
per capita % College
NAEA-
Korean
NAEA-
Math
NAEA-
English
Religious -0.0002 0.914 0.020 0.004 0.009
(0.0002) (1.330) (0.062) (0.043) (0.053)
Constant 0.0007 64.054 0.047 0.047 0.049
(0.0001)*** (0.579)*** (0.029) (0.022)** (0.028)*
District-year F.Es Yes Yes Yes Yes Yes
Number of obs. 375 375 56230 56258 56256
R-squared 0.094 0.374 0.017 0.034 0.057
Notes: Sample restricted to private schools only. Robust standard errors clustered by school reported in
parentheses. *** p<0.01, ** p<0.05, * p<0.1
Table 9: The effect of private schooling on the extent of private tutoring
Light Mild Heavy
Private 0.002 -0.005 -0.014
(0.013) (0.013) (0.012)
Constant 0.662 0.622 0.457
(0.010)*** (0.011)*** (0.010)***
District-year F.Es Yes Yes Yes
Number of obs. 88100 88100 88100
R-squared 0.027 0.027 0. 032
Notes: Sample includes 11 school districts for the year 2010. Robust standard errors clustered by school
reported in parentheses for OLS estimates. Lee’s (2009) bound estimates based on clustered bootstrapped
standard errors are similar. *** p<0.01, ** p<0.05, * p<0.1
Table 10: Differences in resources and infrastructure across school types
Salary expense
per student School land size School ground size Total size
Private 69.32 -0.033 -0.005 -0.003
(66.55) (0.042) (0.006) (0.006)
Constant 3169.41 0.154 0.079 0.081
(42.55)*** (0.041)*** (0.004)*** (0.004)***
District-year F.Es Yes Yes Yes Yes
Number of obs. 194 531 579 579
R-squared 0.156 0.057 0.117 0.091
Notes: Data of teacher salary expense are only available in 2010. Robust standard errors clustered by school
reported in parentheses. *** p<0.01, ** p<0.05, * p<0.1

28
Table 11: Principal’s perception on differences between private and public schools
1. Principal job security %
Public schools are more secure than private school 62.71
Private schools are more secure than public school 5.08
Equal job security 32.2
2. Teacher job security
Public schools are more secure than private school 39.83
Private schools are more secure than public school 5.08
Equal job security 55.08
3. Principals' incentive to deliver good outcomes
Public schools have greater incentive than private schools 7.63
Private schools have greater incentive than public schools 76.27
Equal incentive 16.1
4. Teachers' incentive to deliver good outcomes
Public schools have greater incentive than private schools 8.55
Private schools have greater incentive than public schools 76.92
Equal incentive 14.53
5. The punishment on teachers for poor performance
Public schools have greater punishment 15.38
Private schools have greater punishment 47.01
Equal punishment 37.61
6. More flexible and autonomous school policies Public schools are more flexible 5.98
Private schools are more flexible 70.09
Equally flexible 23.93
7. Whether teachers are encouraged to implement innovative classroom practices
and solutions
Public schools are more encouraged 14.66
Private schools are more encouraged 63.79
Equal encouragement 21.55
Notes: The results are based on the high school principal survey we conducted in 2013. Out of the 173
principals that we surveyed, 118 responded. There is no differential response rate between private and public
school principals.
29
Table 12: Most important measures of student achievement
The coefficient of Private
Dependent variable
Good performance in college entrance exam or national educational assessment -0.049
(0.090)
Enter into prestigious university 0.302***
(0.090)
Show good disciplines and behaviors -0.043
(0.061)
Develop creativity -0.219***
(0.075)
Excel in extracurricular activities -0.020
(0.020)
Notes: The results are based on the high school principal survey we conducted in 2013. Out of the 173
principals that we surveyed, 118 responded. There is no differential response rate between private and public
school principals. Each principal in the survey is asked to pick two most important outcomes. The dependent
variable is an indicator of whether the principal picked the particular outcome. Each coefficient is the estimate
of whether private school principals are more or less likely to pick the outcome than public school principals.
Robust standard errors clustered by school reported in parentheses. *** p<0.01, ** p<0.05, * p<0.1
Table 13: Differences in teacher characteristics and class size
% Short-
term
teachers
Average
salary
% Teachers
on adv.
certificate
% Teachers
with M.A.
Average
class size
Pupil-
teacher
ratio
Private 5.958 4617.9 -9.685 -14.8 0.539 0.426
(0.606)*** (881.2)*** (1.119)*** (1.8)*** (0.284)* (0.150)***
Constant 4.677 45749 84.119 47.8 35.803 17.899
(0.338)*** (451.4)*** (0.661)*** (1.3)*** (0.229)*** (0.113)***
District-year F.Es Yes Yes Yes Yes Yes Yes
Number of obs. 582 194 582 194 578 582
R-squared 0.294 0.169 0.314 0.321 0.291 0.339
Notes: Total salary includes all salaries and wages paid to teaching, administrative, and general staff. Data on
teacher and staff expenditure are available for public schools in 2010 only. Robust standard errors clustered by
school reported in parentheses. *** p<0.01, ** p<0.05, * p<0.1
30
Figure 1: School districts and administrative districts in Seoul
Notes: Seoul has 25 administrative districts. The map shows the 11 official school districts (in colors). Source:
http://commons.wikimedia.org/wiki/File:Map_Seoul_districts_de.png
Figure 2: Distributions of Conditional Aggregate CSAT Scores
Notes: Conditional aggregate CSAT scores were residuals of the regression of aggregate CSAT scores against a
set of school district year fixed effects. There is no differential selection into CSAT participation across school
types. Kolmogorov-Smirnov test for equality of distribution functions rejects the null hypothesis that the two
distributions are the same at the 1% level of significance.
0
.00
1.0
02
.00
3.0
04
kd
en
sity o
f re
sid
ua
l C
SA
T s
co
res
-400 -200 0 200 400x
Private Public
31
Figure 3: Distributions of NAEA Test Scores
Note: Kernel density of NAEA Korean test scores conditional on
school district fixed effects.
Note: Kernel density of NAEA Math test scores conditional on school
district fixed effects.
Note: Kernel density of NAEA English test scores conditional on
school district fixed effects.
0
.00
5.0
1.0
15
kd
en
sity k
or_
res
-100 -50 0 50 100x
Private Public
0
.00
2.0
04
.00
6.0
08
.01
kd
en
sity m
at_
res
-100 -50 0 50 100x
Private Public
0
.00
2.0
04
.00
6.0
08
.01
kd
en
sity e
ng
_re
s
-100 -50 0 50 100x
Private Public