Embed Size (px)
Citation preview
Do International Students Crowd-Out orCross-Subsidize Americans in Higher Education?
Kevin ShihRensselaer Polytechnic Institute∗
December 30, 2016
Abstract
Recent growth in international enrollment at US universities has raised controversy.While critics accuse international students of displacing American students, universityadministrators have tried to justify increased foreign enrollments by arguing they pro-vide much needed tuition revenue. This paper examines how international studentsimpact domestic enrollment, focusing on a unique boom and bust in international ma-triculation into US graduate programs from 1995-2005. Overall foreign students appearto increase domestic enrollment. This positive effect is linked to cross-subsidization,whereby high net tuition payments from foreign students help subsidize additional do-mestic students. This positive effect is pronounced at public universities where foreignstudents face tuition rates that are 2-3 times higher than those for domestic students.
JEL Codes: F22, I21, I23, J11Keywords: International Students, Crowd-Out, Cross-Subsidize, GraduateEducation
∗Assistant Professor, Department of Economics. 110 8th Street, Troy, NY 12180. E-mail: [email protected]. I amthankful for helpful discussions with Giovanni Peri, Hilary Hoynes, Chad Sparber, Petra Moser, Brian Cadena, NormanMatloff, Yury Yatsynovich and seminar participants at UC Davis, Williams College, and Rensselaer PolytechnicInstitute. This research was supported by the National Bureau of Economic Research Predoctoral Fellowship. Specialthanks to Christine Farrugia and Dr. Rajika Bandhari of the Institute of International Education for providing accessto data.
1 IntroductionThe US has sustained an unprecedented influx of students from abroad. Interna-
tional enrollment in post-secondary education grew by 122% between 2005 and 2015.1
This rapid growth has sparked recent controversy. Critics have argued that interna-
tional students steal seats from Americans, and in some instances, these fears have led
to legislative proposals to cap the number of noncitizen students. In contrast, univer-
sity administrators have denied such accusations, arguing that international students
provide much needed tuition that helps subsidize the cost of domestic students.2
This paper examines how international students affect domestic matriculation in
graduate education. While recent debates have arisen as a reaction to inflows at
the undergraduate level, foreign students have long maintained a high presence in
graduate education. In many doctoral programs such as engineering, economics,
and even law, foreign-born students have outnumbered natives for several decades
(see figure 1). Currently, 15% of all graduate students, and 1-in-3 degree recipients
in Science, Technology, Engineering and Math (STEM) fields hail from overseas.
Importantly, graduate education’s long history with international students lends itself
to study.
Focusing on graduate education also addresses several related issues. Graduate
education produces skilled experts who research and innovate, thereby bolstering
economic growth. However, recent statistics indicate high attrition rates–only 50-
60% of Ph.D. students ever graduate (Sowell 2008)–and disinterest in STEM fields,
which pose a threat to the size of the innovative workforce. Changes to domestic
enrollment due to international student entry are especially relevant, as the interna-
tional student visa program–the main pathway for foreign students–is one of the few
immigration policies that has no cap. This contrasts with virtually all classes of work
visas, especially those for skilled immigrants, which have strict limits and thereby
create difficulty for international students to transition to the US workforce following
1See http://www.iie.org/Research-and-Publications/Open-Doors/Data/International-Students/New-International-Enrollment.
2Critics of international student entry recently created a legislative bill proposing limits on non-resident enrollment at the University of California System (http://www.latimes.com/politics/la-pol-sac-essential-politics-state-lawmakers-vote-for-10-c-1464807461-htmlstory.html). In contrast, oth-ers argue that hard limits on the number of international students intending to boost domes-tic enrollment could actually have the opposite effect if universities cannot make up for rev-enue shortfalls (http://www.businessinsider.com/foreign-students-pay-up-to-three-times-as-much-for-tuition-at-us-public-colleges-2016-9).
1
graduation. Therefore, if foreign students displace American students, immigration
policy creates the necessary conditions to magnify such distortions into the labor
market.3
Examining international students also informs debates over the impacts of inter-
national migration, which focus heavily on labor market consequences. In instances
when the education sector is considered, rhetoric often steer towards the impacts
of foreign students on native workers. For example, industry leaders argue that
less restrictive employment pathways for foreign students will solve skill shortages,
while skeptics counter that native workers would suffer. Curiously, however, few ask
whether there are impacts on the education of domestic students, even though educa-
tion is an important determinant of labor market success. Thus, without elucidating
the effects on higher education, our understanding of labor market impacts remains
incomplete. This paper contributes to research on the impacts of immigration by
exploring the consequences for higher education.4
Existing research on international students in graduate education have been im-
portant in documenting their long-held and sizable presence (Bound et al. 2009,
Freeman 2010). Furthermore, a small number of papers have provided initial empir-
ical evidence on whether international students displace domestic students (Borjas
2007, Regets 2007, Zhang 2009). Interestingly, while these studies have produced
quite conflicting findings, they are unified in how they conceptualize higher educa-
tion. In these studies, the impact of international students on domestic enrollment
depends on the number of seats available in graduate schools. This yields two pos-
sibilities: (1) if they are strictly limited, then increases in international students will
displace or crowd-out domestic students, and (2) if they are not, then increases in in-
ternational students will have no impact. Curiously, every existing study contains at
least one empirical estimate suggesting that international students actually increase
the enrollment of some domestic students, even though the intuition surrounding dis-
placement does not provide a scenario wherein international students can actually
raise domestic enrollment. Therefore, these positive findings are usually cited simply
as evidence against displacement.
Borjas (2007) uses panel data on university enrollments to correlate the numbers
3For example, Finn (2003) estimates that roughly one-third of foreign doctoral recipients leavethe US within two years from receiving their degree.
4See related studies by Hoxby (1998) or Hunt (2012), for example.
2
of foreign and domestic graduate students. Results from fixed effects regressions lead
the author to conclude that international students crowd-out white native males in
graduate programs, yet positive and significant effects for native asian and black
students are reported. Using a similar panel approach focused on STEM programs,
Regets (2007) interprets positive and significant effects for white natives in graduate
STEM programs as evidence against displacement. Zhang (2009) also uses panel
regressions to estimate significant positive correlations between the number of foreign
and native Ph.D. recipients in STEM. These results are interpreted as indicating that
“obviously, there is no crowding out” of native students.
This paper approaches the question of whether international students displace
natives with a different view of higher education, motivated by recent stylized facts
on international students and prior theoretical insight. Theoretical work has long
recognized that although universities as non-profit organizations must equate total
revenues and costs, individual activities or services within a university may not meet
this binding constraint (James 1978, Winston 1999). This often is deliberate, as
universities can satisfy important objectives that are not self-sustaining by offering
profit-generating services that may have little relevance to their mission.
Furthermore, while graduate students compete for seats as consumers, they also
serve as inputs to higher education (Rothschild & White 1995). Universities provide
substantial subsidies (e.g. scholarships or fellowships) to graduate students, often in
return for assistance in teaching or research. These subsidies may be so generous
that some graduate students may contribute zero tuition on net, or even receive a
positive subsidy. Therefore graduate programs, particularly those that are academic
rather than professional, are likely not self-sustaining and may heavily rely on other
profitable activities.
A set of stylized facts helps link this theory with international student entry. In
many US universities, international students face higher tuition prices than domestic
students. In particular, public universities price out-of-state tuition 2-3 times higher
on average than the rate for domestic in-state residents (figure 2). Though domestic
out-of-state residents also face higher tuition costs, many states allow them to claim
in-state residency after 1 year.5 Thus, the expected tuition revenue from domestic
students for the duration of graduate school may still be conceivably lower than what
5See http://www.finaid.org/otheraid/stateresidency.phtml for state-by-state residency rules.
3
international students contribute.
Further evidence indicates that most international students are not supported by
sizable subsidies from the university. Figure 3 illustrates that in 1995 only 34% of
foreign graduate students reported their primary source of funds as coming directly
from the university they attend, while 66% report outside sources–most of which come
from personal/family funds. Therefore, high tuition payments from international
students conceivably result in net revenue for universities.
Taken together, these ideas introduce a different conceptualization of the impact
of international students. While international students compete for seats and may
crowd-out domestic students, they also positively contribute to tuition revenue. If
international students do not sufficiently contribute to resources, it is likely that do-
mestic enrollment will fall in response to inflows from abroad. To the extent enrolling
international students is a profitable endeavor, universities can utilize excess revenue
to enroll additional domestic students–international students can cross-subsidize do-
mestic students.
This paper utilizes this intuition to guide the empirical analyses. In addition to
approaching this question from a different perspective, I develop novel instruments to
assuage endogeneity concerns that likely created the many inconsistent findings in the
prior studies described earlier. The setting for my analysis encompasses a dramatic
increase in international enrollment at US graduate programs during the late 1990s
which suddenly reversed following heightened scrutiny of student visa applications in
the aftermath of 9/11. Uniquely, this boom and bust provides distinct sources of vari-
ation, enabling separate examination of both increases and decreases in international
enrollment.
The empirical design relates changes to domestic graduate enrollment with for-
eign student inflows within US research universities over time. Different from prior
work, I utilize panel specifications that account not only for time-invariant university
characteristics correlated with the level of enrollments, but also for university-specific
features correlated with enrollment growth. I address further endogeneity concerns
by developing instruments from supply shocks that helped fuel the boom and bust cy-
cle. Crucially, these supply shocks were unrelated to other factors affecting graduate
education.
Specifically, rising populations of college-age (18-30 year old) individuals in foreign
4
nations created a growing supply of students that spilled overseas. The terrorist
attacks on 9/11 and subsequent discovery that several hijackers exploited student
visas led to more restrictive student visa processing, thereby reducing access to US
universities (GAO 2005; Freeman 2010). Apportioning these aggregate supply shocks
to universities according to their historical presence of foreign graduate students forms
instruments for actual inflows of international students during the boom and bust
period.
The findings reveal that international students actually raise domestic enrollment–
a 1 standard deviation increase in foreign enrollment raises domestic enrollment by
roughly 1/4th of a standard deviation. Results are nearly identical for the bust,
indicating symmetric responses to declines in international matriculation. Coefficients
are significant at the 5% level in preferred specifications, and standard confidence
intervals rule out 1-for-1 displacement. Thus, on average, inflows of international
students appear to increase, rather than decrease, domestic enrollment.
Guided by the theoretical intuition, I explore whether these positive findings can
be explained by cross-subsidization. First, I develop a simple model that formal-
izes the intuition on cross-subsidization. International students can expand domestic
enrollment if universities structure their tuition and costs such that international stu-
dents provide positive net tuition payments that help subsidize the cost of enrolling
more domestic students. Importantly, the model provides empirical tests to assess
whether cross-subsidization underlies the results. Results show heterogeneous effects
consistent with cross-subsidization. Those universities whose tuition and costs were
structured to allow for cross-subsidization exhibit the largest positive effects of inter-
national students on domestic enrollment. Additionally, effects are concentrated in
public universities, which generate high tuition revenue from international students,
but are absent at private universities that do not charge foreign students higher tuition
rates.
The next section describes the empirical strategy and data, providing a detailed
look at the boom and bust in further detail. Section 3 presents the main results, and
provides various robustness checks of the instrumental variable strategy. Section 4
examines whether the main results can be explained by cross-subsidization. Section
5 concludes.
5
2 Methodology & Data
Estimating the impact of international students on domestic enrollment is chal-
lenging as it requires separating exogenous inflows from abroad from demand shocks
that lead universities to expand in general. Focusing on a uniquely volatile decade
between 1995 and 2005 assists in abstracting from such confounding factors. The
ensuing discussion describes the boom and bust in international enrollment in greater
detail.
2.1 The Boom and Bust of 1995-2005
In the early 1990s, US universities faced great uncertainty over whether they would
remain leaders in attracting students worldwide.6 Unexpectedly, enrollment from
abroad surged after 1995, lifting the number of international students from 170,000
to over 250,000 by the turn of the millennium (figure 4). The 9/11 terrorist attacks
brought this growth to an abrupt halt, and foreign enrollment declined in the following
years. While the bust was much smaller than the late-90s boom, it marked the first
time in three decades and only the second occurrence since the 1950s where the
number of foreign students in the US fell (Chin 2005).
Importantly, two factors unrelated to US higher education helped fuel the boom
and bust cycle. Through the 1990s, many nations saw expansions in the number
of college-age individuals alongside improvements in their post-secondary education
systems (e.g., Rosenzweig 2006, Bound et al. 2009). These demographic changes in
college-age populations increased foreign enrollment in the US, as larger cohorts of
students spilled overseas (Bird & Turner 2014, Shih 2016). Importantly, demographic
changes abroad were highly unlikely to be driven by changes in US higher education.
The 9/11 attacks and subsequent discovery that several terrorists exploited stu-
dent visas to enter the U.S. created a sudden shock that limited foreign student entry.
Quickly enacted policies intensified the screening of student visa applications, gen-
erating lengthy wait-times (Wasem 2003; GAO 2005). Additionally, the mandatory
implementation of the Student Exchange and Visitors Information Service (SEVIS)–a
new digitized system to monitor foreign students–across colleges and universities in
6For example, a New York Times article in 1995 expressed concern that increased competitionfrom other nations would lower foreign enrollments in the US. See http://www.nytimes.com/1995/11/24/us/fewer-foreigners-are-choosing-us-colleges.html.
6
2003 was rife with glitches that led to further delays. Visa backlogs and SEVIS issues
were resolved by 2005, after which graduate enrollment from abroad continued its
upward climb (Alberts 2007, Freeman 2010).7
Interestingly, graduate programs at research universities sustained most of the
boom and bust. Figure 5 plots international enrollment from 1995-2005 by academic
level (graduate in the top row and undergraduate in the bottom row) and by Carnegie
Classification. Graduate enrollment at masters institutions, and undergraduate en-
rollment at all institutions also saw similar fluctuations, but on a far smaller scale.
Importantly, this episode created unprecedented variation best suited to identify the
effects of foreign students on domestic enrollment in graduate programs at research
universities.
A final observation about this episode is that while their numbers changed dra-
matically, the composition of foreign students remained stable. Figure 6 examines the
share of international students by country (panel A), and by field of study (panel B).
Importantly, the composition across fields of study was relatively unchanged, with
40-50% of all foreign graduate students in STEM disciplines throughout the boom
and bust. In addition, the boom and bust did not appear to be driven by any single
foreign country. The composition across countries remained stable, with 40-50% hail-
ing from Asia, and much smaller shares held by Europe, the Americas, the Middle
East and Africa.
The stable nature of the boom and bust contrasts markedly with recent inflows
that have been entirely driven by students from China. The consistency of observable
characteristics of international students during the boom and bust allows analysis of
changes in scale that are less contaminated by changes in other characteristics of
international students. The next section describes the empirical methodology to
estimate the impacts on domestic enrollment.
7Conceivably, the surge after 2005 could also be studied, however, the period is complicated bythe fact that undergraduate enrollment also began to surge. Additionally, the Great Recession in2008 caused unusual changes to both domestic student’s educational decisions and the endowmentrevenue of universities. Thus, limiting the scope to the 1995-2005 provides the advantage of focusingon cleaner variation in foreign graduate enrollments.
7
2.2 Empirical Specification
The impact of international graduate students on domestic graduate enrollment is
estimated using the following specification:
∆Dut = α + β∆Fut + γu + γt + εut (1)
I use year-on-year changes (∆Fut = Fut − Fut−1) to measure the influx of interna-
tional students at each university, u. The dependent variable is specified similarly
to capture changes in domestic enrollment. In 1, β measures the marginal impact of
an additional international student. If β > 0, each international student increases
domestic enrollment. If β < 0, then foreign students crowd-out domestic students.
β = 0 corresponds to no effect.
Notice that first-differencing enrollments effectively eliminates the influence of fixed
university characteristics correlated with the level of enrollments, such as university
quality. I further include additional university fixed effects (γu) to account for unob-
served university characteristics correlated with enrollment growth.8 Time-period
dummies (γt) account for changes in aggregate shocks that affect all universities
equally. Hence, the identifying variation in 1 relies on changes in changes of in-
ternational graduate enrollment within universities. Lastly, εut is a zero-mean error
term.
The analysis estimates 1 for the boom and bust periods, separately, to distinguish
the effects of increases and decreases in foreign students. The boom covers 1995-2001,
while the bust covers 2002-2005. While 1 controls for a wider array of potential factors,
unobserved factors that evolve within universities and are correlated with university
expansion remain a concern. Novel instruments developed from the aforementioned
supply shocks help mitigate these remaining issues.
2.3 IV Strategy
College-age population growth in countries around the world generated supply
spillovers of international students to US universities. Security measures after 9/11
8While this specification is more demanding than those used by prior studies, Peri & Sparber(2011) suggest dividing by lagged total enrollment to account for scale bias. However, doing sointroduces further endogeneity bias. Results using the preferred specification by Peri & Sparber(2011) are similar and available upon request.
8
restricted student visa issuance, which lowered international graduate enrollment.
Key to the identification is that these aggregate shocks were not endogenously related
to university-specific factors that affect their graduate program size.
These supply shocks are transformed into instruments by interacting them with the
historical presence of foreign graduate students at universities.9 Historical familiarity
with foreign students generates predictive power through strong networks (Beine,
Noel & Ragot 2014)–previous students return home and inform young compatriots of
their experience, building brand recognition. Future supply shocks disproportionately
affect institutions that possess strong networks.
Since such networks operate strongly among students from the same country, I
enhance predictive power by obtaining access to restricted-use data that provides
precise counts of graduate students at each university by country of origin. The
instruments are constructed by propagating supply shocks across universities with
varying intensity, based on each university’s historical stock of foreign graduate stu-
dents. Specifically,
Fut =
∑
c Fpopcut =
∑c Fcuh ∗ g
popct =
∑c Fcuh ∗
(popctpopch
)if t ≤ 2001
∑c F
9/11cut =
∑c Fcuh ∗ g
popc2001 ∗ g
9/11ct =
∑c F
popcu2001 ∗
(visact
visac2001
)if t ≥ 2002
(2)
For each university (u), historical foreign graduate enrollment from country c, Fcuh,
is multiplied by that country’s college-age population growth factor (gpopct = popctpopch
).
For the years during the bust period, aggregate reductions in student visa issuance
by country since 2001 (g9/11ct = visact
visac2001) are used instead. Summing across countries
yields a prediction of total international enrollment in a given year, Fut. Since equa-
tion 1 specifies international graduate enrollment in first-differences, the instruments
are formed by taking first-differences in predicted foreign graduate enrollment:
∆Fut = Fut − Fut−1 (3)
9This approach is often referred to as a “shift share” instrument, and has been popularly used invarious literatures (e.g. Card 2001, Peri et al. 2015).
9
2.4 Data for Instruments
Restricted-use data on historical international enrollment by country for each uni-
versity are obtained from the Institute of International Education (IIE). Specifically,
I utilize data from the International Student Census surveys which IIE conducts each
year and uses to publish its annual “Open Doors” reports. The earliest available
foreign enrollment counts come from Fall 1993, as data from prior years were lost.
To reduce dimensionality countries are collapsed into 17 nationality groups based
on ethnic/regional similarity. The top 10 countries that send international students to
the US (China, India, South Korea, Japan, Thailand, Indonesia, Germany, Canada,
Mexico, and Turkey) are each their own nationality group. The remaining countries
are aggregated into 7 nationality groups: Rest of Asia, Rest of Americas, Middle
East/North Africa, Eastern Europe, Western Europe, Africa, and Oceania.
College-age population counts are obtained from the UNESCO Institute of Statis-
tics. Data on student visa issuance by country comes from the Department of State
Non-Immigrant Visa Statistics. Because visas are issued while students are abroad
and before they arrive on campus, issuances measure intent to enroll and are a cleaner
measure of policy impacts than actual enrollment. For example, actual enrollment
would reflect students who were issued visas but decided not to enroll due to other
potentially endogenous factors. I utilize the primary class of students visas, the F-1
visa, though other classes exist, such as the J-visa for cultural exchange and M-visa
for border commuters.10
2.5 Data for Analysis
Data on domestic and foreign enrollment by university come from the Integrated
Postsecondary Education Data System (IPEDS). Enrollment counts report the num-
ber of degree-seeking students by academic level during the fall of each academic
year. IPEDS identifies international students via separate enrollment counts for “non-
residents”, defined as persons who are not US citizens or nationals and who are in
10Visa issuances represent flows rather than stocks, but the instrument relies on shocks to totalforeign enrollment. Therefore, I develop a stock measure of the total number of F-1 visas in eachyear by first aggregating visa issuances to the 17 nationality groups, and then cumulating F-1visas issued to each nationality over the prior 3 years. Thus, visact in 2 is computed as visact =visaict + visaict−1 + visaict−2 + visaict−3. The idea in this exercise is that visact approximates thetotal stock of student visa holders in year t, as students issued new student visas in years t−1, t−2,and t− 3 are likely still continuing their education in year t.
10
the country on a temporary visa and do not have the right to remain indefinitely.
IPEDS’ “resident” counts measure domestic enrollment, which include US citizens
and permanent residents.
The analysis centers on research universities, defined by the Carnegie Classifica-
tion.11 Constructing the main sample for analysis requires identifying research uni-
versities consistently available in the IPEDS 1995-2005 surveys, and in the IIE 1993
survey. The main sample excludes institutions reporting extreme outliers to mitigate
measurement error, resulting in a panel of 258 universities.12 Sensitivity tests are
performed by including universities with outliers, or further excluding universities
that have imputed records.
Table I displays summary statistics, measured in 1995, for non-research universities
(left panel), and the main sample of research universities (right panel). Comparisons
reveal research institutions were much larger than non-research schools on average,
both in terms of undergraduate and graduate enrollment. While nearly identical
in the percentage of international undergraduates, the average percentage of inter-
national graduate students at research universities (11%) was nearly double that of
non-research institutions (6%).
Additionally, research universities had a greater focus on graduate education,
awarding over 10 times the number professional, master’s, and Ph.D. degrees con-
ferred at non-research institutions. The main sample of research universities com-
prised the bulk of US graduate education, awarding 52% of all professional degrees,
58% of masters degrees, and 83% of Ph.D. degrees. They accounted for 73% of all
foreign graduate students and over half of all graduate students. The majority are
public (62%), span the 50 states, and include elite ivy-league schools, public flagship
universities and smaller private institutions.
11Revisions of this classification, which categorizes institutions based on the number of degreesawarded in a reference year, occur routinely. Thus, the analysis focuses on a time-consistent group ofinstitutions that are ever classified as a research institution in the 1994, 2000, 2005, or 2010 Carnegieclassifications.
12Outliers are institutions reporting changes in foreign enrollment outside the 1st-99th percentilein the sample. For example, a prominent public university in Colorado reported roughly 500 foreignstudents in 1998, 0 in 1999, and 600 in 2000.
11
2.6 First Stage Power
To examine first stage power, I regress actual changes in foreign graduate enroll-
ment on changes predicted by the instrument as follows:
∆Fut = α + βfs∆Fut + γu + γt + εut (4)
Specification 4 controls for university fixed effects and time-period dummies, as in 1.
Standard errors are clustered at the university level to account for within-university
correlation in residuals.
Results are presented in table II, for the boom and bust periods separately. Column
1 uses the main sample of 258 research universities. Column 2 uses all research
universities available in IPEDS, including those reporting extreme outliers. Column
3 uses the main sample but removes universities that ever had imputed records in
IPEDS surveys over the 1995-2005 decade. Column 4 further removes universities in
which the IIE data was imputed.13
Estimates indicate that the college-age population- and 9/11-based instruments
are strong predictors of foreign student growth during the boom and bust, respec-
tively. When using different samples across the columns, point estimates are virtually
unchanged. F-statistics are sufficiently large to avoid weak instrument bias (Staiger
& Stock 1997), except when including universities reporting extreme outliers (column
2). While coefficients barely change, measurement error from outliers causes precision
to fall sizably, creating potential weak instrument bias for the bust. To abstract from
weak instrument issues, estimates from the main sample will be preferred.
Coefficients center around 4 for the boom and 1.5 for the bust. These magnitudes
can be understood by visualizing the underlying data. Figure 7 plots actual changes
in international enrollment within universities against changes predicted by the in-
strument, after partialling out university fixed effects and time period dummies. The
regression line estimated in table II (solid line) and a 45 degree line (dashed line)
are also included. If actual foreign enrollment grew at exactly the rate of college-age
populations abroad, and fell at the same rate as student visa issuance, the regression
line and 45 degree line would coincide in both graphs. However, the regression line is
steeper, indicating that actual international enrollment, on average, grew faster within
13See appendix section A.1 for further description on imputations.
12
universities than they would have if college-age populations abroad and declines in
student visa issuance were the only contributing factors.
3 The Impact of International Students on Domes-
tic Enrollment
Results from two-stage least squares (2SLS) regressions of 1 are reported in table
III. First stage F-statistics are reprinted for reference. Column 1 uses the main sample,
column 2 includes outliers, column 3 removes institutions with imputed records in
IPEDS, and column 4 removes universities with imputations in IPEDS or IIE data.
Column 5 presents OLS results using the main sample. All specifications include
university fixed effects and time period dummies. Standard errors are clustered at
the university level.
The analysis reveals four key findings. First, point estimates are all positive,
indicating that foreign students actually increase domestic enrollment. The results are
significant at the 5% level when using the main sample, and are generally significant at
lower levels when including outliers or removing imputed data. Standard confidence
intervals rule out 1-for-1 displacement–the notion that each international student
takes a seat from a domestic student.
Second, increases and decreases in international enrollment appear to have sym-
metric effects–the size and direction of point estimates are nearly identical across both
periods. During the boom, inflows of international students raised domestic enroll-
ment. During the bust, declines in foreign students lowered domestic enrollment.
Third, the average effect size is around 0.80, indicating that an influx of 10 in-
ternational students leads to 8 additional domestic students. Importantly, domestic
enrollment is much larger and more variable than foreign enrollment, on average.
Thus, standardized coefficients are more useful to assess magnitudes–the estimates
indicate a 1 standard deviation rise in foreign enrollment increases domestic enroll-
ment by roughly 1/4th of a standard deviation.14
A real example helps to make the magnitudes more concrete. Consider a public
14In the data, a standard deviation in the change of international amounts to approximately 87students. A standard deviation in the change in domestic students is approximately 291 students.Using the coefficient of 0.80 from the main specification for the boom (column 1 row 1) of table III,we can calculate the standardized coefficient as: 0.80 · 87
291 = .24.
13
university situated at the median among research universities in terms of total and
foreign graduate enrollment in 1995. Over the boom, foreign graduate enrollment
grew from 258 to 400 students, a net increase of 142 students. Domestic graduate
enrollment also expanded by 413 students, from 3,228 in 1995 to 3,641 in 2001. While
domestic enrollment rose by an average of 70 students each year, the estimates indicate
that only 19 (β·∆F6yrs
= (142)·(0.80)6
≈ 19) of these additional domestic graduate students
were attributable to the increase in foreign students.
Finally, column 5 presents OLS estimates corresponding to the main specification
in column 1. Notice OLS estimates–0.21 for the boom and 0.41 for the bust–are
also positive, but smaller in magnitude than their 2SLS counterparts. This is likely
due to two factors. First, the instruments help reduce attenuation bias from remain-
ing measurement error–removing extreme outliers may not cleanse the data from all
measurement error. Second, university administrators have admitted that shocks
to revenue or demand often lead them to recruit more foreign students to make up
for declining domestic enrollment.15 2SLS estimates may be larger than OLS if the
instruments mitigate negative downward bias caused by such endogenous shocks.
3.1 Robustness Checks
Section 2.6 demonstrated the instruments have strong first stage power. This
alone, however, is insufficient for the instruments to provide causal inference. Im-
portantly, they must also remain immune to exclusion restriction violations. The
instruments must embody supply shocks that only affect actual international enroll-
ment, remaining unrelated to any other determinants of domestic enrollment. Recall
that the instruments are derived from the interaction of two variables–historical for-
eign graduate enrollment by university and nationality, and aggregate supply shocks
by nationality. Therefore, each piece must be unrelated to other factors that also
affect domestic enrollment. As there is only one instrument for actual changes in do-
mestic enrollment, the regression model is just-identified, and hence it is not possible
to directly test the exclusion restriction. Nevertheless, several checks help rule out
issues of first-order concern.
A first concern is in the use of historical foreign enrollment from 1993. Although it
15For example, see http://www.wsj.com/articles/international-students-stream-into-u-s-colleges-1427248801. This has also been substantiated by a recent working paper by Bound et al. (2016),which finds negative funding shocks lead universities to increase international student enrollment.
14
is the earliest available survey with international graduate student enrollment counts
by country of origin from the IIE, its proximity to the period under study raises
particular issues. For example, institutions with high foreign graduate enrollment in
1993, may have also been looking to expand. Thus, historical features of universities
in 1993 may persist and endogenously influence actual changes in enrollment during
the boom and bust period.
The empirical specification 1 is suited to address much of these concerns. Using
first-differences, instead of levels, removes time-invariant university-specific factors
that might be correlated with foreign enrollment levels in 1993, such as the desire to
grow graduate programs. The inclusion of additional university fixed effects also elim-
inates the influence of university-specific features associated with enrollment growth.
This forces the key identifying variation to come from changes in changes within uni-
versities over time, abstracting from historical features that have constant effects on
future growth in university characteristics, such as enrollment or quality.
Importantly, the instruments will lead to biased estimates if factors in 1993 are
correlated with future changes in university features that do not evolve linearly. A
classic solution to break this persistent endogeneity is to use very long lags. In doing
so, researchers face a trade-off between instrument power and bias. Because the
instruments derive power from persistent information networks between former and
prospective students from the same country, using longer lags will reduce this power.
To the extent bias from persistent factors is large, point estimates should change
noticeably when using longer lags.
While the IIE does not have data available prior to 1993, IPEDs surveys are
available as far back as 1980. However, IPEDS surveys only measure total foreign
graduate enrollment by university, providing no information on countries of origin.
Nonetheless, the IPEDS 1980 data is used to construct an alternative instrument
that interacts foreign graduate enrollment in 1980 with the supply shocks–college
age population growth, and declines in student visa issuance– measured in terms of
their growth factor from 1980 to the years in the sample. Because there is no country
variation, total worldwide (net of the US) college population growth and total declines
in student visa issuance are used. Yearly changes in these predictions from 1980 data
are then taken to form the instrument.
15
Row 3 of table IV performs this check using the main sample.16 Results for the
boom are reported in column 1 and for the bust in column 2. First stage F-statistics
appear in the adjoining columns. Importantly, the point estimates are virtually un-
changed from the main results, reported in the bottom row for reference. Confounding
endogenous factors in 1980 are unlikely to have persistent impacts on graduate enroll-
ments in the mid-90s and 2000s. However, notice that the power of the instruments
falls sizably. During the bust the instrument becomes at risk for weak instrument bias.
Since later analysis examines smaller samples, and stratifies on particular university
characteristics, it is crucial to utilize the primary instruments using 1993 graduate
enrollments by country and university to ensure sufficient power.
Two additional checks can further assuage concerns regarding the persistence of
historical endogenous factors. Persistent university characteristics, such as the de-
sire to expand or historical prestige, will be observed in future growth in enrollment
overall. The instrument is specifically designed to only predict foreign graduate en-
rollment. Correlation between the instrument and foreign or domestic undergraduate
enrollment would signal potential lingering persistent factors. This can be empir-
ically checked by regressing domestic or foreign undergraduate enrollment on the
instrument.
Examining the correlation between the instrument and undergraduate enrollments
also provides a check on a second concern regarding the instruments. The second part
of the instrument–the supply shocks–may also introduce issues if they are endoge-
nously related to growth in domestic graduate enrollment within universities. For
example, college age population growth or post-9/11 visa tightening may have gen-
erated supply shocks to universities in both graduate and undergraduate enrollment
from abroad. Undergraduate enrollment fluctuations, in turn, endogenously alter the
number of graduate students, as universities may require more teaching assistants or
graders for undergraduate courses. Assessing whether the instrument correlates with
undergraduate enrollments also clarifies whether the supply shocks correlate with
confounding changes in undergraduate populations within universities.
Rows 1 and 2 of table IV perform these checks by replacing the dependent vari-
able in 4 with the change in foreign or domestic undergraduate enrollment (∆Xugut =
16Results from specifications using the sample without imputed data are virtually unchanged andare available upon request.
16
XUGut −XUG
ut−1, where X = D,F ). The results show no significant correlation between
the instruments and undergraduate enrollment. Thus, it appears unlikely that for-
eign graduate enrollment in 1993 or the supply shocks were endogenously related to
domestic graduate enrollment through changes in the undergraduate population.
Finally, to reassure that the main findings are not contaminated by endogenous
changes in foreign undergraduate enrollment, row 4 performs the 2SLS regressions,
incorporating a control for undergraduate enrollment. Including actual changes would
risk introducing further endogeneity. Instead, an exogenous control variable is con-
structed by interacting foreign undergraduate enrollment in 1993 with the supply
shocks.17 Although first stage power is weakened due to the incorporation of an
exogenous control that is highly similar to the instrument, the findings do not sub-
stantially differ from the main results. Reassuringly, the point estimates still fall
within the range of those reported from table III.
The period under analysis raises several additional first-order concerns regarding
the supply shocks used to generate the instrument. During the boom and bust in for-
eign graduate enrollment, the US also sustained a dramatic spike and fall in the stock
prices of internet-based firm known as the “Dot-Com” boom and bust (figure 8A),
rapid increases in federal funding to higher education (figure 8B), and an expansion
and subsequent contraction in H-1B visa limits for foreign skilled workers (figure 8C).
These other factors exhibit fluctuations that similarly align with the boom and bust
in foreign graduate enrollment, and are particularly worrisome if the instruments are
unable to abstract from their influence.
Separately accounting for each of these phenomena in rows 5-7 of table IV helps
examine the sensitivity of the instruments.18 To account for the Dot-Com boom and
bust, I draw on prior literature which has shown stock market fluctuations impact
universities by altering endowments (Kantor & Whalley 2014, Brown et al. 2014).
Therefore, interacting historical university endowment per student values, measured
in 1993, with growth in the Nasdaq Composite Index helps capture effects of the
Dot-Com boom and bust on universities. The change in predicted endowment per
17This procedure is almost identical to the construction of the instrument, with the exception thatthe count of foreign undergraduates by university and nationality from the 1993 IIE survey is usedin the interaction.
18Detailed descriptions of these control variables and their data sources are provided in sectionA.2 of the appendix.
17
student values is included as a control in 2SLS regressions in row 5.
The dramatic growth in federal research funding through the turn of the millen-
nium likely increased both foreign and domestic enrollment. To account for this we
interact historical levels of university research funding per student, measured in 1993,
with aggregate growth in federal R&D outlays to universities. Changes in predicted
research funds per student are incorporated as controls in 2SLS regressions in row 6.
Finally, H-1B policy may alter labor market returns for highly educated workers
(Peri et al. 2015), which in turn may influence the schooling decisions of domestic
students. As indicated by Kato & Sparber (2013) and Shih (2016), H-1B policy
can directly affect higher education by altering foreign student entry. To capture
the influence of H-1B changes on universities, I interact historical foreign graduate
enrollment by nationality with nationality-specific growth in H-1B visa issuances.
Summing these interactions across nationalities and then taking first-differences yields
a control variable that helps accounts for the influence of H-1B policy. This is included
in 2SLS regressions in row 7.
Importantly, the central findings remain robust when incorporating these controls.
Point estimates remain positive and are close in value to the main findings–coefficients
range from 0.59-1.74. Further, they are nearly always statistically significant at the
10% level. Thus, other phenomena during the boom and bust period do not appear
to contaminate the estimates.
Table V provides some final robustness checks. Row 1 ensures that the results
are not driven by endogenous changes within a few large universities. Specifically,
I remove the 8 universities that are consistently ranked in the top 10 in terms of
international graduate enrollment in each year from 1995-2005. Rows 2-5 check if
the results simply reflect the performance of universities that host large numbers of
students from particular nations. For example, aggregate declines in student visas
issued to Indians could simply reflect declining quality among universities that host
large numbers of Indian students. Row 2 utilizes a similar instrument that eliminates
the nationality dimension, simply interacting total foreign graduate enrollment in
1993 with growth in the world’s college-age population and total 9/11-induced declines
in student visas. Rows 3 and 4 reconstruct the instruments, excluding the two largest
foreign student groups–India and China, respectively. Finally, row 5 reconstructs
the instruments, removing students from predominantly Muslim nations to examine
18
whether the post-9/11 declines were driven by the heightened attention toward this
group.
The results from table V provide a consistent message. International students
expand domestic enrollment at the graduate level. The instruments are useful in
mitigating endogeneity bias and stand-up to various exclusion restriction violations.
Overall, these checks have shown that the instruments do not appear to be endoge-
nously correlated with changes in undergraduate enrollments within universities. Fur-
thermore, they are not confounded by simultaneous aggregate shocks that also had a
boom and bust pattern in the US.
4 Mechanisms
How do international students expand domestic enrollment? As discussed ear-
lier, cross-subsidization is one such mechanism that has both intuitive appeal and
anecdotal support. High net tuition revenue from international students can be used
to offset the costs of enrolling another domestic student. A direct way to test for
cross-subsidization would be to show that international students do contribute pos-
itively to resources via their tuition payments, and that domestic students receive
higher subsidies as a result. However, universities do not publicly report net tuition
revenues, subsidies (e.g. institutional aid, fellowships, grants, etc.) separately for
international and domestic students. Thus, identifying cross-subsidization requires
alternative methods.
First, though the required data from research universities during the boom and
bust periods are not available, the National Postsecondary Student Aid Survey (NPSAS)
provides relevant information on tuition payments and subsidies received from a ran-
dom sample of graduate students. While NPSAS student sample sizes and coverage
of research universities are too small to be useful for more rigorous analysis, some de-
scriptive evidence is enlightening. We assess information on the sample of US citizens
at research universities from the 1996, 2000, and 2004 NPSAS surveys–years that
roughly align with the beginning, mid-point, and end of the boom and bust cycle.
Figure 9 displays average net tuition, total institutional aid (which includes grants,
scholarships, fellowships, tuition waivers, loans or other support from the university),
and total grant aid of US citizen students in the NPSAS sample. In particular, the
averages are calculated using US citizens enrolled in graduate programs at research
19
universities in each of the NPSAS survey years 1996, 2000, and 2004. The 95%
confidence intervals are provided for reference.
The top figure shows that average net tuition payments of US citizens in graduate
school actually fell by roughly $1, 000, from an average of $6, 618 in 1996 to $4, 596
by 2000. This coincides directly with the boom in international enrollment, and is
consistent with the idea that universities used additional foreign tuition to subsidize
the enrollment of more domestic students. Increases in net tuition payments of US
citizens from 2000-2004 are consistent with the idea that as international enrollment
shrank during the bust, so did the extra revenue from foreign students.
The bottom figures show that the decline in net tuition payments were due to
changes in actual subsidies given to students–what would be expected with cross-
subsidization–rather than lowering tuition rates. Average total institutional aid and
grant aid (e.g. fellowships, teaching assistant and research assistant positions, etc.)
for citizens grew during this period. By 2004, the average institutional aid to citizens
declined slightly, as international enrollment decreased.
The evidence presented thus far has been descriptive. Without detailed data on
net tuition and aid separated for domestic and international students, direct tests of
cross-subsidization are not feasible. Thus, I draw on theory, which helps provide a
structure for different empirical tests of cross-subsidization. In what follows I present
a basic sketch and relegate the details to the section A.3 in the appendix.
Consider a non-profit university that aims to educate students and provide high
quality education, described by an objective function,
U(D,F, q)
D and F denote domestic and foreign graduate enrollment, respectively, and q denotes
quality. Universities benefit from higher quality and educating domestic students, so
that Uq, UD > 0.19 We make no assumptions on preferences for foreign students,
so that UF R 0. The aim is to maximize their objectives subject to a non-profit
19This is a reasonable assumption given that universities receive substantial funding from thegovernment. Thus, to a certain extent their goals will reflect the domestic taxpayer’s preferences.
20
constraint, whereby total revenues must equate total costs:
FC + c(q)D + c(q)F − tDD − tFF − FR = 0
Tuition rates for domestic and international students are tD and tF , respectively,
and are considered to be exogenous. Other non-variable (fixed) revenue (FR) comes
from government support and endowment payouts. Expenses include fixed costs
(FC), such as building operation costs, and variable costs represented by the per
unit student cost of education, c(q), where c′(q) > 0. This includes expenditures
related to instruction, and subsidies given to students in the form of grants and other
aid.
Solving the university’s optimization problem, detailed in the appendix, yields the
following relationship for how domestic enrollment would change given one additional
international student:∂D
∂F=tF − c(q)
c(q) − tD(5)
Equation 5 provides a simple formalization of cross-subsidization. The numerator
in 5 represents the net tuition revenue received from an international student (i.e.
tuition less subsidies and other costs). If foreign student tuition exceeds their marginal
cost (tF > c(q)), the numerator is positive. The denominator represents the net
subsidy given to a domestic student, which is positive when marginal costs exceed
the domestic tuition rate. For simplicity, I refer to the ratio in 5 as relative net tuition.
Relative net tuition has an intuitive interpretation: it indicates how many addi-
tional domestic students the university could enroll with one additional international
student. For example, consider a university where net tuition per international stu-
dent is $1000 and the net subsidy per domestic student is $ 500. Equation 5 indicates
that one additional foreign student would provide enough net tuition to enroll two
additional domestic students ($1,000$500
= 2). Hence, at this hypothetical university,
domestic enrollment would rise by 2 with each additional international student.
This framework provides the insight for a first test for cross-subsidization. Recall
figure 2 showed that sticker price tuition rates do not differ for domestic and foreign
students at private universities. In contrast, foreign tuition rates are nearly 2-3 times
higher, on average at public universities. Therefore, equation 5 predicts that inter-
national students should crowd-out domestic students at private universities, as the
21
numerator will equal the inverse of the denominator. At public universities, inter-
national students may increase domestic enrollment if foreign tuition payments are
significantly greater than costs. I assess this empirically by replicating the analysis
separately for private and public universities.
Figure 10 shows the results when running regressions of specification 1, separately
for public and private universities, with full details in table VI. The point estimates
and 90% confidence intervals presented use the preferred sample that excludes out-
liers. The findings support the general intuition from the model. The positive effects
found earlier appear to be concentrated among public universities. The point es-
timates for private universities are actually negative, indicating that international
students might displace domestic students. However, the coefficients are not statisti-
cally different from zero. These results support the idea that international students
at public universities pay high net tuition that helps subsidize the cost of enrolling
additional domestic students. Private universities that do not price discriminate may
see displacement of domestic students following inflows from abroad.
A more complete test for cross-subsidization using the model’s insights can be
performed by actually calculating measures of relative net tuition at each university
and interacting these with the inflow of international students in regressions. If cross-
subsidization indeed drives the results, there should be a larger positive impact on
domestic enrollment for universities with high relative net tuition–these universities
have structured tuition and costs in such a way as to allow for the greatest amount
of cross-subsidization.
IPEDS provides in-state and out-of-state tuition rates at each university, which
are used for tD and tF , respectively. If domestic out-of-state students only face tF ,
the model indicates international students can only increase enrollment of domestic
in-state students through cross-subsidization. Furthermore, the model then also sug-
gests that exogenous increases in domestic out-of-state students would also increase
domestic in-state enrollment.
Unfortunately, existing data does not provide graduate enrollment counts by state
residency to test for such differences. However, at some public universities that pub-
licly provide such figures, most graduate students hail from in-state.20 Additionally,
20For example, the University of California system reports that among all campuses, out-of-state domestic students only account for roughly 8% of graduate enrollment (see https://www.universityofcalifornia.edu/infocenter/fall-enrollment-glance). At the State University of New York
22
many state laws allow out-of-state domestic students to claim in-state residency after
1-year. Thus, if we consider tD to be roughly similar to expected tuition rates they
face over the duration of graduate school, the model would then suggest that foreign
students can still lead to increases in both domestic in- and out-of-state students.
While tuition prices are accurately tracked, measures of graduate student costs
c(q) are not available. Therefore, I construct a proxy for c(q) by calculating average
variable costs, which include expenses that vary with enrollment, like grant and fel-
lowship aid, and instructional costs. Since available data does not differentiate costs
for undergraduate and graduate students, I calculate average variable costs over all
students at each university using data from the Delta Cost Project (Lenihan 2012).
For each university I construct a single, time-invariant measure of relative net
tuition. First, I calculate relative net tuition for each university in every year from
1990-1994, and then take a simple average over the 1990-1994 period to derive a
single measure for each university. Importantly, this measure is calculated prior to
the period under analysis and therefore is not affected by the subsequent boom and
bust. This relative net tuition measure indicates which universities were most primed
to engage in cross-subsidization during the boom and bust cycle.
The empirical test interacts the measure of relative net tuition with the change in
international students at each university. In particular, I implement a fully-interacted
regression model of the form:
∆Dut = α + β1∆Fut + β2(∆Fut)(RNTu)
+ γu + γu(RNTu) + γt + γt(RNTu) + εut(6)
As the minimum value of relative net tuition in the sample is -1, we add 1 to the
relative net tuition measure allowing β1 to reflect the effects for those universities
that have relative net tuition equal to -1, and β1 + β3RNTu to reflect the differential
additional effect for universities with relative net tuition greater than -1. Note that
the main effect for relative net tuition (RNTu) is absorbed by the fixed effect γu.
Importantly, the interaction (∆Fut)(RNTu) is an additional endogenous variable, and
therefore is instrumented with (∆Fut)(RNTu)–the interaction of the main instrument
with the relative net tuition measure.
campuses, only 6% of students are from out-of-state (see http://www.suny.edu/media/suny/content-assets/documents/FastFacts2016.pdf).
23
Figure 11 displays the point estimates from this exercise, while table VII provides
the full results. The vertical axis measures the marginal effect (i.e. the combined
effect β1 + β3RNTu), while the horizontal axis measures relative net tuition. The
marginal effects are plotted for the ventiles of relative net tuition (i.e. the relative net
tuition measures at the 5th, 10th, 15th,..., 90th, and 95th percentiles). Importantly,
the 0-40th percentile values are all equal to -1. Hence, the point at relative net tuition
value equal to -1 represents the 0-40th percentiles, while the second point represents
the 45th percentile, third point represents the 50th percentile, and so forth.
The results support the model’s intuition regarding cross-subsidization. The posi-
tive impact of international students on domestic enrollment increases in the univer-
sity’s relative net tuition. Universities that receive extremely high levels of foreign
student tuition, relative to their cost are able to use those resources to provide subsi-
dies to enroll more domestic students. Importantly, the pattern is evident in both the
boom and bust periods, although weak instruments during the bust tend to inflate
point estimates.
While the evidence has indicated that cross-subsidization is a key mechanism un-
derlying the central findings, it should only be recognized as a partial equilibrium
analysis that highlights university behavior. A different explanation might be that in-
ternational students actually change domestic student demand. For example, domes-
tic students may have preferences for or against studying with international students.
Alternatively, international student competition may alter the returns to education.
Thus, while the available data are not suited to explore this mechanism, we do not
rule out that domestic demand may itself depend on foreign student peers.
4.1 Extensions
While the empirical analysis has shown that international students can increase
domestic enrollment, the type or quality of these additional domestic students remains
unclear. Importantly, the exact form in which cross-subsidization manifests matters
greatly for understanding more about the domestic students most likely to benefit
from international students. For example, the reallocation of foreign tuition revenue
may be unequal across fields of study. If universities prioritize education in STEM
disciplines, increases in foreign students may have little effect on domestic enrollment
in the Humanities. Differently, some universities may allocate foreign tuition towards
24
academic scholarships for domestic students. In this case, the increase in domestic
enrollment would likely be accompanied by increases in domestic student quality.
While lack of data restricts the ability to explore this in great detail, one interesting
margin of adjustment can be examined. In particular, foreign tuition may be reallo-
cated quite differently towards academic and professional programs.21 If universities
prioritize academic graduate education, growth in international students would result
in little change in domestic enrollment in professional programs. Furthermore, profes-
sional programs tend to charge very high tuition with few subsidies to students, and
often are a key source of revenue for universities. In this sense, international students
would not need to cross-subsidize professional programs if they are self-sustaining.
In this case, the positive impacts should be concentrated on domestic enrollment in
academic programs.
The top panel in table VIII shows results when examining changes in domestic
graduate enrollment in academic programs as the dependent variable. The bottom
panel shows results when the outcome is changes in domestic enrollment in profes-
sional programs. The results reveal that the positive impacts are concentrated in
academic programs, with little impact on enrollment in professional programs. Thus,
on average it appears that universities do prioritize academic programs and utilize
net foreign tuition to expand the number of domestic students pursuing academic
degrees.
5 Conclusion
For decades, international students have maintained a large and growing presence
in US higher education. However, the effects of this internationalization are poorly
understood, and in particular, the consequences for domestic students remain un-
clear. This paper provides insight into these issues by assessing the impact of foreign
students on domestic enrollment in graduate education.
An unusual boom and bust cycle in foreign graduate enrollment over the 1995-2005
decade, driven in part by exogenous supply shocks, provide a means to empirical iden-
tification. Interacting historical foreign graduate enrollment in 1993 with these supply
shocks–growth in the college-age population in sending countries during the boom,
21Professional degree programs include those that require a professional license to practice, suchas Law, Medicine and Physical Therapy.
25
and declines in student visa issuance after 9/11 during the bust–forms instruments
to estimate causal effects.
The analysis reveals that increases in foreign students expand domestic enrollment.
Decreases in foreign enrollment have symmetric effects. Point estimates indicate that
a one standard deviation rise in international enrollment increases domestic enroll-
ment by roughly 1/4th of a standard deviation. Preferred estimates are statistically
significant at 5% levels.
A simple model of university behavior reveals that foreign students can expand
domestic enrollment if they pay high net tuition relative to domestic students (relative
net tuition). Empirical tests of the model’s insights reveal that cross-subsidization
indeed appears to be an underlying mechanism–the estimated effects of international
students on domestic enrollment increase with a university’s relative net tuition.
Understanding how cohort size affects educational achievement has been a subject
of great importance. Students that are part of larger cohorts are likely to experience
crowd-out and lower attainment as fixed resources are diluted among a larger popu-
lace. This paper shows that expansions due to international student entry are distinct
from general demographic expansions, because of the manner in which universities
differentially structure net tuition for domestic and foreign students.
These results also contribute to research showing positive contributions of foreign
graduate students to innovation (Chellaraj et al. 2008, Black & Stephan 2010, Stuen,
Mobarak, & Maskus 2012). Given that international students do not appear to dis-
place domestic students from graduate education, their benefit to innovation may
come at little cost. Additionally, in the face of declining revenue, administrators may
turn to foreign students to bolster resources for additional domestic enrollment.
Importantly, this research has focused exclusively on quantities. Understanding
foreign student quality and its consequences for domestic peers is equally crucial. The
selection and quality of foreign students (Gaule & Piacentini 2013) has important
implications for how social interactions ultimately affect domestic peers. Continued
research on the role of international students will help inform policy and expand our
understanding of globalization in higher education.
26
References[1] Alberts, Heike C., “Beyond the Headlines: Changing patterns in international student en-
rollment in the United States,” Geo Journal, 68.2-3 (2007), 141-153.
[2] Beine, Michel, Romain Noel, and Lionel Ragot, “Determinants of the International Mobilityof Students,” Economics of Education Review, 41 (2014), 40-54.
[3] Bird, Kelli, and Sarah Turner. “College in the States: Foreign student demand and highereducation supply in the US,” Working paper, (2014), EdPolicy Works.
[4] Black, Grant C., and Paula E. Stephan, “The Economics of University Science and theRole of Foreign Graduate Students and Postdoctoral Scholars,” American Universities in aGlobal Market, (2010), 129-161.
[5] Borjas, George J., “Do Foreign Students Crowd Out Native Students from Graduate Pro-grams?,” Science and the University, (2007), 134-149.
[6] Bound, John, Sarah Turner, and Patrick Walsh, “Internationalization of US DoctorateEducation,” Science and Engineering Careers in the United States, (2009).
[7] Bound, John, Breno Braga, Gaurav Khanna, and Sarah Turner, “A Passage to America:University Funding and International Students,” NBER Working Paper No. 22981, (2016).
[8] Brown, Jeffrey R., Stephen G. Dimmock, Jun-Koo Kang, and Scott J. Weisbenner, “HowUniversity Endowments Respond to Financial Market Shocks: Evidence and implications,”American Economic Review, 104.3 (2014), 931-962.
[9] Card, David, “Immigrant Inflows, Native Outflows, and the Local Labor Market Impactsof Higher Immigration,” Journal of Labor Economics, 19.1 (2001), 22-64.
[10] Chellaraj, Gnanaraj, Keith E. Maskus, and Aaditya Mattoo, “The Contribution of Inter-national Graduate Students to US Innovation,” Review of International Economics, 16.3(2008), 444-462.
[11] Chin, Hey-Kyung Koh, “Open Doors 2004: Report on international educational exchange,”IIE Books, Institute of International Education, (2005).
[12] Davis, Todd M., “Open Doors 1995-1996: Report on international educational exchange,”IIE Books, Institute of International Education, (1996).
[13] Finn, Michael G., “Stay Rates of Foreign Doctorate Recipients from US Universities, 2001,”Oak Ridge Institute for Science and Education, (2003).
[14] Freeman, Richard B., “What Does Global Expansion of Higher Education Mean for theUnited States?,” American Universities in a Global Market, (2010), 373-404.
[15] GAO, “Streamlined Visas Mantis Program Has Lowered Burden on Foreign Science Stu-dents and Scholars, but Further Refinements Needed,” Border Security Report to Congres-sional Requesters, Government Accountability Office, (2005).
27
[16] Gaule, Patrick, and Mario Piacentini., “Chinese Graduate Students and US ScientificProductivity,” Review of Economics and Statistics, 95.2 (2013), 698-701.
[17] Hoxby, Caroline M., “Do Immigrants Crowd Disadvantaged American Natives Out ofHigher Education?”, Help or Hindrance?: The Economic Implications of Immigration forAfricans Americans, (1998), 282-321.
[18] Hunt, Jennifer, “The Impact of Immigration on the Educational Attainment of Natives”,NBER Working Paper No. w18047, 2012.
[19] James, Estelle, “Product Mix and Cost Disaggregation: A reinterpretation of the economicsof higher education,” Journal of Human Resources, 13.2 (1978), 157-186.
[20] Kantor, Shawn and Alexander Whalley, “Knowledge Spillovers from Research Universities:Evidence from endowment value shocks,” Review of Economics and Statistics, 96.1 (2014),171-188.
[21] Kato, Takao, and Chad Sparber, “Quotas and Quality: The effect of H-1B visa restrictionson the pool of prospective undergraduate students from abroad,” Review of Economics andStatistics, 95.1 (2013), 109-126.
[22] Lenihan, Colleen, “IPEDS Analytics: Delta Cost Project Database 1987-2010,” NCES2012-823, U.S. Department of Education, Washington, DC: National Center for EducationStatistics, (2012). Retrieved from http://nces.ed.gov/pubsearch.
[23] Peri, Giovanni, and Chad Sparber, “Assessing Inherent Model Bias: An application to do-mestic displacement in response to immigration,” Journal of Urban Economics, 69.1 (2011),82-91.
[24] Peri, Giovanni, Kevin Shih, and Chad Sparber. “STEM workers, H-1B visas, and produc-tivity in US cities,” Journal of Labor Economics 33, no. S1 Part 2 (2015): S225-S255.
[25] Regets, Mark C., “Research Issues in the International Migration of Highly Skilled Workers:A perspective with data from the United States,” National Science Foundation, (2007).
[26] Rosenzweig, Mark R. (2006). “Global Wage Differences and International Student Flows,”In Brookings Trade Forum (pp. 57-96). Brookings Institution Press.
[27] Rothschild, Michael, and Lawrence J. White, “The Analytics of the Pricing of HigherEducation and Other Services in which the Customers are Inputs,” Journal of PoliticalEconomy, 103.3 (1995), 573-586.
[28] Shih, Kevin, “Labor Market Openness, H1B Visa Policy, and the Scale of InternationalStudent Enrollment in the United States,” Economic Inquiry, 54.1 (2016), 121-138.
[29] Sowell, Robert, “PhD Completion and Attrition: Analysis of baseline data,” Washington,DC: Council of Graduate Schools. NSF Workshop Presentation, A Fresh Look at Education,(2008).
[30] Staiger, Douglas O., and James H. Stock, “Instrumental Variables Regression with WeakInstruments,” Econometrica, 65.3 (1997), 557-586.
28
[31] Stuen, Eric T., Ahmed Mushfiq Mobarak, and Keith E. Maskus, “Skilled Immigrationand Innovation: Evidence from enrolment fluctuations in US doctoral programmes,” TheEconomic Journal, 122.565 (2012), 1143-1176.
[32] Wasem, Ruth E., “Foreign Students in the United States: Policies and legislation,” Con-gressional Research Service, Library of Congress, (2003).
[33] Winston, Gordon C., “Subsidies, Hierarchy and Peers: The awkward economics of highereducation,” The Journal of Economic Perspectives, 13.1 (1999), 13-36.
[34] Zhang, Liang, “Do Foreign Doctorate Recipients Displace US Doctorate Recipients at USUniversities?,” Doctoral Education and the Faculty of the Future, (2009).
29
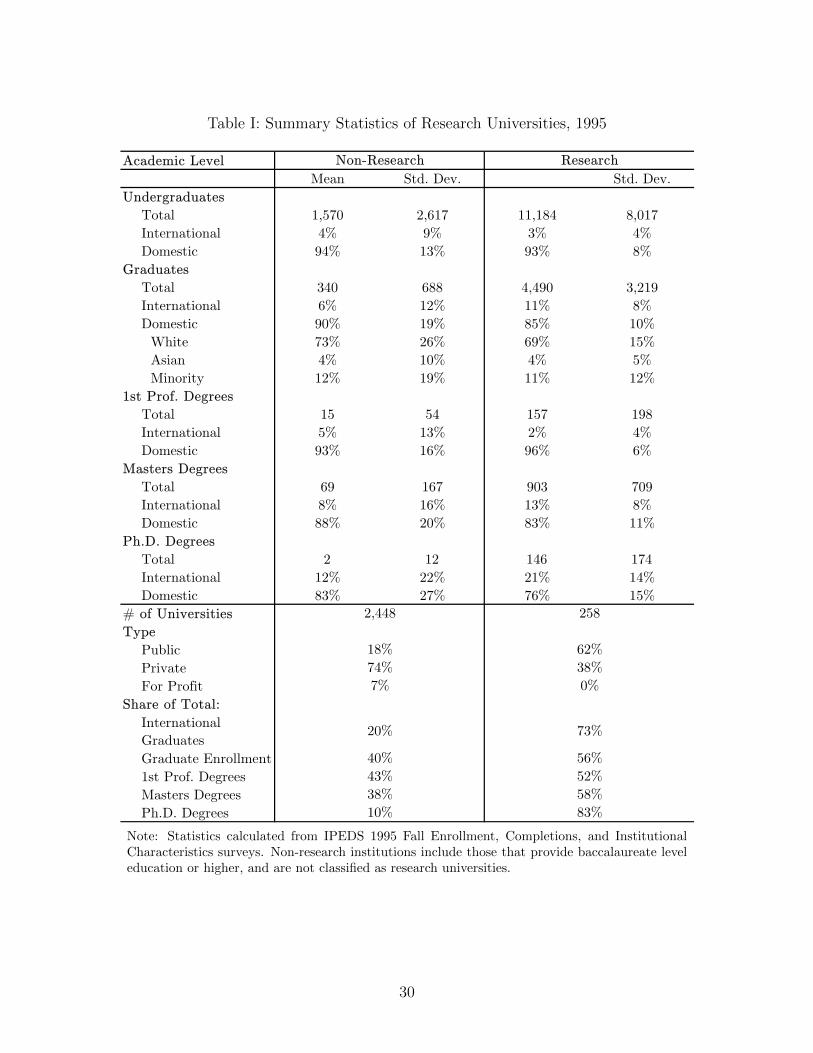
Table I: Summary Statistics of Research Universities, 1995
Academic LevelMean Std. Dev. Std. Dev.
UndergraduatesTotal 1,570 2,617 11,184 8,017International 4% 9% 3% 4%Domestic 94% 13% 93% 8%
GraduatesTotal 340 688 4,490 3,219International 6% 12% 11% 8%Domestic 90% 19% 85% 10%
White 73% 26% 69% 15%Asian 4% 10% 4% 5%Minority 12% 19% 11% 12%
1st Prof. DegreesTotal 15 54 157 198International 5% 13% 2% 4%Domestic 93% 16% 96% 6%
Masters DegreesTotal 69 167 903 709International 8% 16% 13% 8%Domestic 88% 20% 83% 11%
Ph.D. DegreesTotal 2 12 146 174International 12% 22% 21% 14%Domestic 83% 27% 76% 15%
# of UniversitiesType
PublicPrivateFor Profit
Share of Total:International GraduatesGraduate Enrollment1st Prof. DegreesMasters DegreesPh.D. Degrees
18% 62%74% 38%
Non-Research Research
2,448 258
40% 56%43% 52%
7% 0%
20% 73%
38% 58%10% 83%
Note: Statistics calculated from IPEDS 1995 Fall Enrollment, Completions, and InstitutionalCharacteristics surveys. Non-research institutions include those that provide baccalaureate leveleducation or higher, and are not classified as research universities.
30
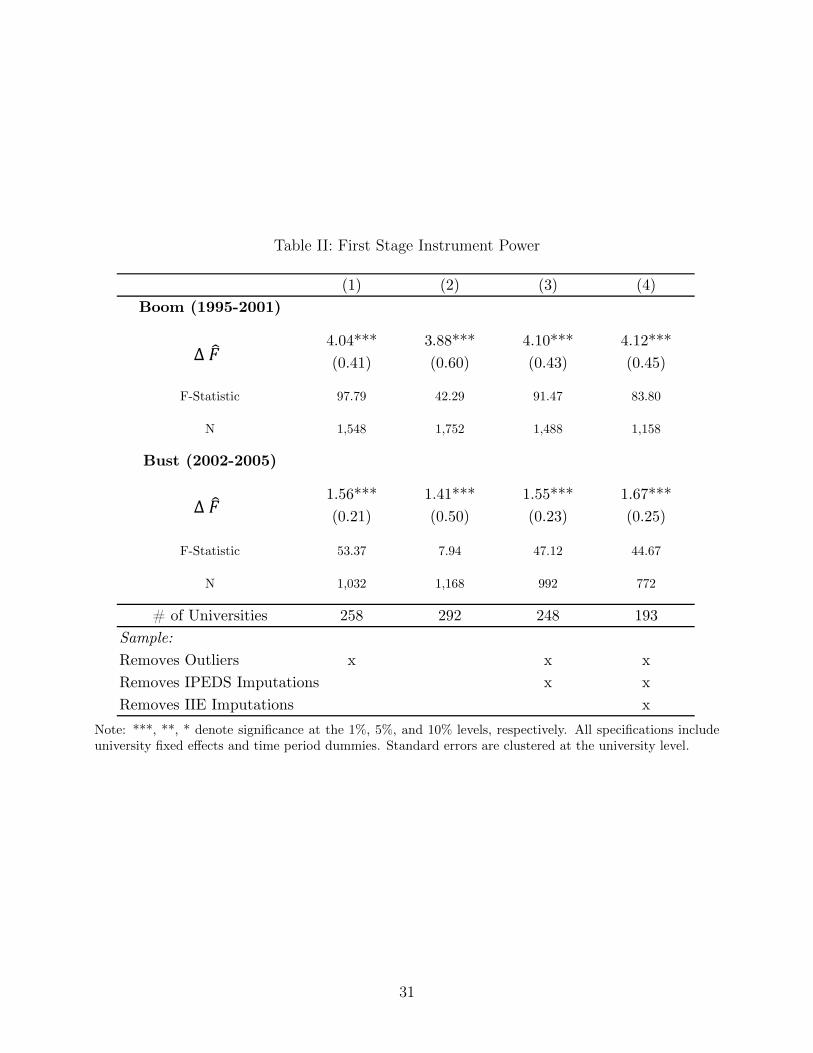
Table II: First Stage Instrument Power
(1) (2) (3) (4)Boom (1995-2001)
4.04*** 3.88*** 4.10*** 4.12***(0.41) (0.60) (0.43) (0.45)
F-Statistic 97.79 42.29 91.47 83.80
N 1,548 1,752 1,488 1,158
Bust (2002-2005)
1.56*** 1.41*** 1.55*** 1.67***(0.21) (0.50) (0.23) (0.25)
F-Statistic 53.37 7.94 47.12 44.67
N 1,032 1,168 992 772
# of Universities 258 292 248 193Sample:Removes Outliers x x xRemoves IPEDS Imputations x xRemoves IIE Imputations x
Δ
Δ
Note: ***, **, * denote significance at the 1%, 5%, and 10% levels, respectively. All specifications includeuniversity fixed effects and time period dummies. Standard errors are clustered at the university level.
31
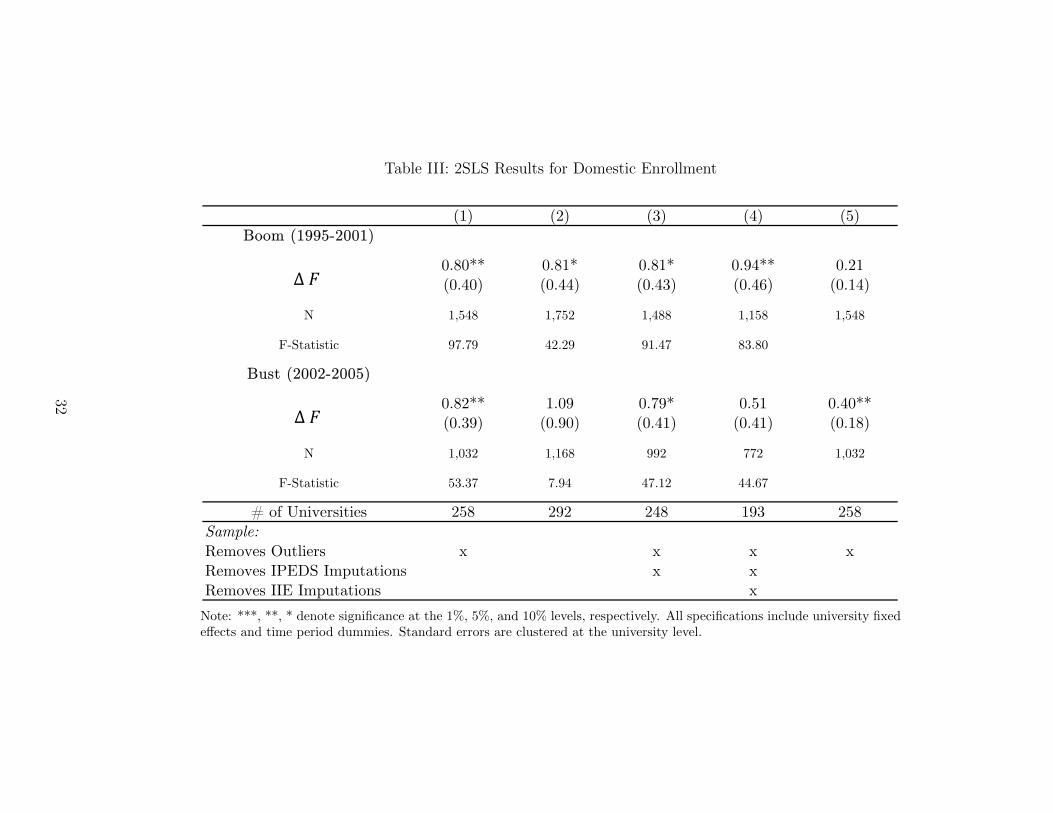
Table III: 2SLS Results for Domestic Enrollment
(1) (2) (3) (4) (5)Boom (1995-2001)
0.80** 0.81* 0.81* 0.94** 0.21(0.40) (0.44) (0.43) (0.46) (0.14)
N 1,548 1,752 1,488 1,158 1,548
F-Statistic 97.79 42.29 91.47 83.80
Bust (2002-2005)
0.82** 1.09 0.79* 0.51 0.40**(0.39) (0.90) (0.41) (0.41) (0.18)
N 1,032 1,168 992 772 1,032
F-Statistic 53.37 7.94 47.12 44.67
# of Universities 258 292 248 193 258Sample:Removes Outliers x x x xRemoves IPEDS Imputations x xRemoves IIE Imputations x
Δ �
Δ �
Note: ***, **, * denote significance at the 1%, 5%, and 10% levels, respectively. All specifications include university fixedeffects and time period dummies. Standard errors are clustered at the university level.
32
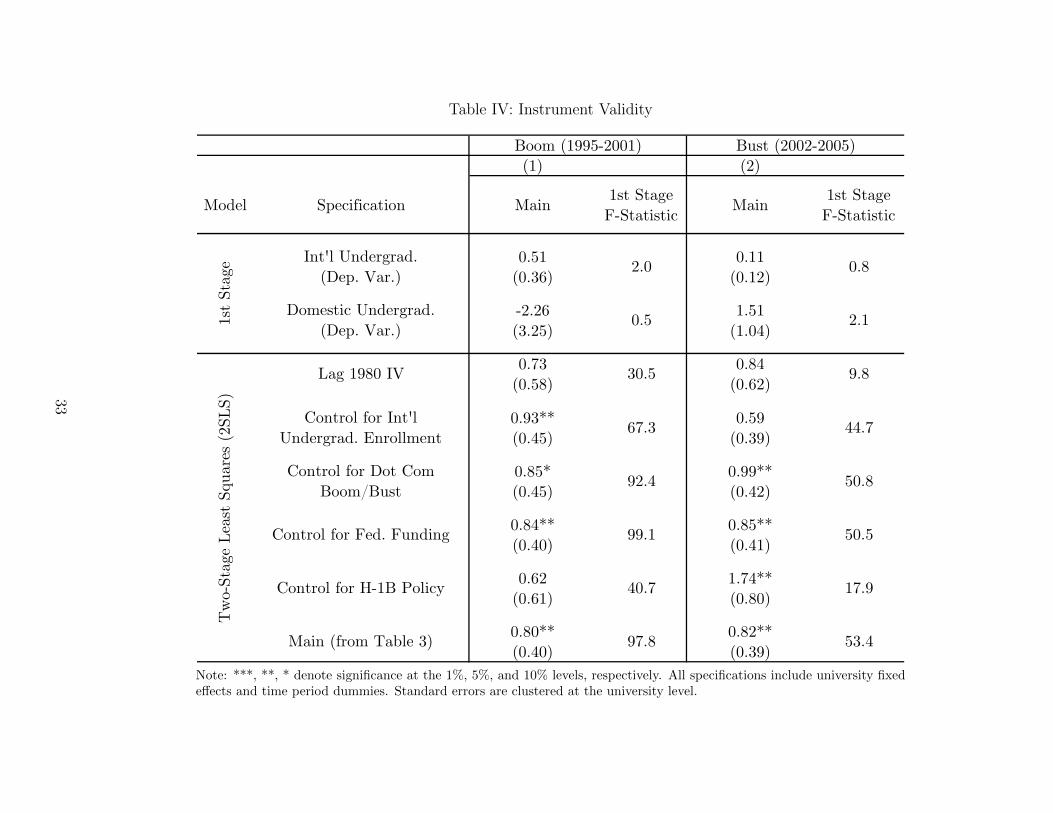
Table IV: Instrument Validity
(1) (2)
Model Specification Main 1st Stage F-Statistic Main 1st Stage
F-Statistic
0.51 0.11(0.36) (0.12)
-2.26 1.51(3.25) (1.04)
0.73 0.84(0.58) (0.62)
0.93** 0.59(0.45) (0.39)
0.85* 0.99**(0.45) (0.42)
0.84** 0.85**(0.40) (0.41)
0.62 1.74**(0.61) (0.80)
0.80** 0.82**(0.40) (0.39)
Boom (1995-2001) Bust (2002-2005)
2.1
0.8
0.5
2.0
17.9
50.5
50.8
Int'l Undergrad. (Dep. Var.)
Domestic Undergrad. (Dep. Var.)
Lag 1980 IV
Main (from Table 3)
40.7
97.8
Control for Dot Com Boom/Bust
Tw
o-St
age
Leas
t Sq
uare
s (2
SLS)
1st
Stag
e
9.830.5
53.4
Control for Int'l Undergrad. Enrollment 44.7
99.1
92.4
67.3
Control for Fed. Funding
Control for H-1B Policy
Note: ***, **, * denote significance at the 1%, 5%, and 10% levels, respectively. All specifications include university fixedeffects and time period dummies. Standard errors are clustered at the university level.
33
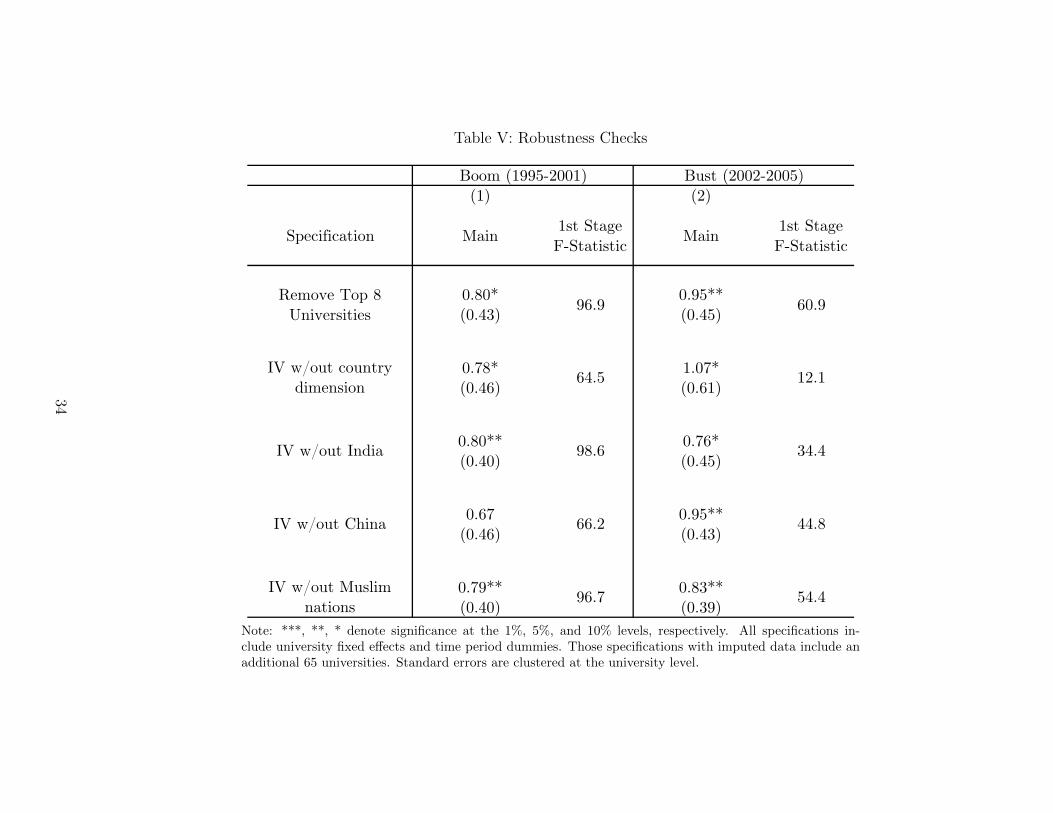
Table V: Robustness Checks
(1) (2)
Specification Main 1st Stage F-Statistic Main 1st Stage
F-Statistic
0.80* 0.95**(0.43) (0.45)
0.78* 1.07*(0.46) (0.61)
0.80** 0.76*(0.40) (0.45)
0.67 0.95**(0.46) (0.43)
0.79** 0.83**(0.40) (0.39)
Remove Top 8 Universities 96.9 60.9
Boom (1995-2001) Bust (2002-2005)
12.1
IV w/out India 98.6 34.4
IV w/out country dimension 64.5
IV w/out Muslim nations 96.7 54.4
IV w/out China 66.2 44.8
Note: ***, **, * denote significance at the 1%, 5%, and 10% levels, respectively. All specifications in-clude university fixed effects and time period dummies. Those specifications with imputed data include anadditional 65 universities. Standard errors are clustered at the university level.
34
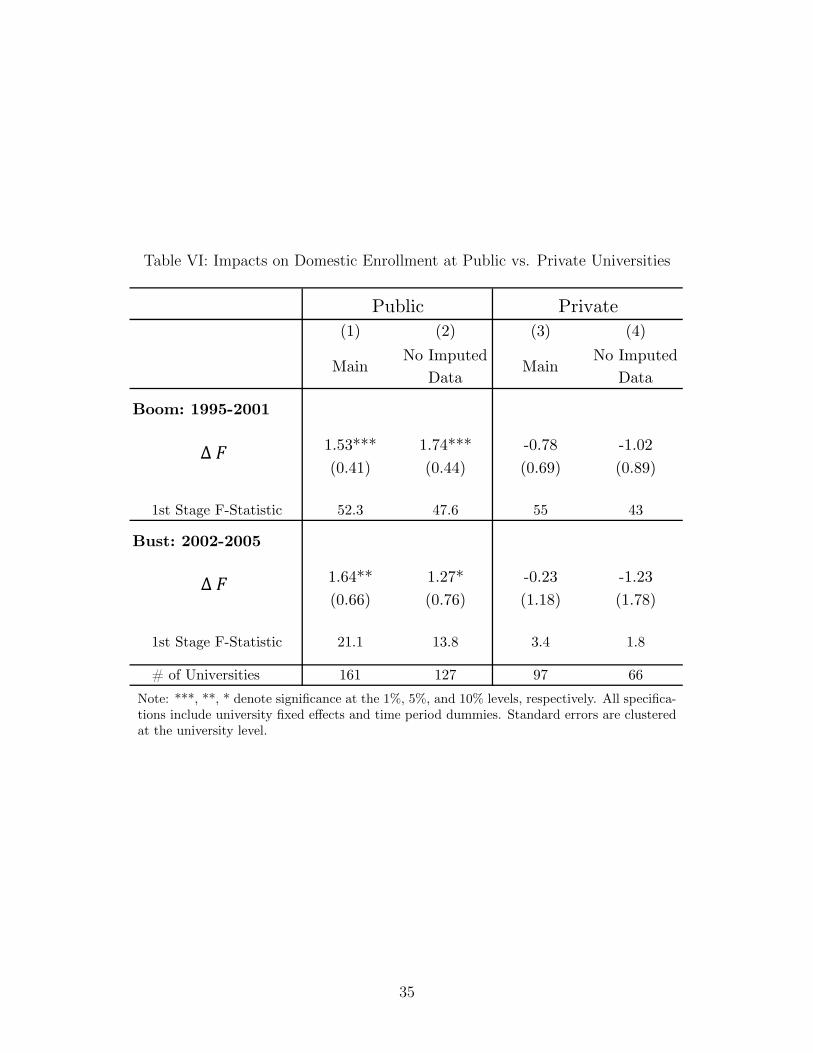
Table VI: Impacts on Domestic Enrollment at Public vs. Private Universities
Public Private(1) (2) (3) (4)
MainNo Imputed
DataMain
No ImputedData
Boom: 1995-2001
1.53*** 1.74*** -0.78 -1.02(0.41) (0.44) (0.69) (0.89)
1st Stage F-Statistic 52.3 47.6 55 43
Bust: 2002-2005
1.64** 1.27* -0.23 -1.23(0.66) (0.76) (1.18) (1.78)
1st Stage F-Statistic 21.1 13.8 3.4 1.8
# of Universities 161 127 97 66
Δ
Δ
Note: ***, **, * denote significance at the 1%, 5%, and 10% levels, respectively. All specifica-tions include university fixed effects and time period dummies. Standard errors are clusteredat the university level.
35
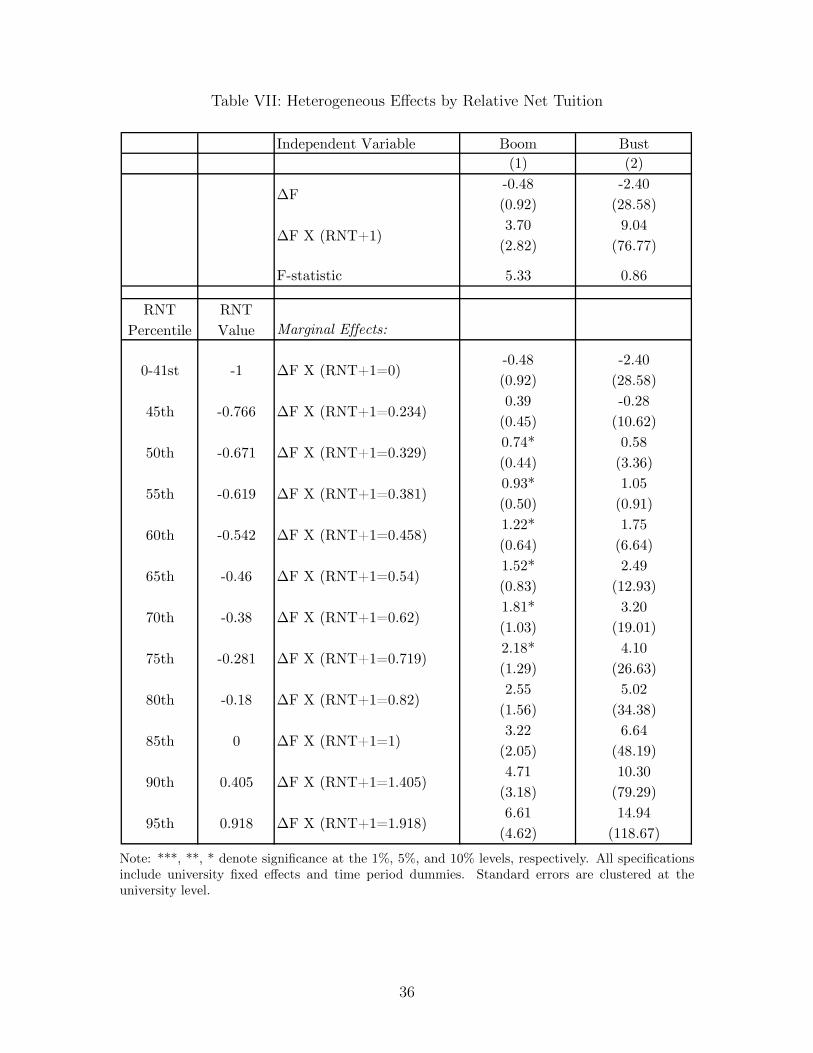
Table VII: Heterogeneous Effects by Relative Net Tuition
Independent Variable Boom Bust(1) (2)
-0.48 -2.40(0.92) (28.58)3.70 9.04
(2.82) (76.77)
F-statistic 5.33 0.86
RNT Percentile
RNT Value Marginal Effects:
-0.48 -2.40(0.92) (28.58)0.39 -0.28
(0.45) (10.62)0.74* 0.58(0.44) (3.36)0.93* 1.05(0.50) (0.91)1.22* 1.75(0.64) (6.64)1.52* 2.49(0.83) (12.93)1.81* 3.20(1.03) (19.01)2.18* 4.10(1.29) (26.63)2.55 5.02
(1.56) (34.38)3.22 6.64
(2.05) (48.19)4.71 10.30
(3.18) (79.29)6.61 14.94
(4.62) (118.67)
85th
90th
95th
-0.766
-0.671
-0.619
-0.542
-0.46
-0.38
-0.281
-0.18
0
0.405
0.918
60th
65th
70th
75th
80th
0-41st -1
45th
50th
55th
∆F X (RNT+1=1)
∆F X (RNT+1=1.405)
∆F X (RNT+1=1.918)
∆F X (RNT+1=0)
∆F X (RNT+1=0.234)
∆F X (RNT+1=0.329)
∆F X (RNT+1=0.381)
∆F X (RNT+1=0.458)
∆F X (RNT+1=0.54)
∆F X (RNT+1)
∆F
∆F X (RNT+1=0.62)
∆F X (RNT+1=0.719)
∆F X (RNT+1=0.82)
Note: ***, **, * denote significance at the 1%, 5%, and 10% levels, respectively. All specificationsinclude university fixed effects and time period dummies. Standard errors are clustered at theuniversity level.
36
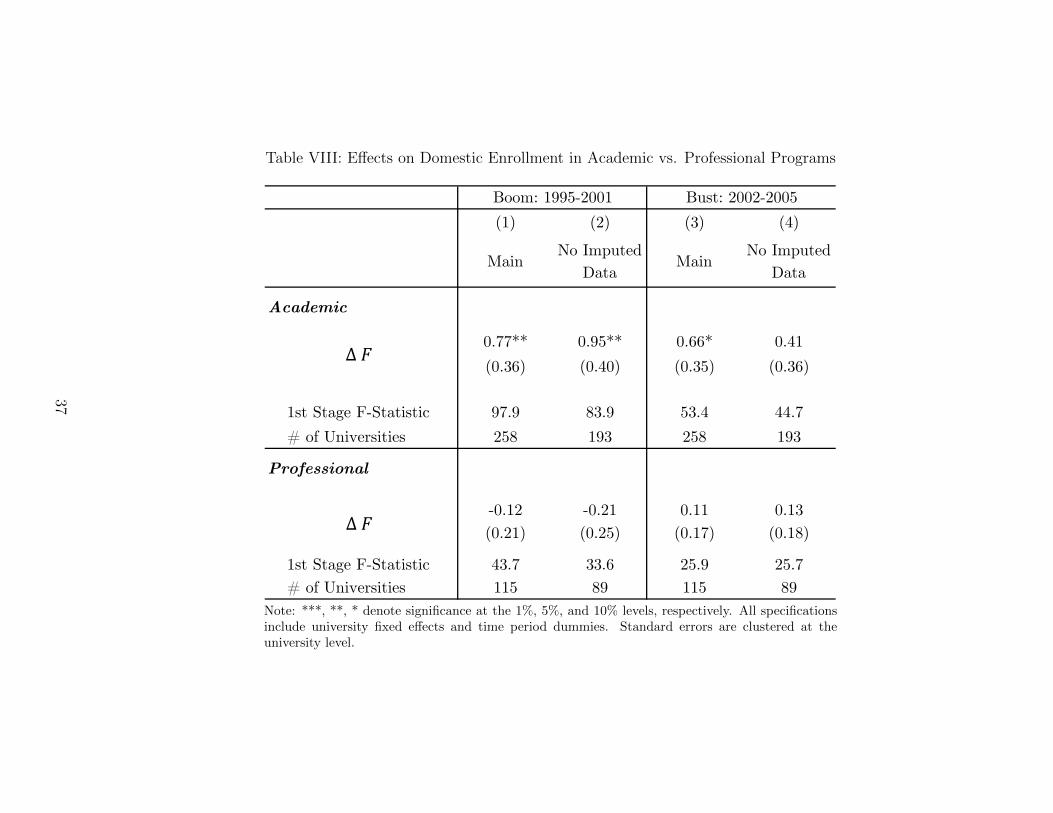
Table VIII: Effects on Domestic Enrollment in Academic vs. Professional Programs
Boom: 1995-2001 Bust: 2002-2005(1) (2) (3) (4)
MainNo Imputed
DataMain
No ImputedData
Academic
0.77** 0.95** 0.66* 0.41(0.36) (0.40) (0.35) (0.36)
1st Stage F-Statistic 97.9 83.9 53.4 44.7# of Universities 258 193 258 193
Professional
-0.12 -0.21 0.11 0.13(0.21) (0.25) (0.17) (0.18)
1st Stage F-Statistic 43.7 33.6 25.9 25.7# of Universities 115 89 115 89
Δ
Δ
Note: ***, **, * denote significance at the 1%, 5%, and 10% levels, respectively. All specificationsinclude university fixed effects and time period dummies. Standard errors are clustered at theuniversity level.
37
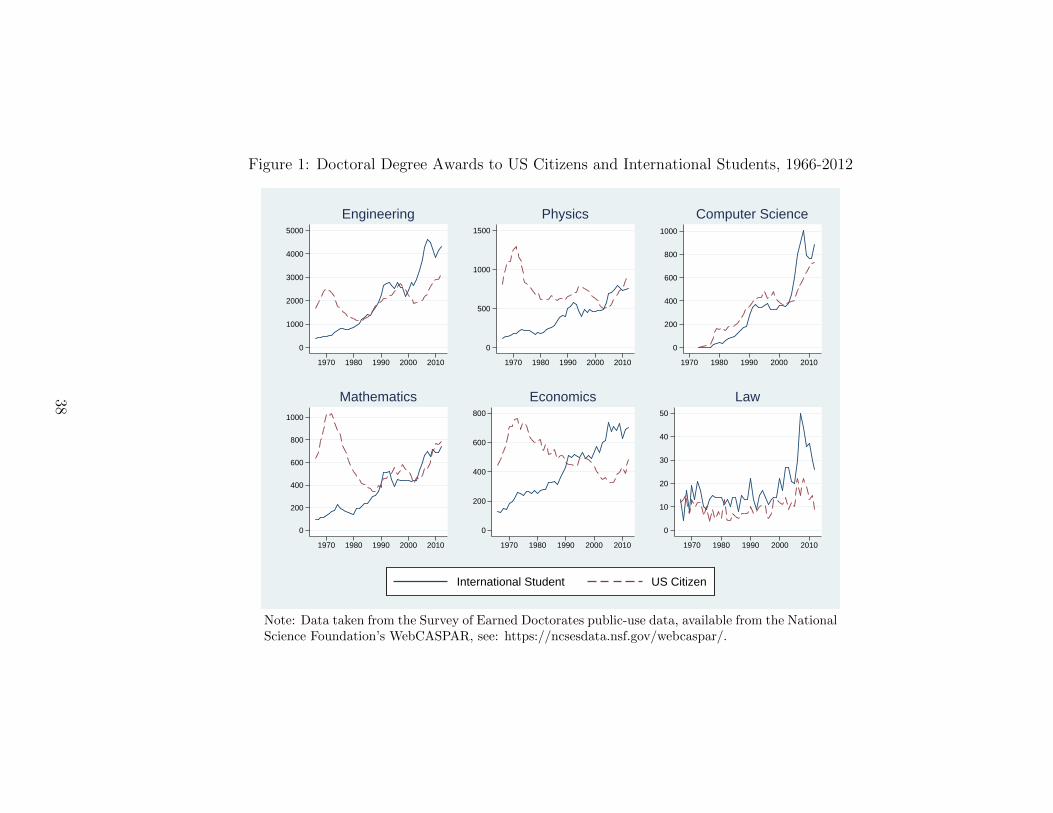
Figure 1: Doctoral Degree Awards to US Citizens and International Students, 1966-2012
0
1000
2000
3000
4000
5000
1970 1980 1990 2000 2010
Engineering
0
500
1000
1500
1970 1980 1990 2000 2010
Physics
0
200
400
600
800
1000
1970 1980 1990 2000 2010
Computer Science
0
200
400
600
800
1000
1970 1980 1990 2000 2010
Mathematics
0
200
400
600
800
1970 1980 1990 2000 2010
Economics
0
10
20
30
40
50
1970 1980 1990 2000 2010
Law
International Student US Citizen
Note: Data taken from the Survey of Earned Doctorates public-use data, available from the NationalScience Foundation’s WebCASPAR, see: https://ncsesdata.nsf.gov/webcaspar/.
38
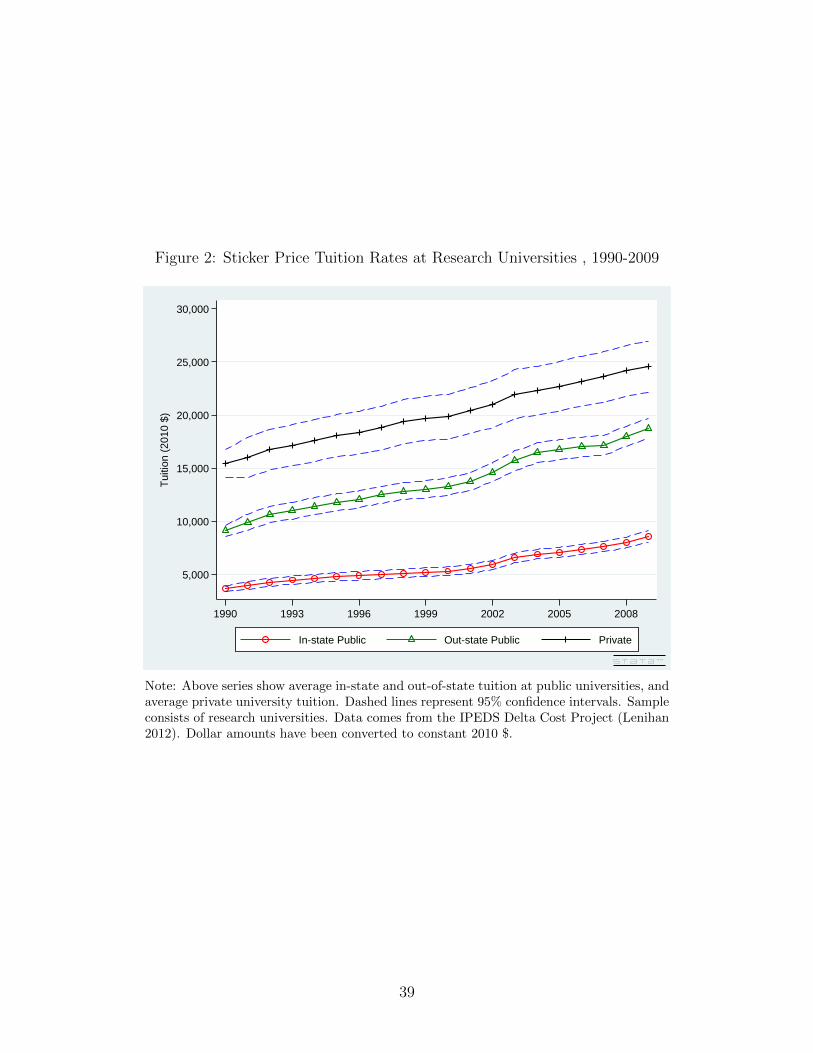
Figure 2: Sticker Price Tuition Rates at Research Universities , 1990-2009
5,000
10,000
15,000
20,000
25,000
30,000
Tui
tion
(201
0 $)
1990 1993 1996 1999 2002 2005 2008
In-state Public Out-state Public Private
Note: Above series show average in-state and out-of-state tuition at public universities, andaverage private university tuition. Dashed lines represent 95% confidence intervals. Sampleconsists of research universities. Data comes from the IPEDS Delta Cost Project (Lenihan2012). Dollar amounts have been converted to constant 2010 $.
39
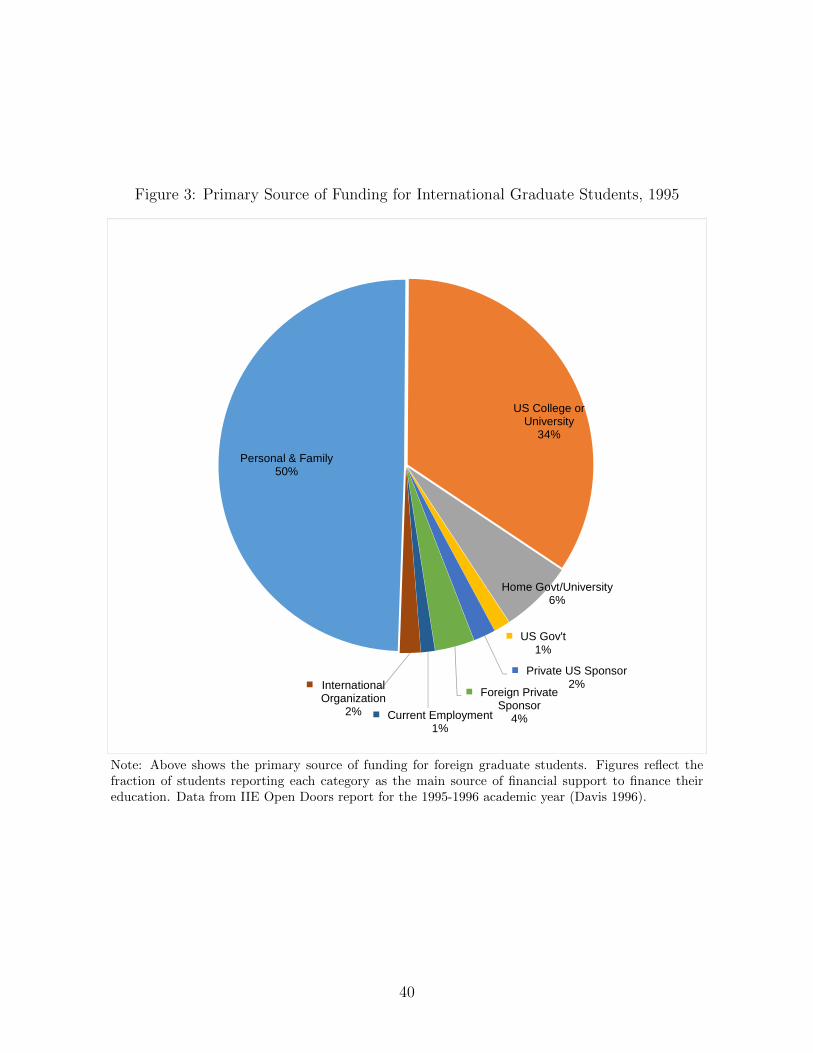
Figure 3: Primary Source of Funding for International Graduate Students, 1995
Personal & Family50%
US College or University
34%
Home Govt/University6%
US Gov't1%
Private US Sponsor2%
Foreign Private Sponsor
4%Current Employment1%
International Organization
2%
Note: Above shows the primary source of funding for foreign graduate students. Figures reflect thefraction of students reporting each category as the main source of financial support to finance theireducation. Data from IIE Open Doors report for the 1995-1996 academic year (Davis 1996).
40
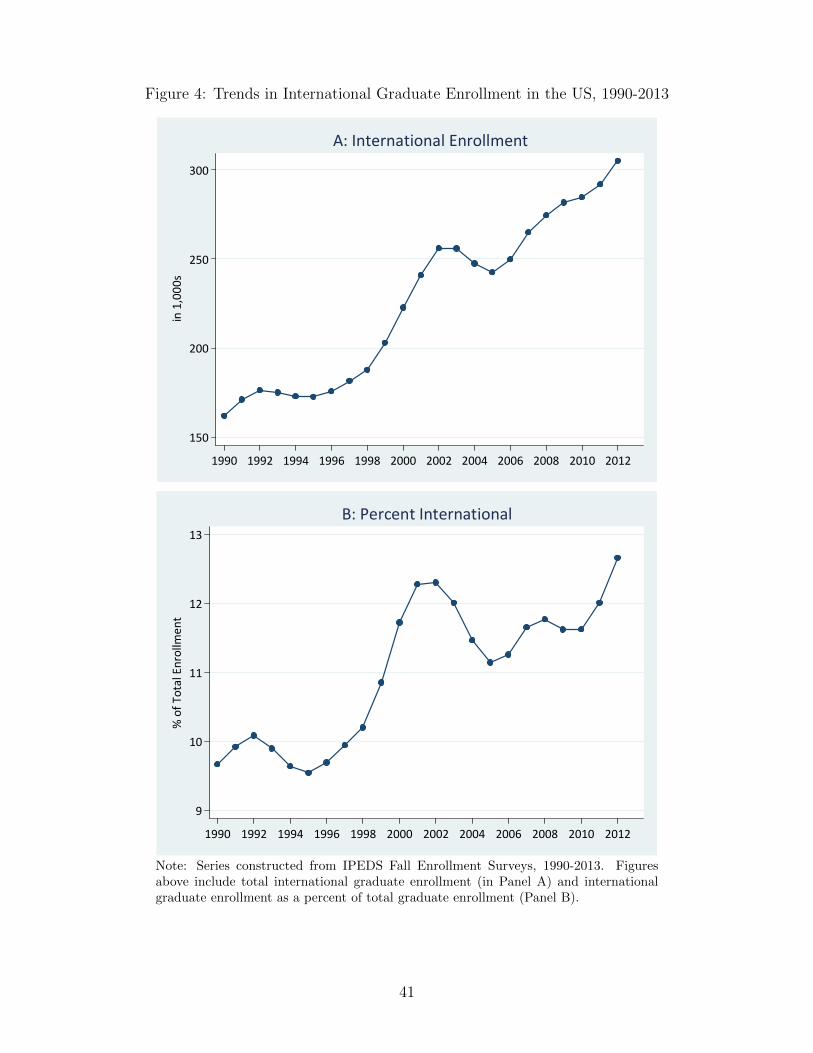
Figure 4: Trends in International Graduate Enrollment in the US, 1990-2013
150
200
250
300in
1,0
00
s
1990 1992 1994 1996 1998 2000 2002 2004 2006 2008 2010 2012
A: International Enrollment
9
10
11
12
13
% o
f To
tal E
nro
llmen
t
1990 1992 1994 1996 1998 2000 2002 2004 2006 2008 2010 2012
B: Percent International
Note: Series constructed from IPEDS Fall Enrollment Surveys, 1990-2013. Figuresabove include total international graduate enrollment (in Panel A) and internationalgraduate enrollment as a percent of total graduate enrollment (Panel B).
41
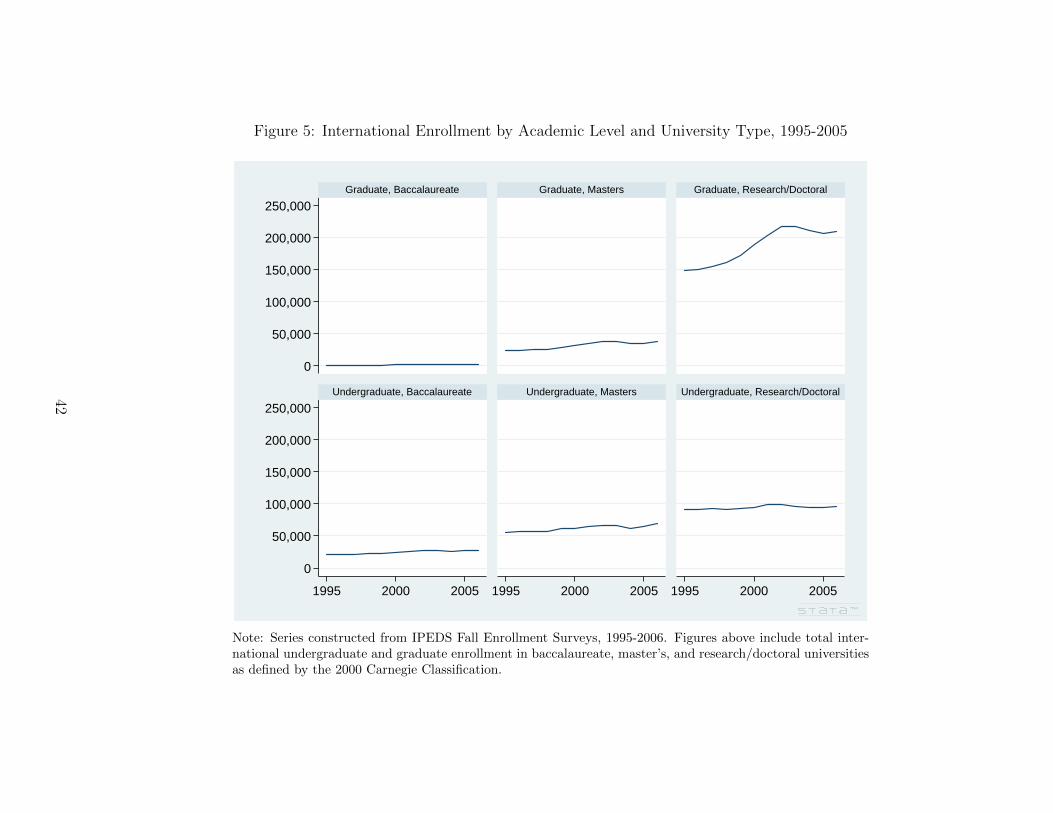
Figure 5: International Enrollment by Academic Level and University Type, 1995-2005
0
50,000
100,000
150,000
200,000
250,000
0
50,000
100,000
150,000
200,000
250,000
1995 2000 2005 1995 2000 2005 1995 2000 2005
Graduate, Baccalaureate Graduate, Masters Graduate, Research/Doctoral
Undergraduate, Baccalaureate Undergraduate, Masters Undergraduate, Research/Doctoral
Note: Series constructed from IPEDS Fall Enrollment Surveys, 1995-2006. Figures above include total inter-national undergraduate and graduate enrollment in baccalaureate, master’s, and research/doctoral universitiesas defined by the 2000 Carnegie Classification.
42
Figure 6: Composition of International Students, 1995-2005
A: Country of Origin
0.0
0.1
0.2
0.3
0.4
0.5
1995 1997 1999 2001 2003 2005
Americas Europe China India
Asia (Total) Middle East/South Asia Africa
B: Field of Study
0.0
0.1
0.2
0.3
0.4
0.5
1997 1999 2001 2003 2005
STEM Agriculture, Environment & Health
Social Science Business
Arts & Humanities Other
Note: Series constructed from IIE International Student Census restricted-usedata from 1995-2005. Graduate enrollment by field of study was available onlyfrom 1997 on.
43
Figure 7: Visual First Stage Estimates
45 Degree Line Regression Line
-500
-250
025
050
0
Act
ual
(Res
idua
l)
-25 -10 5 20Predicted (Residual)
A: Boom
-500
-250
025
050
0
Act
ual
(Res
idua
l)
-55 -5 45 95Predicted (Residual)
B: Bust
Note: Figure plots the actual change in foreign enrollment over the boom (left) and bust (right) against the change predicted by theinstrument for each university in the main sample. For reference, the 45-degree line is represented by the dashed line. The regression lineis represented by the solid line.
44
Figure 8: Coincident Shocks During the Boom and Bust
140,000
160,000
180,000
200,000
220,000
1995 1997 1999 2001 2003 2005
D: Foreign Graduate Enrollment
50,000
100,000
150,000
200,000
1995 1997 1999 2001 2003 2005
H-1B Issued H-1B Annual Cap
C: H-1B Visas Issued & Cap
1,000
1,500
2,000
2,500
3,000
3,500
4,000
1995 1997 1999 2001 2003 2005
A: Nasdaq Index (NDX) Closing Price, Q2 Avg. (in $s)
15,000,000
20,000,000
25,000,000
30,000,000
1995 1997 1999 2001 2003 2005
B: Federal Research Funding to Universities (in constant 2010$s)
Note: Panel A: Nasdaq Composite Index stock prices are from Yahoo Finance Historical Prices and reflect the average daily closing priceover the 2nd quarter, when students generally make enrollment decisions. Panel B shows data from the NSF on total federal research anddevelopment obligations to universities and colleges excluding FFRDCs in constant 2010 dollars. Panel C: H-1B visas issued are from theDepartment of States Non-immigrant Visa Statistics.
45
Figure 9: Net Tuition and Institutional Aid, US Citizens in the NPSAS Sample
3,000
5,000
7,000
9,000(in
con
stan
t 201
5 $)
1996 2000 2004
Avg. Net Tuition Payments of U.S. Citizens
3,000
5,000
7,000
9,000
(in c
onst
ant 2
015
$)
1996 2000 2004
Institutional Grant Aid per U.S. Citizen
8,000
10,000
12,000
14,000
16,000
(in c
onst
ant 2
015
$)
1996 2000 2004
Total Institutional Aid per U.S. Citizen
Note: Figure reflects average net tuition, institutional aid, and institutional grant aid in constant 2015 dollars for US citizensenrolled in graduate programs at research universities from the 1996, 2000, and 2004 NPSAS surveys. Data retrieved fromthe National Center for Education Statistic’s Data Lab (https://nces.ed.gov/datalab/).
46
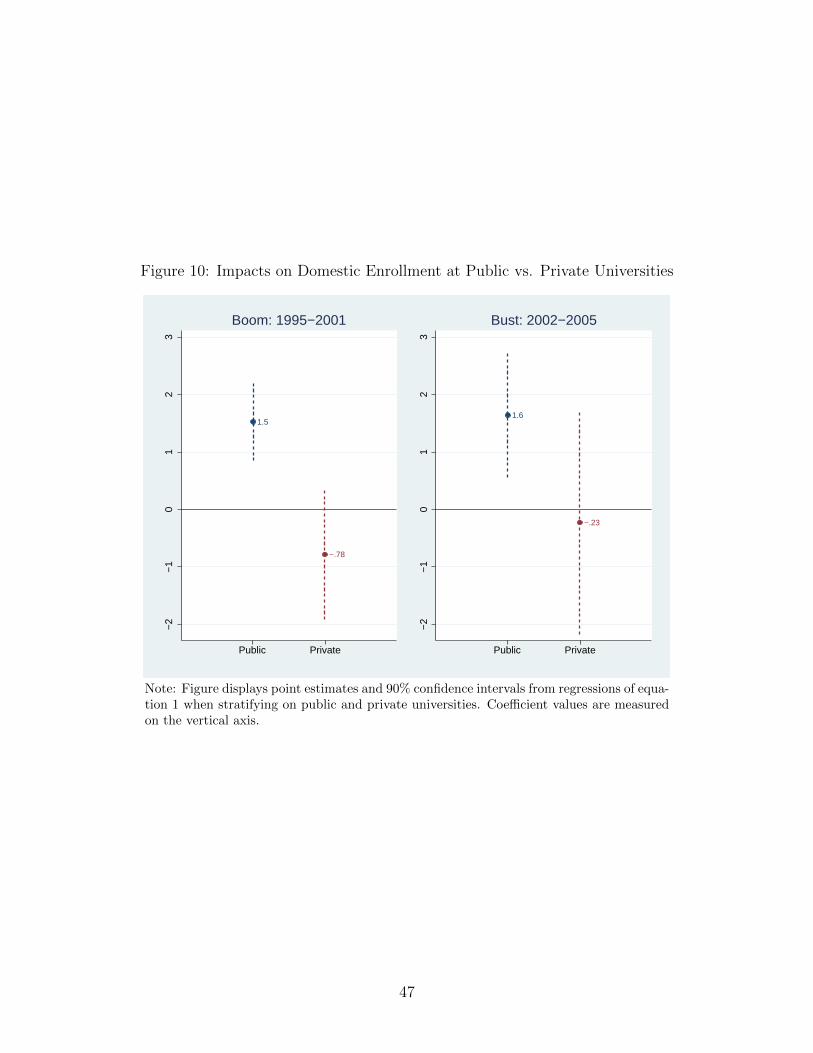
Figure 10: Impacts on Domestic Enrollment at Public vs. Private Universities
1.5
−.78
−2
−1
01
23
Public Private
Boom: 1995−2001
1.6
−.23
−2
−1
01
23
Public Private
Bust: 2002−2005
Note: Figure displays point estimates and 90% confidence intervals from regressions of equa-tion 1 when stratifying on public and private universities. Coefficient values are measuredon the vertical axis.
47
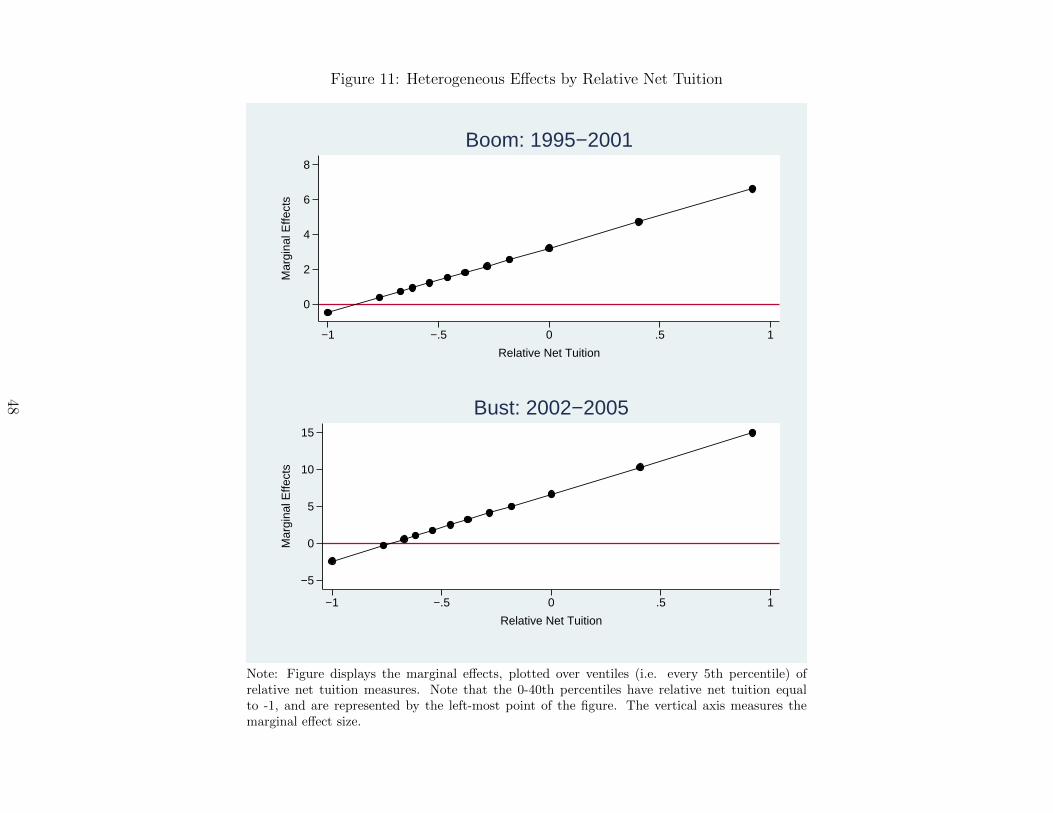
Figure 11: Heterogeneous Effects by Relative Net Tuition
0
2
4
6
8
Mar
gina
l Effe
cts
−1 −.5 0 .5 1
Relative Net Tuition
Boom: 1995−2001
−5
0
5
10
15
Mar
gina
l Effe
cts
−1 −.5 0 .5 1
Relative Net Tuition
Bust: 2002−2005
Note: Figure displays the marginal effects, plotted over ventiles (i.e. every 5th percentile) ofrelative net tuition measures. Note that the 0-40th percentiles have relative net tuition equalto -1, and are represented by the left-most point of the figure. The vertical axis measures themarginal effect size.
48
A Appendix
A.1 Imputations to 1993 IIE Data
Only 201 of these 258 research universities provided enrollment counts by country oforigin and academic level in the 1993 IIE survey. Thus, imputations of the IIE graduate andundergraduate enrollments by country of origin for the 57 non-respondents are necessary toinclude them in the analysis.
Imputations are performed by using data from non-research universities that did respondto the survey. These include master’s and baccalaureate level institutions, and also commu-nity colleges and vocational colleges. In what follows, I describe the imputation procedurefor graduate enrollments by country of origin. The procedure for undergraduate enrollmentsis identical, the only difference being that I use available data on undergraduate enrollmentsrather than graduate enrollments.
To impute graduate enrollment by country of origin, I obtain total graduate enrollmentin 1993 from the IPEDS Fall Enrollment survey for each of the 57 universities missing in theIIE data. Using only non-research universities in the 1993 IIE data, I calculate the shareof graduate enrollment from each country of origin by state. This procedure involves firstaggregating graduate enrollment by country of origin (c) for all non-research universities (i)within the same state (s),
F cs1993 =
∑i
F cis1993 (A.1)
Hence I obtain for each state total enrollment by country of origin in non-research univer-sities. Next, enrollments by country of origin for each state are then aggregated across allcountries of origin,
Fs1993 =∑s
F cs1993 =
∑s
∑i
F cis1993
Dividing the state level country of origin enrollment by total foreign enrollment in that stateyields the share of students from country c in each state in 1993,
shcs1993 =F cs1993
Fs1993
I then multiply total enrollment in 1993, measured from IPEDS, with the share of studentsby country of origin in the corresponding state.
F cu1993 = Fu1993 ∗ shcs1993
To be precise, the state share assigned to the university is that of the state in which the uni-versity is located. Lastly, I aggregate the country of origin imputations to the 17 nationalitygroups. These imputations of graduate enrollment by nationality in 1993 for each universityare then interacted with the supply shocks to form the instruments, as detailed in 3.
49
A.2 Construction of control variables
This section describes, in further detail, the construction of the various different controlvariables used in the analysis, and the data sources. These include variables that controlfor contemporaneous phenomena that may have affected US graduate education during the1995-2005 decade.
H-1B Control
To account for possible influence of national changes to H-1B program, I develop a control.The first step requires calculating the number of H-1B visas issued to each nationality for1993 and the sample years 1995-2005. Data on H-1B visa issued by country of origin isavailable from 1997-2005 from the Department of State.22 Lack of data prior to 1997 posesan issue for constructing this control for 1993, 1995, and 1996. However, yearly data on thetotal number of H-1B visas issued from 1990-2005 are available. This allows imputation ofH-1B visas issued by country of origin in the missing years (i.e. 1993, 1995, 1996), as follows:
Sn97−05 =
∑2005t=1997H1Bnt∑2005t=1997H1Bt
H1Bnτ =Sn97−05 ∗H1Bnτ for τ = 1993, 1995, 1996
I first calculate the share of all H-1B visas awarded to each nationality group n from1997 to 2005 (Sn97−05). This is done by cumulating all visas issued to that nationality group(H1Bnt) and dividing by the total H-1B visas awarded over the 1997-2005 period. Thesecond step imputes the number of H-1B visas issued to each nationality group in the years
prior to 1997 (H1Bnτ ) by interacting the share of all H-1B visas awarded to that nationalitygroup over the 1997-2005 period with the total number of H-1B visas in missing years.
I then calculate the aggregate growth rates of H-1B workers by nationality from 1993 toeach of the sample years.
gH1Bn,93−t =
H1Bnt
H1Bn1993
This growth factor is then interacted with the historical foreign graduate enrollment acrossuniversities, and these predictions are then aggregated across all nationalities,
FH1But =
∑n
FH1Bnut =
∑n
Fnu93 · gH1Bn,93−t =
∑n
Fnu93 ·H1Bnt
H1Bn1993
22Data comes from the FY1997-2012 NIV Detail Table, available at https://travel.state.gov/content/visas/en/law-and-policy/statistics/non-immigrant-visas.html.
50
Similar to 2 in the paper, this procedure yields a variable that captures the contribution ofchanges in H-1B policy on foreign graduate enrollment. Formalizing this into a control for2SLS regressions requires taking first-differences:
∆FH1But = FH1B
ut − FH1But−1
The Dot Com Boom and Bust
The Dot-Com boom and bust dramatically altered the stock prices of internet based firms.To capture these fluctuations I use the Nasdaq Composite Index (NCI), which is comprisedof 3,000+ actively traded securities on the Nasdaq stock exchange, and is often used to trackthe performance of technology-based companies.
I compute a simple average of the NCI daily closing price over the 2nd quarter of each year,around when universities offer admissions to students. I correct these values for inflation,and calculate growth in the average NCI values from 1993 to each of the years in the sample(1995-2005),
gNCI93−t =NCItNCI1993
Since fluctuations in equity prices during the Dot-Com episode materialized as shocks touniversity endowments, I interact these growth rates with average per student endowmentfunds for each university in 1993,
epsut =endowmentu93
Etotalu93
· gNCI93−t
Endowment per student values are constructed for each university by dividing ending mar-ket value of endowment assets (endowmentu93) by total enrollment (Etotal
u93 ), available fromIPEDS data.
The control used in 2SLS is the change in Dot-Com-predicted endowment per student,
∆epsut = epsut − epsut−1
Federal R&D Funding to Universities
Data on Federal funding to universities comes from the National Science Foundation.To measure Federal funding to universities I use total Federal R&D outlays to Collegesand Universities, excluding Federally Funded Research and Development Centers from 1993-2005.23 I adjust these values for inflation by transforming all data into constant 2010$.
23Data retrieved from https://ncsesdata.nsf.gov/webcaspar/OlapBuilder.
51
To measure the impact of these aggregate changes in Federal funding on each university, Ifirst define each university’s historical reliance on Federal funds. I capture historical relianceas Federal research funding per student measured in 1993, using IPEDS data, calculated bydividing the total value of Federal grants and contracts by total enrollment (FedFundsu93
Etotalu93
),
I then interact historical Federal funds per student with growth in total Federal R&Doutlays,
fpsut =FedFundsu93
Etotalu93
· grFedR&D93−t =
FedFundsu93
Etotalu93
· FedR&Dt
FedR&D1993
The control variable is the change in predicted federal funds per student,
∆fpsut = fpsut − fpsut−1
A.3 Derivation of Theoretical Model
The following model adapts the theory from James (1979) to incorporate university de-cisions over foreign and domestic students. Universities choose D, F , and q to maximizeU(D,F, q) subject to the non-profit constraint,
FC + c(q)D + c(q)F − tDD − tFF − FR = 0
With E = D + F and c = c(q), the first-order conditions are:
UD − λ (c− tD) = 0 (A.2)
UF − λ (c− tF ) = 0 (A.3)
Uq − λc′ · E = 0 (A.4)
How would domestic enrollment change after an exogenous shock to foreign student sup-ply, holding all else constant? Substituting equation 7 in 6 and 5, and using the implicitfunction theorem yields:
∂D
∂F= −UF
UD=tF − c
c− tD(A.5)
52