Embed Size (px)
Citation preview
Do Majority-Minority Districts Maximize Substantive Black Representation in Congress?Author(s): Charles Cameron, David Epstein and Sharyn O'HalloranSource: The American Political Science Review, Vol. 90, No. 4 (Dec., 1996), pp. 794-812Published by: American Political Science AssociationStable URL: http://www.jstor.org/stable/2945843Accessed: 17-10-2017 19:06 UTC
JSTOR is a not-for-profit service that helps scholars, researchers, and students discover, use, and build upon a wide
range of content in a trusted digital archive. We use information technology and tools to increase productivity and
facilitate new forms of scholarship. For more information about JSTOR, please contact [email protected].
Your use of the JSTOR archive indicates your acceptance of the Terms & Conditions of Use, available at
http://about.jstor.org/terms
American Political Science Association is collaborating with JSTOR to digitize, preserve andextend access to The American Political Science Review
This content downloaded from 128.112.40.248 on Tue, 17 Oct 2017 19:06:09 UTCAll use subject to http://about.jstor.org/terms

American Political Science Review Vol. 90, No. 4 December 1996
Do Majority-Minority Districts Maximize Substantive Black Representation in Congress? CHARLES CAMERON, DAVID EPSTEIN, and SHARYN O'HALLORAN Columbia University
Mz wajority-minority voting districts have been advanced as a remedy to the underrepresentation of minority interests in the political process. Yet, their efficacy in furthering the substantive goals of minority constituents has been questioned because they may dilute minority influence in surrounding
areas and lead to an overall decrease in support for minority-sponsored legislation. Thus, there may be a trade-off between increasing the number of minority officeholders and enacting legislation that furthers the interests of the minority community. Using nonlinear estimation techniques, we simulate the districting strategies that maximize substantive minority representation, and find that such a trade-off does exist. We also find that, outside of the South, dividing minority voters equally across districts maximizes substantive representation; inside the South the optimal scheme creates concentrated districts on the order of 47% black voting age population. In addition, minority candidates may have a substantial chance of being elected from districts with less than 50% minority voters.
A fter the 1990 Census, the North Carolina state legislature drew up a reapportionment plan whereby only one district out of twelve had a
majority of minority voters, that is, was a "majority- minority" district. This plan was then submitted to the Department of Justice under the preclearance proce- dures of Section 5 of the 1965 Voting Rights Act. Upon review, the Justice Department rejected the proposal, suggesting that the state construct a second such district to accommodate its 20% black population. North Caro- lina's second attempt did result in two majority black districts, the First and the Twelfth, but the latter was, to put it mildly, rather unusually shaped; it snaked along Interstate 85, occasionally ballooning out to capture pockets of black residents and, at times, remaining contiguous only at a single point. The Supreme Court reviewed the second redistricting plan in Shaw v. Reno and ruled that bizarrely shaped majority-minority dis- tricts may create unconstitutional racial gerrymanders.1 Coming three weeks after the withdrawal of Lani Guini- er's nomination to head the Civil Rights Division of the
Charles Cameron is Associate Professor of Political Science, David Epstein is Assistant Professor of Political Science, and Sharyn O'Halloran is Assistant Professor of Political Science and Interna- tional Affairs, Columbia University, New York, NY 10027.
The authors would like to thank Richard Briffault, Neal Beck, David
Brady, Michael Cragg, Mike Fitts, Charles Franklin, Lani Guinier, Simon Jackman, Susanne Lohmann, Nolan McCarty, Jeff Milyo, Daniel Rabinowitz, Douglas Rivers, and seminar participants at Co-
lumbia University, in the Harvard Workshop in Political Economy, in the Kennedy School of Government Faculty Seminar, at the Univer- sities of Princeton, Rochester, and Rutgers, and at the Wharton School
of Business for helpful comments and suggestions. Professors Epstein and O'Halloran appreciate the generous financial support from the National Science Foundation, SBR-95-11628, and the Harvard-MIT Research Training Grant in Positive Political Economy, DIR-91- 13328, as well as the School of International and Public Affairs, Columbia University. Kim Johnson provided excellent research assis-
tance throughout the project.
I Shaw v. Reno, 113 S.Ct. 2816 (1993). The decision remanded the case to the federal district court to review the reapportionment plan under strict scrutiny. The lower court eventually upheld the North Carolina district on the basis that it united urban interests as well as racial minorities, but the Supreme Court again ruled against the district in Shaw v. Hunt (1996).
794
Justice Department, the Shaw decision intensified the debate over the role of majority-minority districts in promoting black representation in Congress.
The past quarter-century has seen the rise of what Guinier (1994) terms the "theory of black electoral success," according to which the advancement of minor- ity interests can be measured by the number of minori- ties elected to public office. This goal has been achieved largely by the construction of concentrated minority voting districts, either through the decennial reappor- tionment or by switching from at-large voting to district- based systems in local elections. Proponents of these districts argue that, given polarized voting, minorities will remain underrepresented in the political process unless they have equal opportunity to elect the candidate of their choice. If this is true, and if minority voters generally elect minority candidates to represent them, then descriptive representation-increasing the number of minority officeholders-goes hand in hand with substan- tive representation- enacting legislation that furthers the interests of the minority community.
Yet, it is unclear that minority interests are always best served by the creation of concentrated minority districts. These dilute minority influence in surrounding areas, which may then elect representatives unsympa- thetic to minority concerns. If minority voters can influ- ence their representative's actions without necessarily comprising a majority of the electorate, then majority- minority districts may increase the number of minority legislators but decrease the number of votes in support of minority legislation. That is, there may be a trade-off between descriptive and substantive representation. Thus, a basic question of constituency and governance remains unresolved: Do majority-minority districts max- imize substantive black representation in Congress? Is it better for political minorities to wield a modest amount of influence in many districts or substantial influence in only a few?
To address this question we develop a general meth- odology for assessing the effect of different districting schemes on the substantive representation of group interests, as measured by legislators' roll-call voting
This content downloaded from 128.112.40.248 on Tue, 17 Oct 2017 19:06:09 UTCAll use subject to http://about.jstor.org/terms

American Political Science Review Vol. 90, No. 4
scores. We then apply this technique to calculate the districting strategy that maximizes black representation in Congress. Our approach consists of three steps. First, we estimate representation equations, which relate the black voting-age population in a district to the represen- tative's support for minority issues. Second, we estimate electoral equations, which relate the concentration of minority voters in a district to the partisan and racial characteristics of the representative elected. Third, we combine the representation and electoral effects to calculate the districting scheme that maximizes overall expected representation of minority interests.
Briefly, our results are as follows. First, a trade-off does exist between maximizing the number of black representatives in Congress and maximizing the number of votes in favor of minority-sponsored legislation. In particular, districting plans designed to maximize de- scriptive representation concentrate minority voters more than do plans designed to maximize substantive representation. Second, electoral effects dominate rep- resentation effects; that is, the largest effect from adding minority voters to a district comes not from influencing the actions of any given representative but from influ- encing the type of representative elected. Third, the point of equal opportunity for minority voters to elect the representative of their choice generally occurs in districts with less than 50% black voting-age population. Fourth, given recent electoral and roll-call voting pat- terns, the districting strategy that maximizes substantive minority representation varies by region. Outside the South, optimal districting schemes divide black voters as equally as possible across districts. Inside the South, substantive minority representation is maximized by creating concentrated minority districts with about 47% black voting-age population.
The rest of the paper is organized as follows. In the next section we review the literature on minority repre- sentation. In the third section we present the data used in the study, detail our estimation techniques, and analyze the representation and electoral equations. In the fourth section we conduct a series of simulations of the optimal allocation of minorities to districts that maximizes their influence in Congress. We conclude by relating our findings to the larger debate on minority representation.
THE DEBATE ON MAJORITY-MINORITY DISTRICTS
Two distinct literatures discuss the effect of minority voting strength on a representative's responsiveness to minority interests. The first focuses on how an increase in the minority voting population translates into discern- ible policy gains. Its emphasis is on finding the appro- priate functional relationship between the percentage of black voting-age population in a district and the legisla- tor's roll-call voting behavior. The second literature concentrates on the effect of majority-minority districts in promoting descriptive and substantive representation of black interests. Although these literatures have some- times been treated separately, we contend that answer- ing the first question- how district composition trans-
lates into legislative behavior-is crucial in assessing the influence of majority-minority districts in promoting black interests. We review these literatures and then discuss how they can be integrated to give a broader perspective on the efficacy of majority-minority districts.
Minority Interests and Representation
In single-member district plurality-winner elections, what influence will electoral minorities have over the actions of their representative? A number of different answers have been advanced in the literature. If prefer- ences within the electorate are polarized, with one group commanding a clear majority, then electoral minorities will have only a tenuous relation with their representa- tive. If the majority is itself divided, then these minorities may have a good deal of influence over outcomes by trading their support in return for policy concessions. The first scenario corresponds to the situation of most blacks in southern politics since Reconstruction; the second reflects the position of blacks as key swing voters in national politics from the late 1950s to the mid-1960s.
We thus begin with two hypotheses about the relation between the percentage of black voters in a district and the behavior of their representative. The first, which we
term majoritarianism, predicts that black voters in a district will have little influence on the voting behavior of their representative until they constitute a majority, at which point the representative's voting behavior takes a discrete jump toward minority-favored policies. The second, termed influence districts, posits a generally positive relation between the percentage of blacks and representation of black interests, as would most stan- dard theories of interest group behavior.
Other possibilities have been mentioned in previous studies of race and representation. Historically, the most important of these was suggested by Key (1949) in his classic Southern Politics. Key notes that those counties with the highest proportion of blacks were the most likely to vote for Smith over Hoover in 1928 and to bolt the party in favor of Strom Thurmond's State's Rights ticket in 1948. He also suggests that members represent- ing these same districts compiled relatively more conser- vative voting records. Thus, we might actually expect a negative relation between the percentage of blacks and support for minority legislation. The argument is that in a polarized district with a relatively large black popula- tion, minority issues become more salient. Representa- tives from these areas will feel pressured by conservative white constituents to prove that they have not been unduly influenced by black voters. We shall call this possibility the polarization hypothesis.2
A variant of Key's hypothesis comes from Keech (1968), who posits a curvilinear, or bimodal, relationship between the percentage of blacks and their representa- tive's voting patterns. Keech asserts that the majority does not take much notice when the percentage of
2 Additional evidence of the polarization effect is demonstrated by Kernell (1973), who found that in Mississippi counties white voter turnout is highly correlated with the potential and actual black turnout. McDonald (1992, 81-2) provides additional examples of white backlash to minority mobilization.
795
This content downloaded from 128.112.40.248 on Tue, 17 Oct 2017 19:06:09 UTCAll use subject to http://about.jstor.org/terms
Do Majority-Minority Districts Maximize Black Representation? December 1996
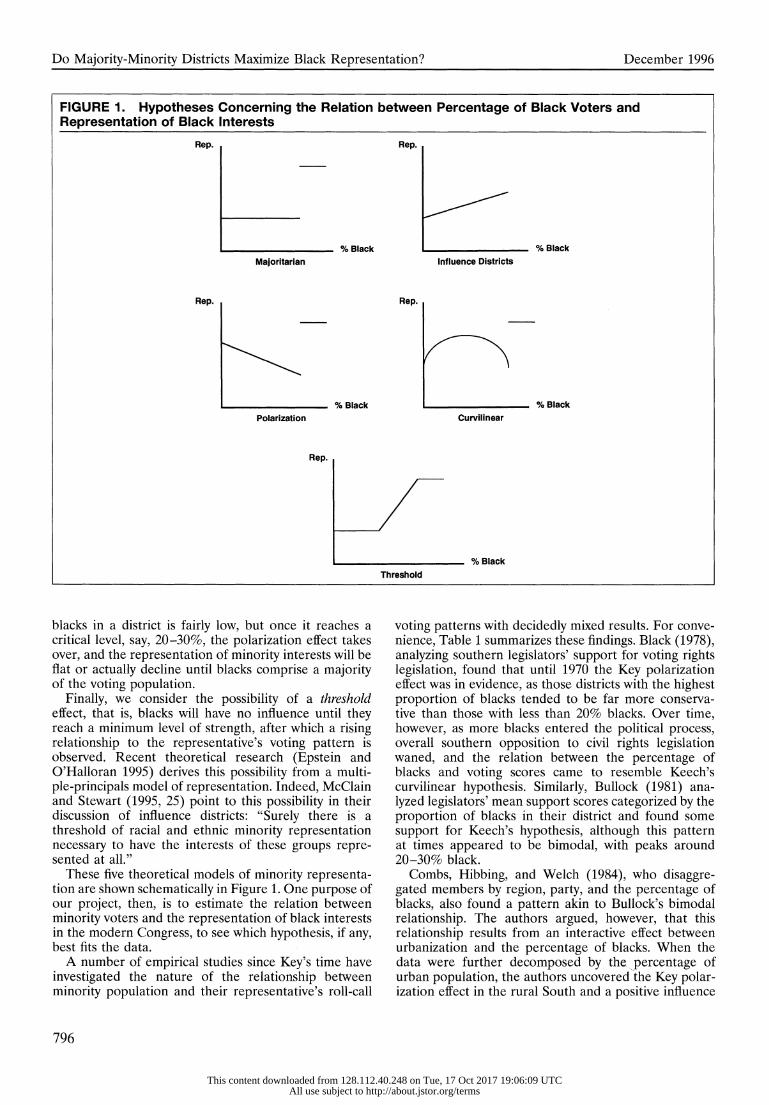
FIGURE 1. Hypotheses Concerning the Relation between Percentage of Black Voters and Representation of Black Interests
Rep. Rep.
% Black % Black
Majoritarian Influence Districts
Rep. Rep.
% Black % Black
Polarization Curvilinear
Rep.
________________________ % Black
Threshold
blacks in a district is fairly low, but once it reaches a critical level, say, 20-30%, the polarization effect takes over, and the representation of minority interests will be flat or actually decline until blacks comprise a majority of the voting population.
Finally, we consider the possibility of a threshold effect, that is, blacks will have no influence until they reach a minimum level of strength, after which a rising relationship to the representative's voting pattern is observed. Recent theoretical research (Epstein and O'Halloran 1995) derives this possibility from a multi- ple-principals model of representation. Indeed, McClain and Stewart (1995, 25) point to this possibility in their discussion of influence districts: "Surely there is a threshold of racial and ethnic minority representation necessary to have the interests of these groups repre- sented at all."
These five theoretical models of minority representa- tion are shown schematically in Figure 1. One purpose of our project, then, is to estimate the relation between minority voters and the representation of black interests in the modern Congress, to see which hypothesis, if any, best fits the data.
A number of empirical studies since Key's time have investigated the nature of the relationship between minority population and their representative's roll-call
796
voting patterns with decidedly mixed results. For conve- nience, Table 1 summarizes these findings. Black (1978), analyzing southern legislators' support for voting rights legislation, found that until 1970 the Key polarization effect was in evidence, as those districts with the highest proportion of blacks tended to be far more conserva- tive than those with less than 20% blacks. Over time, however, as more blacks entered the political process, overall southern opposition to civil rights legislation waned, and the relation between the percentage of blacks and voting scores came to resemble Keech's curvilinear hypothesis. Similarly, Bullock (1981) ana- lyzed legislators' mean support scores categorized by the proportion of blacks in their district and found some support for Keech's hypothesis, although this pattern at times appeared to be bimodal, with peaks around 20-30% black.
Combs, Hibbing, and Welch (1984), who disaggre- gated members by region, party, and the percentage of blacks, also found a pattern akin to Bullock's bimodal relationship. The authors argued, however, that this relationship results from an interactive effect between urbanization and the percentage of blacks. When the data were further decomposed by the percentage of urban population, the authors uncovered the Key polar- ization effect in the rural South and a positive influence
This content downloaded from 128.112.40.248 on Tue, 17 Oct 2017 19:06:09 UTCAll use subject to http://about.jstor.org/terms

American Political Science Review Vol. 90, No. 4
TABLE 1. Empirical Studies on the Relationship between Percentage of Blacks and Legislative Support for Minority Issues
Study Years Dependent Variable(s) Independent Variable(s) Findings Black (1978) 1957-75 Support for five voting Percentage of blacks in Starts with Key's polarization
rights acts district relation and, over time, turns into Keech's curvilinear relation
Bullock (1981) 1959-78 Mean LCCR support Percentage of blacks, party, Both Keech curvilinear and and CC opposition generational replacement, bimodal relationships score and deep South
Combs, 1973-80 CC support scores Percentage of blacks, party, Bimodal relationship, which Hibbing and race of representative, decomposes into influence Welch (1984) region, urban, and foreign districts for urban areas and
stock polarization for rural areas in the South; also, influence districts in the North
Whitby (1985) 1969-82 LCCR score Percentage of blacks, Percentage of blacks not urban, party, median significant, but the interaction education, and between black and urban is generational replacement significant
Whitby (1987) 1983-84 ADA, COPE, LCCR, Percentage of blacks, Percentage of blacks not ACA, CC, BI scores urban, party, income significant, but the interaction
between black and urban is significant
Lublin (1994) 1972-90 Nominate scores Percentage of blacks, Percentage of blacks significant, region, urban, party, with a structural break at 40% education, and income black population; no support for
quadratic or cubic relation
Note: LCCR = Leadership Conference on Civil Rights; CC = Conservative Coalition; ADA = Americans for Democratic Action; COPE = Committee on Political Education; ACA = Americans for Constitutional Action; BI = Black Index, defined by author; Nominate scores = constructed index from Poole and Rosenthal (1991).
district effect in the urban South and the North.3 Whitby (1985, 1987) again found that the interaction between black and urban proportions is an important determi- nant of representatives' voting scores. Lublin (1994) rejected nonlinear estimates of the relation between the percentage of blacks and a representative's voting be- havior in favor of a pattern of linear influence districts, with a structural break at 40% black population.4
Thus, statistical analyses of voting behavior offer no clear picture of the relationship between constituent characteristics and the representative's actions. Swain (1993) took a different approach to the question, inter- viewing all black members of the U.S. House (as of 1990) as well as white representatives of districts with a significant proportion of black voters to discover their positions on racial issues and governance. She argues that black representatives can win election outside ma- jority-black districts by emphasizing issues important to their broad constituency and that white representatives will advance some of the issues important to their black voters. Swain concluded that a majority-minority dis- tricting strategy has only limited possibilities and that multiracial districts offer the greatest avenue for advanc- ing minority political interests. Her larger project was to
3 Southern urbanization also figured prominently in Key's analysis: "The growth of cities contains the seeds of political change for the South" (1949, 673).
4Recently, Overby and Cosgrove (1996) found a significant relation between members' COPE scores and the change in their district's black population from 1992 to 1993.
argue that the future representation of minority interests should not be associated exclusively with the creation of majority-minority districts. As such, her research serves as a bridge between the studies that link voting behavior to the minority percentage in the electorate and the literature that focuses on the importance of minority- controlled electoral districts.
The Efficacy of Majority-Minority Districts
Swain's analysis is the latest chapter in a long debate over majority-black districts and the importance of elect- ing minorities to office (for overviews of this literature, see Davidson 1984 and Grofman and Davidson 1992). One side in this debate contends that the election of minority candidates is a necessary intermediary step, both symbolically and substantively, toward achieving racial political equality. Unless minorities have the power to elect candidates of their choice, the argument goes, their votes will be submerged in a sea of unsym- pathetic majorities. For instance, Davidson (1992, 46-7) argues: "As the political history of the southern states in the present era makes clear, whites have been quick to use the entire panoply of dilutionary measures to main- tain their advantage in officeholding.... Fairness alone dictates that the [Voting Rights] Act protect the ability of recently enfranchised minority voters to elect their candidates" (see also Cain 1992, Kousser 1993).
This argument is borne out in some of the earliest statistical studies linking black officeholding to concrete
797
This content downloaded from 128.112.40.248 on Tue, 17 Oct 2017 19:06:09 UTCAll use subject to http://about.jstor.org/terms

Do Majority-Minority Districts Maximize Black Representation? December 1996
policy gains. Keech (1968, 93) asserted that black polit- ical participation affected both electoral outcomes and the distribution of services in Durham, North Carolina, and Tuskegee, Alabama. Yatrakis (1981) concluded that the black mayor of Newark, New Jersey, brought signif- icant policy benefits to the black community. And Browning, Marshall, and Tabb (1984, 141) similarly found that the presence of minorities on local councils reduces polarization and stereotyping and also leads to "the creation of police review boards, the appointments of more minorities to commissions, the increasing use of minority contractors, and a general increase in the number of programs oriented to minorities" (for a further discussion of recent policy gains associated with black political participation and officeholding, see Mc- Donald 1992).
Increasingly, however, voices from within and without the civil rights community have begun to doubt the efficacy of majority-minority districts in securing minor- ity representation in the current legal and political climate. First, majority-minority districts rely on segre- gated housing patterns and are therefore less effective at uniting a widely dispersed minority, especially after the Shaw decision. Second, there is a fear that these districts may politically "ghettoize" minorities, limiting their in- fluence to a few safe black districts while marginalizing the minority vote elsewhere. This may result in the election of racially conservative candidates in other areas, offsetting the gains from the safe minority dis- trict.5
For instance, Brace, Grofman, and Handley (1987) found a positive and significant correlation between the number of majority-minority seats created in proposed South Carolina redistricting plans and the expected number of Republicans elected. More recently, Hill (1995) concluded that majority-minority districts cost the Democratic Party about six seats in the 1994 con- gressional elections. McDonald (1992, 81) notes that "increased minority participation has in turn caused an exodus of conservative white Democrats to the Repub- lican party. If the exodus continues, some have argued, the result could be an increasingly black but politically impotent Democratic party opposed by an increasingly white and dominant Republican party pursuing ever more racially regressive policies."6 Lublin (1994, 245) concluded that "efforts to maximize the number of black elected members of the House and pro-black congres- sional legislation tend to work at cross-purposes." Fi- nally, it has often been noted that majority-minority
- Along these lines, there is a lingering suspicion that the alacrity with which the Justice Department under presidents Reagan and Bush supported minority districts was partially motivated by potential Republican gains in southern states. See Polsby and Popper (1993) for an entertaining discussion of why Republicans benefit disproportion- ately from the construction of concentrated minority districts. 6 Similarly, Swain (1993, 205) quotes Craig Washington, a black U.S. House member from Texas; "If you have four districts in a state like Alabama, for example, with a sufficiently large black population to neutralize Republicans on some issues, and if you can create one black district by gathering up all the blacks, and in the process you lose the leverage that you had in the three other districts, then that's foolish to me. Every time the one person votes for the things that the black community is for, the other three will probably vote against them."
798
districts may hinder the formation of the biracial liberal coalitions that were the impetus behind the original civil rights campaign.
The overall efficacy of majority-minority districts in advancing black interests, therefore, remains unre- solved. These districts certainly increase the number of minority candidates elected to office, that is, the descrip- tive representation of minorities.7 But it is unclear that concentrated minority districts augment the substantive representation of minorities or the chance that legisla- tion favored by the minority community will be enacted by Congress.
Majority-Minority Districts and the Representation of Minority Interests
We have reviewed two literatures, one relating the percentage of black voters in a district to their represen- tative's voting behavior and the other debating the benefits of majority-minority districts. Although we have treated them separately, it is clear that they are inti- mately related. Assume, for instance, that the relation- ship between the percentage of blacks and support for legislation favorable to minorities is exactly linear, either increasing or decreasing. It then makes no difference how minorities are distributed throughout districts, as the average level of support will be the same in all cases.8 If a minority group is underrepresented unless it com- prises a majority in the jurisdiction, however, then the best way to ensure minority enfranchisement is to create as many majority-minority districts as possible. Finally, if partisan effects are the most significant feature in the political landscape, then reapportionment schemes which result in both minorities and Republicans being elected may decrease the overall average support for minority concerns.
Thus, in general, the representation relation and the optimal distribution of minority voters across districts are closely intertwined. To be more precise, an accurate measure of the former will allow us to calculate the configuration that gives minorities the greatest expected overall substantive representation. This may involve the construction of many concentrated minority districts, or few, or none. We investigate this question by first estimating the relationship between the percentage of black voters and legislators' representation scores. We then estimate the link between the black voting-age population and the probability of electing a black Dem- ocrat, nonblack Democrat, or a Republican to office in each of three geographic regions. Finally, we estimate the optimal apportionment of minority constituents in
7 See the essays in Davidson and Grofman (1994) for clear evidence that increased minority officeholding in the South is due almost entirely to the creation of majority black voting districts. 8 Assume the relation between representation and percentage of black voters is Rep = a + b * (%black). Consider a state with n districts and
Pb percentage of black voters. Then, total representation will be equal to na + b * Pb and average representation (a + b * Pb)/n, no matter how minority voters are divided among districts. This implies that linear methods for calculating representation will not be effective for devising optimal districting strategies.
This content downloaded from 128.112.40.248 on Tue, 17 Oct 2017 19:06:09 UTCAll use subject to http://about.jstor.org/terms
American Political Science Review Vol. 90, No. 4
TABLE 2. Data Sources, Descriptive Statistics, and Coding Rules Variable Description Mean Minimum Maximum Source LCCR Member's civil rights voting 59.6 7.7 100 Leadership Conference on Civil Rights,
record Civil Rights Voting Record for the 103rd Congress
MODCQ Support for measures in 54.68 4.0 100 Congressional Quarterly, Key Votes of which more than 60% of the 103rd Congress black representatives voted alike
Party 1 for Republicans; 0.41 0 1 Barone and Ujifusa, Almanac of 0 otherwise American Politics, 1994
Race Race of member: 1 for 8.7% 0 1 Congressional Quarterly, vol. 52, black; 0 otherwise supplemental to issue no. 44, p. 10
BVAP Percentage of blacks of 10.96% 0.099% 72.14% 1990 Census data voting age in the district
Cover 1 if district is covered 28.7% 0 1 Bott, Handbook of U.S. Election Laws under Section 5 of the and Practices, pp. 249-51 and 257- VRA; 0 otherwise 62
South 1 for southern states; 31.3% 0 1 Congressional Quarterly Almanac, 1994 0 otherwise
Eastb 1 for eastern states; 21.0% 0 1 Congressional Quarterly Almanac, 1994 0 otherwise
Note: LCCR Leadership Conference on Civil Rights; CQ = Congressional Quarterly, BVAP = black voting-age population; Cover = judicial oversight under the Voting Rights Act. aAlabama, Arkansas, Florida, Georgia, Kentucky, Louisiana, Mississippi, North Carolina, Oklahoma, South Carolina, Tennessee, Texas, and Virginia. bConnecticut, Delaware, Maine, Maryland, Massachusetts, New Hampshire, New Jersey, New York, Pennsylvania, Rhode Island, Vermont, and West Virginia.
each region that maximizes substantive representation in Congress.
THE DATA
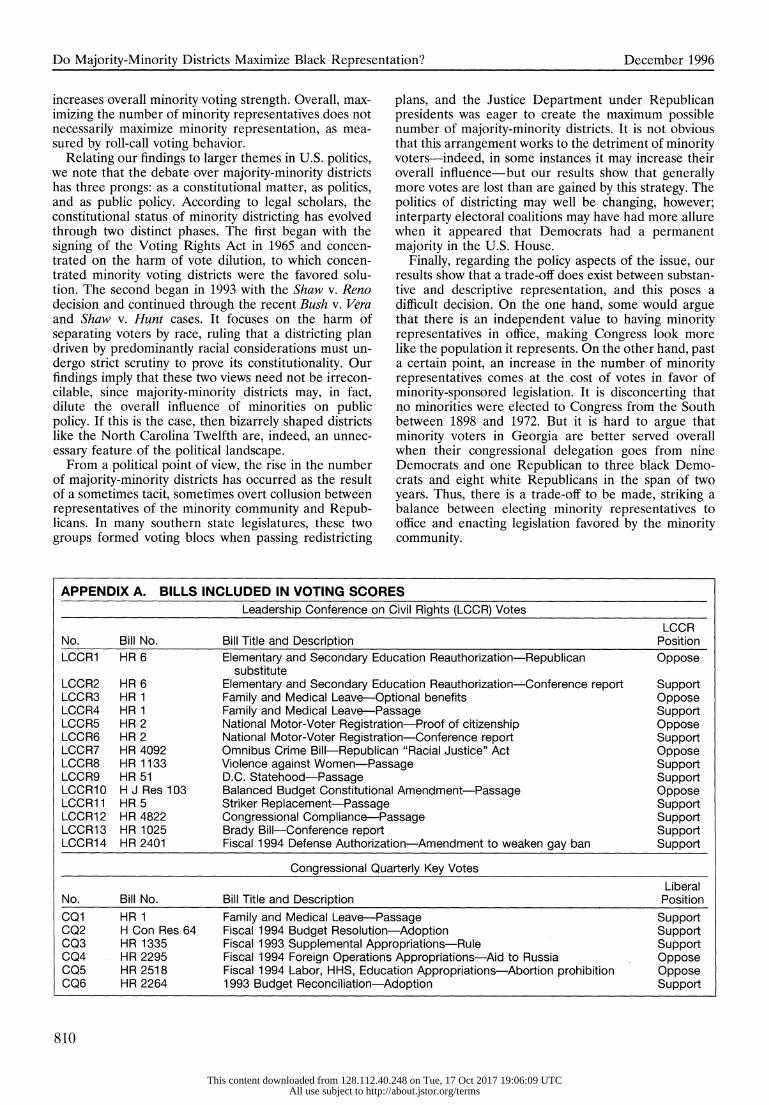
Table 2 describes the data used in the analysis. Legisla- tors' support for minority issues is measured by the Leadership Conference on Civil Rights index (LCCR) for the 103rd Congress, which is compiled from votes cast on 14 bills considered important to minority inter- ests.9 Since failure to vote lowers these scores, we have undertaken the standard procedure for attendance-cor- recting, eliminating from the total possible votes those measures on which a member did not actually cast a ballot. If a member was replaced through retirement or death, we calculated the average district support score.10
9 Swain (1993) argues that the LCCR index captures only a member's position on civil rights issues and not overall support for redistributive policies that also may be important to black constituents. To account for this possibility, we constructed another measure, labeled modified Congressional Quarterly index (MODCQ), based on the Congressional Quarterly key votes for the 103rd Congress. We identified the position adopted by the majority of black representatives and coded whether a member voted with this majority. Issues that divided the Black Caucus votes on which less than 60% of its members voted the same way were eliminated from the sample. The votes included in both the LCCR and MODCQ indexes are provided in Appendix A. As the correlation between these indexes is 0.96, we use only LCCR scores in our analysis. "I Two districts changed partisan alignment in midsession. The roll calls from the first (Oklahoma 6th) were eliminated from the sample, although the election was used in calculating the electoral equations. In the second (Kentucky 2d), nine of the eleven votes were cast by Natcher (D) and only two were cast by Lewis (R). The district was
The mean LCCR support score for all members was 59.6, ranging from a low of 7.7 to a high of 100.
Two comments are in order about our use of LCCR scores as a measure of minority representation. First, there is the issue mentioned above of descriptive as opposed to substantive representation. If descriptive representation is an overriding goal, then there can be no substitute for policies that favor the election of minorities to office, just as in the classic arguments for affirmative action. In practice, however, majority-minor- ity districts have been neither sanctioned by the courts nor pursued by the Justice Department on the grounds of descriptive representation; the avowed goal has al- ways been to increase the possibility that minorities can affect public policy by electing the candidate of their choice, regardless of race. There is also the "slippery- slope" argument that, once descriptive representation is acknowledged as a goal, it will be difficult to define exactly which groups should be afforded such an oppor- tunity. Therefore, we investigate the effect of majority- minority districts on substantive representation and then examine the implications of the analysis for the number of minority candidates elected to office.
Second, the question arises as to whether the positions embodied in the LCCR votes are (1) merely liberal policies which are not actually helpful to the minority community and/or (2) not what the minority community actually wants, given a split in opinion between black elites and voters. Certain commentators have argued, for
coded as Democratic, and only those votes cast by Natcher were included in the analysis.
799
This content downloaded from 128.112.40.248 on Tue, 17 Oct 2017 19:06:09 UTCAll use subject to http://about.jstor.org/terms
Do Majority-Minority Districts Maximize Black Representation? December 1996
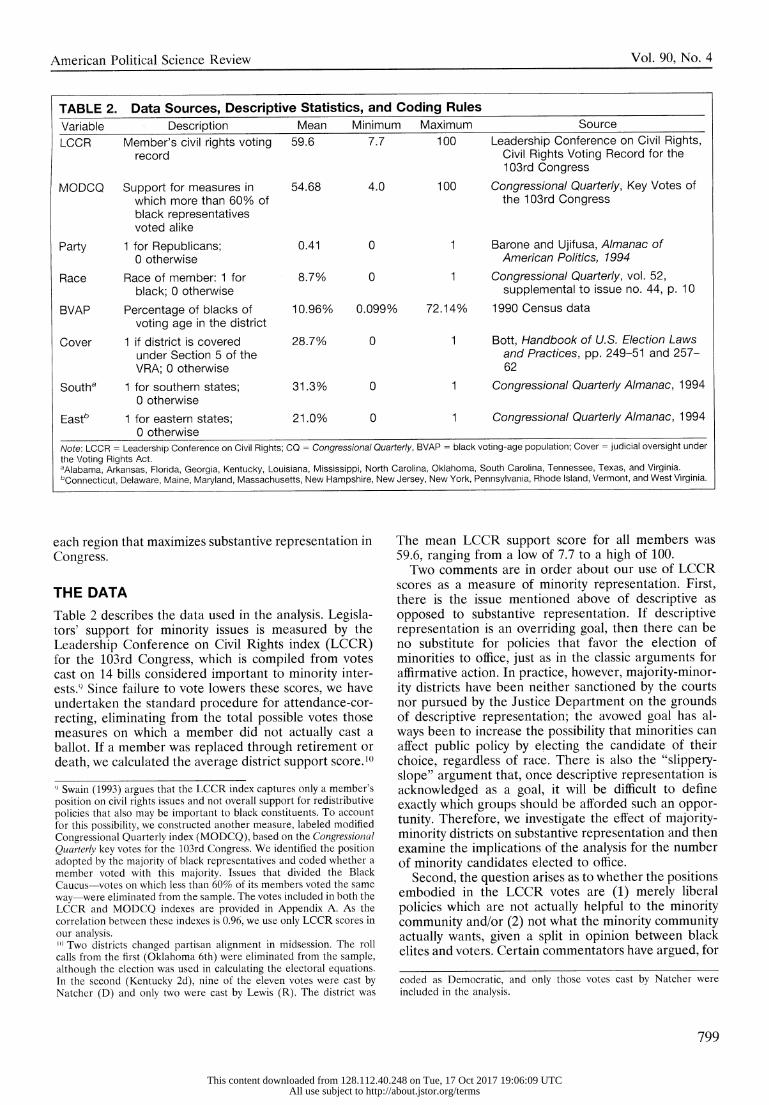
FIGURE 2. Relation between Black Voting Age Population and LCCR Voting Index Score o. A ******- A A A A* I A -**v* * ** ** I
ao I t *te** *** * / I I
O _ **v* * ** ** * */
2 ****** *** * *
OX v * o *o *** * ** I
o 0 0 0 o4 * -- *
C\J
'? 1 0 ? ooooo | Republicans _ o* Nonblack Democrats A 2 | Black Democrats
0
? I I I I I
0.0 0.1 0.2 0.3 0.4 0.5 0.6 0.7
Percentage BVAP in District
instance, that liberal programs have failed to secure economic advancement for minorities and that alterna- tive policies might better serve these populations. We do not pretend to answer the questions of whether the policy positions characterized by these votes are "cor- rect" or whether each of these votes corresponds with the underlying preferences of the minority community. We do assert, however, that whatever the substantive opinions of the minority community, they are likely to be closer to the policy positions taken by legislators in districts with a substantial population of minority voters as opposed to districts with fewer minority constituents. The high correlation between LCCR scores and the MODCQ index, which is constructed from votes actually cast by black legislators, therefore suggests that LCCR scores are a reasonable measure of substantive minority interests.
The key independent variable in the analysis is the black voting-age population (BVAP) in each district as a proportion of total population. We also record each representative's region: South, East, and other. A num- ber of studies have tried to capture additional subre- gional distinctions by including a Deep South variable. A better proxy for historic discrimination against minori- ties is to control for whether a district is covered under the preclearance procedures of the 1965 Voting Rights Act, as amended.1" The variable Cover codes which
I In 1975, the Voting Rights Act was amended to include language minorities (mostly Hispanic) as well as racial minorities.
800
districts are subject to judicial oversight of any changes to electoral systems or reapportionment plans. In our sample, 125 districts are covered, including 95 out of 137 districts in the South.
Finally, we have recorded the race and partisan affil- iation of each member. The 103rd Congress had 38 black members, all but one of them Democrats. The partisan division for the Congress was 256 Democrats, 177 Re- publicans, and one Independent.12
We first determined the appropriate level of aggrega- tion for our analysis. Figure 2 plots BVAP against LCCR scores for all members of the 103rd Congress. Included in the figure is an extremely flexible, highly data-sensi- tive regression line, a local regression or lesss" line.13 The less line indicates a generally rising pattern, with some evidence of bimodality at 20-30% BVAP. The figure also clearly identifies three distinct populations in the data: black Democrats, confined almost exclusively to the upper right quadrant of the figure; nonblack Democrats, located primarily in the upper left quadrant;
12 Bernie Sanders (I-Vermont) is coded as a Democrat. The one black Republican in the 103rd Congress was Gary Franks, from Connecticut; his LCCR score of 0.21 was similar to that of other northeastern Republicans. 13 Loess fitting, which we employ below, has become a workhorse of
modern nonlinear, nonparametric regression analysis. See Hardle (1990), Fox (1991), Chambers and Hastie (1993), and Venables and Ripley (1994); Cleveland (1993, 93-101) provides an- accessible intro- duction to less fitting, including an overview of the computational details.
This content downloaded from 128.112.40.248 on Tue, 17 Oct 2017 19:06:09 UTCAll use subject to http://about.jstor.org/terms

American Political Science Review Vol. 90, No. 4
TABLE 3. Average Black Voting-Age Population and Leadership Conference on Civil Rights Scores by Subgroup
BVAP LCCR Number of
Subgroup Mean Median Mean Median Districtsa (1) Nonnortheastern Republicans 5.12% 3.70% 0.19 0.14 133 (2) Northeastern Republicans 5.22 3.94 0.35 0.35 42 (3) Southern nonblack Democrats from covered districts 14.49 15.31 0.62 0.57 47
(4) Southern nonblack Democrats from noncovered districts 10.20 7.33 0.71 0.71 21
(5) Nonblack Democrats from outside the South 6.24 3.72 0.90 0.93 154
(6) Black Democrats 54.25 55.79 0.99 1.00 37
All representatives 10.96% 4.87% 0.60 0.70 434 aThe 6th District in Oklahoma changed partisan alignment in midsession and was eliminated from the sample. See footnote 10.
and Republicans, located predominately in the lower left quadrant.
The analysis that follows is therefore performed at the subnational level, allowing us to capture important regional and partisan variations in the data. A well- chosen set of subgroups will display fairly cohesive behavior within each group but different behavior across groups. Earlier studies, as well as Figure 2, indicate the importance of party, race, region, and coverage under Section 5 of the Voting Rights Act in predicting repre- sentatives' voting behavior. These factors suggest that the data be partitioned into the six subgroups shown in Table 3.
ESTIMATING REPRESENTATION AND ELECTORAL EFFECTS
In this section we estimate representation and electoral equations, which we will then combine to simulate optimal districting strategies. This two-step procedure allows us to capture the underlying trade-off between electing minority candidates and the overall representa- tion of minority interests. It also allows us to calculate the effect of changing electoral conditions, such as a surge in Republican popularity, on policy outcomes.
Notice also that the estimations below are bivariate, including BVAP as an independent variable but exclud- ing other socioeconomic indicators, such as education, income, and urbanization, that are often used as covari- ates in analyses of voting behavior. We employ bivariate analysis because the estimated relations will be used in simulations that implicitly reallocate black voters across districts within a state. But this redistricting will, on average, change levels of the other socioeconomic vari- ables as well, both in the districts from which voters were taken and the districts to which they are given. A standard multivariate analysis of voting scores or elec- toral probabilities would thus misrepresent the effects of voter reallocations, since such an analysis would hold factors like urbanization constant as racial composition shifts, rather than let them vary, as does bivariate analysis. 14
14 The reasoning here is similar to that used in the related area of
Representation Equations
We first estimate representation equations, which detail the effect of black voters on their representative's voting behavior. In particular, we calculate members' expected LCCR score given the level of BVAP in their district and the subgroup 0 from which the representative is drawn:
E(LCCRIBVAP, 0). (1)
The following method of analysis is employed in each of the six subgroups. First, we estimate general additive models using less and smoothing splines, another flex- ible and potentially nonlinear, nonparametric regression method. Next, we employ an appropriate statistical test, an F test, to determine whether nonlinearities are nec- essary to describe the relationship. If this analysis reveals an essential nonlinearity in the data, we reproduce the nonlinear relationship with a parametric regression that closely tracks the less fit. Otherwise, we summarize the relationship in a linear fashion.
For our linear estimation, we employ ordinary least squares (OLS) analysis, along with two variants of OLS that downplay the influence of outliers, a notorious weakness of standard linear regression models. The first, denoted the robust method, is based on group medians rather than means. The second, denoted the resistant method, deemphasizes both outliers and influential ob- servations.15 Both methods are less drastic than discard- ing extreme observations. We then select the estimator that best tracks the less fit.16
Figure 3 summarizes the relation between BVAP and
determining whether voting in a given area is racially polarized. Here, too, the courts have decided that bivariate correlations are more appropriate than mutivariate regressions. For a discussion, see Grof- man, Handley, and Niemi (1992, 83-93). 15 For the robust method we employ the rlm function in S-Plus, provided by Venables and Ripley (1994), which uses Huber's M- estimator. For the resistant method, we use the ltsreg procedure in S-Plus, which implements Rousseeuw and Leroy's (1987) least trimmed squares regression. This procedure minimizes the sum of the smallest half of the squared residuals. Venables and Ripley (1994), in chapter 8, provide details on both procedures; the ltsreg procedure produces no standard errors. 16 As a diagnostic check, we identified influential observations via their Cook's distances and reran the linear regressions deleting the influen-
801
This content downloaded from 128.112.40.248 on Tue, 17 Oct 2017 19:06:09 UTCAll use subject to http://about.jstor.org/terms

Do Majority-Minority Districts Maximize Black Representation? December 1996
FIGURE 3. Representation Equations by Subgroup
Other Republicans Northeast Republicans Southern Nonblack Democrats, Covered
0~~~~~~~~~~~~~~~~~(
LA * s o |0 0~~~~~~~~~~~~~~~~~
0.0 0.10 0.20 0.0 0.05 0.10 0.15 0.0 0.1 0.2 0.3
BVAP BVAP BVAP
Southern Nonblack Democrats, Noncovered _ Other Nonblack Democrats Black Democrats
TI,~ ~ ~~~~~~
0~~~~~~~~~~
o * o D-?
0.05 0.10 0.15 0.20 -7 . -5 4 -3 -2 -1 0.2 0.4 0.6
BVAP log(BVAP) BVAP
LCCR in each subgroup. Shown in each panel of the figure are less fits along with the fit from our best parametric estimate of the relationship. In all cases, the selected model tracks the less fit rather well.
Table 4 provides more detail. The row labeled "Pr(F)" provides the probability value for an F-test of the models LCCR = a + b * BVAP and LCCR = a + b * s(BVAP),
where s(Q) denotes a nonparametric smoothing spline.17 Only for Northeast Republicans is the nonlinearity statistically significant, as shown by the less fit in Figure 3. For nonblack Democrats outside the South, the distribution of black voting-age population is highly skewed toward rural regions; re-expression of the inde- pendent variable as log(BVAP) corrects this skew so that a linear model may be appropriately applied.18 The values in the row labeled Average Estimated LCCR
tial observations. In no case was there, for example, a sign reversal, which would indicate a major problem with outliers. 17 We use the s ( ) function in S-Plus, which fits a cubic smoothing spline with df = 4. All the less fits in Figure 3 were generated by the S-Plus function scatter.smooth, which employs a span of 2/3. See Chambers and Hastie (1993, Section 7.4.1) for details. 18 In category 5, all results shown are for the independent variable log(BVAP). So the F-test indicates that, following reexpression, no additional nonlinearity is essential in describing the data.
802
calculate the value of the selected model at the mean BVAP level in the group. The resulting estimated LCCR score can then be compared to the actual median and mean values shown in the first two rows of the table. In all cases the selected model produces estimated LCCR scores close to the actual mean and median values.
The nonlinear parametric model selected for North- eastern Republicans is a step function with a ramp between the steps. The function is:
0.2732 if BVAP ' 0.04
0.2732 + 5.604 * (BVAP - 0.04) if LCCR 1 0.04 ? BVAP ? 0.08
L 0.4974 if BVAP > 0.08.
Two parameters are estimated, the first being the lower intercept and the second a term that jointly determines the slope of the ramp and the distance between the two steps. The t-value for first parameter is 8.2, while that of the second is 3.6.19 As seen in Figure 3,
19 The actual function estimated, using the S-Plus code, is:
LCCR = [0.2732 + 5.6044x] * [I(I((x 0 0.04) * (c 0.08)
* (x - 0.04)) + I(0.04 * (x > 0.08)))].
This content downloaded from 128.112.40.248 on Tue, 17 Oct 2017 19:06:09 UTCAll use subject to http://about.jstor.org/terms

American Political Science Review Vol. 90, No. 4
TABLE 4. Representation Equations for LCCR Scores, by Subgroups
Subgroup
Nonblack Nonblack Southern Southern Nonblack
Nonnortheastern Northeastern Democrats, Democrats, Democrats Black Republicans Republicans covered noncovered Outside South Democrats
LCCR median .14 .35 .57 .71 .93 1.00 mean .19 .35 .63 .71 .89 .99
BVAP median .04 .04 .15 .08 .04 .56 mean .05 .05 .15 .10 .06 .54
Linear Model intercept .20 (.01) .27 (.04) .67 (.06) .74 (.07) 1.00 (.03) .99 (.03) slope -.17 (.15) 1.57 (.66) -.32 (.36) -.32 (.58) .03 (.01) -.01 (.06)
Robust Model intercept .17 (.006) .25 (.04) .69 (.06) .77 (.05) .99 (.02) 1.00 (0.0) slope -.10 (.08) 1.60 (.61) -.41 (.36) -.47 (.45) .02 (.008) .00 (0.0)
Resistant Model intercept .14 .10 .57 .77 1.02 1.00 slope 0.00 4.20 -.42 -.59 .01 .00
General additive Pr(F) .67 .02 .51 .19 .53 .37
Final Model robust nonlinear robust robust robust robust Averge Est. LCCR .16 .33 .62 .73 .95 1.0 N 134 42 47 21 154 37
Note: The nonlinear parametric model selected for Northeastern Republicans is discussed in the text. Average estimated LCCR is calculated using the final model at the mean BVAP level. Standard errors are given in parentheses.
the representation pattern here exhibits a clear thresh- old effect.
The analysis provides some interesting evidence con- cerning the polarization hypothesis. The estimated mod- els in subgroups 1, 3, and 4 indicate that representatives' LCCR scores decrease as the percentage of black voting age population increases. Yet, the effect is sufficiently small in magnitude to prevent rejecting the hypothesis that no polarization effect exists, given the precision of the estimates of the slope coefficients. Comparisons across groups, as shown in Figure 3, clearly indicate that the polarization effect is dwarfed in magnitude by shifts across subgroups, for example, from Republican, to nonblack Democrat, to black Democrat. Therefore, the large polarization effect visible in Figure 2 seems to be an artifact of mixing together several distinct popula- tions, none of which individually displays a similar pattern.
Notice, too, that support for minority issues is strong among nonblack Democrats, especially outside the South. Although not quite as high as for black Demo- crats, the LCCR scores of these representatives are generally around 80% on the index. Even in the South, the gap between nonblack Democrats and Republicans is quite significant. This highlights again a basic trade-off in reapportionment decisions: whether to place blacks in majority-minority districts, where they can increase the probability of a black Democrat being elected, or to place them elsewhere, to boost the chances of any Democrat winning a seat rather than a Republican, who is likely to be unsupportive of minority positions.
Electoral Equations
The preceding analysis suggests that LCCR scores are relatively constant within the six subgroups but differ widely across them. The percentage of BVAP may thus have its largest effect by influencing the distribution from which a representative is drawn; that is, in determining whether the elected representative is a Republican, a nonblack Democrat, or a black Democrat. In this section we estimate equations relating the size of the black voting-age population to the type of representative elected (0):
P(O I BVAP). (2)
The small number of black representatives and their geographic concentration make it impossible to estimate the electoral equations using a trinomial logit model disaggregated by region (estimation routines in standard computer programs fail to converge). Therefore, we conducted sequential logit analysis to determine the model specification that best fits our data while retaining regional and partisan characteristics. The results from this portion of the analysis can be summarized fairly succinctly. Both portions of the sequential logit models were estimated using smoothing splines. Neither the logit for black Democrats, estimated at the national level, nor the three separate logits for nonblack repre- sentatives displayed important nonlinearities, using the nonparametric Chi-squared test.20 Accordingly, all mod- els were fit using a general linear model that includes a
20 See Chambers and Hastie (1993, 262, 306).
803
This content downloaded from 128.112.40.248 on Tue, 17 Oct 2017 19:06:09 UTCAll use subject to http://about.jstor.org/terms
Do Majority-Minority Districts Maximize Black Representation? December 1996
TABLE 5. Final Electoral Equation, Multinomial Logit
Category
Nonblack Variables Democrats Republicans
Constant 12.15 12.44 (4.17) (4.18)
BVAP -43.43 -54.01 (14.97) (15.17)
BVAP*East 17.38 21.98
(7.31) (7.93)
South 5.21 5.86
(2.91) (2.92)
Log-likelihood -268.34
x2 (6) 262.85
Percentage correctly predicted 61%
Percentage
Improvement 20%
Predicted
Black Nonblack Repub- Actual Democrats Democrats licans Total
Black Democrats 35 2 0 37 Nonblack Democrats 2 147 73 222
Republicans 0 92 84 176
Total 37 241 157 435
Note: Standard errors are given in parentheses.
dummy variable intercept term for the South and an interactive slope term East*BVAP.
The resulting multinomial logit model, with various summary statistics, is shown in Table 5. Like all multi- nomial logit models, it is appropriate only if the data display the independence of irrelevant alternatives (11A) property (Greene 1993, 670-2). A procedure devised by Hausman and McFadden (1984) is commonly employed to test for the validity of the 11A assumption; application of this test to the model in Table 5 fails to reject the null hypothesis that the property holds.
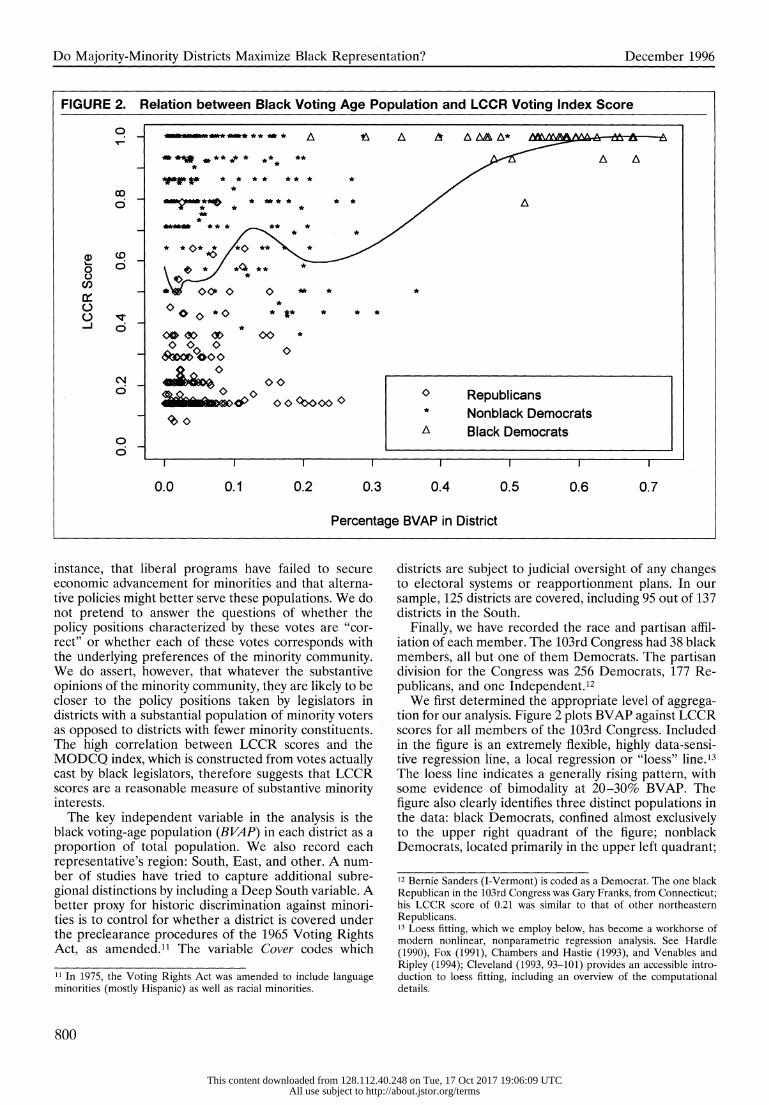
Figure 4 displays the results of the electoral analysis in an easily interpretable fashion. Each panel shows the estimated probabilities that a representative is a Repub- lican, nonblack Democrat, or black Democrat for all possible levels of BVAP in a given region. At any level of BVAP, the three probabilities sum to one; the most likely representative at any level of BVAP is given by the uppermost of the three lines. The figures show the dramatic effect of black voting-age population on the partisan and racial identity of representatives. If a district has low levels of BVAP (0-10% in the South, 0-5% outside the South), the most likely partisan iden- tity of the representative from that district is Republi- can, and it is exceedingly unlikely the representative is a black Democrat. At somewhat higher levels of BVAP (10-30% in the South, 5-30% in the Northwest,
804
5-20% in the Northeast), the most likely partisan iden- tity of a representative is Democrat, though it remains possible the representative is Republican; in this range it remains quite unlikely the representative is black. At a sufficient concentration of minority voters (starting at 30% in the South and Northwest, at 20% in the North- east), the probability that the representative is a black Democrat increases very rapidly, soon becoming a vir- tual certainty.
There are important differences across regions, per- haps best summarized by the concentration level of BVAP required to achieve a 50% probability that the elected representative is a black Democrat, that is, the point of equal opportunity for minority voters to elect their candidate of choice. As shown in Figure 4, in the South the required level of BVAP is 40.3%; in the Northwest, 47.3%; in the Northeast, only 28.3%. These figures carry a number of important implications. It is rarely necessary for minority voters to be a clear majority within a district to have a good chance of electing a minority representative, and the 65% rule enforced by the courts certainly seems excessive. By the same token, black candidates seem to have a fair chance of winning election, even in districts with a white majority (so-called minority-minority districts). Thus, Swain's emphasis on the electoral possibilities in these districts is consistent with our findings.
Figure 4 suggests that the probability of electing a Republican in the South is fairly high at low levels of black participation. The likelihood is far less in the Northwest, while the Northeast presents a middle case. Furthermore, nonblack Democrats retain a fairly high chance of winning in the Northeast, even with significant portions of black voters in the district. This may be due to the fact that liberal northeastern Democrats do a good job of representing their black constituents' con- cerns. It also may reflect the presence of liberal Demo- cratic machines in many large northeastern cities.
Finally, we point out the fact that the electoral equations estimate the probability of different types of representatives being elected, given present turnout. If minority turnout were to increase so that minority candidates would stand a greater chance of winning in any given region, for example, then this would be reflected in Figure 4 by raising the estimated black Democrat probability line. Thus, although turnout ef- fects are not explicitly built into our estimation proce- dure, they do influence our final results.
OPTIMAL DISTRICTING FOR SUBSTANTIVE MINORITY REPRESENTATION
The previous section estimated representation effects, the influence of minority constituents on their legisla- tor's voting behavior, and electoral effects, the relation between the composition of the electorate and the type of representative elected. Our analysis showed that the representation effect was small or negligible: Within any given subgroup of representatives, an increase in the percentage of black voters in a district had little influ- ence on voting patterns. Taken alone, this information might seem to lend support for majority-minority dis-
This content downloaded from 128.112.40.248 on Tue, 17 Oct 2017 19:06:09 UTCAll use subject to http://about.jstor.org/terms

American Political Science Review Vol. 90, No. 4
FIGURE 4. Probability of Election of Three Types of Representatives by Percentage Black in District, by Region
Probability
1 Nonblack Democrat Black Democrat
0.8.
0.6
South 40.29% 0.4
0.2 Republican
0.2 0.4 0.6 0.8 1 %BVAP
Probability
Nonblack Democrat Black Democrat 0.8.
0.6
Northwest 47.29% 0.4
02 Republican
0.2 0.4 0.6 0.8 1 % BVAP Probability
1 / ~~~~~~~~Black Democrat Nonblack Democra
Northeast 0.6 - - - 28.43%
0.4 \-A
0.2 Republca
0.2 0.4 0.6 0.8 1%BVAP
tricts, as black representatives do, indeed, consistently show the highest level of support for minority issues.
Yet, the electoral effect of minority voters proved to be much more significant, as the BVAP in a district has a substantial influence on the partisan and racial char- acteristics of the representative. And while it is certainly true that majority-minority districts are quite likely to elect a minority representative, Figure 4 indicates that high concentrations may be unnecessary to secure mi- nority electoral opportunities. The basic question, then, is whether the marginal gain in the probability of
electing a black Democrat from a majority-minority district is sufficient to offset the marginal loss of influ- ence in other districts.
Expected LCCR Scores
To answer this question, we first calculate the expected LCCR score of a representative in each geographic region, depending on the level of BVAP. This is done by simply combining figures 3 and 4. For each region, we estimate the probability of electing each type of repre-
805
This content downloaded from 128.112.40.248 on Tue, 17 Oct 2017 19:06:09 UTCAll use subject to http://about.jstor.org/terms
Do Majority-Minority Districts Maximize Black Representation? December 1996
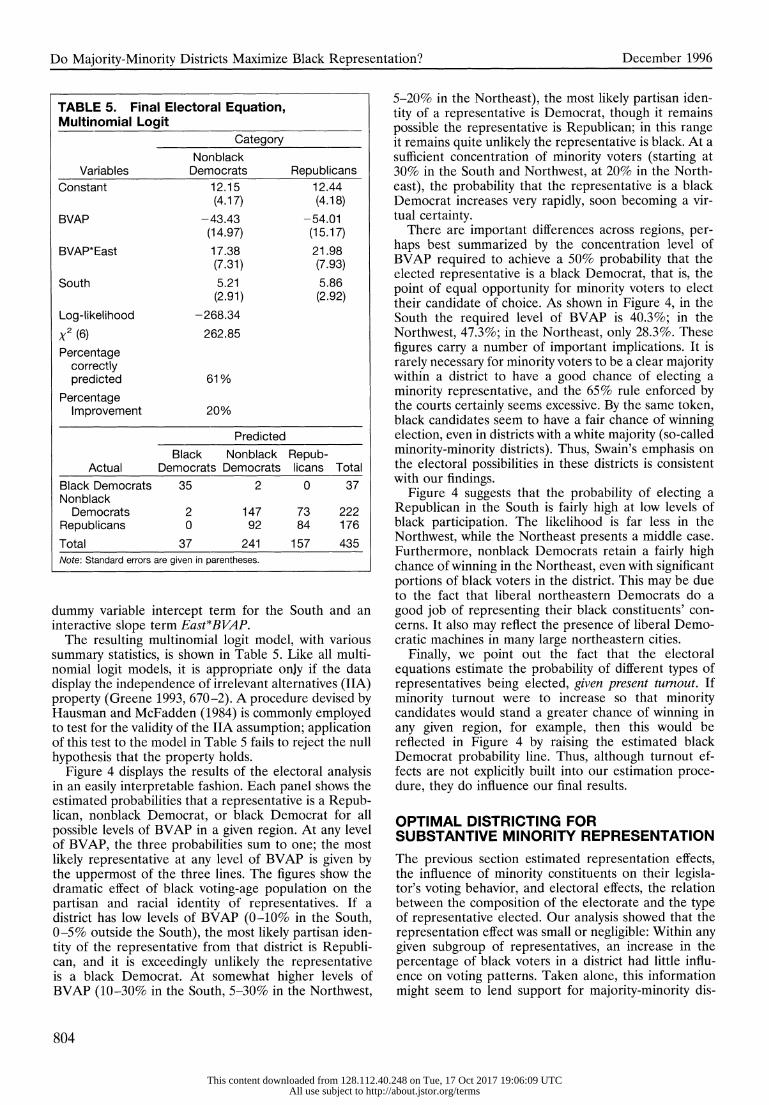
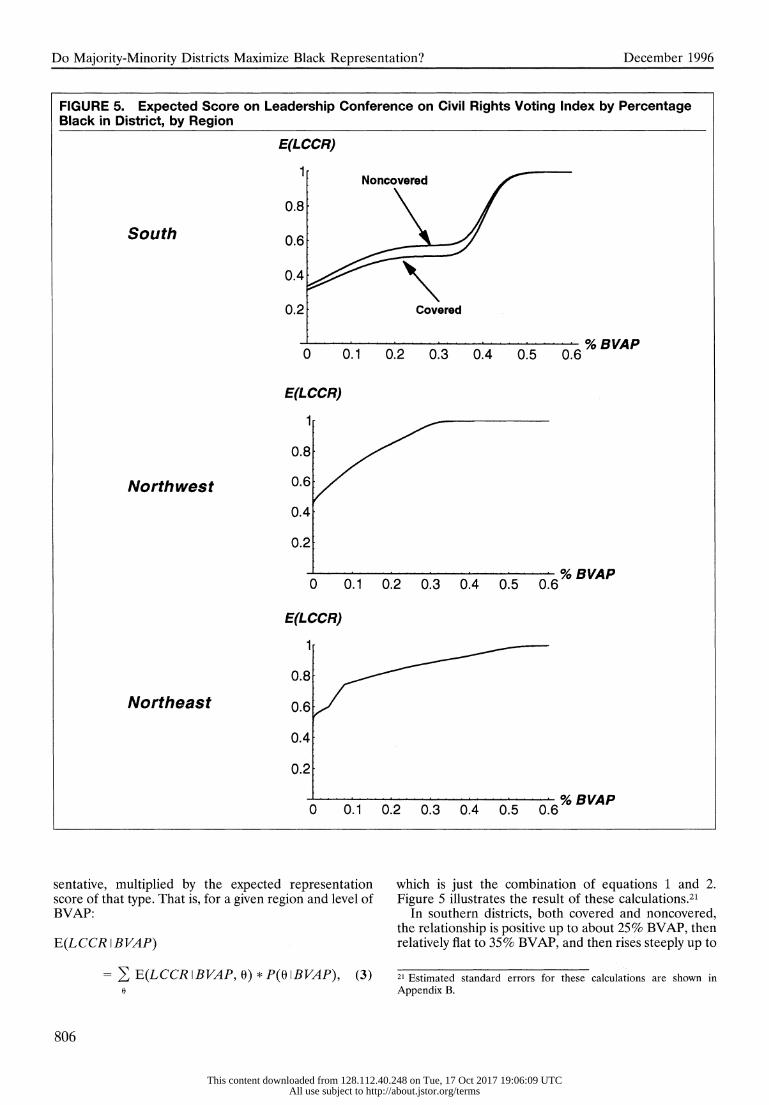
FIGURE 5. Expected Score on Leadership Conference on Civil Rights Voting Index by Percentage Black in District, by Region
E(LCCR)
1.8 | Noncovered
0.8
South 0.6
0.2. Covered
% BVAP 0 0.1 0.2 0.3 0.4 0.5 0.6
E(LCCR)
0.8
Northwest
0.4.
0.2
% BVAP 0 0.1 0.2 0.3 0.4 0.5 0.6
E(LCCR)
0.8.
Northeast 0.6
0.4
0.2
% BVAP 0 0.1 0.2 0.3 0.4 0.5 0.6
sentative, multiplied by the expected representation score of that type. That is, for a given region and level of BVAP:
E(LCCR IBVAP)
= EE(LCCRIBVAP, 0) *P(OIBVAP), (3) 0
806
which is just the combination of equations 1 and 2. Figure 5 illustrates the result of these calculations.21
In southern districts, both covered and noncovered, the relationship is positive up to about 25% BVAP, then relatively flat to 35% BVAP, and then rises steeply up to
21 Estimated standard errors for these calculations are shown in Appendix B.
This content downloaded from 128.112.40.248 on Tue, 17 Oct 2017 19:06:09 UTCAll use subject to http://about.jstor.org/terms

American Political Science Review Vol. 90, No. 4
50% BVAP. The noncovered line follows a similar pattern but is slightly higher than for covered districts. Overall, these findings attest to the importance of white Democrats in southern districts. Although neither Re- publicans nor Democrats represent black interests as well as do black Democrats, white Democrats are still more supportive than are Republicans. So, although adding black voters to a district does not change the voting pattern of any given representative (if anything, it slightly decreases black representation), it does increase the probability of electing a Democrat over a Republi- can. Once again, the electoral effect dominates the representation effect.
This pattern is even clearer in the other two geo- graphic regions. In the Northwest, the relationship in- creases steadily to about 35% BVAP, when it levels off at 1.00; by the time a district reaches 35% BVAP, it is virtually certain to elect a Democrat. As any Democrat in this area represents black interests well, the marginal effect of adding minority constituents beyond 35% is negligible.
In the Northeast, the relationship rises sharply until about 10% BVAP, due to the threshold effect from Northeastern Republicans, and then rises more gently to about 55%. Notice that with only 10% BVAP in a district, the expected support score is nearly 80%. Again, this reflects the general liberal outlook of both Demo- crats and Republicans from the Northeast.
Simulation Equations: The Overall Representation of Black Interests
Given the relationships in Figure 5, what districting strategy maximizes substantive minority representation in each region of the country? That is, given a fixed number of districts and percentage of black voters in the population, which configuration maximizes the average support for minority legislation in a state's congressional delegation? Notice that by posing the question in this manner, we automatically account for the fact that placing more black voters in one district will necessarily reduce their number in surrounding districts.
An argument could be made at this point that the relevant statistic for measuring representation is the median LCCR score of a state's congressional contin- gent, rather than the average score. Three factors indi- cate that calculating average scores is preferable, how- ever. First, maximizing state-by-state medians will not necessarily maximize the national median. Second, while median positions are relevant if the policy at issue is unidimensional, they have little meaning for multidi- mensional policies. For instance, the distribution of pork-barrel benefits to minority constituents, one of the purported benefits of majority-minority districts, is an inherently multidimensional problem. Third, if voting scores are taken to be probabilities of voting in favor of minority-supported issues, then, again, maximizing the average score is appropriate.22
22 See Aranson, Hinich, and Ordeshook (1974) and Hinich (1977) for discussions of the correct objective function in similar voting games, arguing in favor of means over medians.
We analyze the question of optimal districting as a constrained nonlinear maximization problem. Consider a state with n districts and Pb percentage of black voters.
Let b = (b1, b2, . . ., bn) represent the vector of the percentage of black voters in each district. Let LCCR(bi) be the expected LCCR score in district i if it contains bi percentage of black voters, as calculated from Figure 5. Then, the problem to be solved is:
n
max E LCCR(bi), (4) b
subject to:
(i) bi 'O,
(ii) bi 1,
(iii) bi 'n * Pb,
n
(iv) Ebi =n * Pb
Notice that the total big's must be equal to n Pb. For instance, in a state with three districts and 15% black voters, a single district could have 45% black voters if the other two have none. In general, the total of the BVAPs in all districts will equal the average BVAP in the state times the number of districts. Constraints (i) through (iii) state that the percentage of black voters in a district must be nonnegative, that it cannot be greater than the maximum population in any one district, and that it cannot be greater than the total number of minority residents in the state. Constraint (iv) indicates that all minority residents must be members of some district.
For purposes of comparison, we also calculated the distribution of minority voters that would maximize the expected number of minority candidates elected to office, that is, descriptive rather than substantive repre- sentation. Here, the maximization problem was the same as equation 4, except that the objective function was to
maxb E'=1 PBD(bi), where PBD(Q) is the probability of electing a black Democrat, calculated from the logit analysis in Table 5.
Results and Discussion
Simulation results for states with five districts are illus- trated in Table 6.23 As shown, outside the South, black representation is maximized by distributing black voters equally across districts. The reasoning behind this comes from Figure 4: The marginal gain in the representation effect from placing more minority voters in any given district is less than the marginal loss from the electoral effect elsewhere. In other words, the most important objective for minority representation in these areas is to elect Democrats, either black or nonblack. Majority- minority districts make little sense in this context, unless
23 The simulations were performed using Microsoft Excel's Solver
function, which uses the Newton-Raphson hill-climbing algorithm. For an overview of this procedure, see Press, Flannery, Teukolsky, and Vetterling (1986, 254-9).
807
This content downloaded from 128.112.40.248 on Tue, 17 Oct 2017 19:06:09 UTCAll use subject to http://about.jstor.org/terms
Do Majority-Minority Districts Maximize Black Representation? December 1996
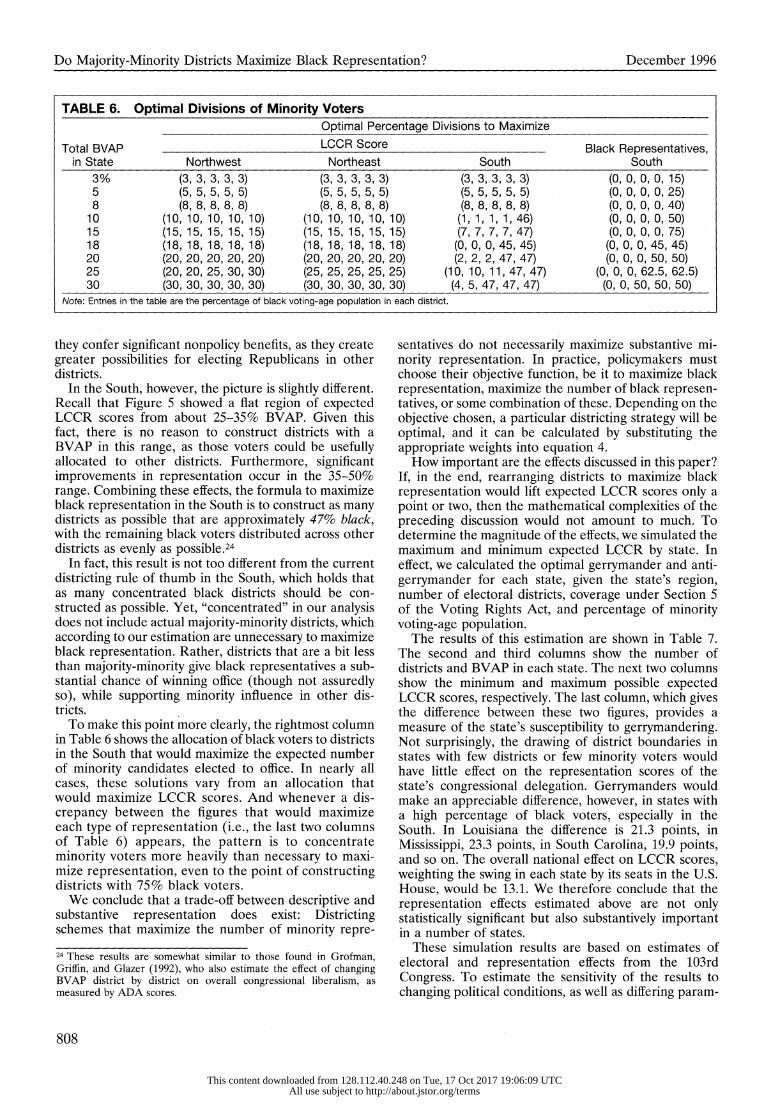
TABLE 6. Optimal Divisions of Minority Voters
Optimal Percentage Divisions to Maximize
Total BVAP LCCR Score Black Representatives, in State Northwest Northeast South South
3% (3, 3, 3, 3, 3) (3, 3, 3, 3, 3) (3, 3, 3, 3, 3) (0, 0, 0, 0, 15) 5 (5, 5, 5, 5, 5) (5, 5, 5, 5, 5) (5, 5, 5, 5, 5) (0, 0, 0, 0, 25) 8 (8, 8, 8, 8, 8) (8, 8, 8, 8, 8) (8, 8, 8, 8, 8) (0, 0, 0, 0, 40) 10 (10, 10, 10, 10, 10) (10, 10, 10, 10, 10) (1, 1, 1, 1, 46) (0, 0, 0, 0, 50) 15 (15, 15, 15, 15, 15) (15, 15, 15, 15, 15) (7, 7, 7, 7, 47) (0, 0, 0, 0, 75) 18 (18, 18, 18, 18, 18) (18, 18, 18, 18, 18) (0, 0, 0, 45, 45) (0, 0, 0, 45, 45) 20 (20, 20, 20, 20, 20) (20, 20, 20, 20, 20) (2, 2, 2, 47, 47) (0, 0, 0, 50, 50) 25 (20, 20, 25, 30, 30) (25, 25, 25, 25, 25) (10, 10, 11, 47, 47) (0, 0, 0, 62.5, 62.5) 30 (30, 30, 30, 30, 30) (30, 30, 30, 30, 30) (4, 5, 47, 47, 47) (0, 0, 50, 50, 50)
Note: Entries in the table are the percentage of black voting-age population in each district.
they confer significant nonpolicy benefits, as they create greater possibilities for electing Republicans in other districts.
In the South, however, the picture is slightly different. Recall that Figure 5 showed a flat region of expected LCCR scores from about 25-35% BVAP. Given this fact, there is no reason to construct districts with a BVAP in this range, as those voters could be usefully allocated to other districts. Furthermore, significant improvements in representation occur in the 35-50% range. Combining these effects, the formula to maximize black representation in the South is to construct as many districts as possible that are approximately 47% black, with the remaining black voters distributed across other districts as evenly as possible.24
In fact, this result is not too different from the current districting rule of thumb in the South, which holds that as many concentrated black districts should be con- structed as possible. Yet, "concentrated" in our analysis does not include actual majority-minority districts, which according to our estimation are unnecessary to maximize black representation. Rather, districts that are a bit less than majority-minority give black representatives a sub- stantial chance of winning office (though not assuredly so), while supporting minority influence in other dis- tricts.
To make this point more clearly, the rightmost column in Table 6 shows the allocation of black voters to districts in the South that would maximize the expected number of minority candidates elected to office. In nearly all cases, these solutions vary from an allocation that would maximize LCCR scores. And whenever a dis- crepancy between the figures that would maximize each type of representation (i.e., the last two columns of Table 6) appears, the pattern is to concentrate minority voters more heavily than necessary to maxi- mize representation, even to the point of constructing districts with 75% black voters.
We conclude that a trade-off between descriptive and substantive representation does exist: Districting schemes that maximize the number of minority repre-
24 These results are somewhat similar to those found in Grofman, Griffin, and Glazer (1992), who also estimate the effect of changing BVAP district by district on overall congressional liberalism, as measured by ADA scores.
808
sentatives do not necessarily maximize substantive mi- nority representation. In practice, policymakers must choose their objective function, be it to maximize black representation, maximize the number of black represen- tatives, or some combination of these. Depending on the objective chosen, a particular districting strategy will be optimal, and it can be calculated by substituting the appropriate weights into equation 4.
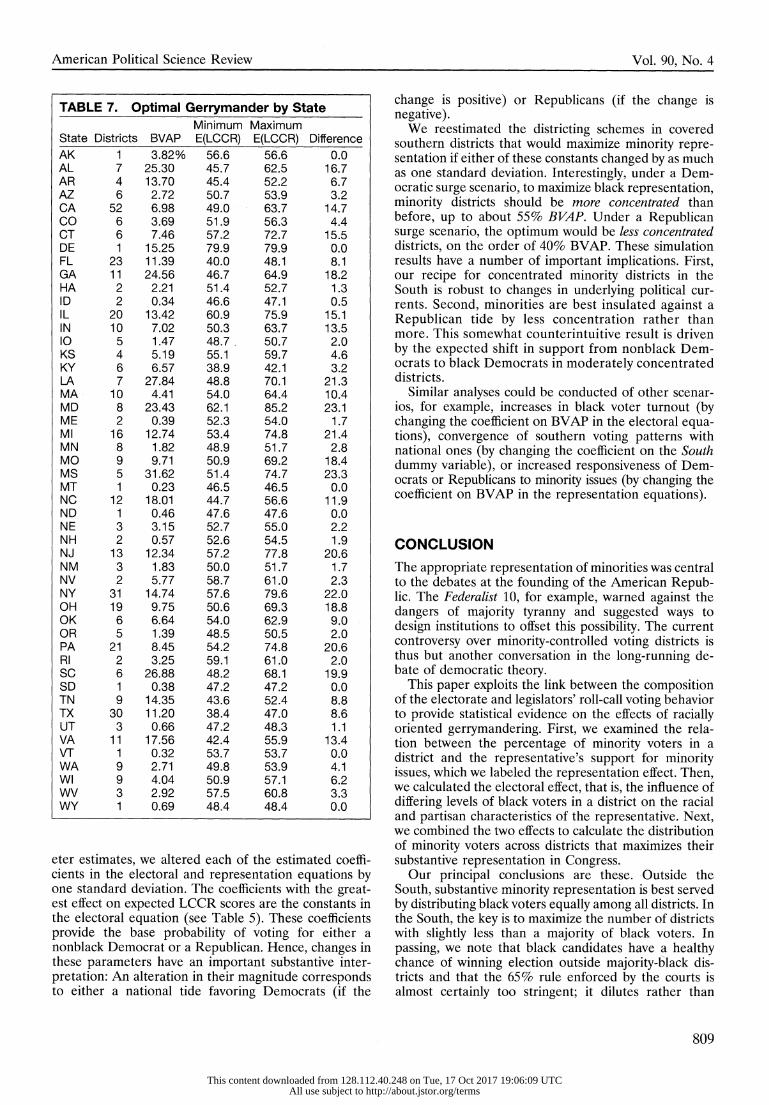
How important are the effects discussed in this paper? If, in the end, rearranging districts to maximize black representation would lift expected LCCR scores only a point or two, then the mathematical complexities of the preceding discussion would not amount to much. To determine the magnitude of the effects, we simulated the maximum and minimum expected LCCR by state. In effect, we calculated the optimal gerrymander and anti- gerrymander for each state, given the state's region, number of electoral districts, coverage under Section 5 of the Voting Rights Act, and percentage of minority voting-age population.
The results of this estimation are shown in Table 7. The second and third columns show the number of districts and BVAP in each state. The next two columns show the minimum and maximum possible expected LCCR scores, respectively. The last column, which gives the difference between these two figures, provides a measure of the state's susceptibility to gerrymandering. Not surprisingly, the drawing of district boundaries in states with few districts or few minority voters would have little effect on the representation scores of the state's congressional delegation. Gerrymanders would make an appreciable difference, however, in states with a high percentage of black voters, especially in the South. In Louisiana the difference is 21.3 points, in Mississippi, 23.3 points, in South Carolina, 19.9 points, and so on. The overall national effect on LCCR scores, weighting the swing in each state by its seats in the U.S. House, would be 13.1. We therefore conclude that the representation effects estimated above are not only statistically significant but also substantively important in a number of states.
These simulation results are based on estimates of electoral and representation effects from the 103rd Congress. To estimate the sensitivity of the results to changing political conditions, as well as differing param-
This content downloaded from 128.112.40.248 on Tue, 17 Oct 2017 19:06:09 UTCAll use subject to http://about.jstor.org/terms
American Political Science Review Vol. 90, No. 4
TABLE 7. Optimal Gerrymander by State
Minimum Maximum State Districts BVAP E(LCCR) E(LCCR) Difference
AK 1 3.82% 56.6 56.6 0.0 AL 7 25.30 45.7 62.5 16.7 AR 4 13.70 45.4 52.2 6.7 AZ 6 2.72 50.7 53.9 3.2 CA 52 6.98 49.0 63.7 14.7 CO 6 3.69 51.9 56.3 4.4 CT 6 7.46 57.2 72.7 15.5 DE 1 15.25 79.9 79.9 0.0 FL 23 11.39 40.0 48.1 8.1 GA 11 24.56 46.7 64.9 18.2 HA 2 2.21 51.4 52.7 1.3 ID 2 0.34 46.6 47.1 0.5 IL 20 13.42 60.9 75.9 15.1 IN 10 7.02 50.3 63.7 13.5 10 5 1.47 48.7 50.7 2.0 KS 4 5.19 55.1 59.7 4.6 KY 6 6.57 38.9 42.1 3.2 LA 7 27.84 48.8 70.1 21.3 MA 10 4.41 54.0 64.4 10.4 MD 8 23.43 62.1 85.2 23.1 ME 2 0.39 52.3 54.0 1.7 Ml 16 12.74 53.4 74.8 21.4 MN 8 1.82 48.9 51.7 2.8 MO 9 9.71 50.9 69.2 18.4 MS 5 31.62 51.4 74.7 23.3 MT 1 0.23 46.5 46.5 0.0 NC 12 18.01 44.7 56.6 11.9 ND 1 0.46 47.6 47.6 0.0 NE 3 3.15 52.7 55.0 2.2 NH 2 0.57 52.6 54.5 1.9 NJ 13 12.34 57.2 77.8 20.6 NM 3 1.83 50.0 51.7 1.7 NV 2 5.77 58.7 61.0 2.3 NY 31 14.74 57.6 79.6 22.0 OH 19 9.75 50.6 69.3 18.8 OK 6 6.64 54.0 62.9 9.0 OR 5 1.39 48.5 50.5 2.0 PA 21 8.45 54.2 74.8 20.6 RI 2 3.25 59.1 61.0 2.0 SC 6 26.88 48.2 68.1 19.9 SD 1 0.38 47.2 47.2 0.0 TN 9 14.35 43.6 52.4 8.8 TX 30 11.20 38.4 47.0 8.6 UT 3 0.66 47.2 48.3 1.1 VA 11 17.56 42.4 55.9 13.4 VT 1 0.32 53.7 53.7 0.0 WA 9 2.71 49.8 53.9 4.1 WI 9 4.04 50.9 57.1 6.2 WV 3 2.92 57.5 60.8 3.3 WY 1 0.69 48.4 48.4 0.0
eter estimates, we altered each of the estimated coeffi- cients in the electoral and representation equations by one standard deviation. The coefficients with the great- est effect on expected LCCR scores are the constants in the electoral equation (see Table 5). These coefficients provide the base probability of voting for either a nonblack Democrat or a Republican. Hence, changes in these parameters have an important substantive inter- pretation: An alteration in their magnitude corresponds to either a national tide favoring Democrats (if the
change is positive) or Republicans (if the change is negative).
We reestimated the districting schemes in covered southern districts that would maximize minority repre- sentation if either of these constants changed by as much as one standard deviation. Interestingly, under a Dem- ocratic surge scenario, to maximize black representation, minority districts should be more concentrated than before, up to about 55% BVAP. Under a Republican surge scenario, the optimum would be less concentrated districts, on the order of 40% BVAP. These simulation results have a number of important implications. First, our recipe for concentrated minority districts in the South is robust to changes in underlying political cur- rents. Second, minorities are best insulated against a Republican tide by less concentration rather than more. This somewhat counterintuitive result is driven by the expected shift in support from nonblack Dem- ocrats to black Democrats in moderately concentrated districts.
Similar analyses could be conducted of other scenar- ios, for example, increases in black voter turnout (by changing the coefficient on BVAP in the electoral equa- tions), convergence of southern voting patterns with national ones (by changing the coefficient on the South dummy variable), or increased responsiveness of Dem- ocrats or Republicans to minority issues (by changing the coefficient on BVAP in the representation equations).
CONCLUSION
The appropriate representation of minorities was central to the debates at the founding of the American Repub- lic. The Federalist 10, for example, warned against the dangers of majority tyranny and suggested ways to design institutions to offset this possibility. The current controversy over minority-controlled voting districts is thus but another conversation in the long-running de- bate of democratic theory.
This paper exploits the link between the composition of the electorate and legislators' roll-call voting behavior to provide statistical evidence on the effects of racially oriented gerrymandering. First, we examined the rela- tion between the percentage of minority voters in a district and the representative's support for minority issues, which we labeled the representation effect. Then, we calculated the electoral effect, that is, the influence of differing levels of black voters in a district on the racial and partisan characteristics of the representative. Next, we combined the two effects to calculate the distribution of minority voters across districts that maximizes their substantive representation in Congress.
Our principal conclusions are these. Outside the South, substantive minority representation is best served by distributing black voters equally among all districts. In the South, the key is to maximize the number of districts with slightly less than a majority of black voters. In passing, we note that black candidates have a healthy chance of winning election outside majority-black dis- tricts and that the 65% rule enforced by the courts is almost certainly too stringent; it dilutes rather than
809
This content downloaded from 128.112.40.248 on Tue, 17 Oct 2017 19:06:09 UTCAll use subject to http://about.jstor.org/terms
Do Majority-Minority Districts Maximize Black Representation? December 1996
increases overall minority voting strength. Overall, max- imizing the number of minority representatives does not necessarily maximize minority representation, as mea- sured by roll-call voting behavior.
Relating our findings to larger themes in U.S. politics, we note that the debate over majority-minority districts has three prongs: as a constitutional matter, as politics, and as public policy. According to legal scholars, the constitutional status of minority districting has evolved through two distinct phases. The first began with the signing of the Voting Rights Act in 1965 and concen- trated on the harm of vote dilution, to which concen- trated minority voting districts were the favored solu- tion. The second began in 1993 with the Shaw v. Reno decision and continued through the recent Bush v. Vera and Shaw v. Hunt cases. It focuses on the harm of separating voters by race, ruling that a districting plan driven by predominantly racial considerations must un- dergo strict scrutiny to prove its constitutionality. Our findings imply that these two views need not be irrecon- cilable, since majority-minority districts may, in fact, dilute the overall influence of minorities on public policy. If this is the case, then bizarrely shaped districts like the North Carolina Twelfth are, indeed, an unnec- essary feature of the political landscape.
From a political point of view, the rise in the number of majority-minority districts has occurred as the result of a sometimes tacit, sometimes overt collusion between representatives of the minority community and Repub- licans. In many southern state legislatures, these two groups formed voting blocs when passing redistricting
plans, and the Justice Department under Republican presidents was eager to create the maximum possible number of majority-minority districts. It is not obvious that this arrangement works to the detriment of minority voters-indeed, in some instances it may increase their overall influence-but our results show that generally more votes are lost than are gained by this strategy. The politics of districting may well be changing, however; interparty electoral coalitions may have had more allure when it appeared that Democrats had a permanent majority in the U.S. House.
Finally, regarding the policy aspects of the issue, our results show that a trade-off does exist between substan- tive and descriptive representation, and this poses a difficult decision. On the one hand, some would argue that there is an independent value to having minority representatives in office, making Congress look more like the population it represents. On the other hand, past a certain point, an increase in the number of minority representatives comes at the cost of votes in favor of minority-sponsored legislation. It is disconcerting that no minorities were elected to Congress from the South between 1898 and 1972. But it is hard to argue that minority voters in Georgia are better served overall when their congressional delegation goes from nine Democrats and one Republican to three black Demo- crats and eight white Republicans in the span of two years. Thus, there is a trade-off to be made, striking a balance between electing minority representatives to office and enacting legislation favored by the minority community.
APPENDIX A. BILLS INCLUDED IN VOTING SCORES
Leadership Conference on Civil Rights (LCCR) Votes
LCCR No. Bill No. Bill Title and Description Position
LCCR1 HR 6 Elementary and Secondary Education Reauthorization-Republican Oppose substitute
LCCR2 HR 6 Elementary and Secondary Education Reauthorization-Conference report Support LCCR3 HR 1 Family and Medical Leave-Optional benefits Oppose LCCR4 HR 1 Family and Medical Leave-Passage Support LCCR5 HR 2 National Motor-Voter Registration-Proof of citizenship Oppose LCCR6 HR 2 National Motor-Voter Registration-Conference report Support LCCR7 HR 4092 Omnibus Crime Bill-Republican "Racial Justice" Act Oppose LCCR8 HR 1133 Violence against Women-Passage Support LCCR9 HR 51 D.C. Statehood-Passage Support LCCR1 0 H J Res 103 Balanced Budget Constitutional Amendment-Passage Oppose LCCR1 1 HR 5 Striker Replacement-Passage Support LCCR12 HR 4822 Congressional Compliance-Passage Support LCCR13 HR 1025 Brady Bill-Conference report Support LCCR14 HR 2401 Fiscal 1994 Defense Authorization-Amendment to weaken gay ban Support
Congressional Quarterly Key Votes
Liberal No. Bill No. Bill Title and Description Position
CQ1 HR 1 Family and Medical Leave-Passage Support CQ2 H Con Res 64 Fiscal 1994 Budget Resolution-Adoption Support CQ3 HR 1335 Fiscal 1993 Supplemental Appropriations-Rule Support CQ4 HR 2295 Fiscal 1994 Foreign Operations Appropriations-Aid to Russia Oppose CQ5 HR 2518 Fiscal 1994 Labor, HHS, Education Appropriations-Abortion prohibition Oppose CQ6 HR 2264 1993 Budget Reconciliation-Adoption Support
810
This content downloaded from 128.112.40.248 on Tue, 17 Oct 2017 19:06:09 UTCAll use subject to http://about.jstor.org/terms

American Political Science Review Vol. 90, No. 4
APPENDIX A. Continued
Congressional Quarterly Key Votes continued
Liberal
No. Bill No. Bill Title and Description Position
CQ7 HR 1340 Resolution Trust Company-Passage Support CQ8 HR 2401 Fiscal 1994 Defense Authorization-Amendment to weaken gay ban Support CQ9 HR 1845 National Biological Survey-Nonfederal property Support CQ1 0 HR 2445 Fiscal 1994 Energy and Water Appropriations-Previous question Support CQ1 1 H Con Res 170 Somalia Troop Removal-March 31 deadline Support CQ12 HR 1025 Brady Bill-Passage Support CQ13 HR 3450 NAFTA Implementation-Passage Oppose CQ14 HR 322 Mining Law Overhaul-Passage Support CQ15 HR 3 Campaign Finance-Rule (HRes. 319) Support CQ16 HR 3400 Fiscal 1994 Spending Cuts and Govt. Restructuring-Penny-Kasich Oppose
Amendment CQ1 7 HR 3425 Department of Environmental Protection-Rule Support CQ1 8 H Con Res 218 Fiscal 1995 Budget Resolution-Defense Cuts Support CQ1 9 H J Res 103 Balanced Budget Constitutional Amendment-Passage Oppose CQ20 H Con Res 218 Fiscal 1995 Budget Resolution-Instruct Conferees Oppose CQ21 HR 4296 Assault Weapons Ban-Passage Support CQ22 S 636 Abortion Clinic Access-Conference Report Support CQ23 HR 4301 Fiscal 1995 Defense Authorization-Bosnia Arms Embargo Unilateral Oppose
Termination CQ24 HR 3626 Revising Restrictions on the Regional Bell Companies-Passage Support CQ25 HR 4624 Fiscal 1995 VA, HUD Appropriations-Space Station Oppose CQ26 HR 518 California Desert Protection-Hunting Exception Oppose CQ27 HR 4604 Entitlement Spending Control-Stenholm Substitute Oppose CQ28 HR 3355 Omnibus Crime Bill-Rule Support CQ29 HR 3355 Omnibus Crime Bill-Conference Report Support CQ30 S 349 Lobbying Disclosure-Rule Support CQ31 H J Res 416 U.S. Troops in Haiti-Immediate Withdrawal Oppose CQ32 HR 5110 General Agreement on Tariffs and Trade-Passage Oppose
APPENDIX B: ESTIMATION OF STANDARD ERRORS
Since the equation for E(LCCR) involves the product of two random variables, one must calculate standard errors using what is known as the 8-method. Let the probability of electing a representative of type 0 from region r in a district with black voting-age population BVAP be p(O IBVAP, r), where 0 E {R, BD, NBD}. Let the expected LCCR score of that representative be pi(LCCR I 0, BVAP, r). For convenience, we will abbreviate these quantities as p(0) and pi(0). Then, we wish to estimate, for a given region and value of BVAP,
Var( A P(0)[L(0)) (B-i)
This expression involves the product of two subexpressions, each of which must be treated as a random variable. To estimate the overall standard error, we use the 8 method, which is described in Rice (1988, 143). Essentially, the 8 method involves rewriting the function to be estimated, so that a product is converted into a series of sums. In our case, we use the fact that
fiA-PV=(F AL) + VL(fi-P)
to write the variance of equation B-1 as:
E(fi5 -pV)= E E p (0)p(0')Cov(> (0), (0')) o 0'
+ > gi(0)gi(0')Cov(j5(0), j(0')) (B-2) 0 0'
> 3(0)2 Var(i(0)) + ,E, $i(0)$i(0')Cov(f(0),fi(0')), 0 0 0'
since the estimates of the it terms are taken from different subsets of the data and are therefore expected to be independent from one another.
The values of P(O) and ii(O) come from substituting given values of 0 and BVAP directly into the estimated representation and electoral equations for any given region. The variance of ii for a given value of BVAP is given by:
Var(Si(O)) = [1, BVAP] S2j S2] LBVAP]
where S 2 is the estimated variance of the intercept term in the representation equations, s2 is the estimated variance of the slope, and s2 is the covariance between the two.
The covariance terms from the electoral equations are more com-
plicated. Let P1 be the vector of four coefficients for nonblack Democrats from Table 5, and let P2 be the four coefficients for Republicans. Let M be the (8 X 8) variance-covariance matrix from the estimation of the electoral equation. Then, a Taylor series expansion indicates that
Cov(p(0), p(0')) = V )p(0) * M * V )p(0').
The terms V , are the gradients of the probability functions with
respect to the vectors of coefficients for a given type of representative, value of BVAP, and region. These values complete the necessary components to calculate the right-hand side of equation B-2. The resulting standard errors of E(LCCR) for given values of BVAP are shown in Table B-1.*
In general, the greatest uncertainty occurred for levels of BVAP between 30% and 40%. This is not surprising, as relatively few electoral districts currently fall in that range of concentration. The standard error for lower and higher values of BVAP were fairly small, however, especially for levels of BVAP of 45% and more.
*The calculations were performed using a Mathematica program designed by the authors. Copies of the mathematics code are available from the author upon request.
811
This content downloaded from 128.112.40.248 on Tue, 17 Oct 2017 19:06:09 UTCAll use subject to http://about.jstor.org/terms

Do Majority-Minority Districts Maximize Black Representation? December 1996
TABLE B-1. Estimated Standard Errors for E(LCCR) Equation, Calculated by a Method
South BVAP Northeast Northwest South Covered
0.0 0.045 0.037 0.060 0.054 0.05 0.057 0.042 0.051 0.048 0.10 0.098 0.055 0.045 0.042 0.15 0.135 0.062 0.049 0.044 0.20 0.160 0.057 0.060 0.049 0.25 0.173 0.0425 0.073 0.056 0.30 0.172 0.0182 0.090 0.066 0.35 0.157 0.003 0.126 0.110 0.40 0.122 0.0004 0.212 0.219 0.45 0.069 0.00005 0.085 0.085 0.50 0.026 6.12*10-6 0.014 0.014 0.55 0.007 7.18*10-7 0.002 0.002 0.60 0.002 8.34*1 Q-8 0.0003 0.0003 0.65 0.0005 9.60*10-9 0.00004 0.00004 0.70 0.00014 1.09*10-9 6.34*1 0-6 6.03*1 0-6
In the Northwest, the standard errors are uniformly modest, while in the South and Northeast they are somewhat higher for intermediate levels of BVAP. It is, therefore, highly improbable that alternative districting strategies could increase minority representation in north- western states. In the South and Northeast, although the districting rule we derive is most compatible with the data, it is not impossible that alternative strategies might perform better.
REFERENCES
Aranson, Peter, Melvin Hinch, and Peter Ordeshook. 1974. "Election Goals and Strategies: Equivalent and Non-equivalent Candidate Objectives." American Political Science Review 68 (March):135-52.
Barone, Michael, and Grant Ujifusa. 1993. Almanac of American Politics, 1994. Washington DC: National Journal.
Black, Merle. 1978. "Racial Composition of Congressional Districts and Support for Federal Voting Rights in the American South." Social Science Quarterly 59 (December):435-50.
Bott, Alexander J. 1990. Handbook of United States Election Laws and Practices. New York: Greenwood Press.
Brace, Kimball, Bernard Grofman, and Lisa Handley. 1987. "Does Redistricting Aimed to Help Blacks Necessarily Help Republicans?" Journal of Politics 49 (February):167-85.
Browning, Rufus, Dale Rogers Marshall, and David Tabb. 1984. Protest Is Not Enough: The Struggle of Blacks and Hispanics for Equality in Urban Politics. Berkeley: University of California Press.
Bullock, Charles. 1981. "Congressional Voting and the Mobilization of a Black Electorate in the South." Journal of Politics 43 (August): 662-82.
Cain, Bruce. 1992. "Voting Rights and Democratic Theory: Toward a Color-Blind Society." In Controversies in Minority Voting, ed. Ber- nard Grofman and Chandler Davidson. Washington, DC: Brookings Institution.
Chambers, John M., and Trevor J. Hastie, eds. 1993. Statistical Models in S. Chapman & Hall Computer Science Series. London: Chapman & Hall.
Cleveland, W.S. 1993. Visualizing Data. Summit, NJ: Hobart Press. Combs, Michael W., John R. Hibbing, and Susan Welch. 1984. "Black
Constituents and Congressional Roll Call Votes." Western Political Quarterly 37 (September):424-34.
Davidson, Chandler, ed. 1984. Minority Vote Dilution. Washington, DC: Howard University Press.
Davidson, Chandler. 1992. "The Voting Rights Act: A Brief History." In Controversies in Minority Voting, ed. Bernard Grofman and Chandler Davidson. Washington, DC: Brookings Institution.
Davidson, Chandler, and Bernard Grofman, eds. 1994. Quiet Revolu- tion in the South: The Impact of the Voting Rights Act of 1965. Princeton, NJ, Princeton University Press.
812
Epstein, David, and Sharyn O'Halloran. 1995. "Interest Group Com- petition and Endogenous Coalition Formation." Manuscript, Co- lumbia University.
Fox, John. 1991. Regression Diagnostics. Newberry Park, CA: Sage Publications.
Greene, William H. 1993. Econometric Analysis. New York: Macmillan. Grofman, Bernard, and Chandler Davidson, eds. 1992. Controversies in
Minority Voting. Washington, DC: Brookings Institution. Grofman, Bernard, Robert Griffin, and Amihai Glazer. 1992. "The
Effect of Black Population on Electing Democrats and Liberals to the House of Representatives." Legislative Studies Quarterly 17 (August):365-79.
Grofman, Bernard, Lisa Handley, and Richard Niemi. 1992. Minority Representation and the Quest for Voting Equality. New York: Cam- bridge University Press.
Guinier, Lani. 1994. The Tyranny of the Majority: Fundamental Fairness in Representative Democracy. New York: Free Press.
Hardle, Wolfgang. 1990. Applied Non-Parametric Regression. New York: Cambridge University Press.
Hausman, J., and D. McFadden. 1984. "A Specification Test for the Multinomial Logit Model." Econometrica 52 (September):1219-40.
Hill, Kevin. 1995. "Does the Creation of Majority Black Districts Aid Republicans?" Journal of Politics 57 (May):384-401.
Hinich, Melvin. 1977. "Equilibrium in Spatial Voting: The Median Voter Result Is an Artifact." Journal of Economic Theory 16 (December):208-19.
Keech, William R. 1968. The Impact of Negro Voting. Chicago: Rand McNally.
Kernell, Sam. 1973. "Comment: A Re-evaluation of Black Voting in Mississippi." American Political Science Review 67 (December): 1307-18.
Key, V. 0. 1949. Southern Politics in State and Nation. Knoxville: University of Tennessee Press.
Kousser, Morgan. 1993. "Beyond Gingles: Influence Districts and the Pragmatic Tradition in Voting Rights Law." University of San Francisco Law Review 27 (Spring):551-92.
Lublin, David. 1994. "Gerrymander for Justice? Racial Redistricting and Black and Latino Representation." Ph.D. diss., Harvard University.
McClain, Paula, and Joseph Stewart. 1995. "W(h)ither the Voting Rights Act after Shaw v. Reno: Advancing to the Past?" PS 28 (June):24-6.
McDonald, Laughlin. 1992. "The 1982 Amendments of Section 2 and Minority Representation." In Controversies in Minority Voting, ed. Bernard Grofman and Chandler Davidson. Washington, DC: Brookings Institution.
Overby, L. Marvin, and Kenneth Cosgrove. 1996. "Unintended Con- sequences? Racial Redistricting and the Representation of Minority Interests." Journal of Politics 58 (May):540-50.
Polsby, Daniel, and Robert Popper. 1993. "Ugly: An Inquiry into the Problem of Racial Gerrymandering under the Voting Rights Act." Michigan Law Review 92 (December):652-82.
Poole, Keith, and Howard Rosenthal. 1991. "Pattern of Congressional Voting." American Journal of Political Science 35 (February):49-67.
Press, William, Brian Flannery, Saul Teukolsky, and William Vetter- ing. 1986. Numerical Recipes. Cambridge: Cambridge University Press.
Rice, John. 1988. Mathematical Statistics and Data Analysis. Pacific Grove, CA: Wadsworth.
Rousseeuw, Peter, and Annick Leroy. 1987. Robust Regression and Outlier Detection. New York: John Wiley and Sons.
Swain, Carol. 1993. Black Faces, Black Interests: The Representation of African Americans in Congress. Cambridge, MA: Harvard University Press.
Venables, W. N., and B. D. Ripley. 1994. Modem Applied Statistics with S-Plus. New York: Springer-Verlag.
Whitby, Kenny J. 1985. "Effects of the Interaction between Race and Urbanization on Votes of Southern Congressmen." Legislative Stud- ies Quarterly 10 (November):505-17.
Whitby, Kenny J. 1987. "Measuring Congressional Responsiveness to the Policy Interests of Black Constituents." Social Science Quarterly 68 (June):367-77.
Yatrakis, K. 1981. Electoral Demands and Political Benefits: Minority as Majority, A Case Study of Two Newark Elections 1970, 1974. New York: Columbia University Press.
This content downloaded from 128.112.40.248 on Tue, 17 Oct 2017 19:06:09 UTCAll use subject to http://about.jstor.org/terms