Embed Size (px)
Citation preview
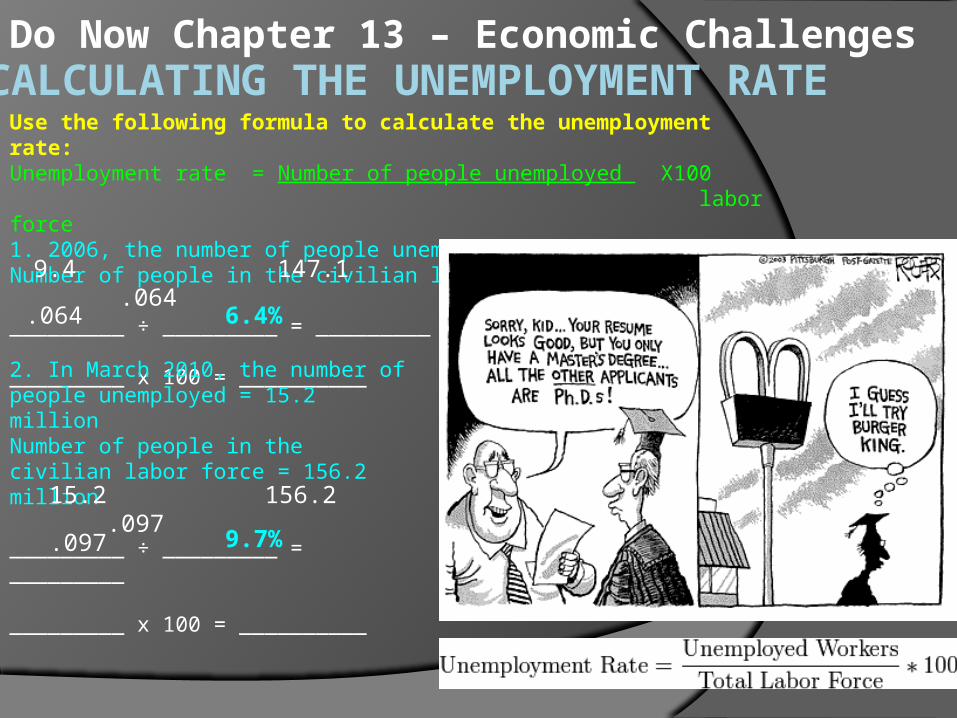
CALCULATING THE UNEMPLOYMENT RATE
Do Now Chapter 13 – Economic Challenges
Use the following formula to calculate the unemployment rate:Unemployment rate = Number of people unemployed X100 labor force 1. 2006, the number of people unemployed = 9.4 millionNumber of people in the civilian labor force = 147.1 million
_________ ÷ _________ = _________
_________ x 100 = __________
2. In March 2010, the number of people unemployed = 15.2 millionNumber of people in the civilian labor force = 156.2 million
_________ ÷ _________ = _________
_________ x 100 = __________
9.4 147.1 .064
.064 6.4%
15.2 156.2 .097
.097 9.7%

Chapter 13 – Economic ChallengesSection 1 - Unemployment Employed – people work as paid employees, own their own business,
unpaid workers in a family business, people who had jobs but temporarily absent Full-time and part-time workers
Unemployed – workers without jobs, were available for work and tried to find employment in the past 4 weeks
Not in labor force – do not fit in previous two categories, full-time student, homemaker, or retiree
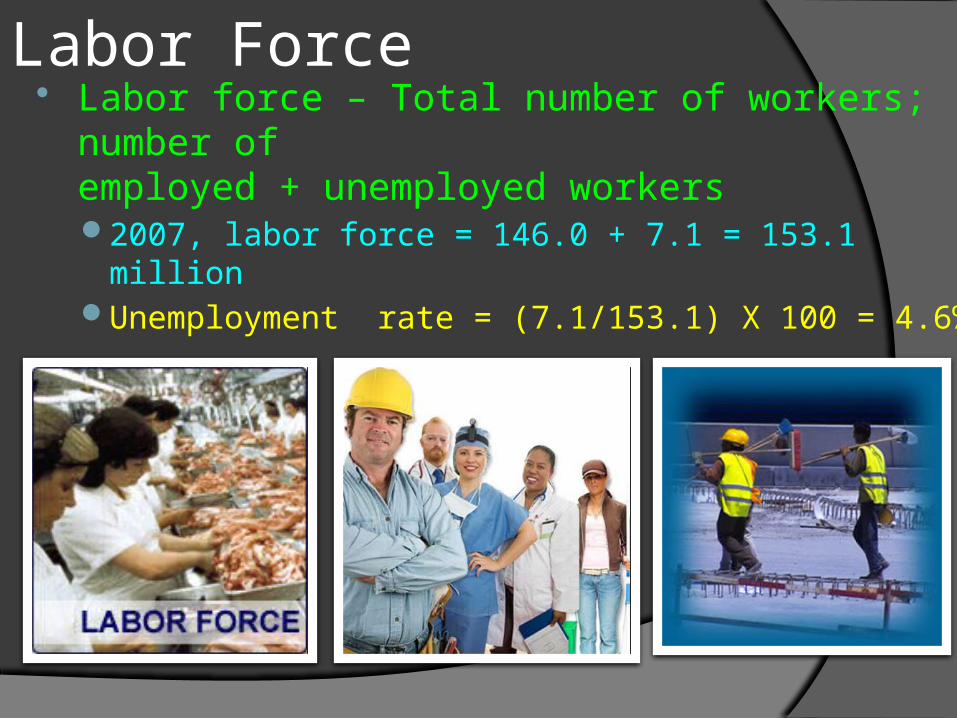
Labor Force Labor force – Total number of workers; number of
employed + unemployed workers 2007, labor force = 146.0 + 7.1 = 153.1 millionUnemployment rate = (7.1/153.1) X 100 = 4.6%

Types of Unemployment1. Frictional Unemployment – always present in the economy, resulting from
temporary transitions made by workers and employers; occurs when people take time to find a job
2. Seasonal Unemployment – occurs as a result of season, vacations, or when industries slow or shut down for a season
3. Structural Unemployment – workers skill do not match the jobs that are available
4. Cyclical Unemployment – rises during economic downturns and falls when the economy improves
Measuring Unemployment
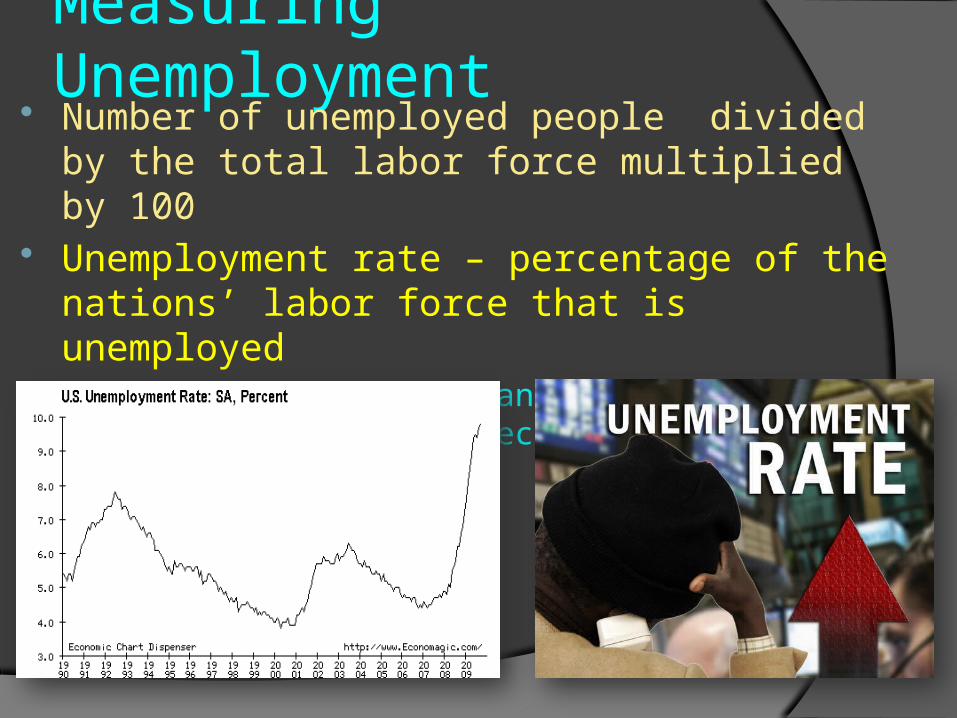
Number of unemployed people divided by the total labor force multiplied by 100
Unemployment rate – percentage of the nations’ labor force that is unemployedUnemployment rate is an indication of the health of a
nation’s economy

Full Employment Natural rate of unemployment – normal rate of unemployment
around which the unemployment rate fluctuates (4-6%) Zero unemployment is not an achievable goal because of frictional
unemployment
Underemployment – working at a job for which one is overqualified, or working part-time when full-time work is desired
Discouraged workers – a person who wants a job, but has given up looking (do not count against unemployment rate)
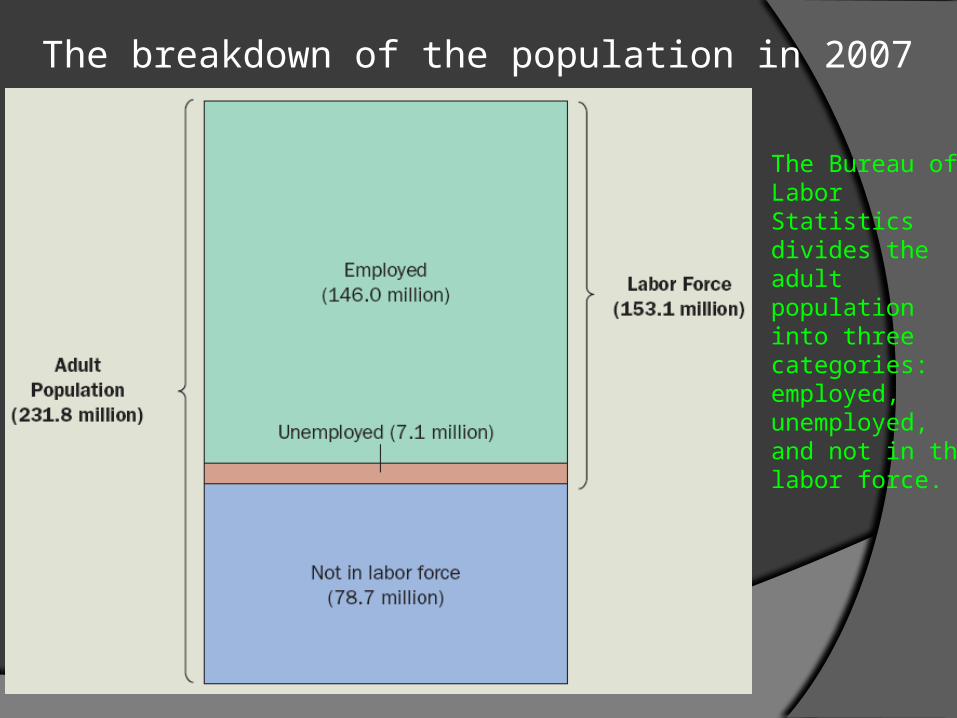
The breakdown of the population in 2007
The Bureau of Labor Statistics divides the adult population into three categories: employed, unemployed, and not in the labor force.
Unemployment Insurance
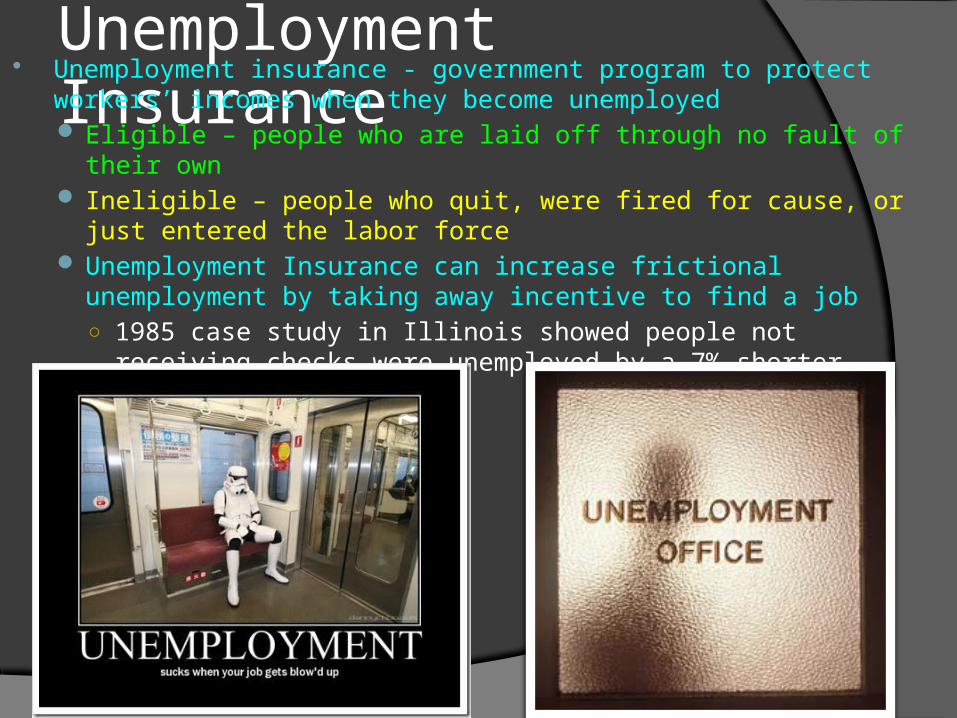
Unemployment insurance - government program to protect workers’ incomes when they become unemployed Eligible – people who are laid off through no fault of their own Ineligible – people who quit, were fired for cause, or just entered the labor
force Unemployment Insurance can increase frictional unemployment by taking
away incentive to find a job○ 1985 case study in Illinois showed people not receiving checks were
unemployed by a 7% shorter period
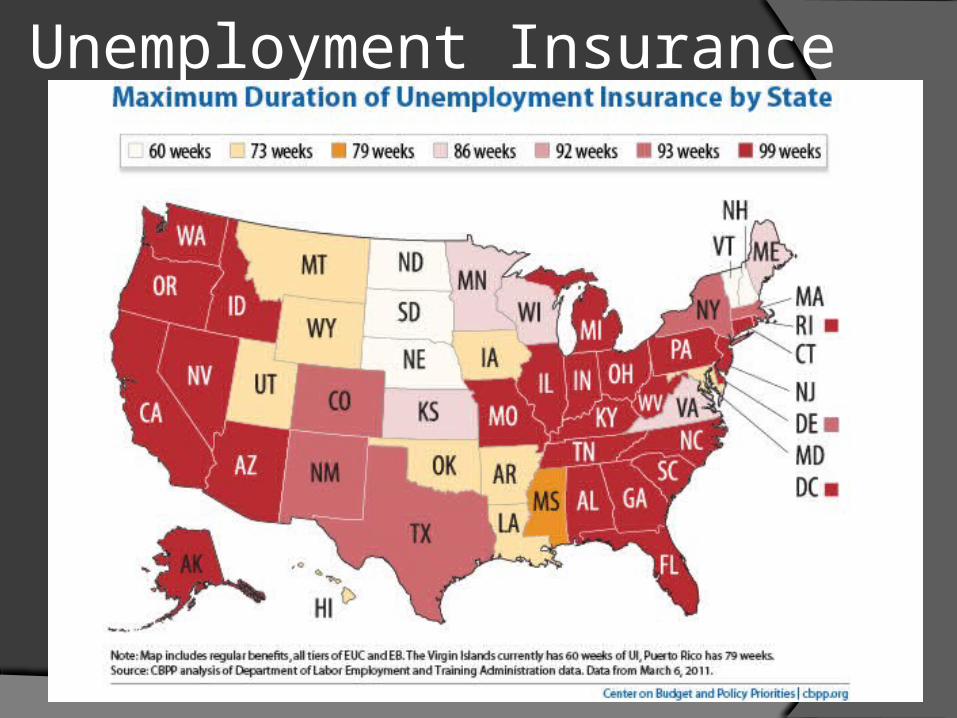
Unemployment Insurance
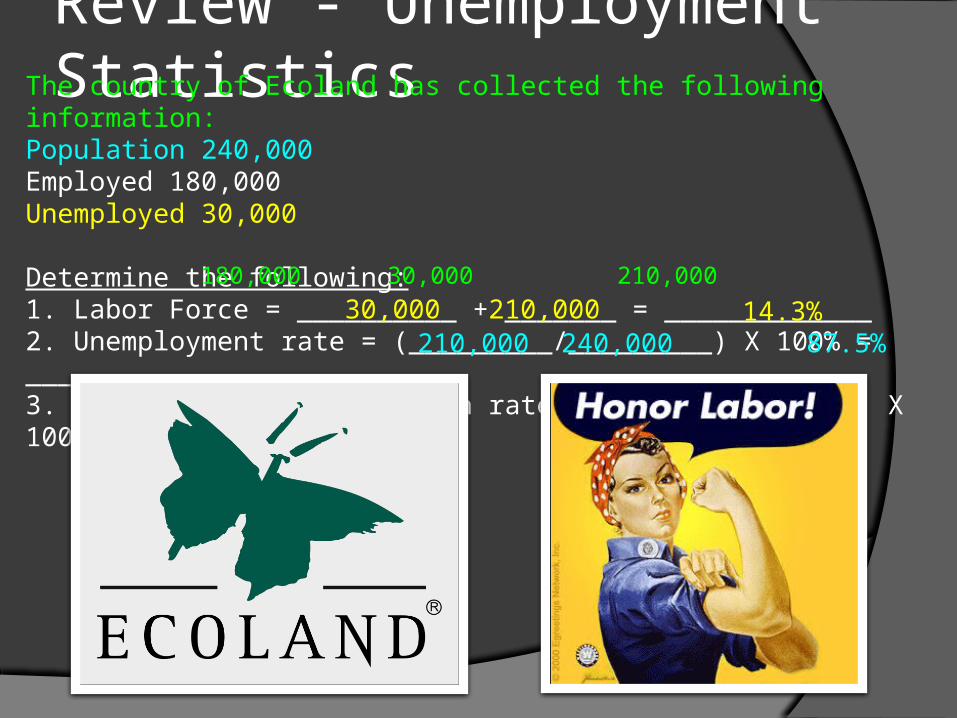
Review - Unemployment StatisticsThe country of Ecoland has collected the following information:
Population 240,000Employed 180,000Unemployed 30,000
Determine the following:1. Labor Force = __________ + _______ = _____________2. Unemployment rate = (_________/_________) X 100% = ______3. Labor-force participation rate = (_______/_______) X 100% = _______
30,000 210,000 14.3%210,000 240,000 87.5%
180,000 30,000 210,000
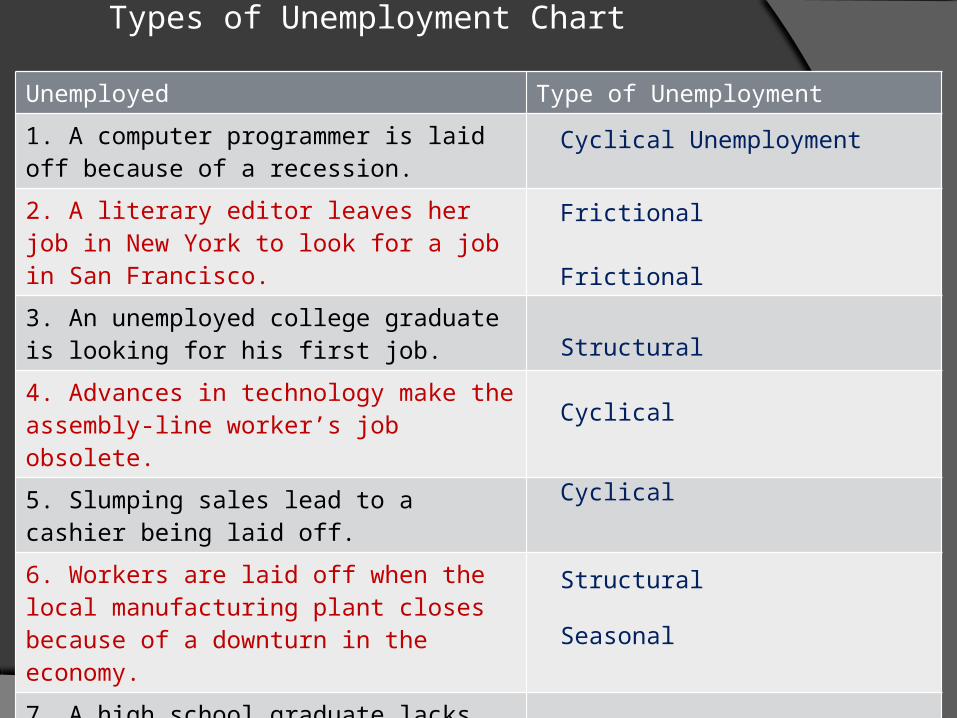
Types of Unemployment Chart
Unemployed Type of Unemployment
1. A computer programmer is laid off because of a recession.
2. A literary editor leaves her job in New York to look for a job in San Francisco.
3. An unemployed college graduate is looking for his first job.
4. Advances in technology make the assembly-line worker’s job obsolete.
5. Slumping sales lead to a cashier being laid off.
6. Workers are laid off when the local manufacturing plant closes because of a downturn in the economy.
7. A high school graduate lacks the skills necessary for a particular job.
8. Summer ends and local teens lose their jobs.
Cyclical Unemployment
Frictional
Frictional
Structural
Cyclical
Cyclical
Structural
Seasonal

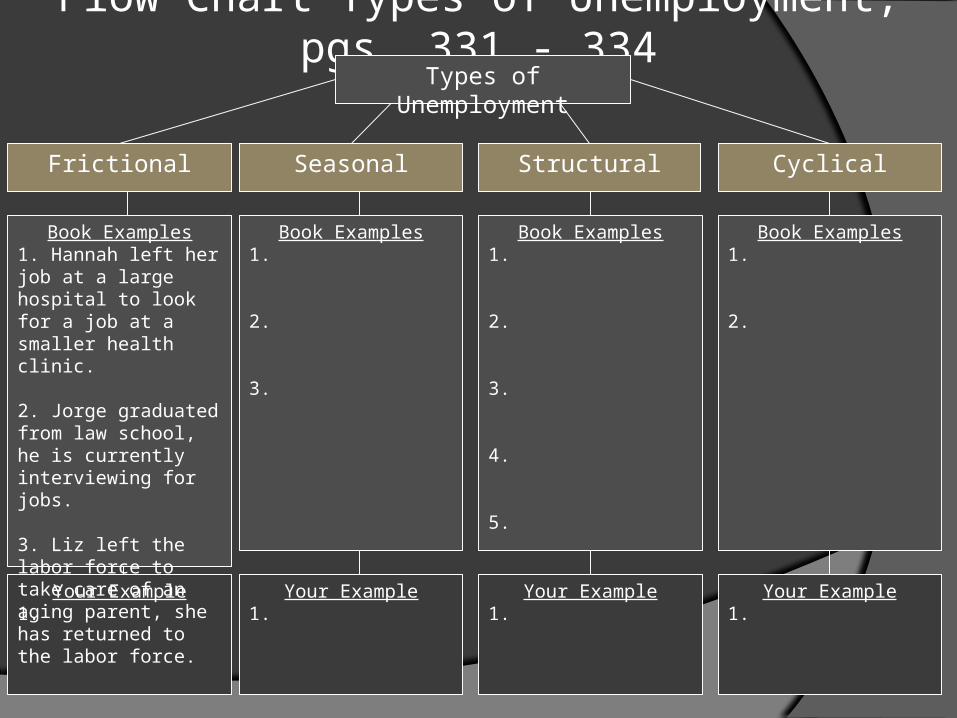
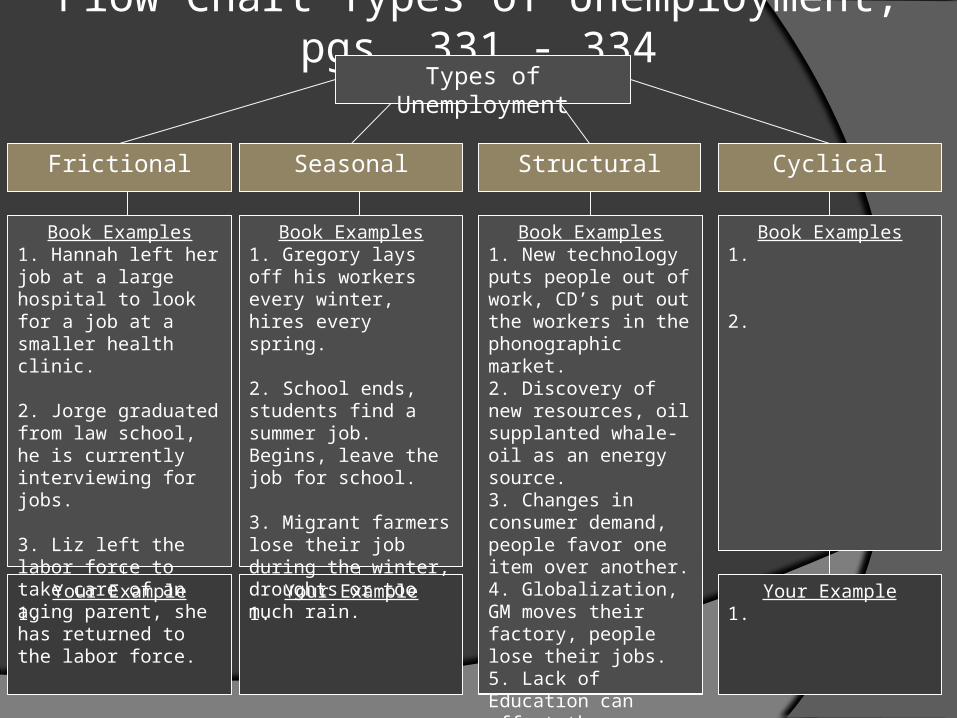
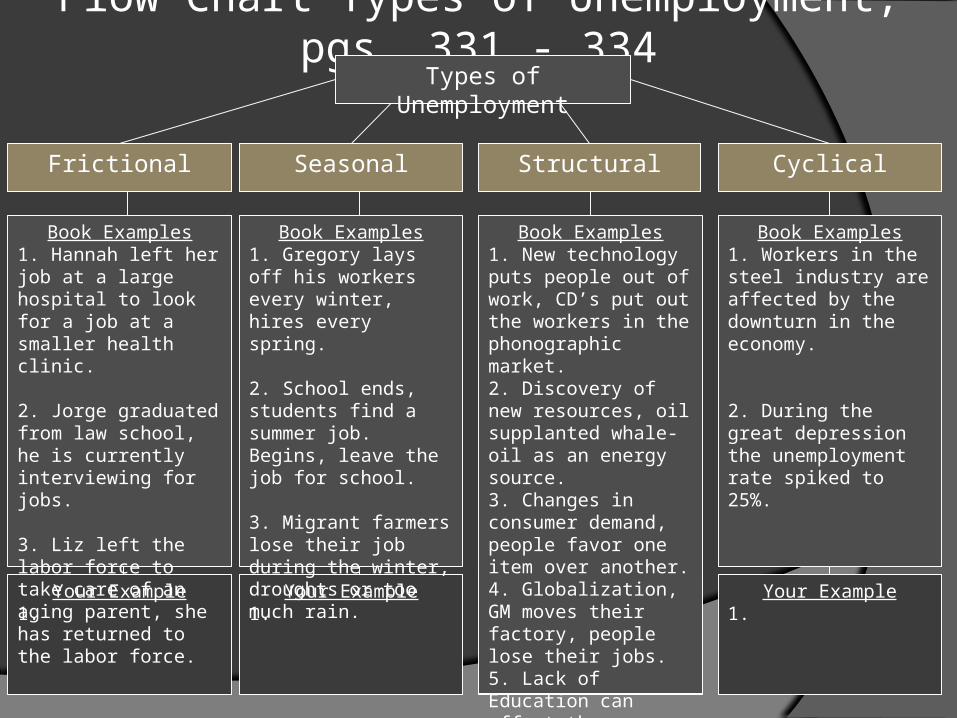
Flow Chart Types of Unemployment, pgs. 331 - 334
Frictional Seasonal Structural Cyclical
Types of Unemployment
Your Example1.
Your Example1.
Your Example1.
Your Example1.
Book Examples1.
2.
3.
Book Examples1.
2.
3.
Book Examples1.
2.
3.
4.
5.
Book Examples1.
2.
Flow Chart Types of Unemployment, pgs. 331 - 334
Frictional Seasonal Structural Cyclical
Types of Unemployment
Your Example1.
Your Example1.
Your Example1.
Your Example1.
Book Examples1. Hannah left her job at a large hospital to look for a job at a smaller health clinic.
2. Jorge graduated from law school, he is currently interviewing for jobs.
3. Liz left the labor force to take care of an aging parent, she has returned to the labor force.
Book Examples1.
2.
3.
Book Examples1.
2.
3.
4.
5.
Book Examples1.
2.
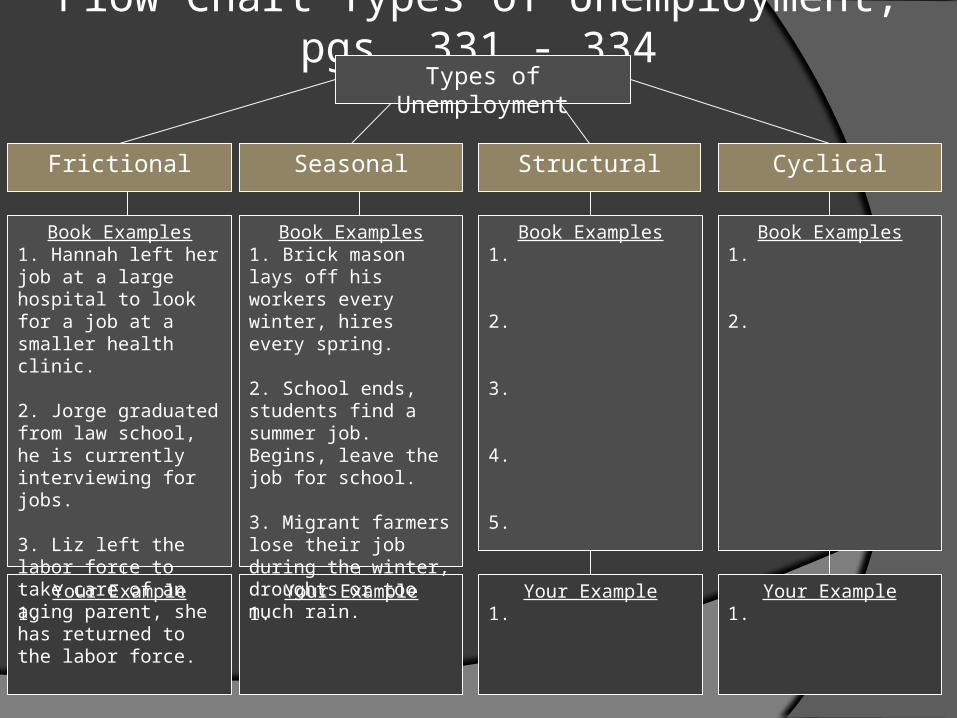
Flow Chart Types of Unemployment, pgs. 331 - 334
Frictional Seasonal Structural Cyclical
Types of Unemployment
Your Example1.
Your Example1.
Your Example1.
Your Example1.
Book Examples1. Hannah left her job at a large hospital to look for a job at a smaller health clinic.
2. Jorge graduated from law school, he is currently interviewing for jobs.
3. Liz left the labor force to take care of an aging parent, she has returned to the labor force.
Book Examples1. Brick mason lays off his workers every winter, hires every spring.
2. School ends, students find a summer job. Begins, leave the job for school.
3. Migrant farmers lose their job during the winter, droughts or too much rain.
Book Examples1.
2.
3.
4.
5.
Book Examples1.
2.
Flow Chart Types of Unemployment, pgs. 331 - 334
Frictional Seasonal Structural Cyclical
Types of Unemployment
Your Example1.
Your Example1.
Your Example1.
Your Example1.
Book Examples1. Hannah left her job at a large hospital to look for a job at a smaller health clinic.
2. Jorge graduated from law school, he is currently interviewing for jobs.
3. Liz left the labor force to take care of an aging parent, she has returned to the labor force.
Book Examples1. Gregory lays off his workers every winter, hires every spring.
2. School ends, students find a summer job. Begins, leave the job for school.
3. Migrant farmers lose their job during the winter, droughts or too much rain.
Book Examples1.
2.
3.
4.
5.
Book Examples1.
2.
Book Examples1. New technology puts people out of work, CD’s put out the workers in the phonographic market.2. Discovery of new resources, oil supplanted whale-oil as an energy source.3. Changes in consumer demand, people favor one item over another.4. Globalization, GM moves their factory, people lose their jobs.5. Lack of Education can affect the marketability of an individual looking for a job.
Flow Chart Types of Unemployment, pgs. 331 - 334
Frictional Seasonal Structural Cyclical
Types of Unemployment
Your Example1.
Your Example1.
Your Example1.
Your Example1.
Book Examples1. Hannah left her job at a large hospital to look for a job at a smaller health clinic.
2. Jorge graduated from law school, he is currently interviewing for jobs.
3. Liz left the labor force to take care of an aging parent, she has returned to the labor force.
Book Examples1. Gregory lays off his workers every winter, hires every spring.
2. School ends, students find a summer job. Begins, leave the job for school.
3. Migrant farmers lose their job during the winter, droughts or too much rain.
Book Examples1. New technology puts people out of work, CD’s put out the workers in the phonographic market.2. Discovery of new resources, oil supplanted whale-oil as an energy source.3. Changes in consumer demand, people favor one item over another.4. Globalization, GM moves their factory, people lose their jobs.5. Lack of Education can affect the marketability of an individual looking for a job.
Book Examples1. Workers in the steel industry are affected by the downturn in the economy.
2. During the great depression the unemployment rate spiked to 25%.
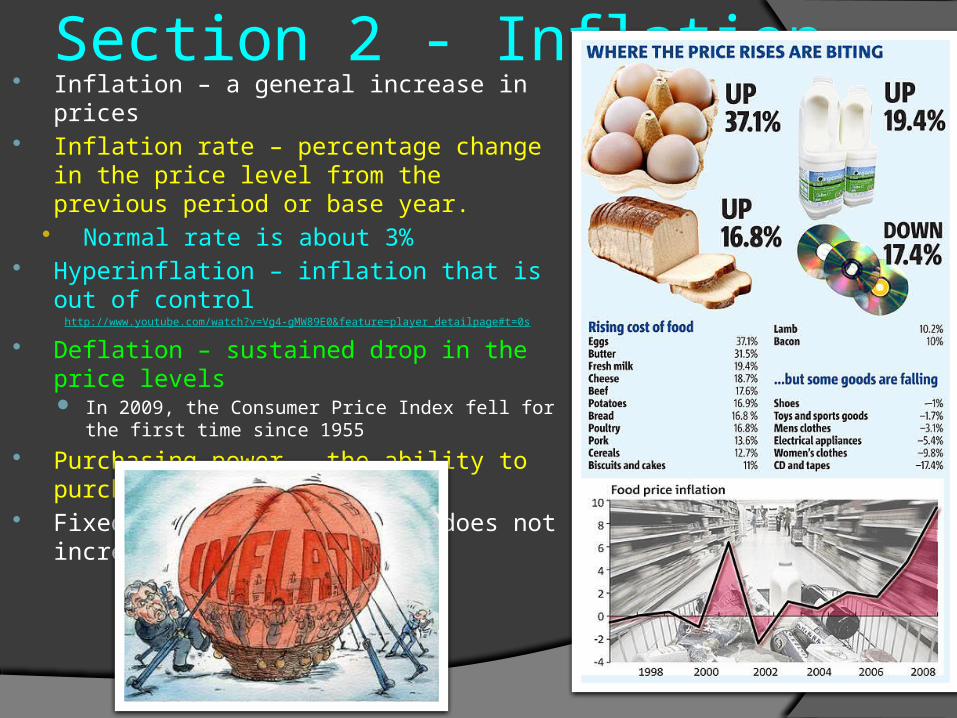
Section 2 - Inflation Inflation – a general increase in prices Inflation rate – percentage change in the price
level from the previous period or base year. Normal rate is about 3%
Hyperinflation – inflation that is out of control http://www.youtube.com/watch?v=Vg4-gMW89E0&feature=player_detailpage#t=0s
Deflation – sustained drop in the price levels In 2009, the Consumer Price Index fell for the first time
since 1955
Purchasing power – the ability to purchase goods and services
Fixed Income – income that does not increase when prices go up
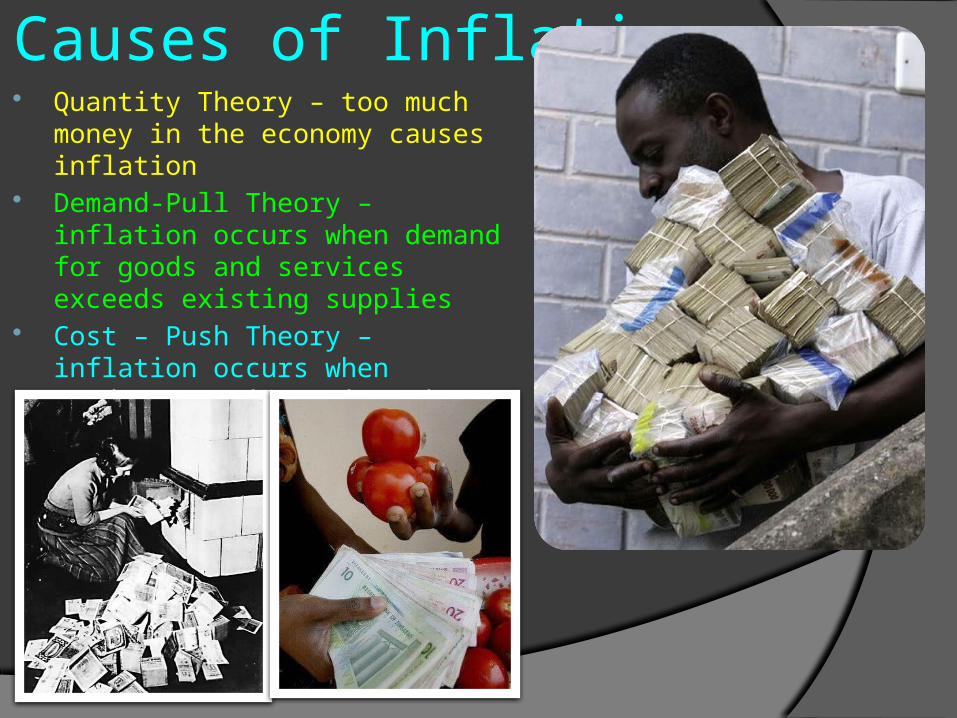
Causes of Inflation Quantity Theory – too much money in
the economy causes inflation Demand-Pull Theory – inflation
occurs when demand for goods and services exceeds existing supplies
Cost – Push Theory – inflation occurs when producers raise prices in order to meet increasing costs of inputs

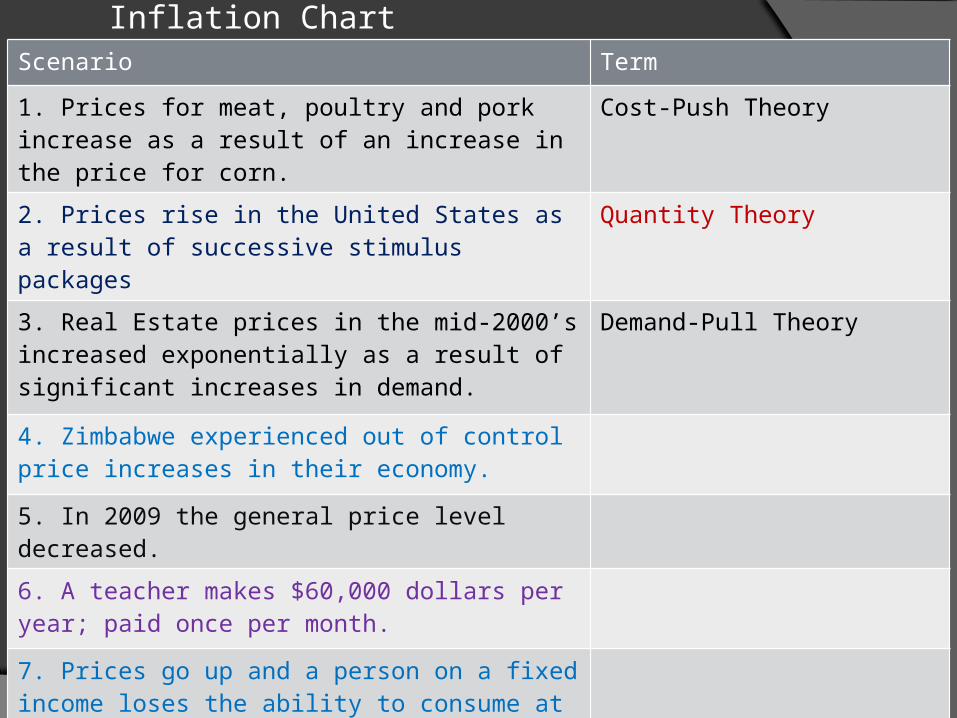
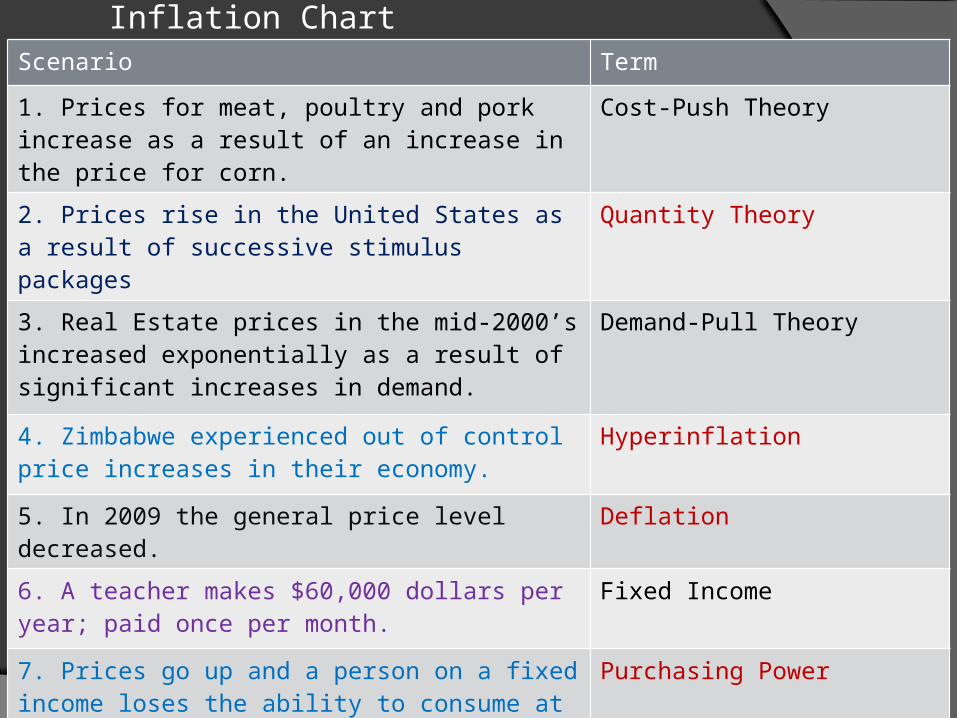
Inflation ChartScenario Term
1. Prices for meat, poultry and pork increase as a result of an increase in the price for corn.
2. Prices rise in the United States as a result of successive stimulus packages
3. Real Estate prices in the mid-2000’s increased exponentially as a result of significant increases in demand.
4. Zimbabwe experienced out of control price increases in their economy.
5. In 2009 the general price level decreased.
6. A teacher makes $60,000 dollars per year; paid once per month.
7. Prices go up and a person on a fixed income loses the ability to consume at the same rate.

Inflation ChartScenario Term
1. Prices for meat, poultry and pork increase as a result of an increase in the price for corn.
Cost-Push Theory
2. Prices rise in the United States as a result of successive stimulus packages
Quantity Theory
3. Real Estate prices in the mid-2000’s increased exponentially as a result of significant increases in demand.
4. Zimbabwe experienced out of control price increases in their economy.
5. In 2009 the general price level decreased.
6. A teacher makes $60,000 dollars per year; paid once per month.
7. Prices go up and a person on a fixed income loses the ability to consume at the same rate.
Inflation ChartScenario Term
1. Prices for meat, poultry and pork increase as a result of an increase in the price for corn.
Cost-Push Theory
2. Prices rise in the United States as a result of successive stimulus packages
Quantity Theory
3. Real Estate prices in the mid-2000’s increased exponentially as a result of significant increases in demand.
Demand-Pull Theory
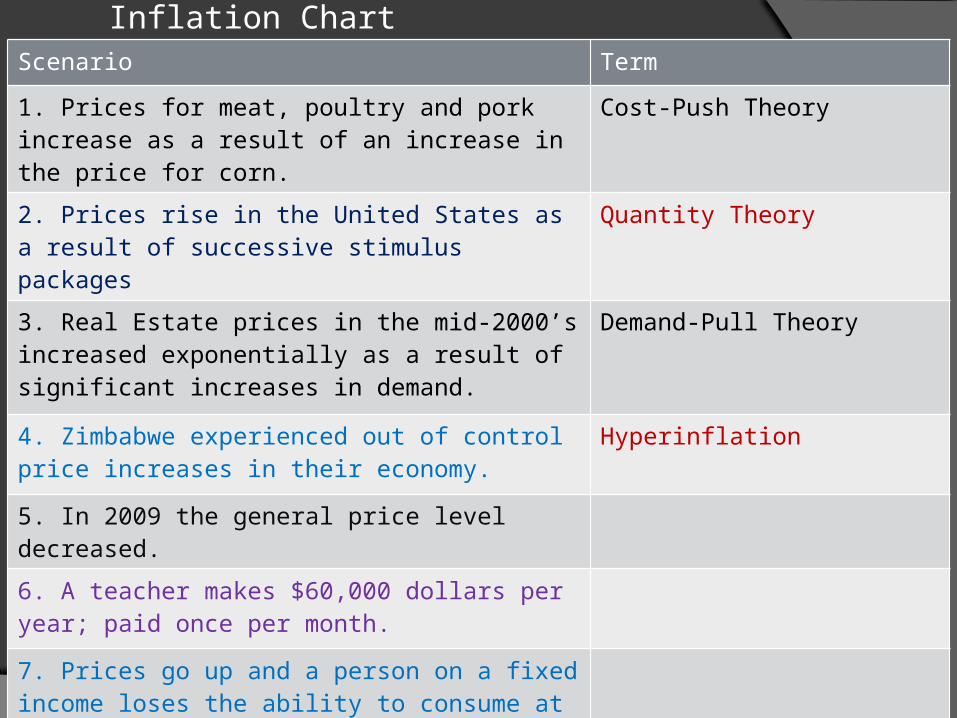
4. Zimbabwe experienced out of control price increases in their economy.
Hyperinflation
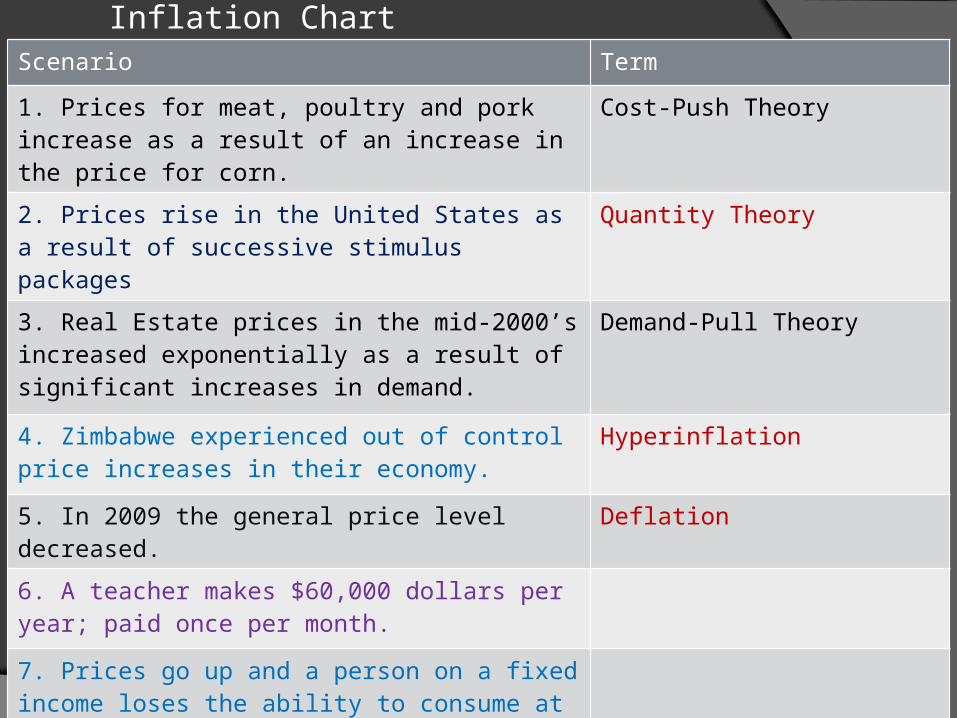
5. In 2009 the general price level decreased.
6. A teacher makes $60,000 dollars per year; paid once per month.
7. Prices go up and a person on a fixed income loses the ability to consume at the same rate.
Inflation ChartScenario Term
1. Prices for meat, poultry and pork increase as a result of an increase in the price for corn.
Cost-Push Theory
2. Prices rise in the United States as a result of successive stimulus packages
Quantity Theory
3. Real Estate prices in the mid-2000’s increased exponentially as a result of significant increases in demand.
Demand-Pull Theory
4. Zimbabwe experienced out of control price increases in their economy.
Hyperinflation
5. In 2009 the general price level decreased. Deflation
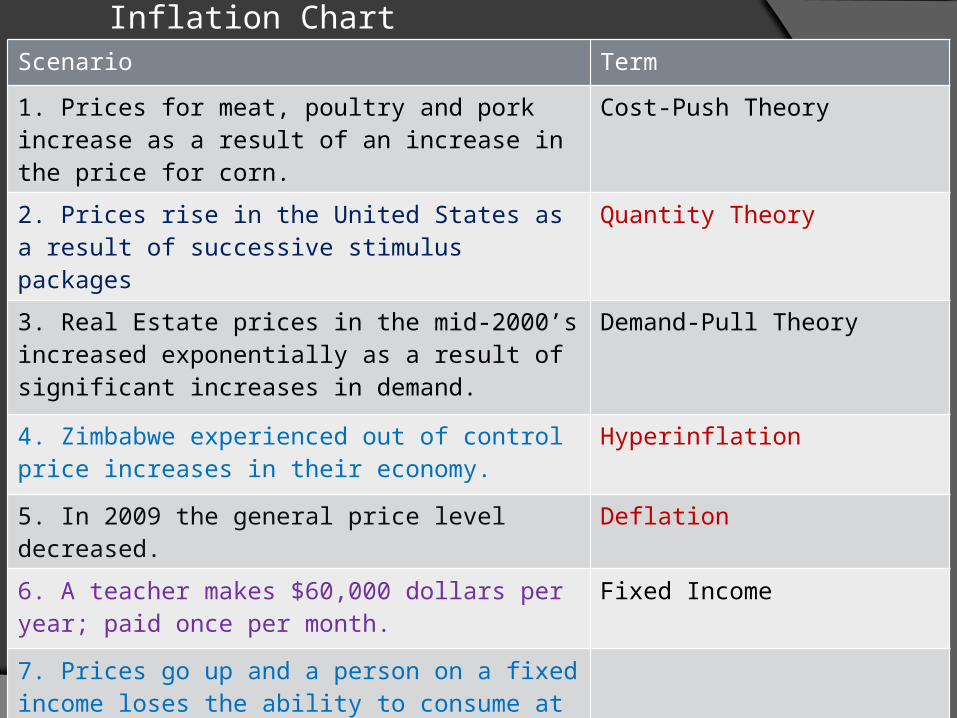
6. A teacher makes $60,000 dollars per year; paid once per month.
Fixed Income
7. Prices go up and a person on a fixed income loses the ability to consume at the same rate.
Inflation ChartScenario Term
1. Prices for meat, poultry and pork increase as a result of an increase in the price for corn.
Cost-Push Theory
2. Prices rise in the United States as a result of successive stimulus packages
Quantity Theory
3. Real Estate prices in the mid-2000’s increased exponentially as a result of significant increases in demand.
Demand-Pull Theory
4. Zimbabwe experienced out of control price increases in their economy.
Hyperinflation
5. In 2009 the general price level decreased. Deflation
6. A teacher makes $60,000 dollars per year; paid once per month.
Fixed Income
7. Prices go up and a person on a fixed income loses the ability to consume at the same rate.
Purchasing Power
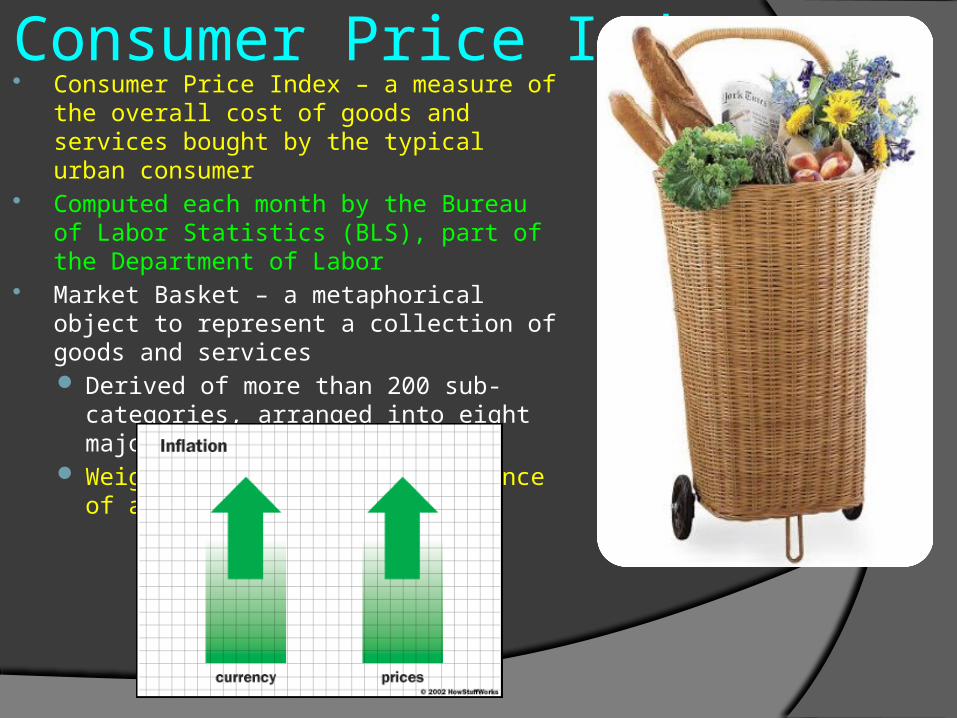
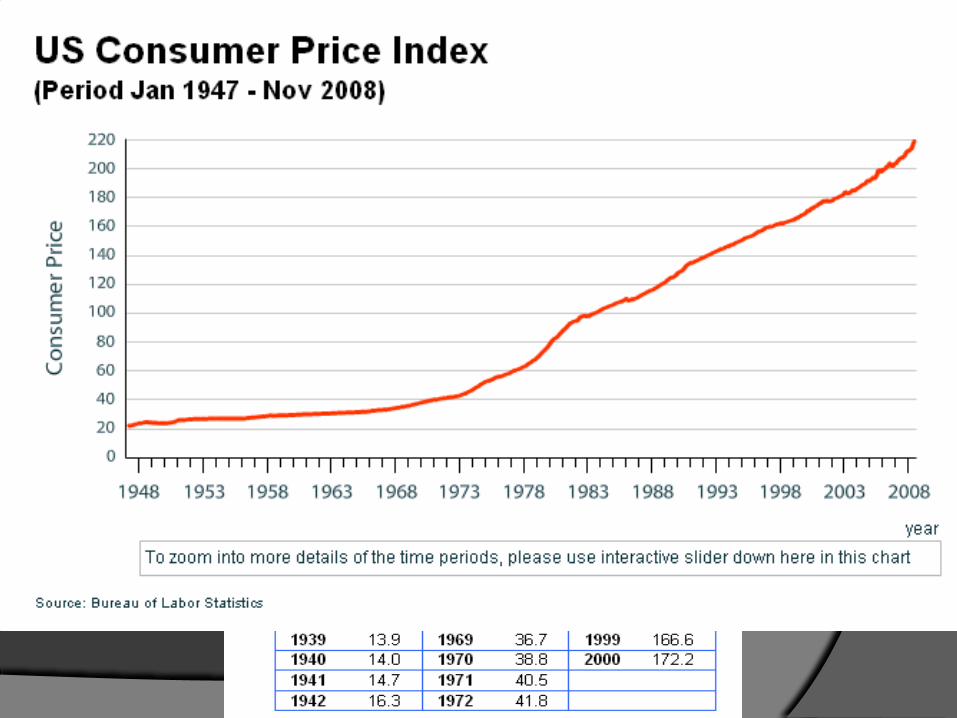
Consumer Price Index Consumer Price Index – a measure of the
overall cost of goods and services bought by the typical urban consumer
Computed each month by the Bureau of Labor Statistics (BLS), part of the Department of Labor
Market Basket – a metaphorical object to represent a collection of goods and services Derived of more than 200 sub-categories,
arranged into eight major groups Weighted based on the importance of an
item to the consumer
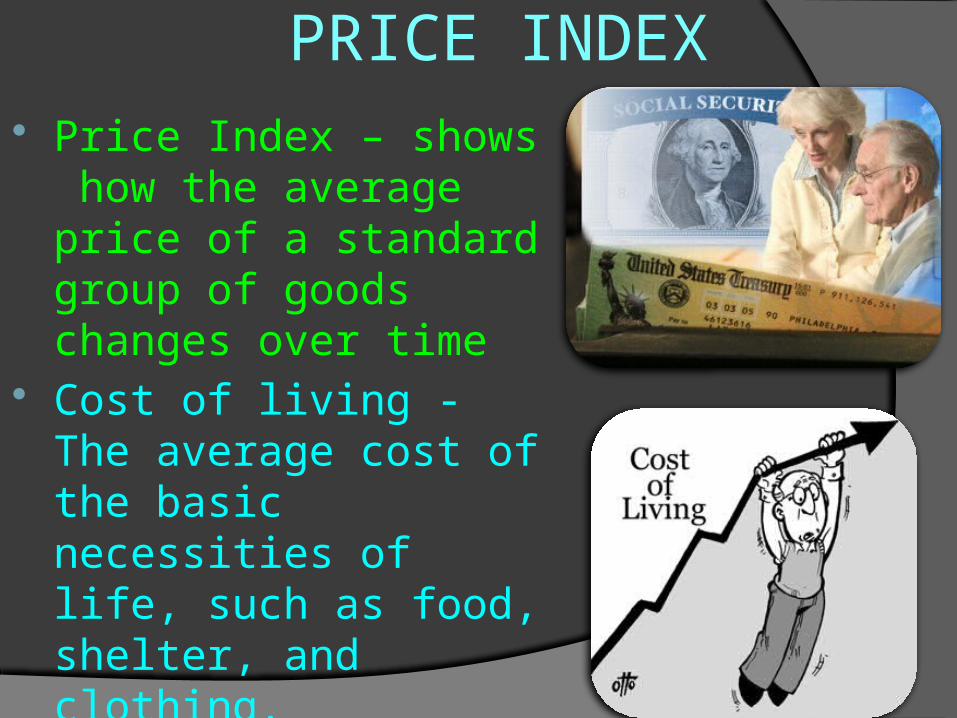
Price Index – shows how the average price of a standard group of goods changes over time
Cost of living - The average cost of the basic necessities of life, such as food, shelter, and clothing.
PRICE INDEX
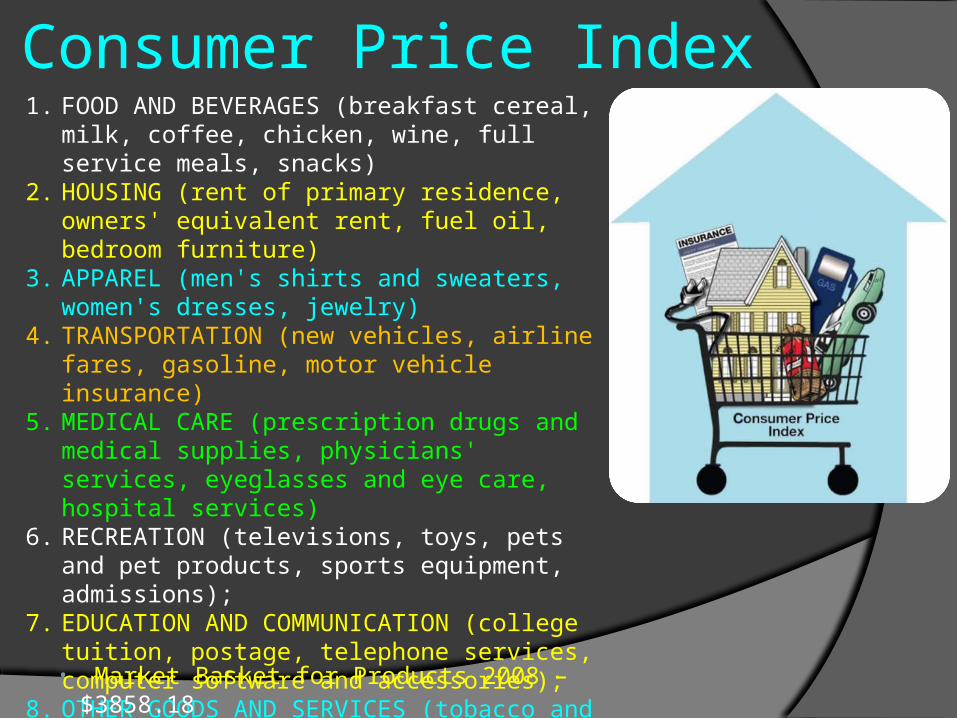
1. FOOD AND BEVERAGES (breakfast cereal, milk, coffee, chicken, wine, full service meals, snacks)
2. HOUSING (rent of primary residence, owners' equivalent rent, fuel oil, bedroom furniture)
3. APPAREL (men's shirts and sweaters, women's dresses, jewelry)
4. TRANSPORTATION (new vehicles, airline fares, gasoline, motor vehicle insurance)
5. MEDICAL CARE (prescription drugs and medical supplies, physicians' services, eyeglasses and eye care, hospital services)
6. RECREATION (televisions, toys, pets and pet products, sports equipment, admissions);
7. EDUCATION AND COMMUNICATION (college tuition, postage, telephone services, computer software and accessories);
8. OTHER GOODS AND SERVICES (tobacco and smoking products, haircuts and other personal services, funeral expenses).
Consumer Price Index
• Market Basket for Products 2008 – $3858.18

The typical basket of goods and services
This figure shows how the typical urban consumer divides spending among various categories of goods and services. The Bureau of Labor Statistics calls each percentage the “relative importance” of the category.
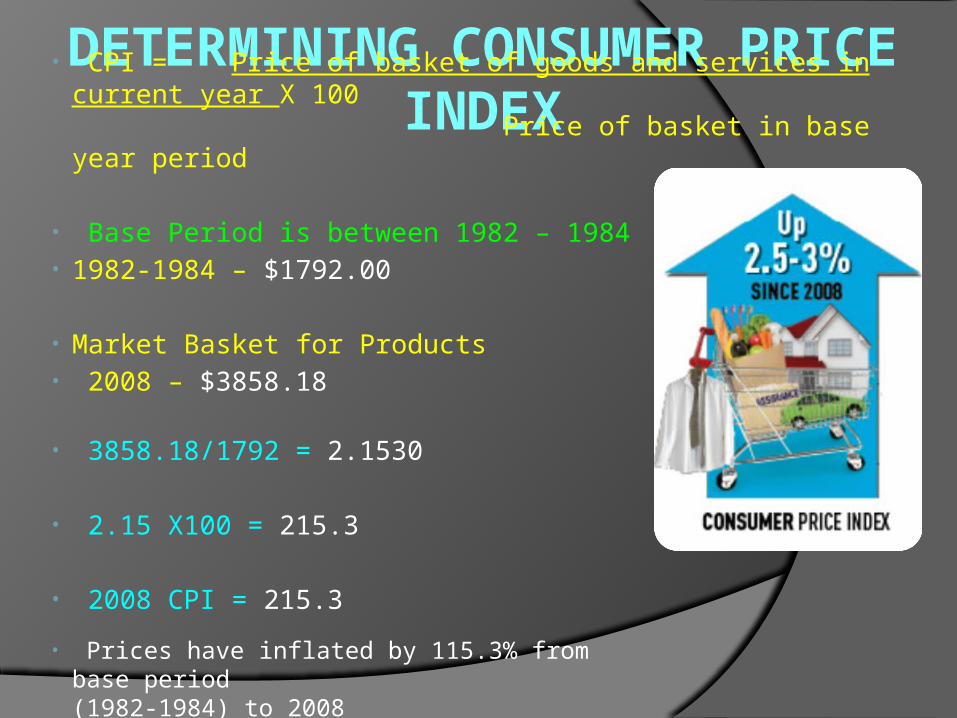
DETERMINING CONSUMER PRICE INDEX• CPI = Price of basket of goods and services in current year X 100
Price of basket in base year period
• Base Period is between 1982 – 1984• 1982-1984 – $1792.00
• Market Basket for Products• 2008 – $3858.18
• 3858.18/1792 = 2.1530
• 2.15 X100 = 215.3
• 2008 CPI = 215.3
• Prices have inflated by 115.3% from base period (1982-1984) to 2008

DETERMINING INFLATION• Inflation = CPI in year 2 – CPI in year 1 X 100
CPI in year 1• 2008 – 215.30• 2007 – 207.34• 215.30 – 207.34 = 7.96
• 7.96/207.34 = .0384
• .0384 X 100 = 3.84%
• Prices have inflated by 3.84% from 2007 to 2008

Determining CPIYear CPI Conversion
2008 3858.18/1792 = 2.153 x 100 = 215.30
2007
2006
2005
2004
2003
2002
2001
2000
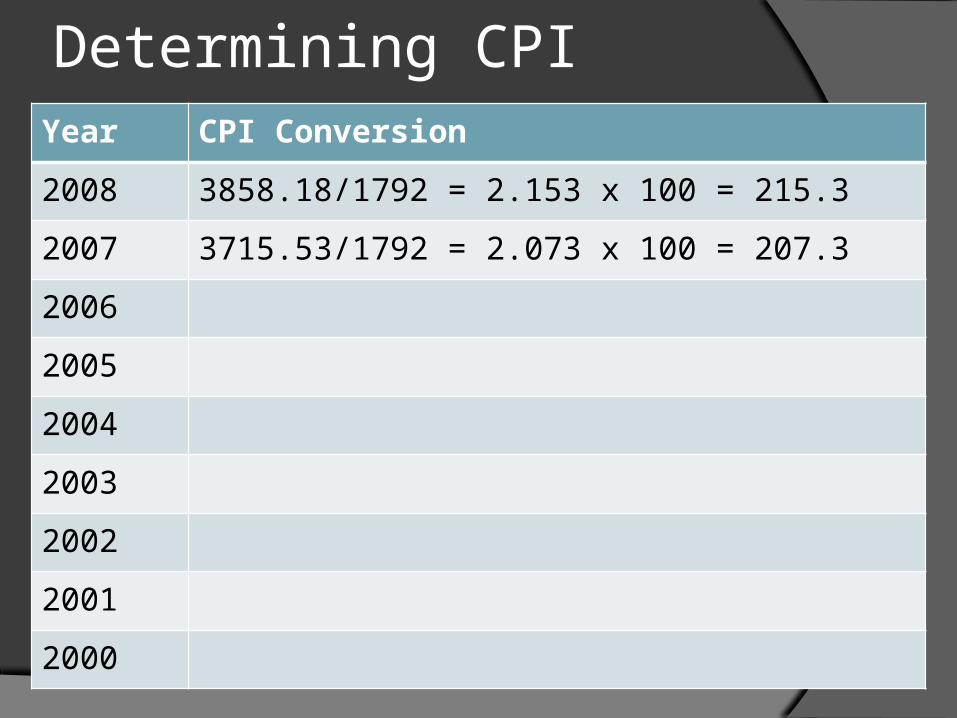
Determining CPIYear CPI Conversion
2008 3858.18/1792 = 2.153 x 100 = 215.3
2007 3715.53/1792 = 2.073 x 100 = 207.3
2006
2005
2004
2003
2002
2001
2000
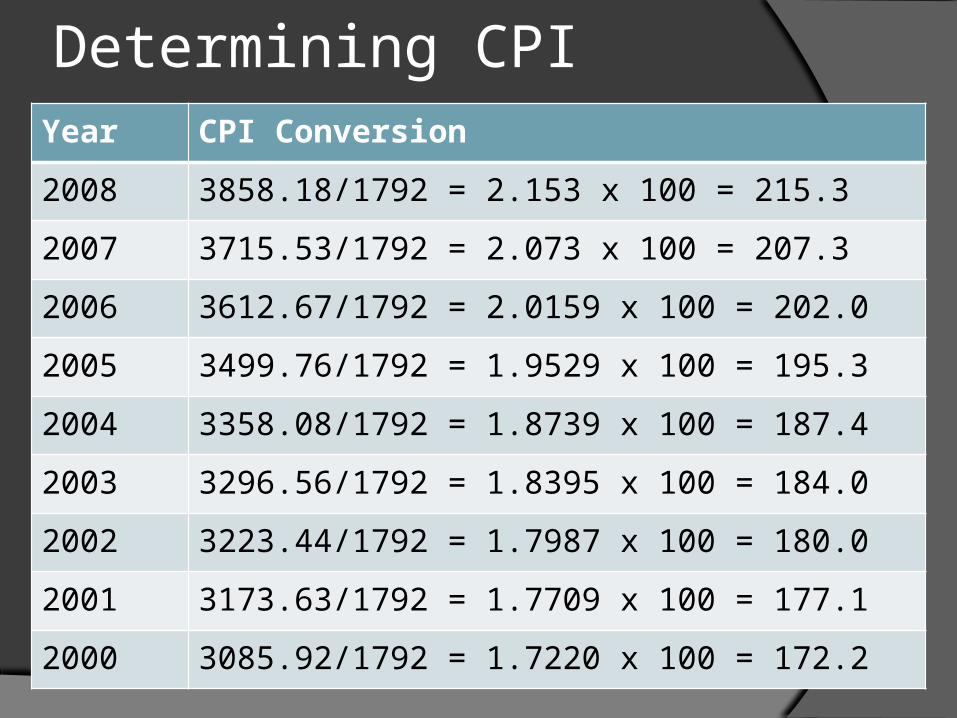
Determining CPIYear CPI Conversion
2008 3858.18/1792 = 2.153 x 100 = 215.3
2007 3715.53/1792 = 2.073 x 100 = 207.3
2006 3612.67/1792 = 2.0159 x 100 = 202.0
2005 3499.76/1792 = 1.9529 x 100 = 195.3
2004 3358.08/1792 = 1.8739 x 100 = 187.4
2003 3296.56/1792 = 1.8395 x 100 = 184.0
2002 3223.44/1792 = 1.7987 x 100 = 180.0
2001 3173.63/1792 = 1.7709 x 100 = 177.1
2000 3085.92/1792 = 1.7220 x 100 = 172.2

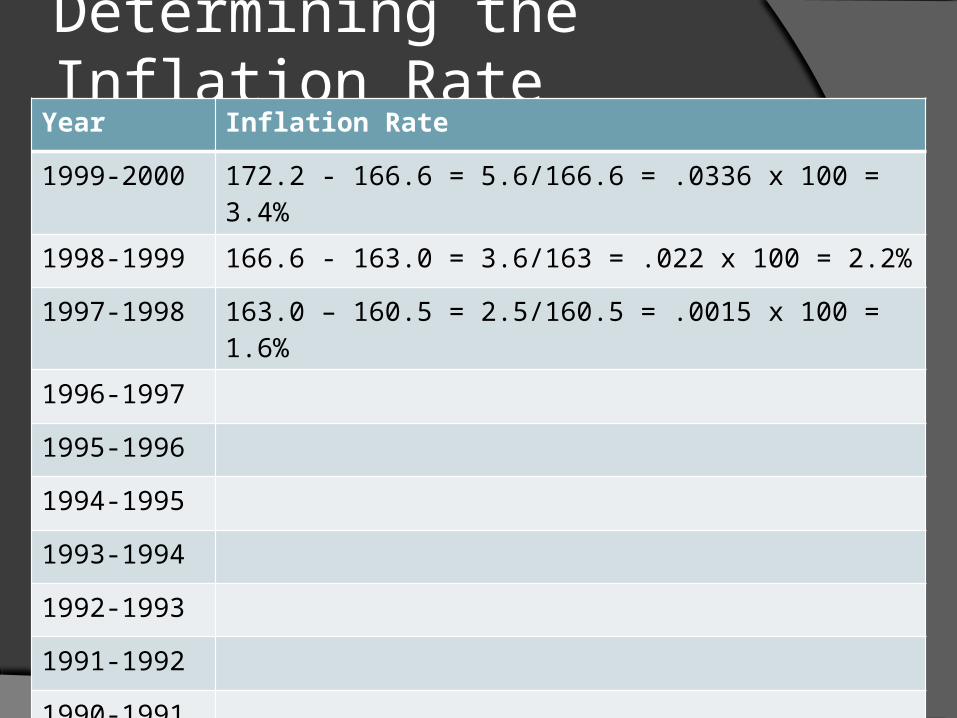
Determining the Inflation Rate
Year Inflation Rate
1999-2000 172.2 - 166.6 = 5.6/166.6 = .0336 x 100 = 3.4%
1998-1999
1997-1998
1996-1997
1995-1996
1994-1995
1993-1994
1992-1993
1991-1992
1990-1991

Determining the Inflation Rate
Year Inflation Rate
1999-2000 172.2 - 166.6 = 5.6/166.6 = .0336 x 100 = 3.4%
1998-1999 166.6 - 163.0 = 3.6/163 = .022 x 100 = 2.2%
1997-1998
1996-1997
1995-1996
1994-1995
1993-1994
1992-1993
1991-1992
1990-1991
Determining the Inflation Rate
Year Inflation Rate
1999-2000 172.2 - 166.6 = 5.6/166.6 = .0336 x 100 = 3.4%
1998-1999 166.6 - 163.0 = 3.6/163 = .022 x 100 = 2.2%
1997-1998 163.0 – 160.5 = 2.5/160.5 = .0015 x 100 = 1.6%
1996-1997
1995-1996
1994-1995
1993-1994
1992-1993
1991-1992
1990-1991
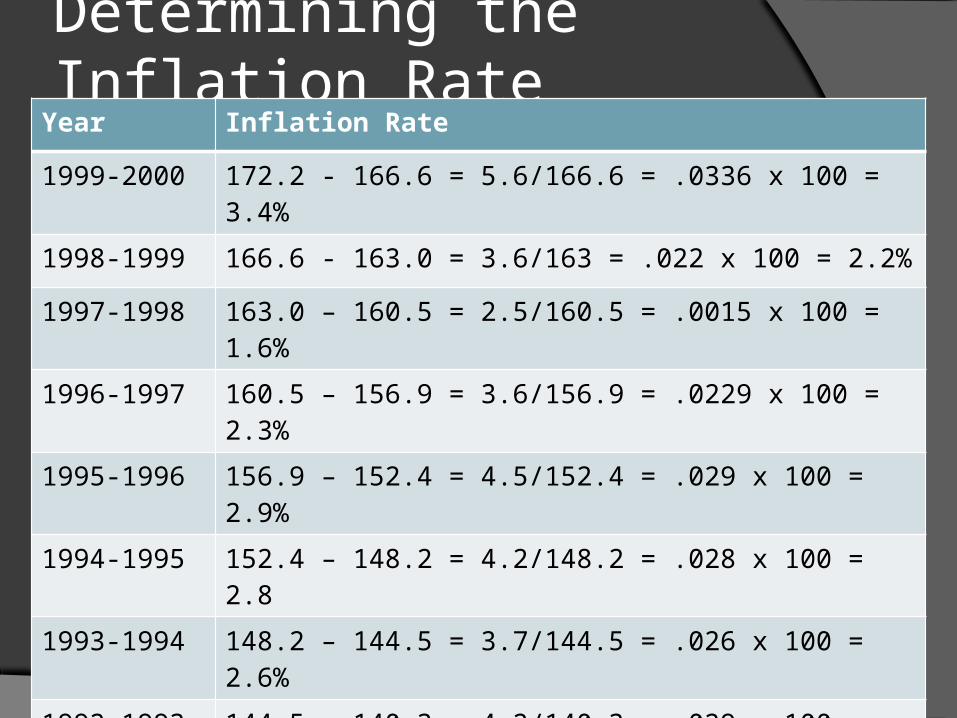
Determining the Inflation Rate
Year Inflation Rate
1999-2000 172.2 - 166.6 = 5.6/166.6 = .0336 x 100 = 3.4%
1998-1999 166.6 - 163.0 = 3.6/163 = .022 x 100 = 2.2%
1997-1998 163.0 – 160.5 = 2.5/160.5 = .0015 x 100 = 1.6%
1996-1997 160.5 – 156.9 = 3.6/156.9 = .0229 x 100 = 2.3%
1995-1996 156.9 – 152.4 = 4.5/152.4 = .029 x 100 = 2.9%
1994-1995 152.4 – 148.2 = 4.2/148.2 = .028 x 100 = 2.8
1993-1994 148.2 – 144.5 = 3.7/144.5 = .026 x 100 = 2.6%
1992-1993 144.5 – 140.3 = 4.2/140.3 = .029 x 100 = 2.9%
1991-1992 140.3 – 136.2 = 4.1/136.2 = .03 x 100 = 3.0%
1990-1991 136.2 – 130.7 = 5.5/130.7 = .04 x 100 = 4.2%
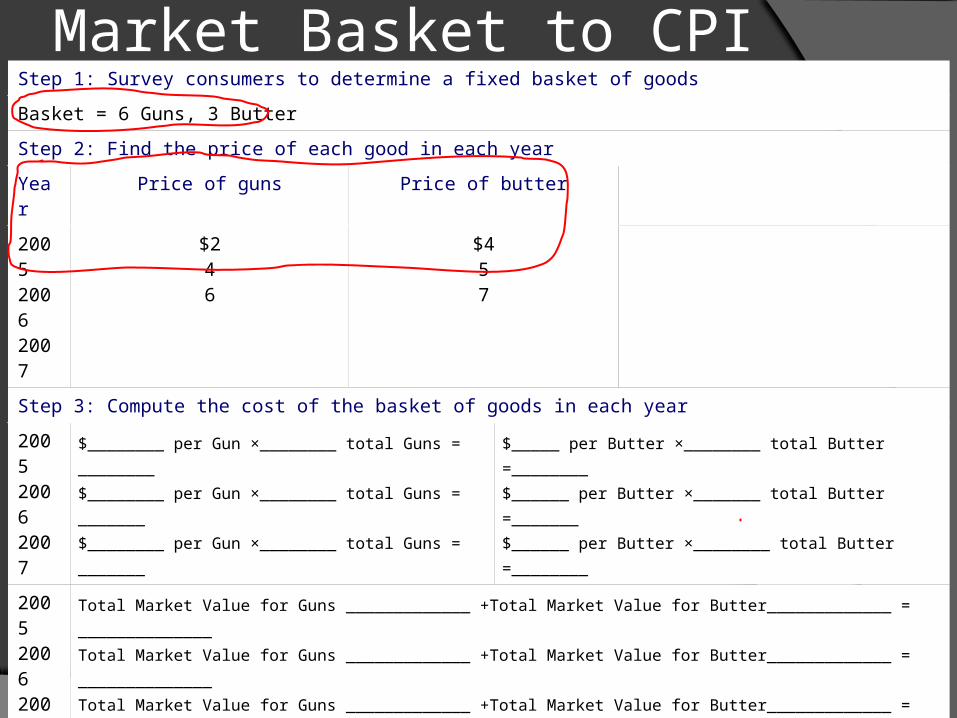
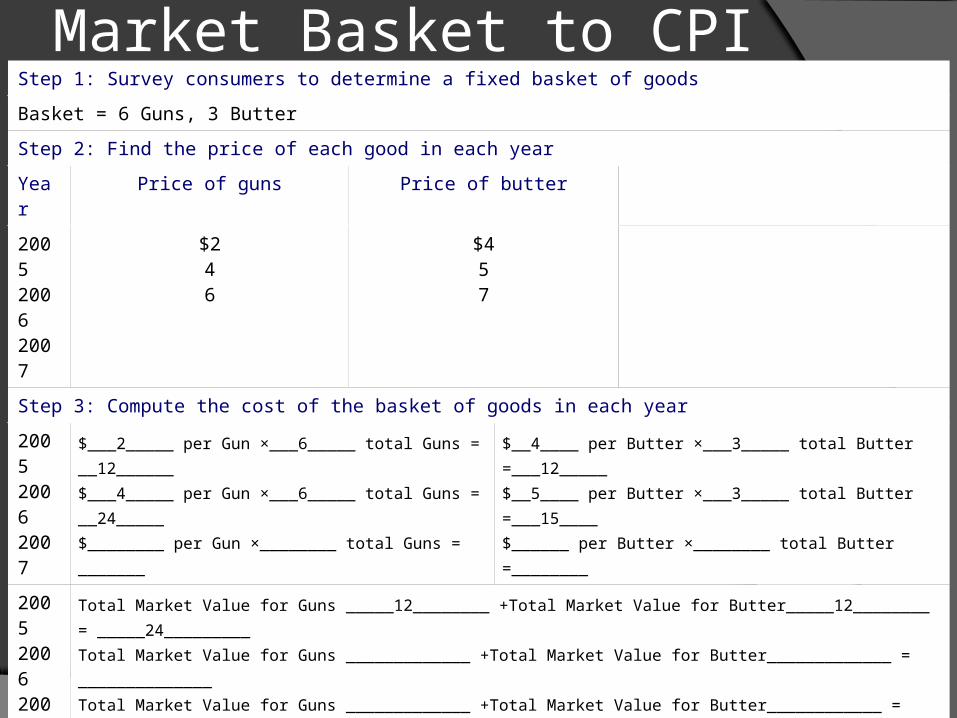
Market Basket to CPIStep 1: Survey consumers to determine a fixed basket of goods
Basket = 6 Guns, 3 Butter
Step 2: Find the price of each good in each year
Year Price of guns Price of butter
200520062007
$246
$457
Step 3: Compute the cost of the basket of goods in each year
200520062007
$________ per Gun ×________ total Guns = ________$________ per Gun ×________ total Guns = _______$________ per Gun ×________ total Guns = _______
$_____ per Butter ×________ total Butter =________$______ per Butter ×_______ total Butter =_______$______ per Butter ×________ total Butter =________
200520062007
Total Market Value for Guns _____________ +Total Market Value for Butter_____________ = ______________ Total Market Value for Guns _____________ +Total Market Value for Butter_____________ = ______________Total Market Value for Guns _____________ +Total Market Value for Butter_____________ = ______________
Step 4: Choose one year as a base year (2005) and compute the CPI in each year
200520062007
CPI = $___________ (2005)/___________(2005) = __________ X 100 = __________CPI = $____________ (2006)/___________(2005) = ___________ X 100 = ________CPI = $___________ (2007)/___________(2005) = ___________ X 100 = _________
Step 5: Use the consumer price index to compute the inflation rate from previous year
20062007

Market Basket to CPIStep 1: Survey consumers to determine a fixed basket of goods
Basket = 6 Guns, 3 Butter
Step 2: Find the price of each good in each year
Year Price of guns Price of butter
200520062007
$246
$457
Step 3: Compute the cost of the basket of goods in each year
200520062007
$___2_____ per Gun ×___6_____ total Guns = __12______$________ per Gun ×________ total Guns = _______$________ per Gun ×________ total Guns = _______
$__4____ per Butter ×___3_____ total Butter =___12_____$______ per Butter ×_______ total Butter =_______$______ per Butter ×________ total Butter =________
200520062007
Total Market Value for Guns _____12________ +Total Market Value for Butter_____12________ = _____24_________ Total Market Value for Guns _____________ +Total Market Value for Butter_____________ = ______________Total Market Value for Guns _____________ +Total Market Value for Butter_____________ = ______________
Step 4: Choose one year as a base year (2005) and compute the CPI in each year
200520062007
CPI = $_____24_______ (2005)/_____24______(2005) = _____1______ X 100 = ____100_____CPI = $____________ (2006)/___________(2005) = ___________ X 100 = ________CPI = $___________ (2007)/___________(2005) = ___________ X 100 = _________
Step 5: Use the consumer price index to compute the inflation rate from previous year
20062007
Market Basket to CPIStep 1: Survey consumers to determine a fixed basket of goods
Basket = 6 Guns, 3 Butter
Step 2: Find the price of each good in each year
Year Price of guns Price of butter
200520062007
$246
$457
Step 3: Compute the cost of the basket of goods in each year
200520062007
$___2_____ per Gun ×___6_____ total Guns = __12______$___4_____ per Gun ×___6_____ total Guns = __24_____$________ per Gun ×________ total Guns = _______
$__4____ per Butter ×___3_____ total Butter =___12_____$__5____ per Butter ×___3_____ total Butter =___15____$______ per Butter ×________ total Butter =________
200520062007
Total Market Value for Guns _____12________ +Total Market Value for Butter_____12________ = _____24_________ Total Market Value for Guns _____________ +Total Market Value for Butter_____________ = ______________Total Market Value for Guns _____________ +Total Market Value for Butter____________ = ______________
Step 4: Choose one year as a base year (2005) and compute the CPI in each year
200520062007
CPI = $_____24_______ (2005)/_____24______(2005) = _____1______ X 100 = ____100_______CPI = $____________ (2006)/___________(2005) = ___________ X 100 = ________CPI = $___________ (2007)/___________(2005) = ___________ X 100 = _________
Step 5: Use the consumer price index to compute the inflation rate from previous year
20062007

Market Basket to CPIStep 1: Survey consumers to determine a fixed basket of goods
Basket = 6 Guns, 3 Butter
Step 2: Find the price of each good in each year
Year Price of guns Price of butter
200520062007
$246
$457
Step 3: Compute the cost of the basket of goods in each year
200520062007
$___2_____ per Gun ×___6_____ total Guns = __12______$___4_____ per Gun ×___6_____ total Guns = __24_____$________ per Gun ×________ total Guns = _______
$__4____ per Butter ×___3_____ total Butter =___12_____$__5____ per Butter ×___3_____ total Butter =___15____$______ per Butter ×________ total Butter =________
200520062007
Total Market Value for Guns _____12________ +Total Market Value for Butter_____12________ = _____24_________ Total Market Value for Guns _____24________ +Total Market Value for Butter_____15________ = _____39_________Total Market Value for Guns _____________ +Total Market Value for Butter____________ = ______________
Step 4: Choose one year as a base year (2005) and compute the CPI in each year
200520062007
CPI = $_____24_______ (2005)/_____24______(2005) = _____1______ X 100 = ____100_______CPI = $_____39_______ (2006)/____24_______(2005) = ___1.625________ X 100 = __162.5______
CPI = $___________ (2007)/___________(2005) = ___________ X 100 = _________
Step 5: Use the consumer price index to compute the inflation rate from previous year
20062007

Market Basket to CPIStep 1: Survey consumers to determine a fixed basket of goods
Basket = 6 Guns, 3 Butter
Step 2: Find the price of each good in each year
Year Price of guns Price of butter
200520062007
$246
$457
Step 3: Compute the cost of the basket of goods in each year
200520062007
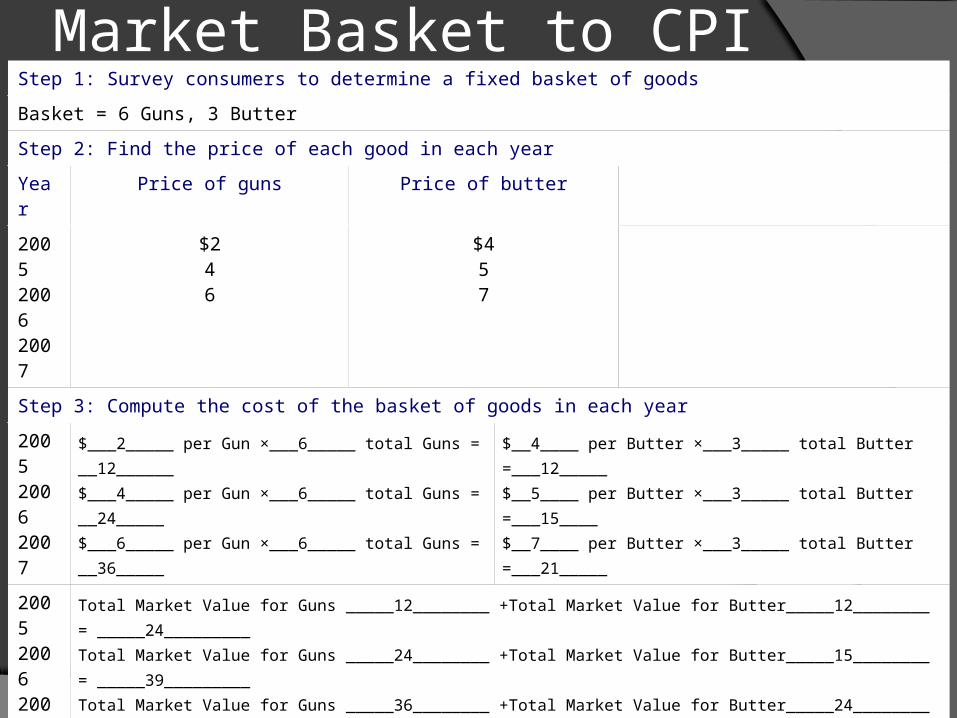
$___2_____ per Gun ×___6_____ total Guns = __12______$___4_____ per Gun ×___6_____ total Guns = __24_____$___6_____ per Gun ×___6_____ total Guns = __36_____
$__4____ per Butter ×___3_____ total Butter =___12_____$__5____ per Butter ×___3_____ total Butter =___15____$__7____ per Butter ×___3_____ total Butter =___21_____
200520062007
Total Market Value for Guns _____12________ +Total Market Value for Butter_____12________ = _____24_________ Total Market Value for Guns _____24________ +Total Market Value for Butter_____15________ = _____39_________Total Market Value for Guns _____36________ +Total Market Value for Butter_____21________ = _____57_________
Step 4: Choose one year as a base year (2005) and compute the CPI in each year
200520062007
CPI = $_____24_______ (2005)/_____24______(2005) = _____1______ X 100 = ____100_______CPI = $_____39_______ (2006)/____24_______(2005) = ___1.625________ X 100 = __162.5______CPI = $_____57______ (2007)/____24_______(2005) = ___2.375________ X 100 = ____237.5_____
Step 5: Use the consumer price index to compute the inflation rate from previous year
20062007
Market Basket to CPIStep 1: Survey consumers to determine a fixed basket of goods
Basket = 6 Guns, 3 Butter
Step 2: Find the price of each good in each year
Year Price of guns Price of butter
200520062007
$246
$457
Step 3: Compute the cost of the basket of goods in each year
200520062007
$___2_____ per Gun ×___6_____ total Guns = __12______$___4_____ per Gun ×___6_____ total Guns = __24_____$___6_____ per Gun ×___6_____ total Guns = __36_____
$__4____ per Butter ×___3_____ total Butter =___12_____$__5____ per Butter ×___3_____ total Butter =___15____$__7____ per Butter ×___3_____ total Butter =___21_____
200520062007
Total Market Value for Guns _____12________ +Total Market Value for Butter_____12________ = _____24_________ Total Market Value for Guns _____24________ +Total Market Value for Butter_____15________ = _____39_________Total Market Value for Guns _____36________ +Total Market Value for Butter_____24________ = _____57_________
Step 4: Choose one year as a base year (2005) and compute the CPI in each year
200520062007
CPI = $_____24_______ (2005)/_____24______(2005) = _____1______ X 100 = ____100_______CPI = $_____39_______ (2006)/____24_______(2005) = ___1.625________ X 100 = __162.5______CPI = $_____57______ (2007)/____24_______(2005) = ___2.375________ X 100 = ____237.5_____
Step 5: Use the consumer price index to compute the inflation rate from previous year
20062007
(162.5 – 100) / 100 × 100 =

Market Basket to CPIStep 1: Survey consumers to determine a fixed basket of goods
Basket = 6 Guns, 3 Butter
Step 2: Find the price of each good in each year
Year Price of guns Price of butter
200520062007
$246
$457
Step 3: Compute the cost of the basket of goods in each year
200520062007
$___2_____ per Gun ×___6_____ total Guns = __12______$___4_____ per Gun ×___6_____ total Guns = __24_____$___6_____ per Gun ×___6_____ total Guns = __36_____
$__4____ per Butter ×___3_____ total Butter =___12_____$__5____ per Butter ×___3_____ total Butter =___15____$__7____ per Butter ×___3_____ total Butter =___21_____
200520062007
Total Market Value for Guns _____12________ +Total Market Value for Butter_____12________ = _____24_________ Total Market Value for Guns _____24________ +Total Market Value for Butter_____15________ = _____39_________Total Market Value for Guns _____36________ +Total Market Value for Butter_____24________ = _____57_________
Step 4: Choose one year as a base year (2005) and compute the CPI in each year
200520062007
CPI = $_____24_______ (2005)/_____24______(2005) = _____1______ X 100 = ____100_______CPI = $_____39_______ (2006)/____24_______(2005) = ___1.625________ X 100 = __162.5______CPI = $_____57______ (2007)/____24_______(2005) = ___2.375________ X 100 = ____237.5_____
Step 5: Use the consumer price index to compute the inflation rate from previous year
20062007
(162.5 – 100) / 100 × 100 = 62.5%

Market Basket to CPIStep 1: Survey consumers to determine a fixed basket of goods
Basket = 6 Guns, 3 Butter
Step 2: Find the price of each good in each year
Year Price of guns Price of butter
200520062007
$246
$457
Step 3: Compute the cost of the basket of goods in each year
200520062007
$___2_____ per Gun ×___6_____ total Guns = __12______$___4_____ per Gun ×___6_____ total Guns = __24_____$___6_____ per Gun ×___6_____ total Guns = __36_____
$__4____ per Butter ×___3_____ total Butter =___12_____$__5____ per Butter ×___3_____ total Butter =___15____$__7____ per Butter ×___3_____ total Butter =___21_____
200520062007
Total Market Value for Guns _____12________ +Total Market Value for Butter_____12________ = _____24_________ Total Market Value for Guns _____24________ +Total Market Value for Butter_____15________ = _____39_________Total Market Value for Guns _____36________ +Total Market Value for Butter_____24________ = _____57_________
Step 4: Choose one year as a base year (2005) and compute the CPI in each year
200520062007
CPI = $_____24_______ (2005)/_____24______(2005) = _____1______ X 100 = ____100_______CPI = $_____39_______ (2006)/____24_______(2005) = ___1.625________ X 100 = __162.5______CPI = $_____57______ (2007)/____24_______(2005) = ___2.375________ X 100 = ____237.5_____
Step 5: Use the consumer price index to compute the inflation rate from previous year
20062007
(162.5 – 100) / 100 × 100 = 62.5%(237.5 – 162.5) / 162.5 × 100 = 46.15%
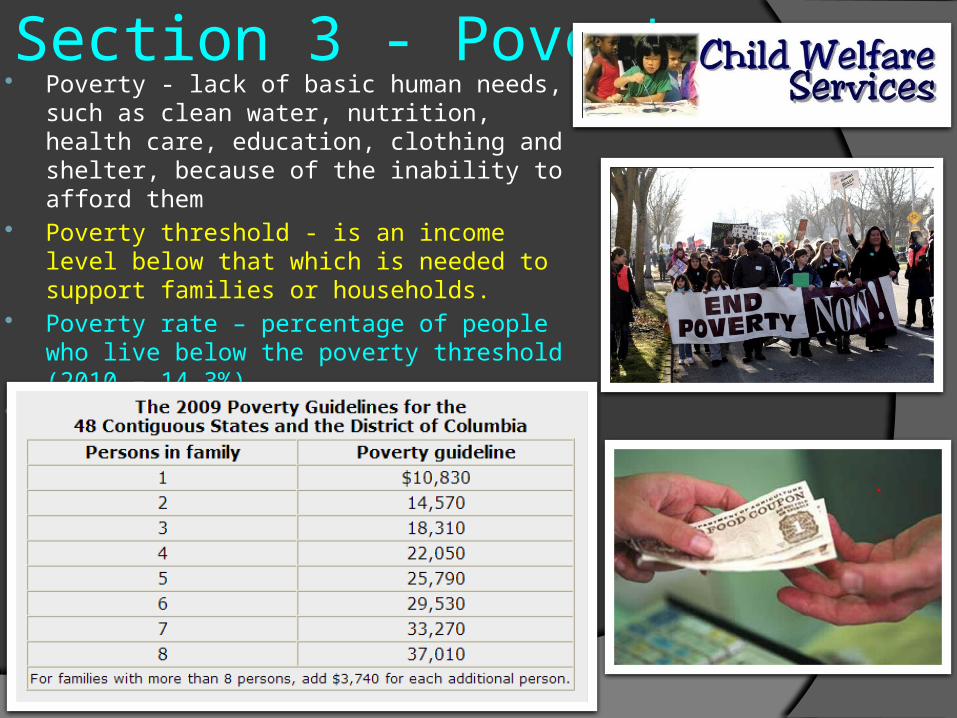
Section 3 - Poverty Poverty - lack of basic human needs, such as
clean water, nutrition, health care, education, clothing and shelter, because of the inability to afford them
Poverty threshold - is an income level below that which is needed to support families or households.
Poverty rate – percentage of people who live below the poverty threshold (2010 – 14.3%)
Poor – low income working poor, unemployed, homeless, children
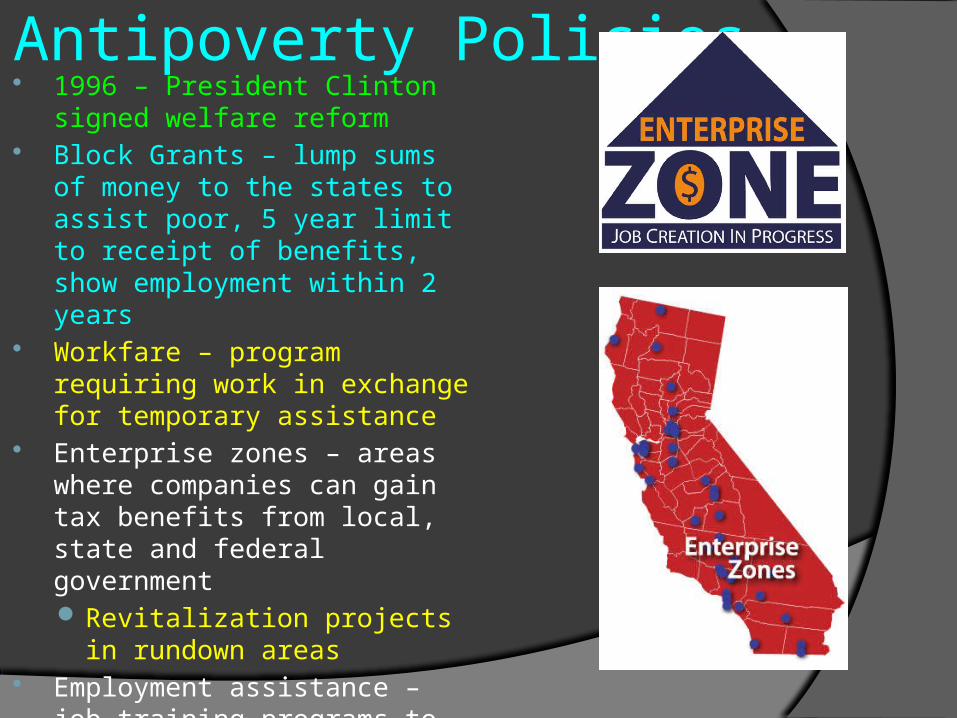
Antipoverty Policies 1996 – President Clinton signed
welfare reform Block Grants – lump sums of
money to the states to assist poor, 5 year limit to receipt of benefits, show employment within 2 years
Workfare – program requiring work in exchange for temporary assistance
Enterprise zones – areas where companies can gain tax benefits from local, state and federal government Revitalization projects in
rundown areas Employment assistance – job
training programs to deal with unskilled workers; minimum wage laws
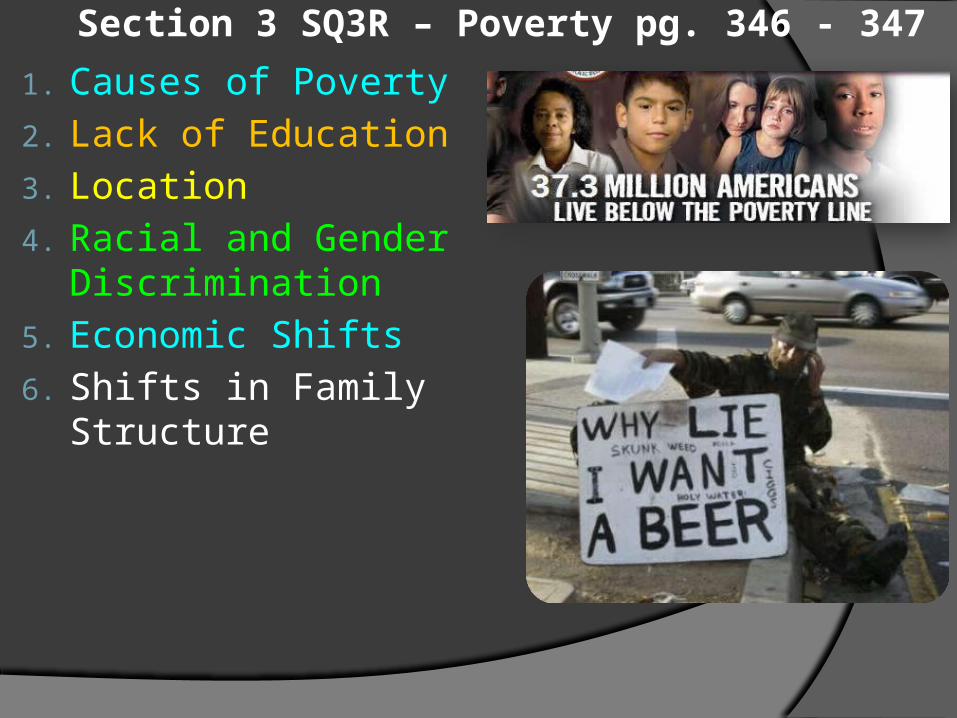
Section 3 SQ3R – Poverty pg. 346 - 347
1. Causes of Poverty
2. Lack of Education
3. Location
4. Racial and Gender Discrimination
5. Economic Shifts
6. Shifts in Family Structure
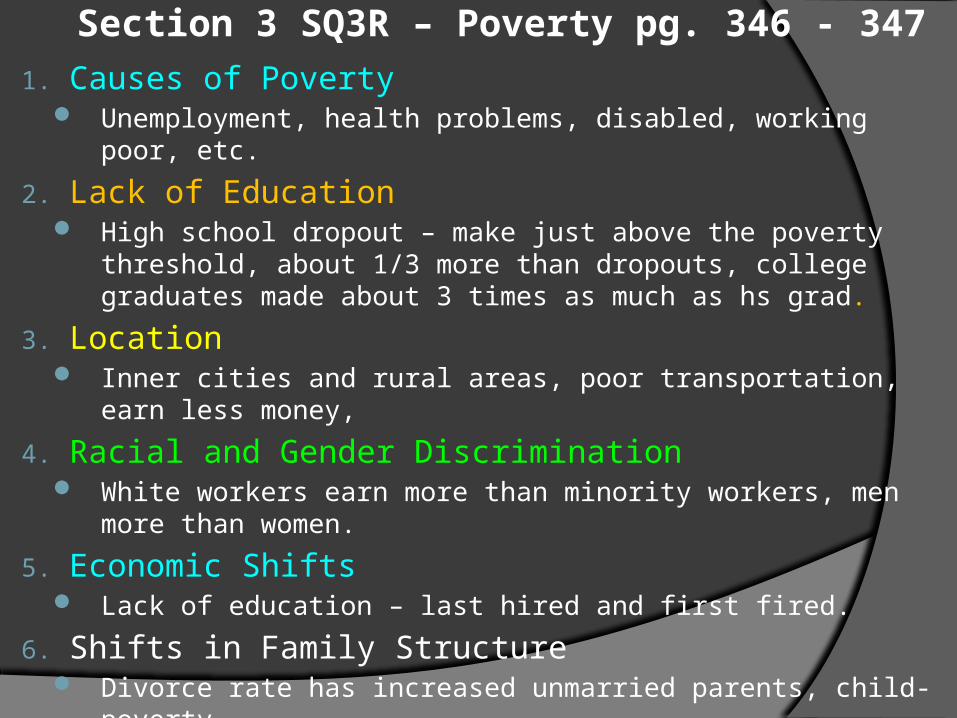
Section 3 SQ3R – Poverty pg. 346 - 3471. Causes of Poverty
Unemployment, health problems, disabled, working poor, etc.
2. Lack of Education High school dropout – make just above the poverty threshold, about 1/3
more than dropouts, college graduates made about 3 times as much as hs grad.
3. Location Inner cities and rural areas, poor transportation, earn less money,
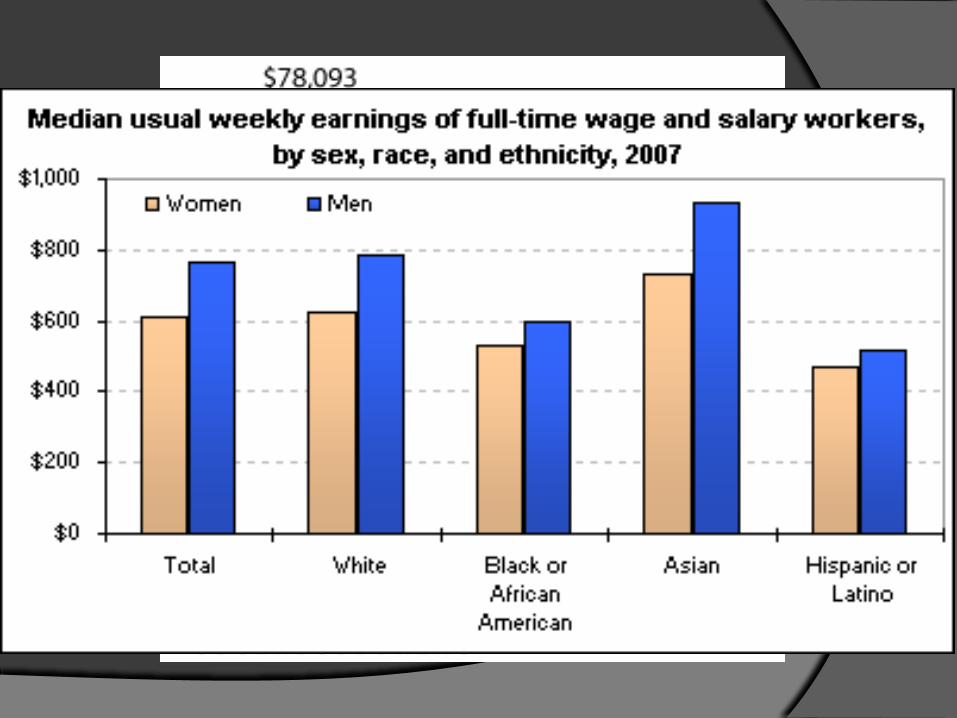
4. Racial and Gender Discrimination White workers earn more than minority workers, men more than
women.
5. Economic Shifts Lack of education – last hired and first fired.
6. Shifts in Family Structure Divorce rate has increased unmarried parents, child-poverty.
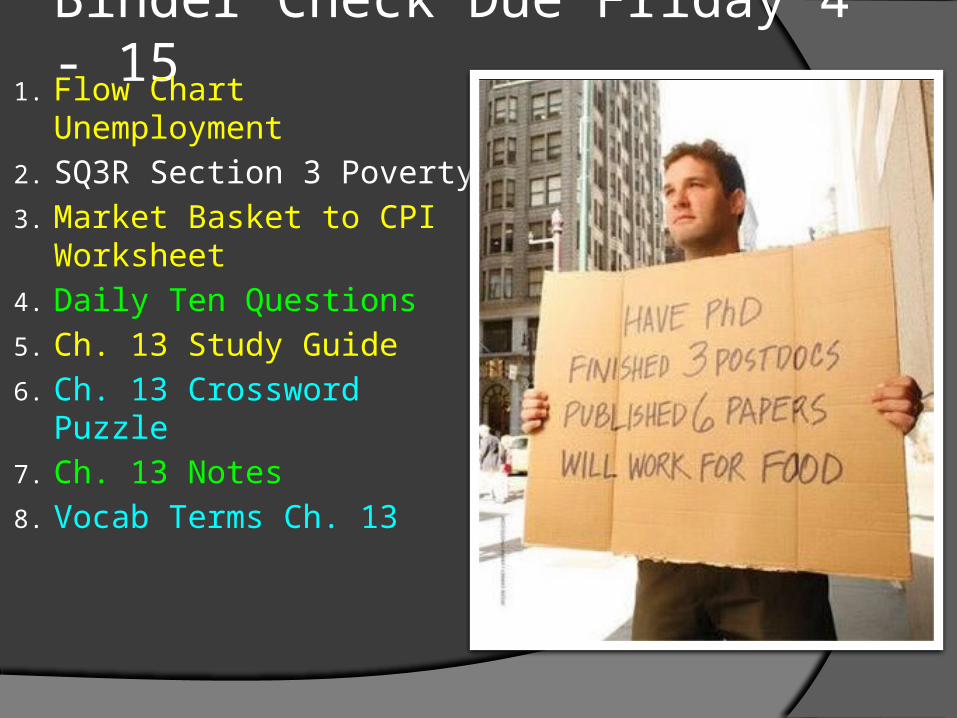
Binder Check Due Friday 4 - 151. Flow Chart Unemployment
2. SQ3R Section 3 Poverty
3. Market Basket to CPI Worksheet
4. Daily Ten Questions
5. Ch. 13 Study Guide
6. Ch. 13 Crossword Puzzle
7. Ch. 13 Notes
8. Vocab Terms Ch. 13
VIS Terms1. Structural2. Cyclical 3. Frictional 4. Seasonal
5. Unemployment Rate
6. Underemployment
7. Discouraged Worker
8. Consumer Price Index
9. Market Basket
10. Inflation
11. Inflation rate
12. Hyperinflation
13. Deflation
14. Poverty Threshold
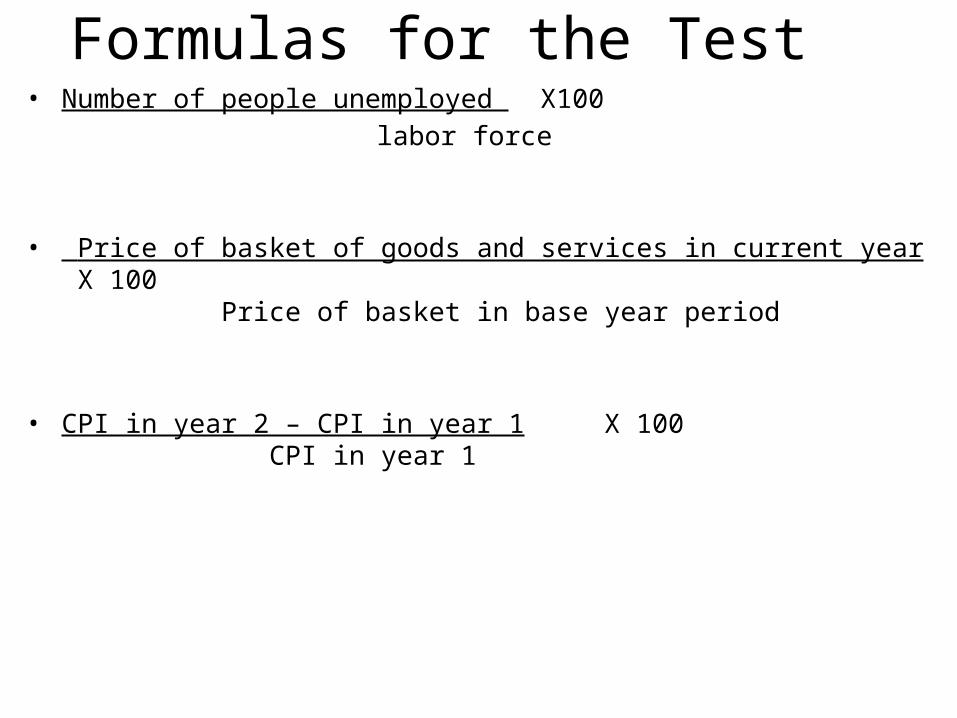
Formulas for the Test• Number of people unemployed X100 labor force
• Price of basket of goods and services in current year X 100 Price of basket in base year period
• CPI in year 2 – CPI in year 1 X 100 CPI in year 1