Embed Size (px)
Citation preview
DO NOW
• Turn in your completed owl pellet lab to the bin
• Pick up the 4 different papers from the front table
• Take out your composition notebook on your desk
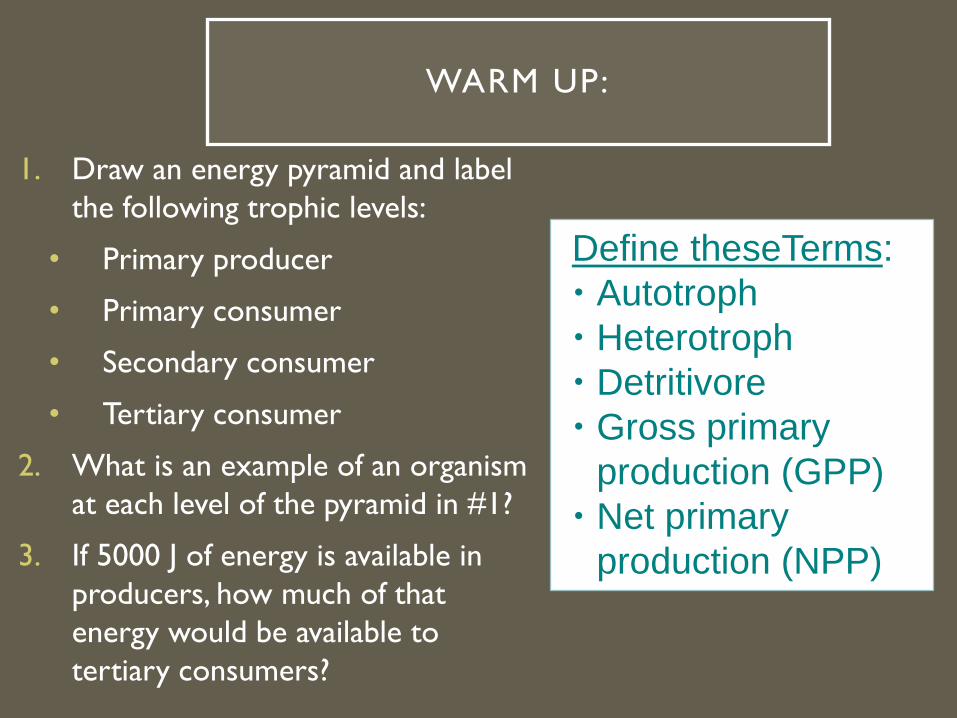
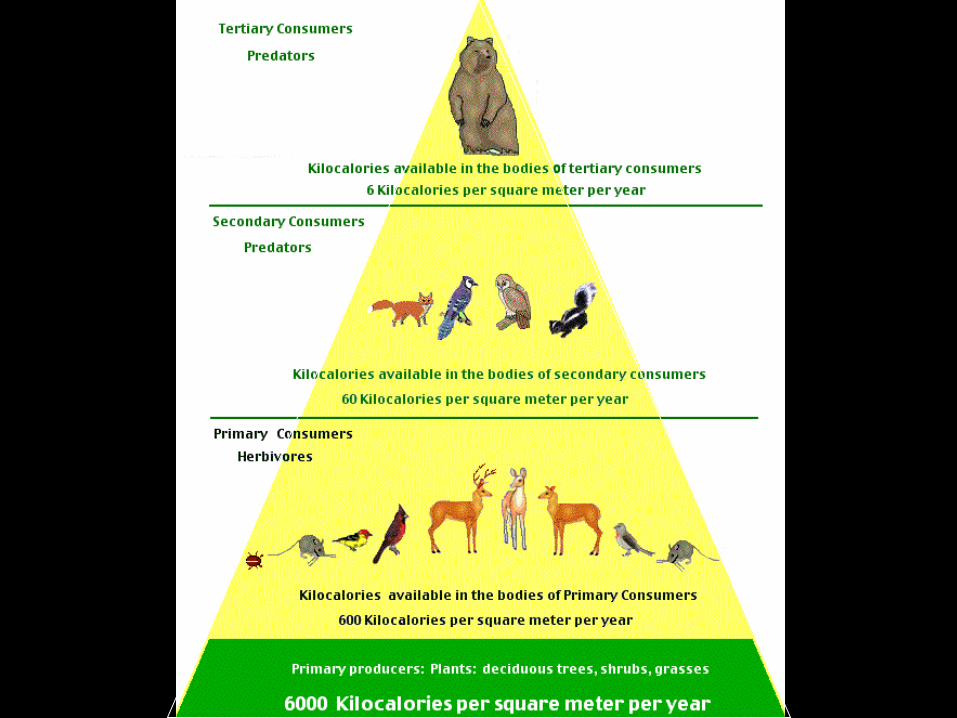
1. Draw an energy pyramid and label
the following trophic levels:
• Primary producer
• Primary consumer
• Secondary consumer
• Tertiary consumer
2. What is an example of an organism
at each level of the pyramid in #1?
3. If 5000 J of energy is available in
producers, how much of that
energy would be available to
tertiary consumers?
Define theseTerms:
Autotroph
Heterotroph
Detritivore
Gross primary
production (GPP)
Net primary
production (NPP)
WARM UP:
FOOD CHAINS, FOOD WEBS, ENERGY PYRAMIDS
UNIT 1: ECOLOGY
Notesheet 1
ECOSYSTEMS AND ENERGY
YOU MUST KNOW:
• How energy flows through the ecosystem (food chains and food webs)
• The difference between gross primary productivity and net primary productivity.
• The carbon and nitrogen biogeochemical cycles.
ECOSYSTEMS
Ecosystem = sum of all the organisms living within its
boundaries (biotic community) + abiotic factors with
which they interact
Involves two unique processes:
1. Energy flow
2. Chemical cycling
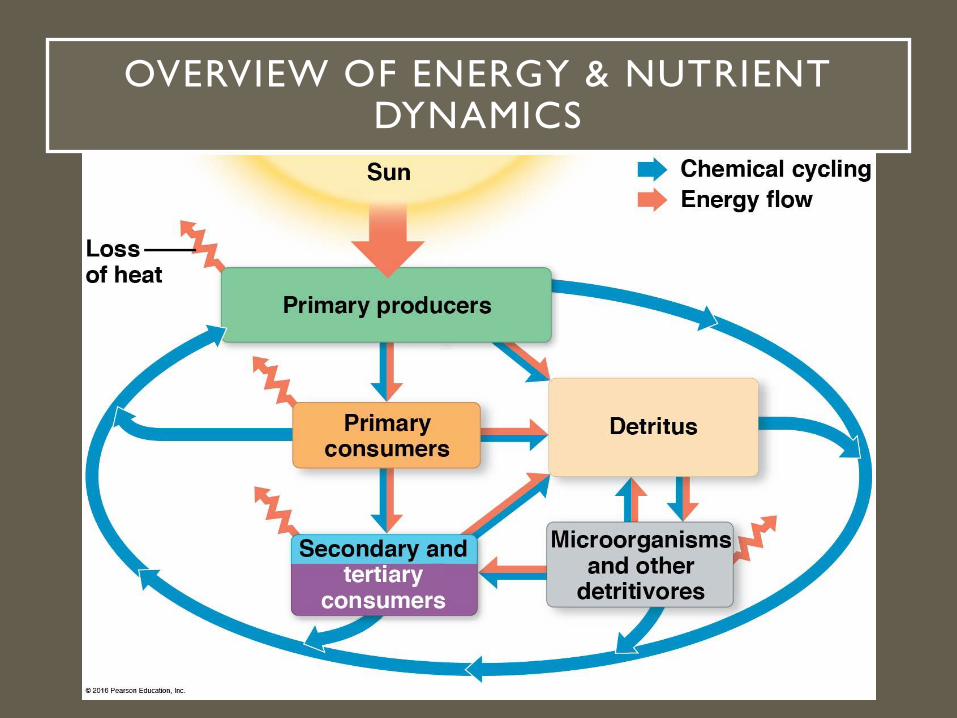
OVERVIEW OF ENERGY & NUTRIENT DYNAMICS
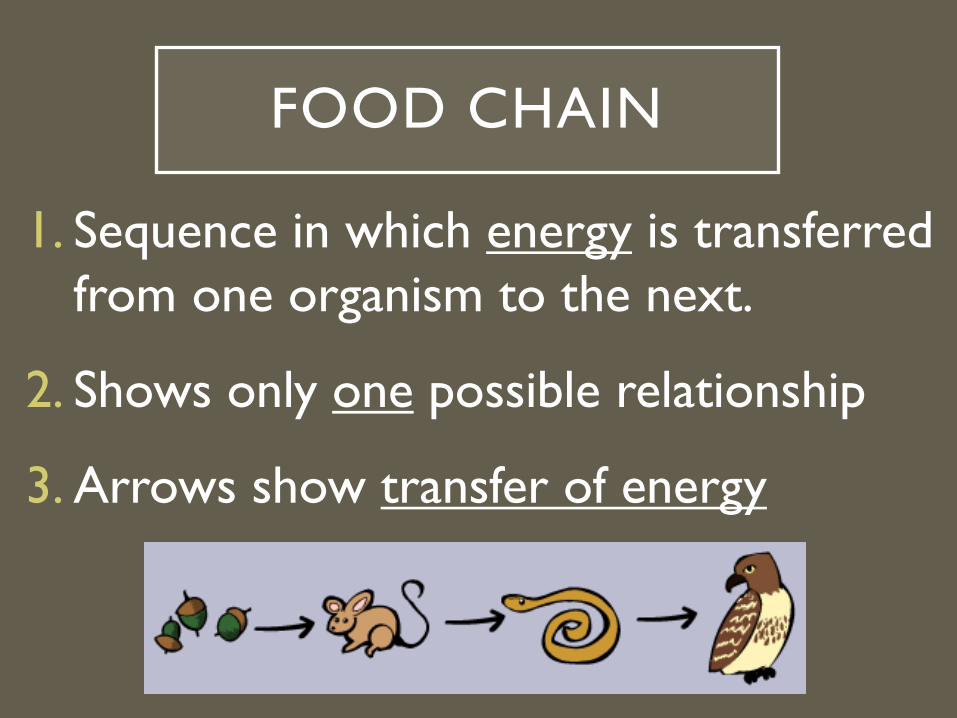
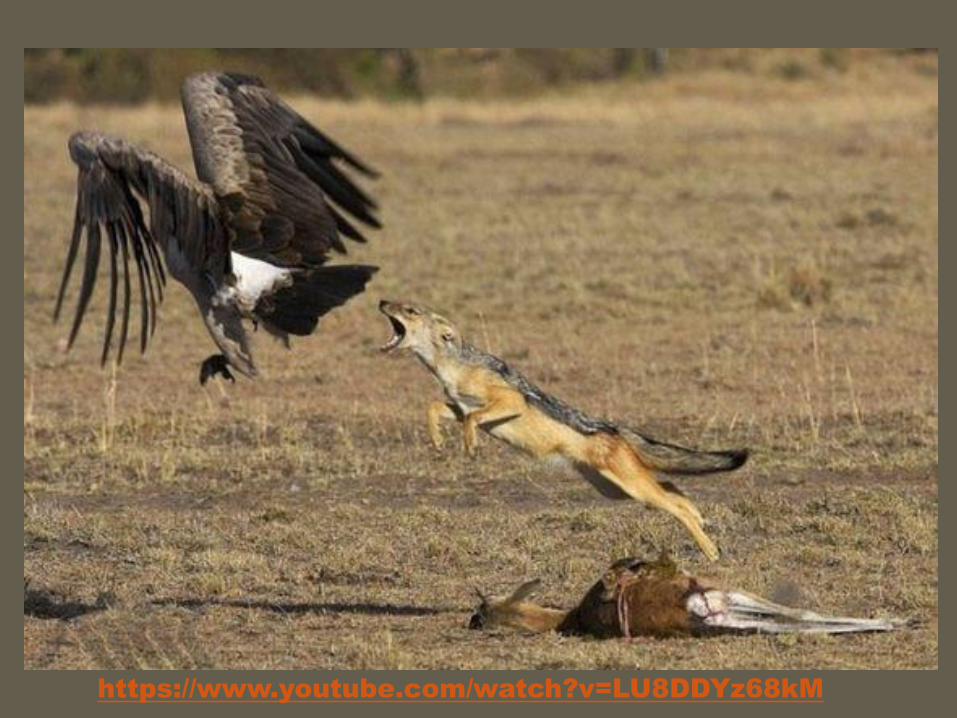
FOOD CHAIN
1. Sequence in which energy is transferred
from one organism to the next.
2. Shows only one possible relationship
3. Arrows show transfer of energy
ENERGY FLOW IN AN ECOSYSTEM
• Energy cannot be recycled → must be constantly
supplied to an ecosystem (mostly by SUN)
• The autotrophs (“self feeders”) are the primary
producers, and are usually photosynthetic (plants
or algae).
▫ They use light energy to synthesize sugars and other
organic compounds.
• Heterotrophs (“other feeders”) – can’t make own
food
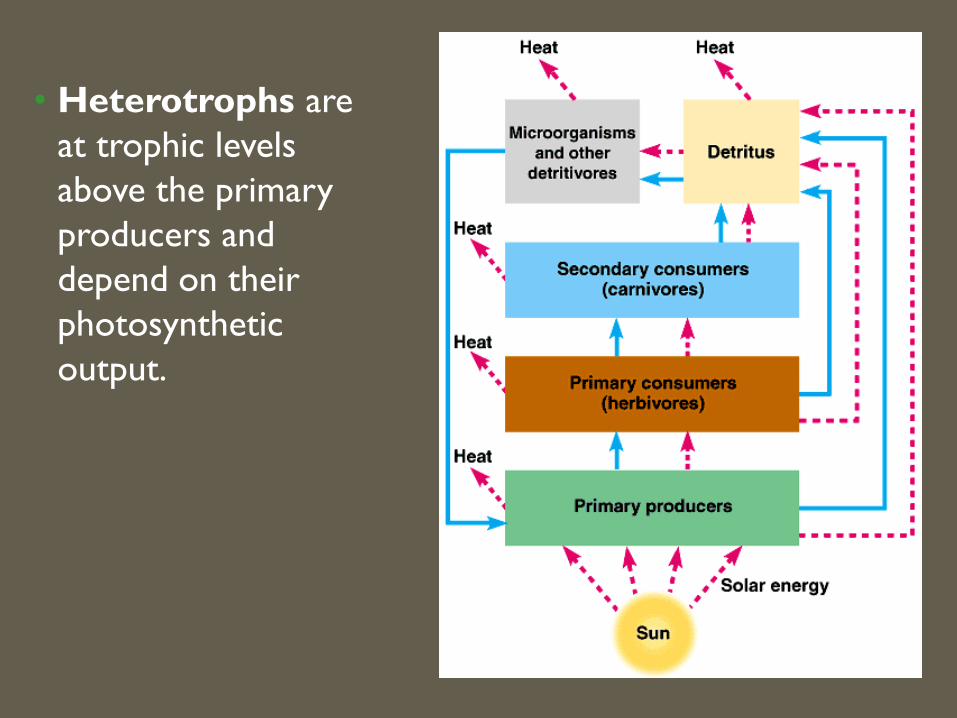
• Heterotrophs are
at trophic levels
above the primary
producers and
depend on their
photosynthetic
output.
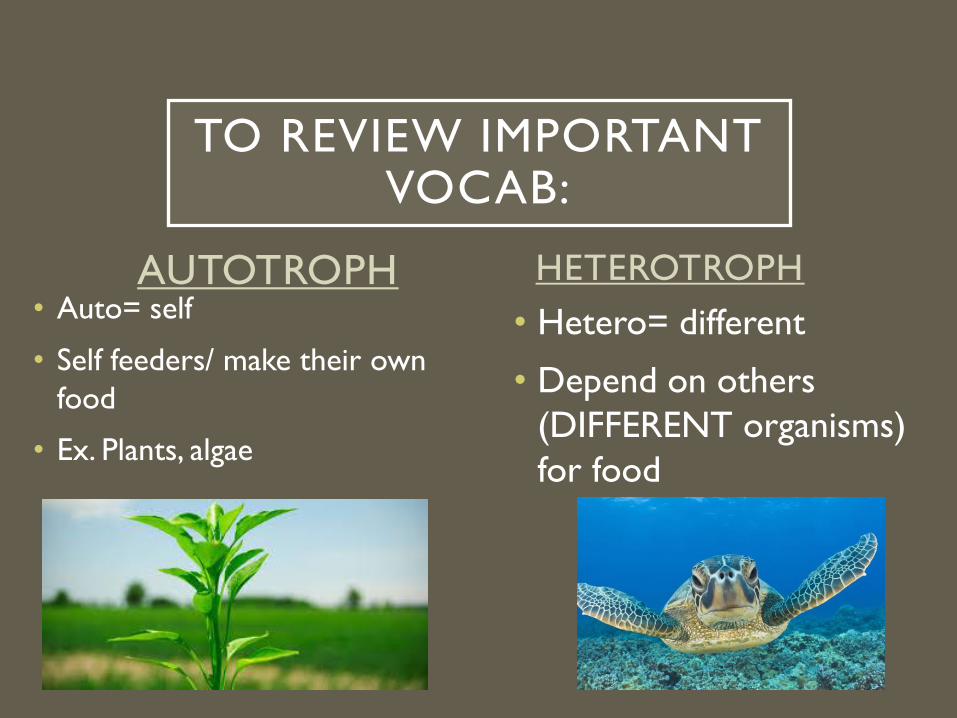
AUTOTROPH• Auto= self
• Self feeders/ make their own
food
• Ex. Plants, algae
• Hetero= different
• Depend on others
(DIFFERENT organisms)
for food
HETEROTROPH
TO REVIEW IMPORTANT VOCAB:
• Herbivores that eat primary producers are called
primary consumers.
• Carnivores that eat herbivores are called
secondary consumers.
• Carnivores that eat secondary consumers are called
tertiary consumers.
• Another important group of heterotrophs is the
detritivores, or decomposers.
• They get energy from detritus, nonliving organic
material, and play an important role in material
cycling.
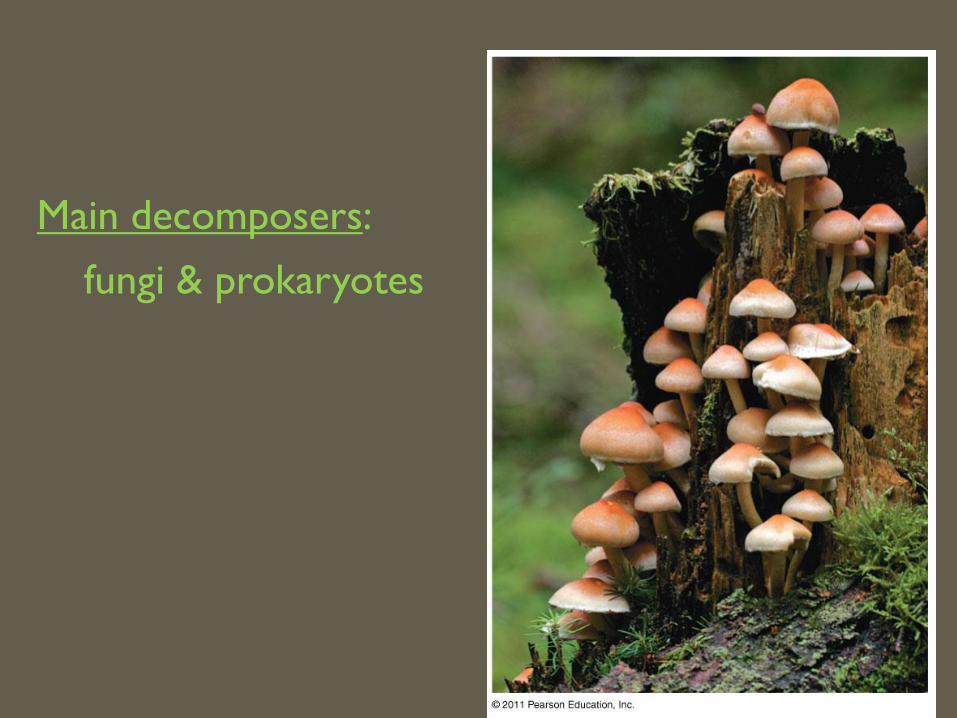
Main decomposers:
fungi & prokaryotes
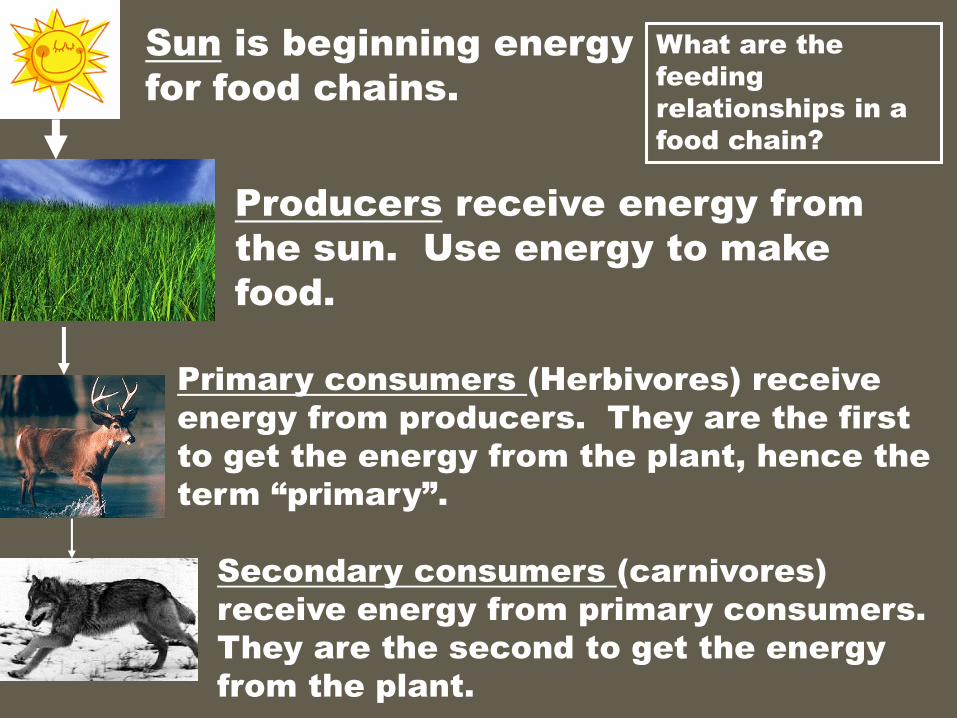
Sun is beginning energy
for food chains.
Producers receive energy from
the sun. Use energy to make
food.
Primary consumers (Herbivores) receive
energy from producers. They are the first
to get the energy from the plant, hence the
term “primary”.
Secondary consumers (carnivores)
receive energy from primary consumers.
They are the second to get the energy
from the plant.
What are the
feeding
relationships in a
food chain?
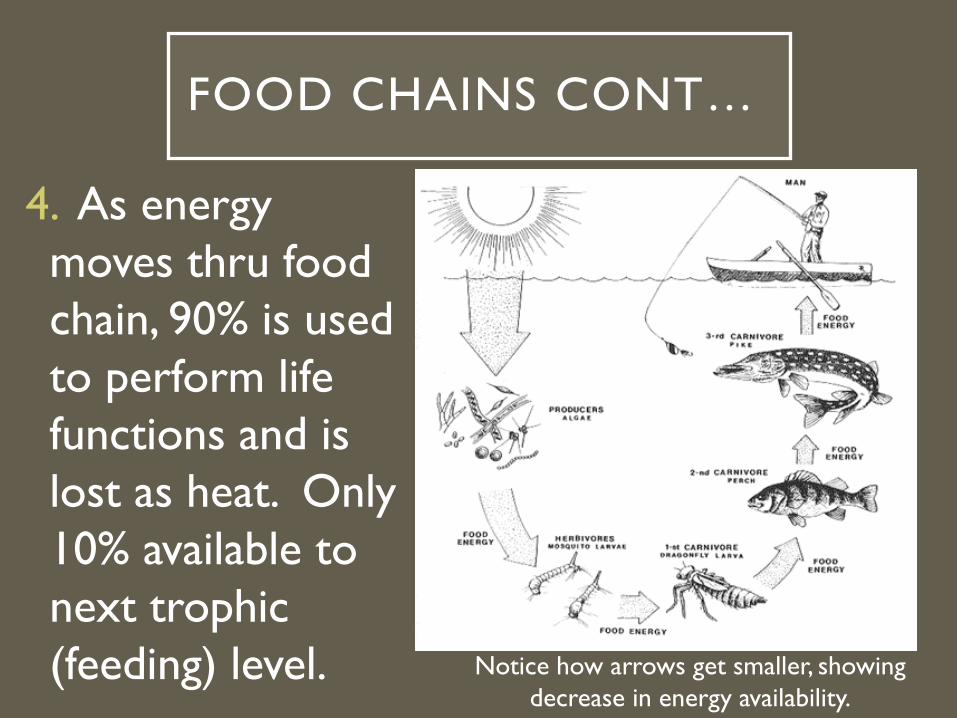
FOOD CHAINS CONT…
4. As energy
moves thru food
chain, 90% is used
to perform life
functions and is
lost as heat. Only
10% available to
next trophic
(feeding) level. Notice how arrows get smaller, showing
decrease in energy availability.
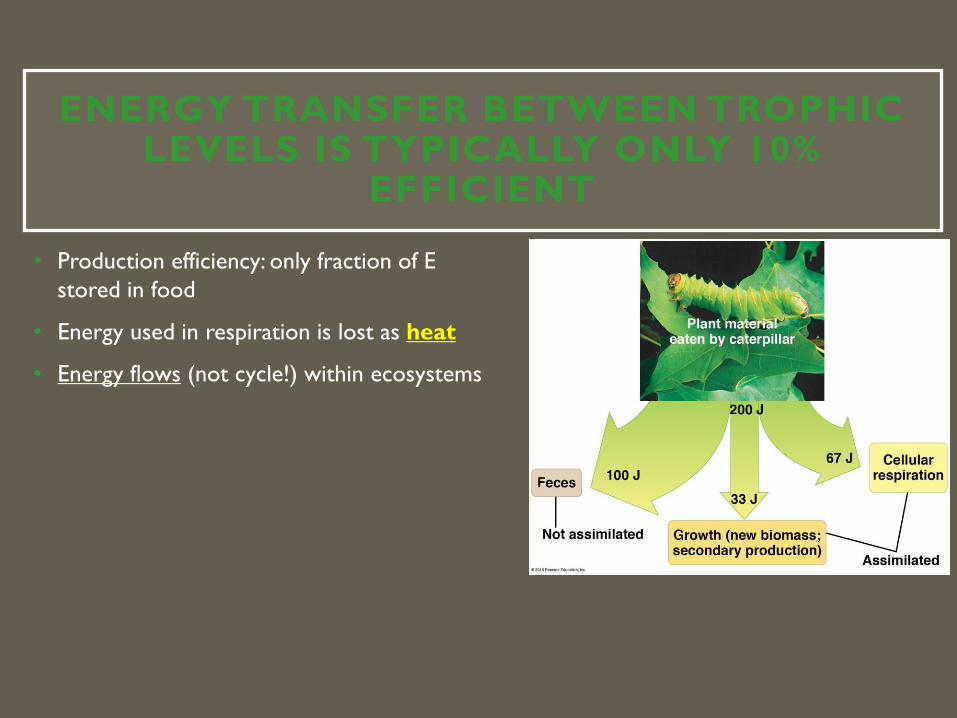
ENERGY TRANSFER BETWEEN TROPHIC LEVELS IS TYPICALLY ONLY 10%
EFFICIENT
• Production efficiency: only fraction of E
stored in food
• Energy used in respiration is lost as heat
• Energy flows (not cycle!) within ecosystems
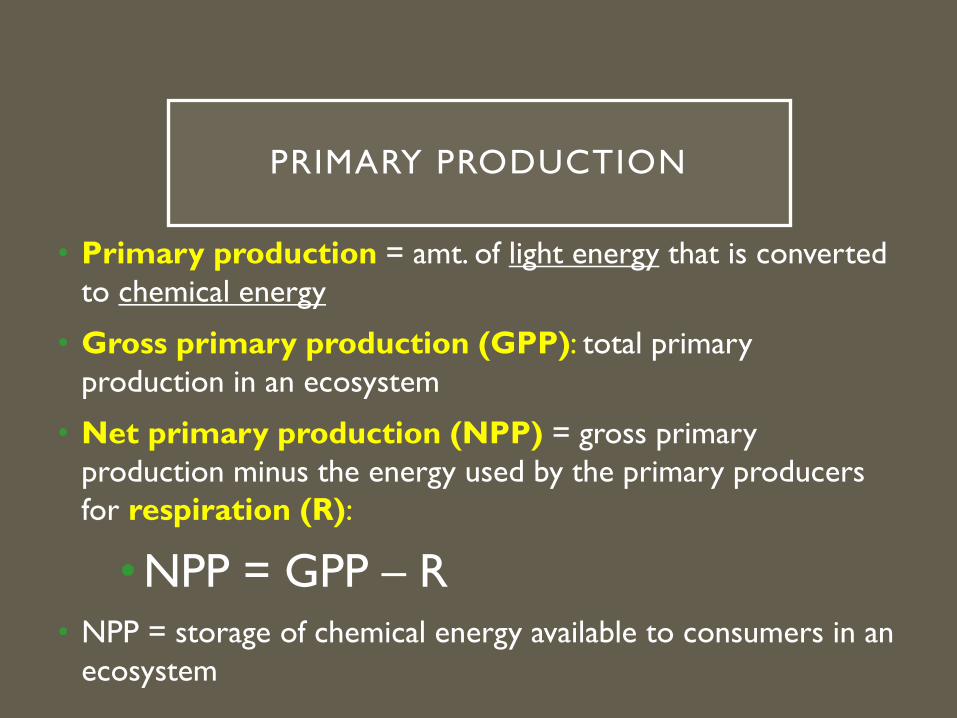
PRIMARY PRODUCTION
• Primary production = amt. of light energy that is converted
to chemical energy
• Gross primary production (GPP): total primary
production in an ecosystem
• Net primary production (NPP) = gross primary
production minus the energy used by the primary producers
for respiration (R):
• NPP = GPP – R
• NPP = storage of chemical energy available to consumers in an
ecosystem
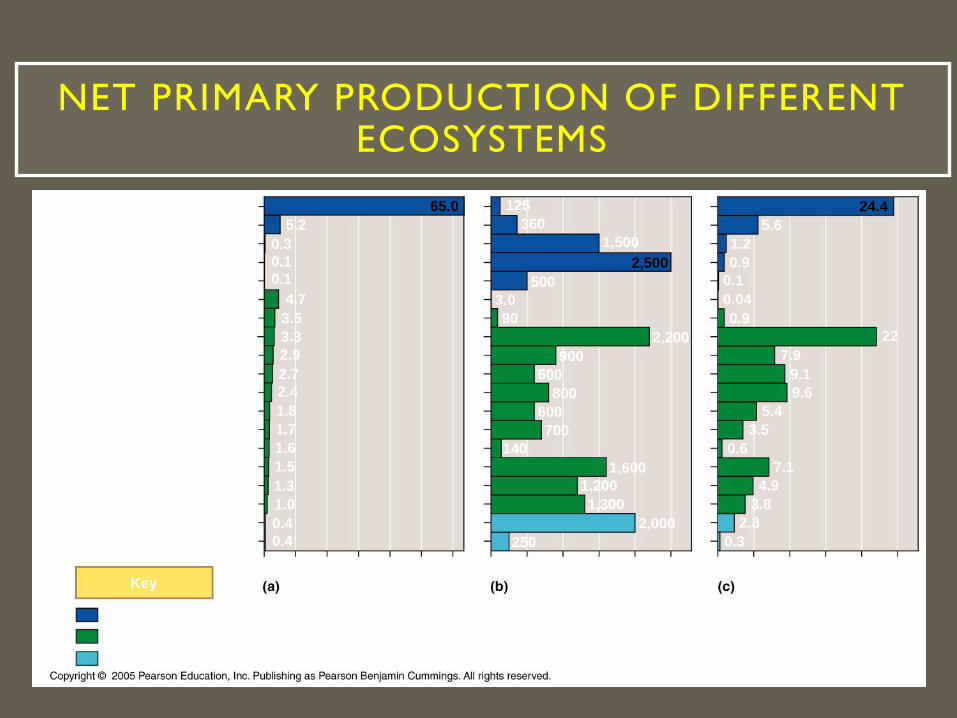
Open ocean
Continental shelf
Upwelling zones
Extreme desert, rock, sand, ice
Swamp and marsh
Lake and stream
Desert and semidesert scrub
Tropical rain forest
Temperate deciduous forest
Temperate evergreen forest
Tropical seasonal forest
Savanna
Cultivated land
Estuary
Algal beds and reefs
Boreal forest (taiga)
Temperate grassland
Woodland and shrubland
Tundra
0.4
0.4
1.0
1.3
1.5
1.6
1.7
1.8
2.4
2.7
2.9
3.3
3.5
4.7
0.3
0.1
0.1
5.2
65.0
Freshwater (on continents)
Terrestrial
Marine
Key Percentage of Earth’ssurface area
Average net primary
production (g/m2/yr)
6050403020100 2,5002,0001,5001,0005000
Percentage of Earth’s net
primary production
2520151050
125
2,500
360
1,500
500
3.0
90
900
600
800
2,200
600
250
1,600
1,200
1,300
2,000
700
140
0.3
7.9
9.1
9.6
5.4
3.5
0.6
7.1
4.9
3.8
2.3
24.4
5.6
1.2
0.9
0.1
0.04
0.9
22
NET PRIMARY PRODUCTION OF DIFFERENT ECOSYSTEMS
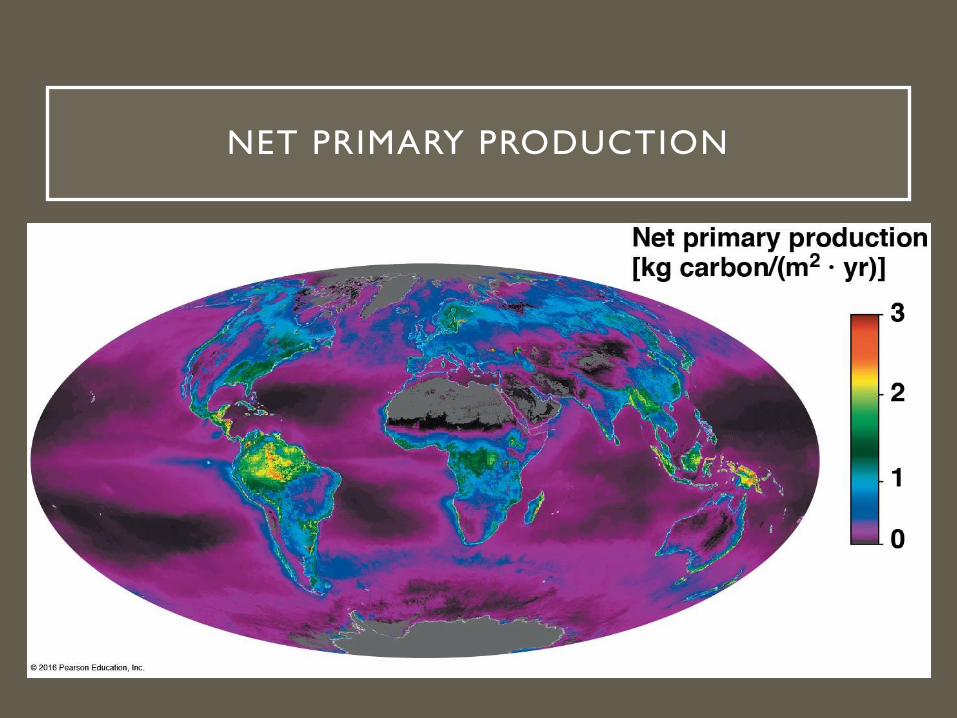
NET PRIMARY PRODUCTION
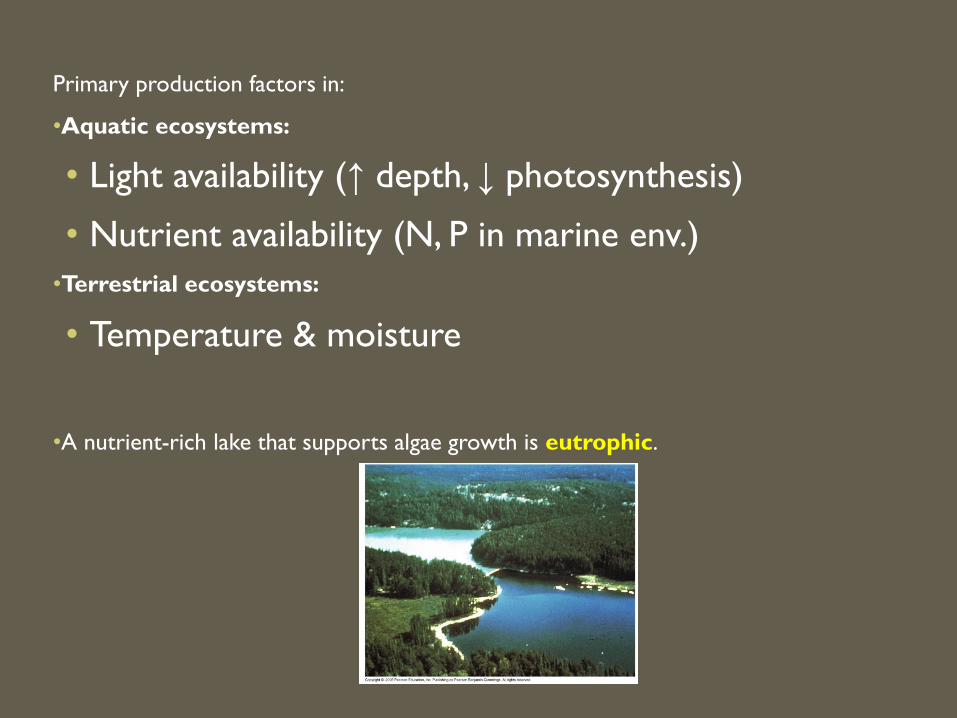
Primary production factors in:
•Aquatic ecosystems:
• Light availability (↑ depth, ↓ photosynthesis)
• Nutrient availability (N, P in marine env.)
•Terrestrial ecosystems:
• Temperature & moisture
•A nutrient-rich lake that supports algae growth is eutrophic.
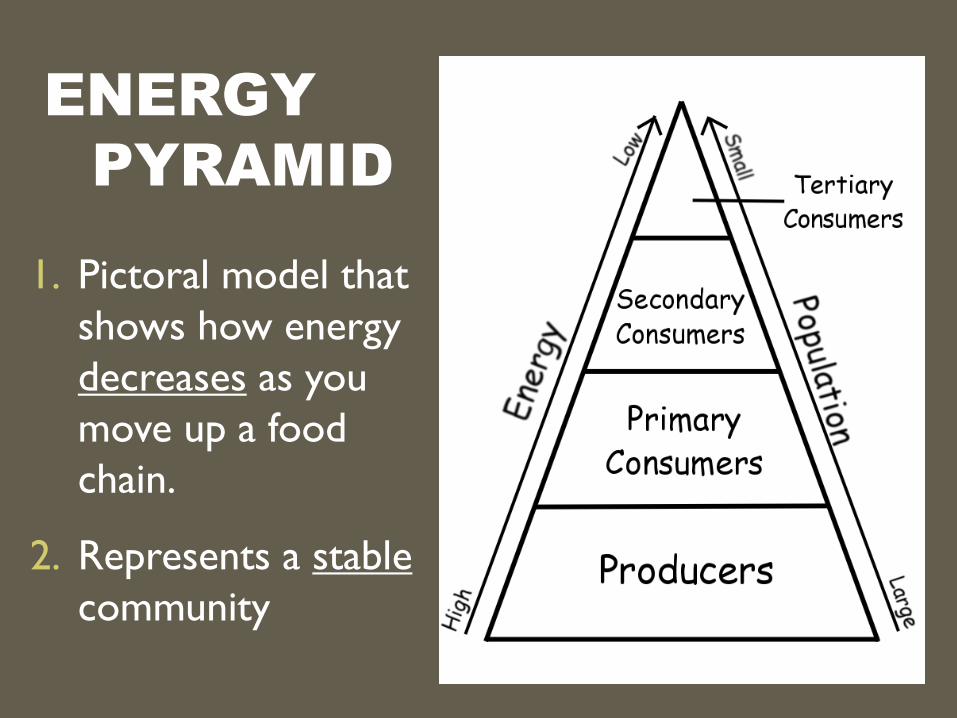
ENERGY
PYRAMID
1. Pictoral model that
shows how energy
decreases as you
move up a food
chain.
2. Represents a stable
community
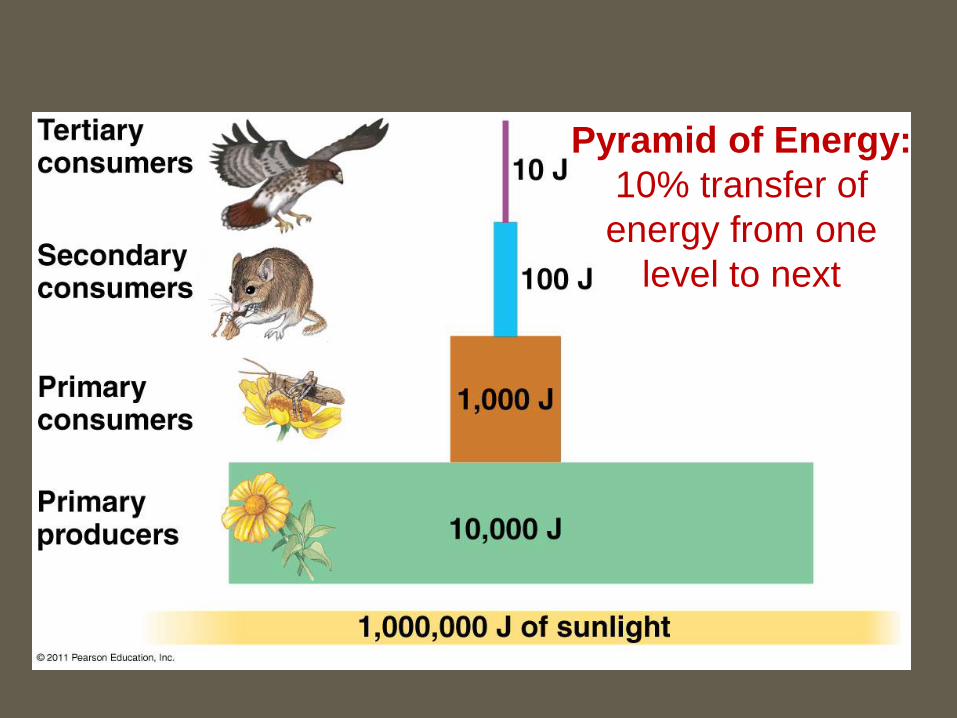
Pyramid of Energy:
10% transfer of
energy from one
level to next
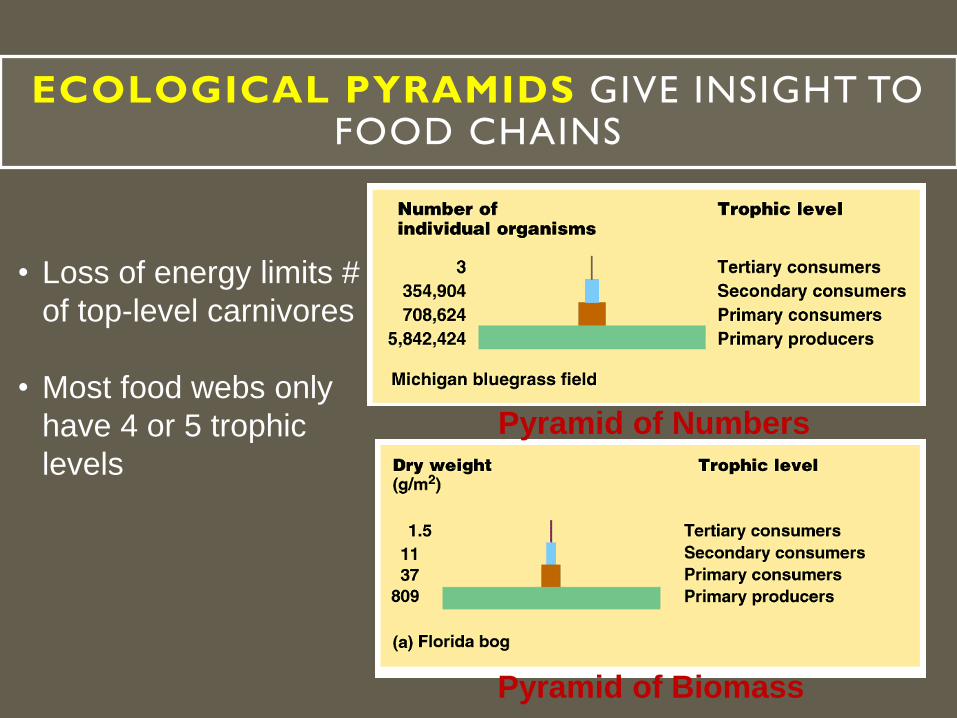
ECOLOGICAL PYRAMIDS GIVE INSIGHT TO FOOD CHAINS
Pyramid of Numbers
Pyramid of Biomass
• Loss of energy limits #
of top-level carnivores
• Most food webs only
have 4 or 5 trophic
levels
Trophic level
Secondary
consumers
Primary
consumers
Primary
producers
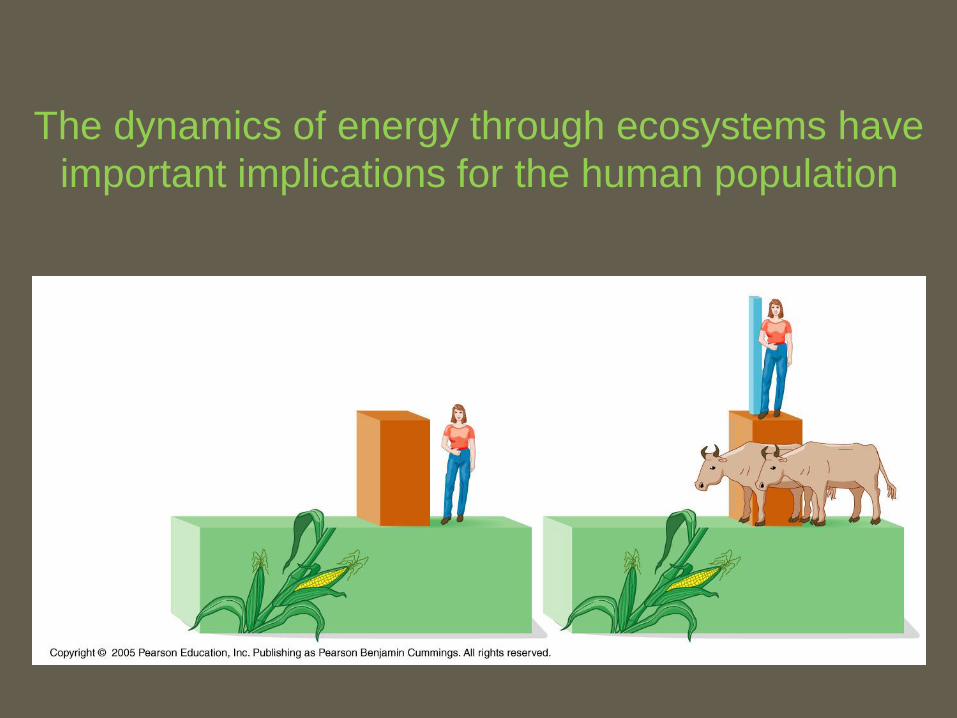
The dynamics of energy through ecosystems have
important implications for the human population
TROPHIC STRUCTURES
• The trophic structure of a community is determined by the
feeding relationships between organisms.
• Trophic levels = links in the trophic structure
• The transfer of food energy from plants → herbivores →
carnivores → decomposers is called the food chain.
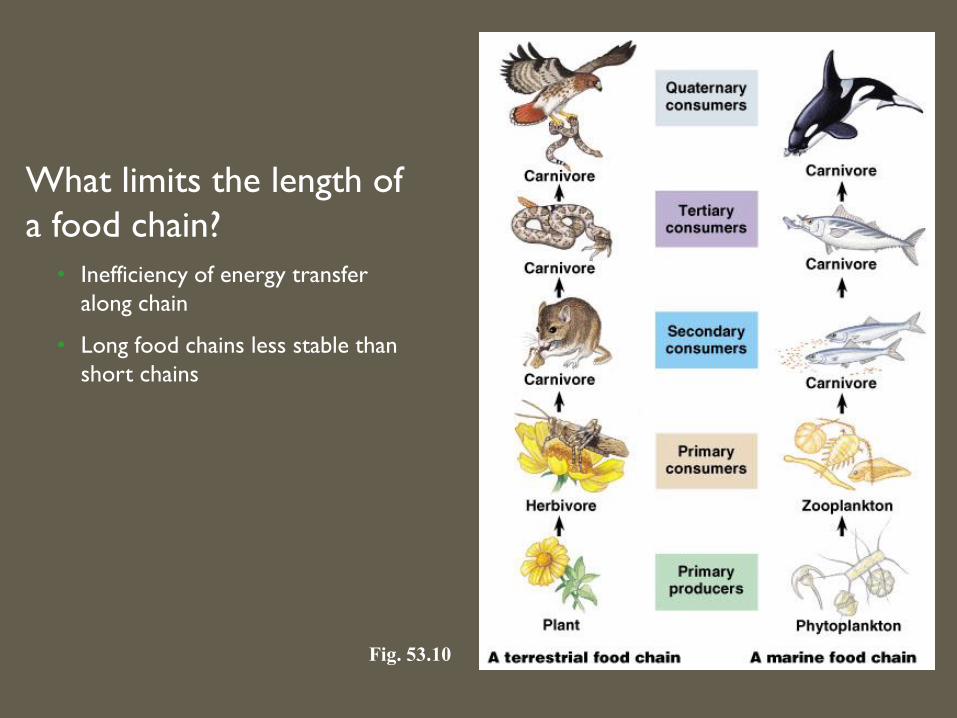
Fig. 53.10
What limits the length of
a food chain?
• Inefficiency of energy transfer
along chain
• Long food chains less stable than
short chains
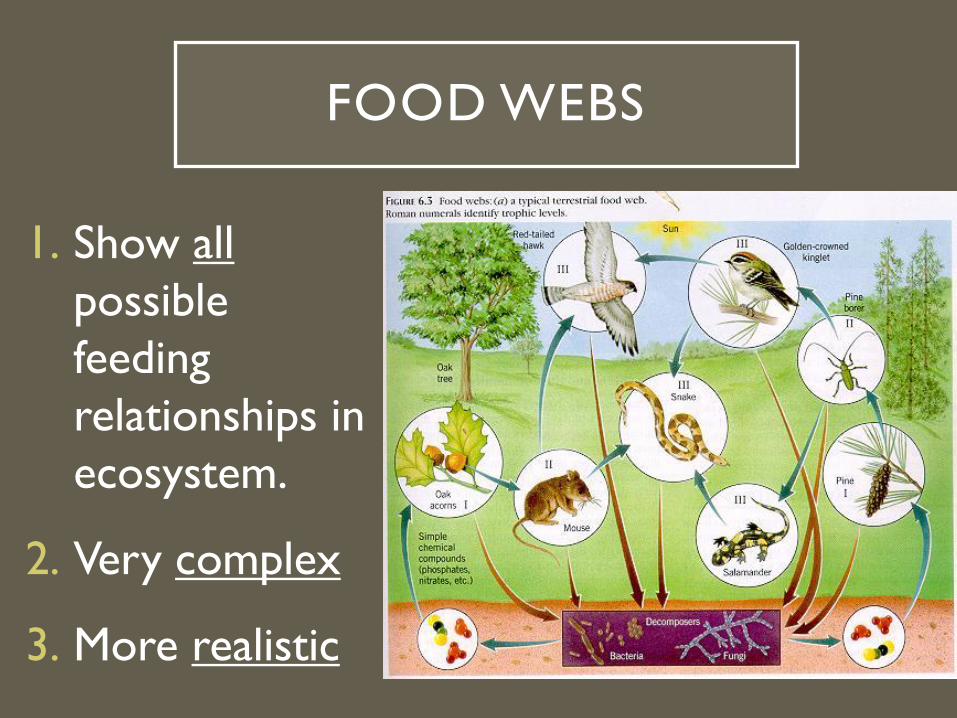
FOOD WEBS
1. Show all
possible
feeding
relationships in
ecosystem.
2. Very complex
3. More realistic
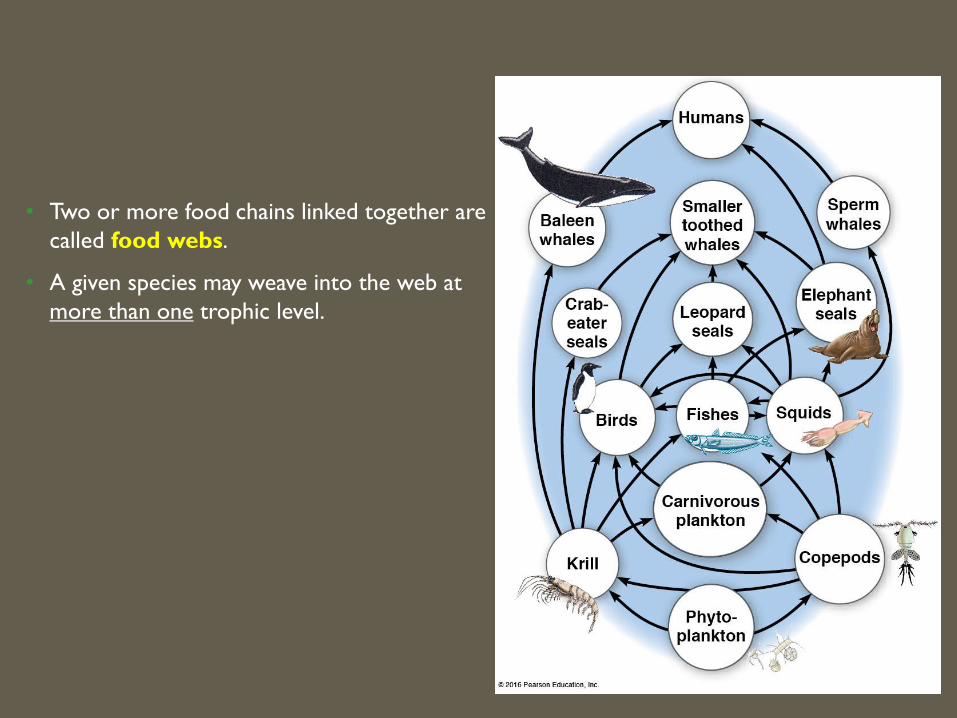
• Two or more food chains linked together are
called food webs.
• A given species may weave into the web at
more than one trophic level.
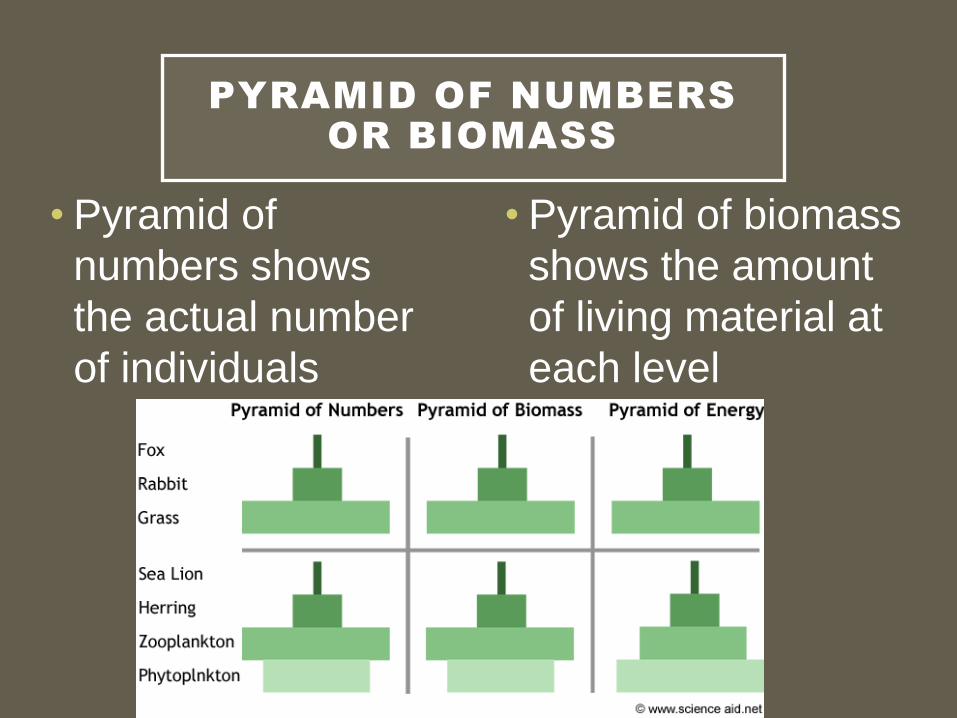
PYRAMID OF NUMBERS OR BIOMASS
• Pyramid of
numbers shows
the actual number
of individuals
• Pyramid of biomass
shows the amount
of living material at
each level
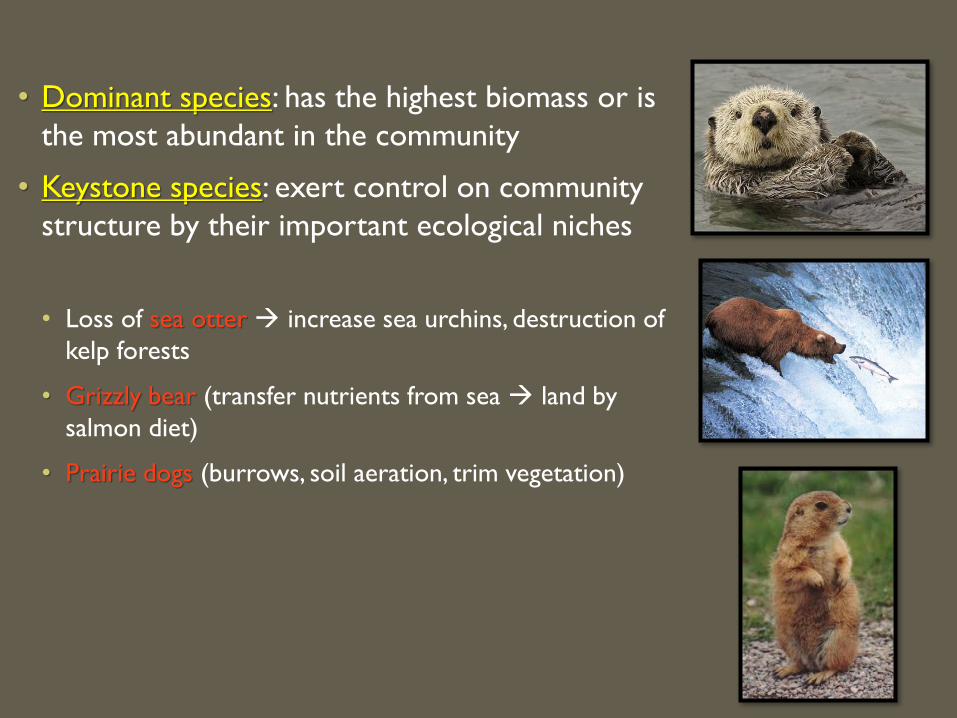
• Dominant species: has the highest biomass or is
the most abundant in the community
• Keystone species: exert control on community
structure by their important ecological niches
• Loss of sea otter → increase sea urchins, destruction of
kelp forests
• Grizzly bear (transfer nutrients from sea → land by
salmon diet)
• Prairie dogs (burrows, soil aeration, trim vegetation)
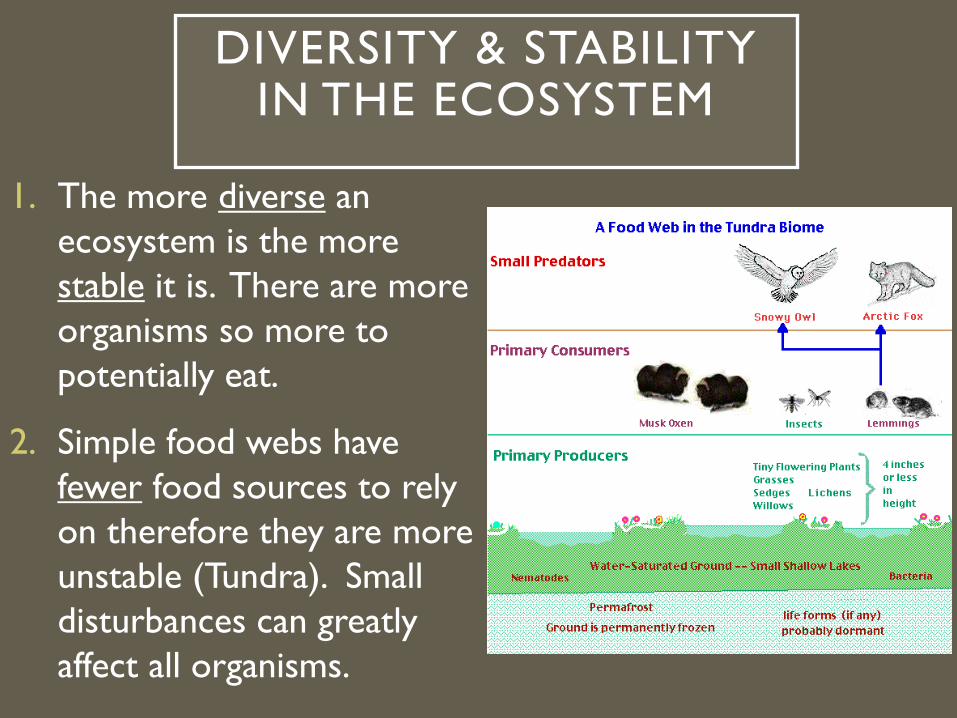
DIVERSITY & STABILITY IN THE ECOSYSTEM
1. The more diverse an
ecosystem is the more
stable it is. There are more
organisms so more to
potentially eat.
2. Simple food webs have
fewer food sources to rely
on therefore they are more
unstable (Tundra). Small
disturbances can greatly
affect all organisms.

QUIZ OVER ALL OF THIS FIRST THING THURSDAY MORN!!!


![Tri-Trophic Interactions within Potato Agro …file.scirp.org/pdf/AS_2016122714403574.pdfTri-Trophic Interactions within Potato ... trophic levels [1]. The relationship between plant](https://img.pdfslide.net/doc/110x75/5aa86a9b7f8b9a95188b878b/tri-trophic-interactions-within-potato-agro-filescirporgpdfas-interactions.jpg)