Embed Size (px)
Citation preview

This is a very preliminary draft. Please do not circulate or quote without permission. For many helpful*
discussions, we thank Michael Balch, Robert Forsythe and Robert Weber.
Do Unto Others:
A Theory and Experimental Test of Interpersonal Factorsin Decision Making Under Uncertainty*
by
Joyce E. Bergand
Thomas A. Rietz
College of Business AdministrationUniversity of Iowa
Iowa City, Iowa 52242-1000
First Draft: October 1996July 1997
Abstract
Using a very simple method, we isolate and study precisely how interpersonal factors mayinfluence individuals' decisions under uncertainty. We develop and test a model of individualbehavior that encompasses the interpersonal concepts of altruism, malice, competitiveness (or,more properly, distinction) and fairness in decision making. As Veblen (1909) suggests, therelative importance of such factors may vary with the institutions governing decision makerbehavior. Experimentally, we study five such situations, three of which parallel decision makingin partnership, bargaining and auction situations. Preliminary results show that, when actingalone, individuals appear risk-neutral to slightly risk averse on average in a simple choice task.However, their risk aversion (measured using the same task) appears to shift when their decisionsalso affect other participants. Thus, interpersonal factors may account for anomalous patterns ofrisk aversion within particular institutions and differences in apparent risk aversion acrossinstitutions.


Von Neumann and Morgenstern (1944), Allais (1953) and Arrow (1953) firmly established this precedent.1
For examples and summaries of this evidence, see Kahneman and Tversky (1979), Machina (1982 and 1987)2
and Samuelson and Zeckhauser (1988), among others.
For some examples of such non-expected utility theories, see Bell (1982), Gul (1991), Kahneman and Tversky3
(1979), Loomes and Sugden (1982), Machina (1982), etc.
See Machina (1987) for a survey.4
These are too numerous to list here. For examples, see Machina (1987), Kahneman and Tversky (1979),5
many of the Journal of Economic Perspectives "Anomalies" sections and most of the Journal of Business, Volume 59,Number 4.
See Sugden (1986) and Weber and Camerer (1987) for reviews of a number of alternative models. See6
Battalio, Kagel and Jiranyakul (1990) for a summary of and experimental tests of some non-expected utility models.
1
Do Unto Others:
A Theory and Experimental Test of Interpersonal Factorsin Decision Making Under Uncertainty
I. Introduction
Most economic models assume self-interested, maximizing agents. Most models under
uncertainty assume agents maximize expected utility functions with final wealth as the only
argument. However, when facing uncertainty, experimental subjects often appear not to1
maximize expected utility. Economists have developed various non-expected utility models in2
response. While they relax some assumptions of expected utility theory, most such utility models
still assume self interested agents who maximize some perceived notion of their own well-being,
independent of what happens to others. As Veblen (1909, p. 627) puts it, "conceived in3
hedonistic terms," conventional economic theory "concerns a disconnected episode in the
sensuous experience of an individual."
A large body of experimental research shows that, when choosing between alternative
risky propositions, subjects often appear not to maximize expected utility. Instead, a variety of4
framing effects and probability judgement biases appear to affect choices. In response,5
economists have developed and experimentally tested various non-expected utility models. Many6

For examples, see Cooper, DeJong, Forsythe and Ross (1990 and 1992).7
For example, see Hoffman and Spitzer (1982) and Hoffman, McCabe, Shachat and Smith (1992).8
See Loewenstein, Thompson and Bazerman (1989) for a summary of such research in dispute situations.9
Four of these are based on payoff comparisons, including ones analogous to our later definitions of altruism,10
malice and distinction seeking.
This is analogous to our later definition of fairness. 11
2
researchers model agents who care about their payoff levels relative to some benchmark as well
as their absolute payoff levels. Prospect theory (Kahneman and Tversky, 1979) proposes a
benchmark payoff level of 0. Regret theory (Bell, 1982, and Loomes and Sugden, 1982) is used
to compare two gambles. The benchmark is the outcome of the other gamble. Disappointment
theory (Bell, 1988, and Gul, 1991) uses the expected value or the certainty equivalent of a gamble
as the benchmark.
Experimental research subjects also often appear care about the payoffs others receive
in interactive games with certain payoffs. In particular, Pareto dominant and "fair" equilibria
appear to attract subjects. Further, how the problem is presented affects behavior. The7 8
research in social psychology shows that subjects care about the payoffs others receive in a wider
variety of situations with certainty. Further, a subject's relationship with or attitude toward the
other affects choices. In response, researchers have developed and tested new choice models9
that include interpersonal payoff comparison arguments. For example, MacCrimmon and Messick
(1976) identify several factors influencing choices in social situations. Scott (1972) proposes that10
egalitarianism affects choices. Many of these factors appear to affect decisions when subjects11
interact with each other (i.e., when one's payoffs are affected by one's own and the other subject's
actions). These lines of research contrast sharply and the large body of experimental research
in which conventional economic theory “works” as predicted.
Here, we begin to explore several aspects of these interpersonal effects. We wish to study
whether interpersonal factors affect choices under uncertainty and how much of the effect is

Definitions of these terms vary. We interpret altruism as the desire to increase the other's payoffs, malice as12
the desire to decrease the other's payoffs, distinction seeking as the desire to maximize the difference between own andother's payoffs (i.e., decrease their cross moment) and fairness seeking as the desire to minimize the difference betweenown and other's payoffs (i.e., increase their cross moment). By “context free” we mean that the factors are stable acrosscontexts and remain in the absence of context.
We isolate both direct interaction (subjects are unknown to each other, remain anonymous and do not have13
face to face contact) and indirect interaction through payoffs.
3
driven by social context and how much is a stable, generic attribute of the subjects themselves.
We begin by extending expected utility theory to include notions of concern for others’
payoffs. We define concepts of altruism, malice, distinction seeking (competitiveness) and
fairness seeking in a social and relationship context free manner as attributes of this utility
function. We then show how such factors would affect choices in several specific, relatively12
sterile situations if the factors were indeed context free.
We ask whether these factors appear important in laboratory settings without a contextual
relationship between subjects and when there is no interaction between subjects. We isolate13
interpersonal effects using simple choices under uncertainty with five slightly different incentive
treatments. Under these treatments, the choices a subject makes always affect his or her own
payoffs in the same manner. The effect on another subject’s payoffs changes. (We will refer to
this other subject the "matched subject" and the payoffs he or she receives as the "matched
payoffs.") The specific effects vary across the treatments. Two treatments serve as benchmarks
to assess risk aversion over own and matched payoffs. Three treatments study interaction effects
under incentive structures that parallel decision making in a partnership situation, a bidding
situation and a bargaining situation. We will refer to the treatments accordingly.
We study several aspects of choice under these situations. Our results highlight the
differences between individual subjects and “on average” group outcomes.
First, we determine if subjects' responses vary as a result of affecting payoffs of another
participant. We find that they do. While some experimental subjects appear unaffected by how
their decisions affect matched payoffs, most vary their decisions with changes in this impact on
This classification depends on whether a subjects choices reflect a tendency to increase, decrease or leave14
unaffected correlations between own and matched payoffs, other things constant.
This classification depends on whether their choices reflect a tendency to increase expected matched15
participant payoffs, decrease them or leave them unaffected, other thing’s constant.
4
matched payoffs.
Second, we determine whether any of these effects appear to consistently bias subjects’
choices in predictable directions. We also determine whether a simple reference frame has a
larger effect on average than these interpersonal frames. We find that the reference frame does
have a slight impact. However, when studying interpersonal frames, we find relatively
uncorrelated variances across subjects tend to wash out these effects on average. This leaves
the average choices across treatments similar.
Third, we ask if individuals display consistent patterns of altruism or maliciousness and
fairness or distinction seeking across these treatments. Using the results across choice tasks, we
classify subjects according to several categories. Using one baseline treatment, we classify them
as risk averse or risk seeking in own payoffs. Using a second baseline treatment, we classify
them as risk averse, neutral or risk seeking in matched payoffs. On average, responses are risk
neutral to slightly risk seeking along both dimensions. However, we find a simple, intuitive pattern
across subjects. Subjects who appear risk averse for their own payoffs also appear risk averse
in the matched subject payoffs. Similarly, those who appear risk risk seeking in own payoffs also
appear risk seeking in the matched payoffs. Using the partnership treatment, we can classify
subjects as fairness seeking, distinction seeking or neutral. Using the bidding treatment, we can14
also classify subjects as altruistic, malicious or neutral. We find that subjects who are altruistic15
are generally fairness seeking. Subjects who are malicious tend to be distinction seekers as well.
Subjects who appear neutral along one dimension typically appear neutral on both. Finally, we
use the bargaining treatment to assess the subjects’ consistency along these dimensions when
both are present. We find that subjects are generally consistent in their own choices. Overall, we
5
can classify a large portion of individuals as consistently altruistic and fairness seeking,
consistently malicious and distinction seeking or neutral on both dimensions.
Our work contrasts with earlier work in that the average responses here do not deviate
significantly across treatments from the risk neutral, self-interested predictions of traditional
economic theory. This arises because roughly equal numbers of subjects appear risk averse
versus risk seeking. Similarly, roughly equal numbers of subjects appear altruistic versus
malicious and roughly equal numbers appear fairness seeking versus distinction seeking. Other
factors must account for the consistent effects observed in earlier work. Perhaps social context
tends to bias the mindsets of subjects toward the altruistic and fair end of the continuum or toward
the malicious and distinction seeking end of the continuum. For example, social comparisons may
predispose subjects to be altruistic and fair to subjects who are known to be very similar to
themselves. Alternatively, the institution may favor particular behavioral types. For example,
auction prices likely result from the bids of the most competitive bidders, not from a cross section
of all bidders. Thus, they tend to reflect choices made by more competitive (distinction seeking)
individuals. In contrast, if the same items were priced through negotiations, we would observe
prices that resulted from successful bargaining agreements. These more likely reflect the
preferences of more cooperative individuals.
In further research, we will explore factors that we hope will reproduce the consistent
interpersonal effects observed in other experiments. Is it the face to face interaction? (If so
anonymity is very important to experimental design.) Is it the interdependence of payoffs and
interactions between subjects? Specifically, is it the chance that one will be punished by a subject
who was adversely affected by one’s actions? (If so, then designs need to carefully control and
understand such possibilities.) Or, is it due purely to social context? (If so, then experimenters
must bring important social features into the lab or recognize their possible impact when
generalizing to situations outside the lab.) We will also ask whether demographic information
6
can help explain the patter of choices across subjects.
Specific next steps:
Determine if patterns arise because of INTERACTION effects. Stage 1: Allow subjects to
affect and be affected in the same manner by other subjects. Stage 2: Allow face to face
interaction. Determine if demographic information has any explanatory power.
II. Theory
We propose a simple generalization of expected utility theory to include the impact of
actions on the payoffs of another individual (matched payoffs). Arguments include the subject’s
own and matched payoffs. The first, second and cross partial derivatives determine whether the
subject is self interested or not, altruistic or not, risk averse or risk seeking in his or her own
payoffs, risk averse or risk seeking in matched payoffs and fairness or distinction seeking.
Specifically, let u(x,y) be the utility function over own (x) and other's (y) payoffs and let U(.)
denote the expected value of this function. We will assume self interest (u (x,y) > 0) and make1
the following definitions:
Self-Interest: u (x,y) > 01
Risk Aversion in Own Payoffs: u (x,y) < 011
Risk Seeking in Own Payoffs: u (x,y) > 011
Altruism: u (x,y) > 02
Malice: u (x,y) < 02
Risk Aversion in Matched Payoffs: u (x,y) < 022
Risk Seeking in Matched Payoffs: u (x,y) > 022
Fairness Seeking: u (x,y) > 012
Distinction Seeking: u (x,y) < 012

u(x,y) ' ax&"x 2 % by & (y 2 & c(x&y)2
Y U ' aE(x)&"E(x 2) % bE(y) & (E(y 2) & cE((x&y)2).
u(x,y) ' a x 1&"
1&"% b y 1&(
1&(% c x 1&"y 1&(
(1&")(1&()
Y U ' aE x 1&"
1&"% bE y 1&(
1&(% cE x 1&"y 1&(
(1&")(1&()
If we assume individuals are always somewhat self interested, we can set a=1 without loss of generality.16
7
(1)
(2)
If the subject is neither altruistic nor malicious (u (x,y) = 0) and neither fairness nor2
distinction seeking (u (x,y) = 0), the utility function defined over x and y becomes the simple12
expected utility function over x. A specific example of such a function is the following second
moment utility function which is a direct extension of the commonly used mean/variance utility
function:
Another example is the constant relative risk aversion counterpart:
In both cases, the parameters ", (, a, b and c allow for self interest, risk aversion and the four
interpersonal factors of altruism, malice, fairness seeking and distinction seeking. Of course,
interactions between all these terms exist, but roughly speaking, the following representations
hold: Self interest is represented by a>0 dominating over the risk preference effect of " and the
correlation effect of c. Risk aversion over own and other's payoffs are represented by ">0 and16
(>0, respectively. Altruism and malice are represented by b>0 and b<0, respectively (again
dominating over the risk preference effect of ( and the correlation effect of c). Finally, fairness
and distinction seeking are represented by c>0 and c<0 respectively.
In the Appendix II, we show that, all else constant, subjects will prefer gambles increasing
in the properties associated with the interpersonal factors in their utility factions. For example, an

8
altruistic subject will prefer a gamble with a slightly higher expected payoff to the other all else
constant. Similarly, a fair subject will prefer a slightly higher first cross moment all else constant.
Thus, below we ask if subjects react to interpersonal impacts of their choices on others by
changing their choices in response to how their choices affect the mean and variance of another’s
payoff and first cross moment of own and other’s payoffs.
III. Experimental Design and Predictions
A. Design
We test for interpersonal comparison effects on decisions made under uncertainty by
paying two experimental subjects based on one subject's decision and a random draw. Across
treatments, decisions made by the decision making subject always affects his or her own payoffs
in the same way. How this subject's decision affects the other (matched) subject's payoff varies
by treatment. The decision making subject never knows anything about the matched subject
except how much he or she will receive as a result of the decision made and the random draw.
This isolates pure comparison effects from perceptions and attitudes about the matched subject
and from interactions between the matched subject's actions and the deciding subject's own
payoffs. By not varying the relationship between a subject's choices and his or her own payoffs,
we can isolate pure comparison effects from the framing effects and probability judgement biases
that affect choices between alternative risky situations. While these other factors may all be
important, we wish to focus only on interpersonal payoff comparisons in this study.
The experiment consists of six sessions of twenty subject each. We draw subjects
randomly from a large volunteer subject pool recruited in undergraduate and MBA classes at the
University of Iowa. Subjects are paid $3 for participating (in addition to any earnings they receive
as a result of their choice tasks). We have subjects arrive in two adjoining rooms and leave by
separate doors to insure anonymity.

The instructions are given in Appendix I. The rooms are arranged so that subjects in one room cannot see17
subjects in the other even when the door is open.
9
Upon arrival, subjects were given copies of the instructions and seated at desks separate
from each other. The instructions were read aloud to all subjects from a doorway between the
rooms. All questions were repeated and answered so that all subjects could hear.17
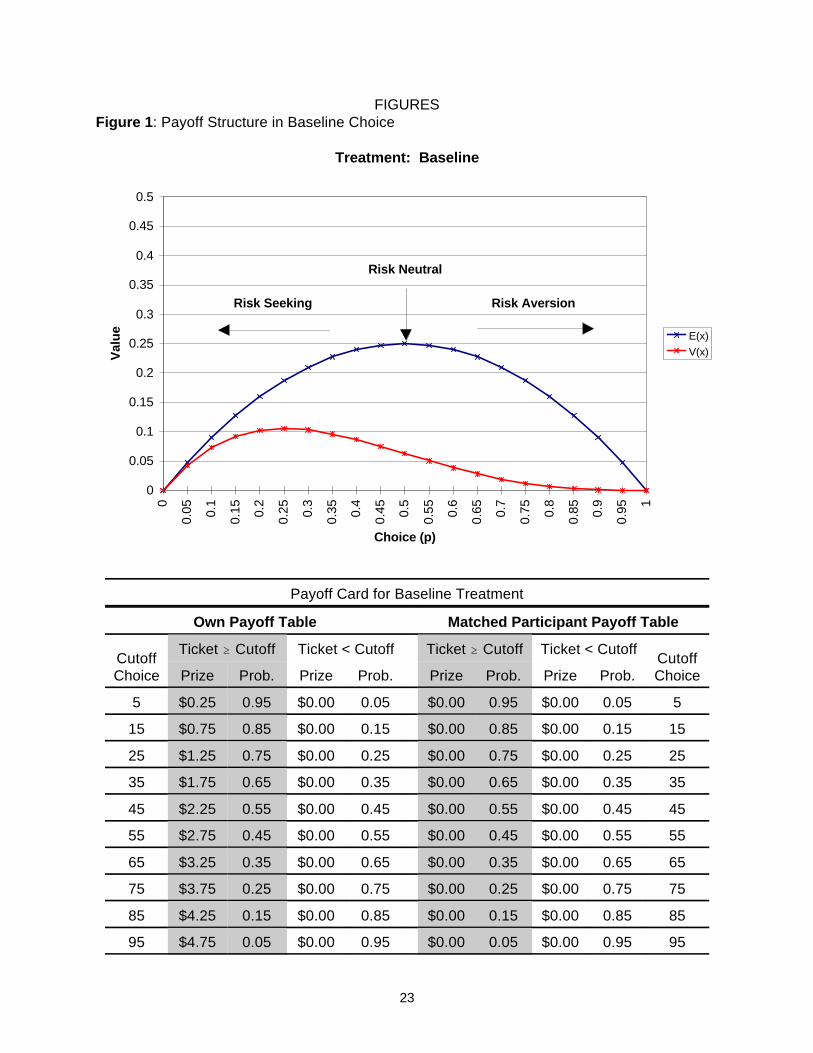
Each subject made five choices, one for each of five payoff cards. The payoff relevant
portions of the cards used for sessions F1S1, F1S2 and F1S3 are given in Figures 1 through 5.
These cards showed the subject how much they would be paid conditional on the choice they
make (denoted by "C" later) and a random draw. They also showed that each choice affected a
"Matched Participant" from the other room and how the choice affected that subject's payoffs.
The payoff determining random draws occurred after all subjects made all five choices.
These consisted of draws (with replacement) from a box of lottery tickets numbered 00 to 99. If
the ticket drawn exceeded the cutoff in the chosen row, the subject received the payment listed
in the "Ticket $ Cutoff" column on the left hand side of the payoff table. If not, the subject
received nothing. Thus, each choice corresponded to a probability of winning cash for the subject.
This probability does not vary with the treatment and we will use it as the measure of response,
denoting it by p. The figures at the top of each page show, as functions of p, the expected levels
and variances of payoffs to both subjects along with their (non-central) cross moment (the
expected value of the payoffs multiplied together).
The payoff cards contained five different "Matched Participant" sections, corresponding
to each of five treatments. In each treatment, the subjects' choices affect his or her own in exactly
the same manner. Increasing the choice (increasing C) corresponded to decreasing the
probability of receiving a payoff (p) but increasing its size. The optimal choice for a risk neutral
subject would be 50. Risk averse subjects will make smaller choices (corresponding to higher
probabilities of lower payoffs) while risk loving subjects will make larger choices (corresponding

A choice of 50 would maximize expected payoffs given the relationship between the choice and payoffs. 18
However, so we could see if approximately risk neutral subjects tended toward risk aversion or risk seeking, we did notallow this choice.
10
to lower probabilities of higher payoffs).18
In the Baseline treatment (Figure 1), subjects make this choice without having any impact
on another's payoffs. The Matched Participant payoff portion of the card corresponding to the
baseline contained only zeros. In the other treatments, the matched participant receives a
payment conditional on the decision making subject's choice and corresponding random draw.
If the ticket drawn exceed the cutoff in the chosen row, the matched participant received the
amount given in the "Ticket $ Cutoff" column on the right hand side of the table. If not, the
matched participant received the amount listed in the "Ticket < Cutoff" column.
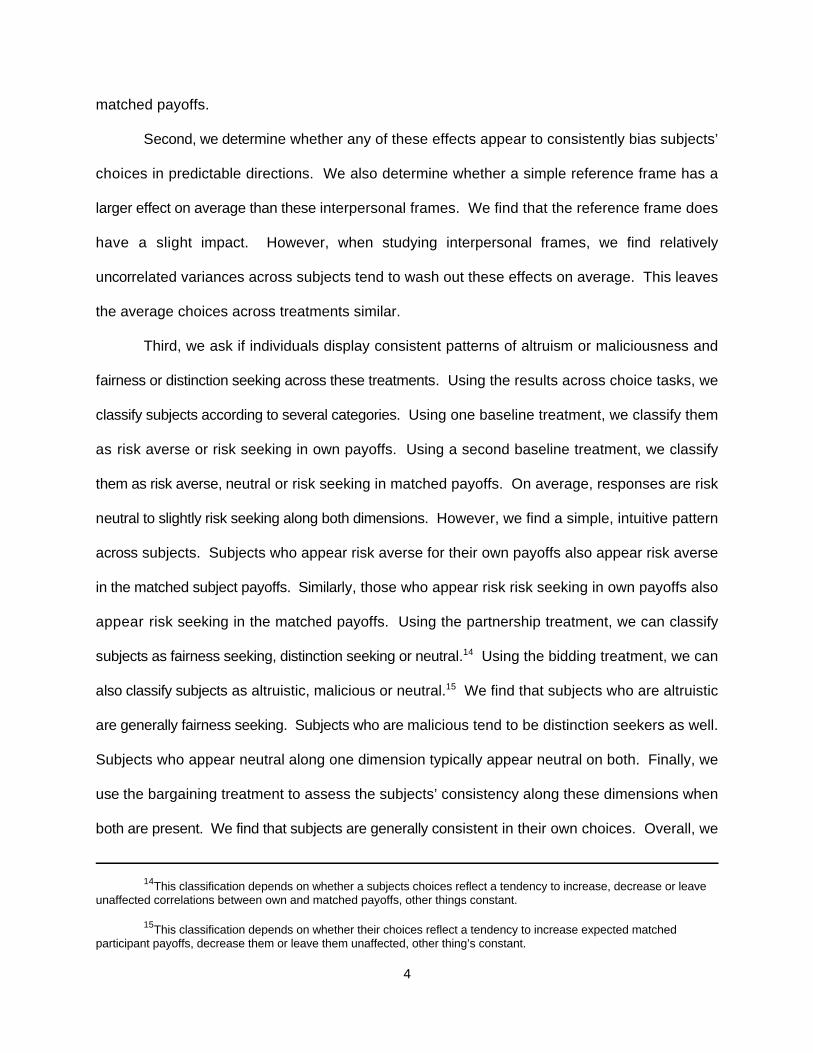
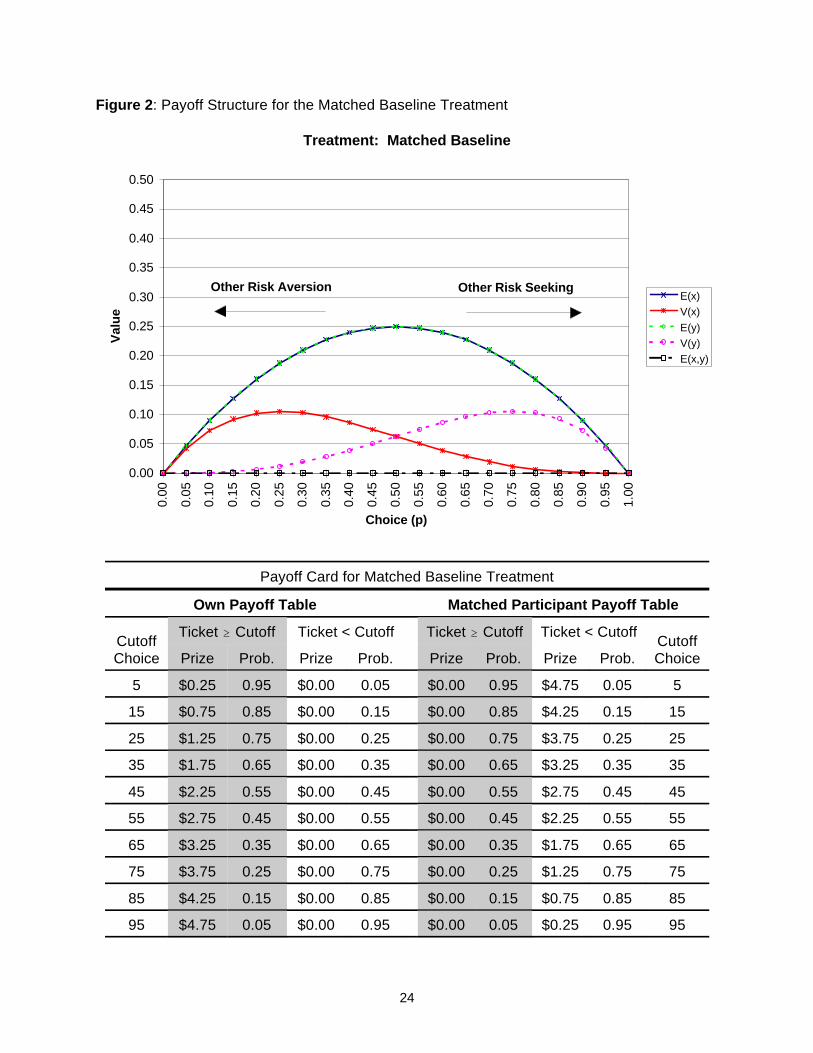
The Matched Baseline treatment in Figure 2 serves to identify relative risk attitudes over
own and matched participant payoffs. The expected payoffs of the two subjects align with each
other. However, the variances of these payoffs are mirrored around 0.5. The other three
treatments parallel “real world” situations and allow us to measure the impact of other
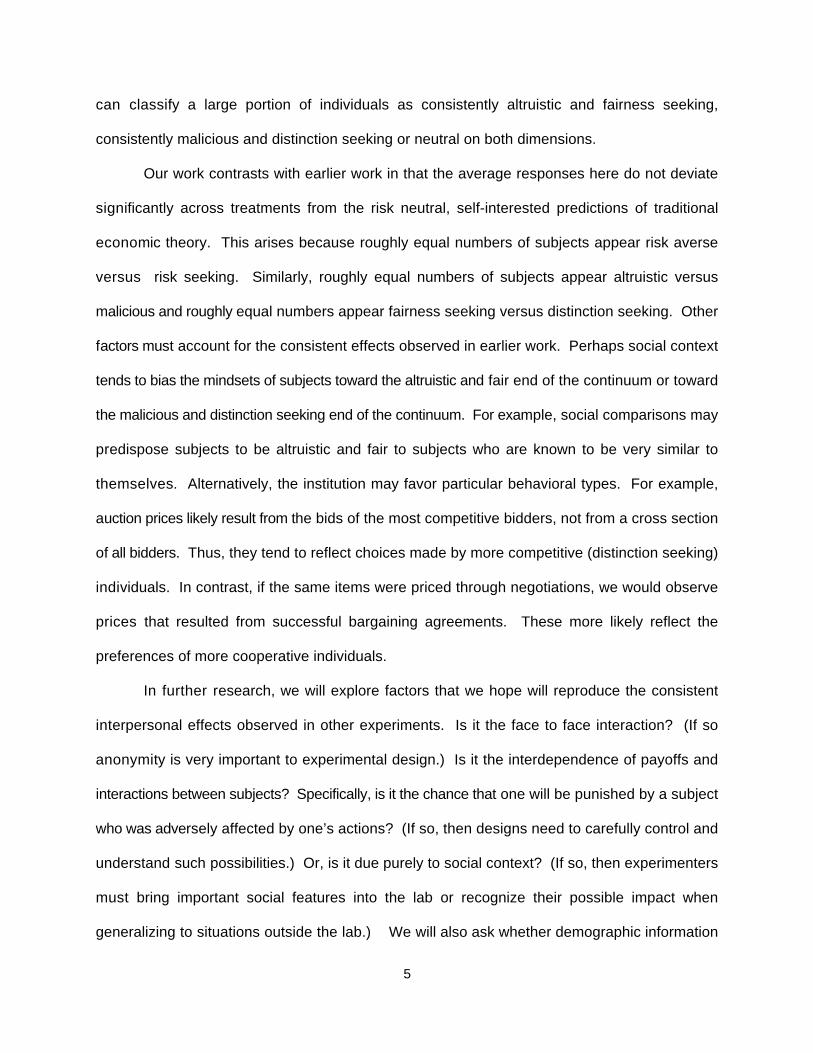
interpersonal comparisons on behavior. The incentives in Figure 3 corresponds roughly to a
partnership situation. The subjects' payoffs align perfectly. The incentives in Figure 4
corresponds roughly to a bidding situation. If the decision making subject decreases p (i.e., bids
less aggressively), the probability of receiving a payoff (winning the auction) decreases but the
subject receives more. This action increases the probability that the other subject receives a
payoff (wins the auction) and raises the other subject's payoff size (winning with a lower bid). The
incentives in Figure 5 corresponds roughly to a bargaining situation. If the decision making subject
lowers p (i.e., bargains more aggressively), the probability of receiving a payoff (settlement)
decreases, but the subject receives more while the other subject receives less. The treatments
are labeled accordingly.
Payoffs cards for sessions F2S1, F2S2 and F2S3 differed in slightly in their presentation.
11
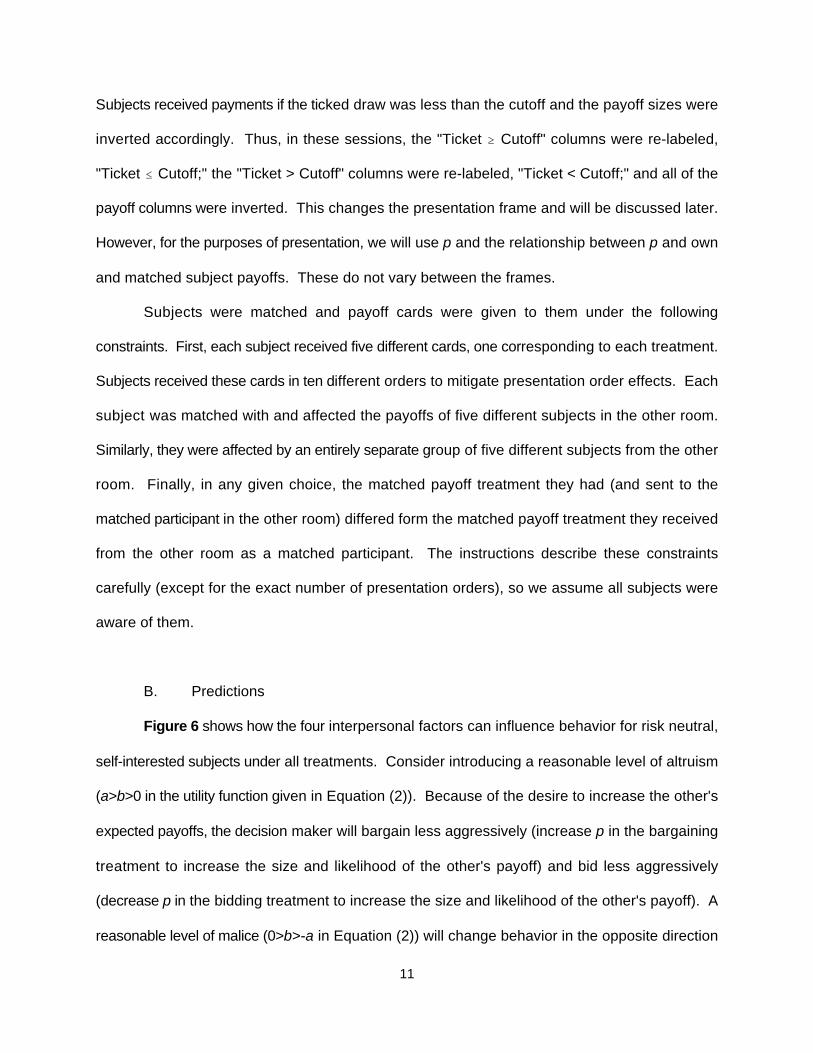
Subjects received payments if the ticked draw was less than the cutoff and the payoff sizes were
inverted accordingly. Thus, in these sessions, the "Ticket $ Cutoff" columns were re-labeled,
"Ticket # Cutoff;" the "Ticket > Cutoff" columns were re-labeled, "Ticket < Cutoff;" and all of the
payoff columns were inverted. This changes the presentation frame and will be discussed later.
However, for the purposes of presentation, we will use p and the relationship between p and own
and matched subject payoffs. These do not vary between the frames.
Subjects were matched and payoff cards were given to them under the following
constraints. First, each subject received five different cards, one corresponding to each treatment.
Subjects received these cards in ten different orders to mitigate presentation order effects. Each
subject was matched with and affected the payoffs of five different subjects in the other room.
Similarly, they were affected by an entirely separate group of five different subjects from the other
room. Finally, in any given choice, the matched payoff treatment they had (and sent to the
matched participant in the other room) differed form the matched payoff treatment they received
from the other room as a matched participant. The instructions describe these constraints
carefully (except for the exact number of presentation orders), so we assume all subjects were
aware of them.
B. Predictions
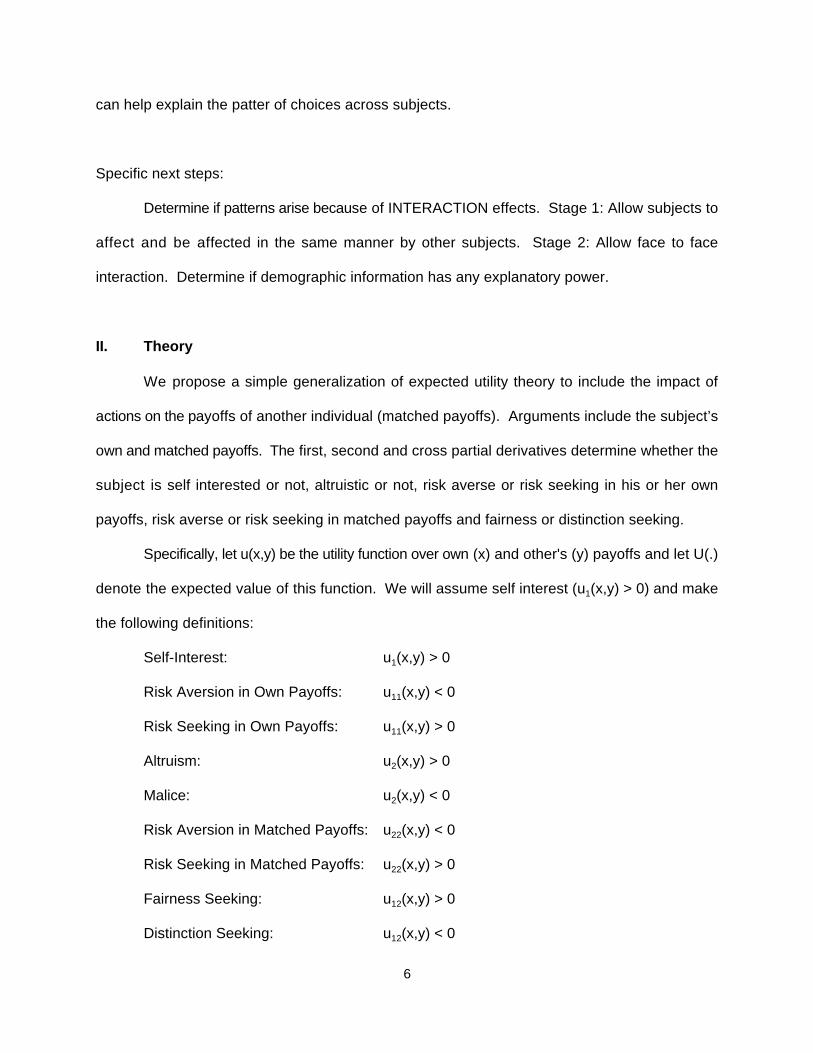
Figure 6 shows how the four interpersonal factors can influence behavior for risk neutral,
self-interested subjects under all treatments. Consider introducing a reasonable level of altruism
(a>b>0 in the utility function given in Equation (2)). Because of the desire to increase the other's
expected payoffs, the decision maker will bargain less aggressively (increase p in the bargaining
treatment to increase the size and likelihood of the other's payoff) and bid less aggressively
(decrease p in the bidding treatment to increase the size and likelihood of the other's payoff). A
reasonable level of malice (0>b>-a in Equation (2)) will change behavior in the opposite direction

12
as the decision maker tries to decrease the likelihood and size of the other's payoff.
Fairness results in apparent risk seeking behavior in the partnership treatment. The
increased covariance resulting from a lower p compensates for the loss in expected value.
Intuitively, since both misery and elation love company, the decision maker becomes more of a
risk taker. In the bidding treatment, the decision maker bids more aggressively (increases p). This
decreases the other's payoff when the decision maker receives nothing, increasing the covariance
and compensating for the decreased expected value. Intuitively, when the decision maker loses
the auction, he or she takes solace in the face that the other received a low payoff.
Distinction seeking is a desire for distinction between the subjects' payoffs. Thus, it affects
behavior in a direction opposite of fairness for the opposite reasons.
For the risk neutral bidder, the matched baseline treatment results in the same behavior
as the baseline treatment. However, choices in the baseline and matched baseline will serve to
pin down each subject’s risk preferences over the his or her own and the matched participant’s
payoffs.
IV. Results
We will discuss the data in terms of the probabilities of winning cash implicit in each
subjects choice. Recall, that p=0.5 is the optimal choice for a risk neutral subject in the baseline
treatment, p>0.5 reflects risk aversion and p<0.5 is risk seeking.
A. Summary of Choices
Table 1 summarizes the choices made by subjects in each treatment, in each session, in
each presentation frame and overall. Generally, Frame 1 choices do not differ significantly from
risk neutral on average, while Frame 2 choices appear slightly risk seeking. We interpret this as
a presentation frame effect. The payoff tables in Frame 2 were ordered top to bottom from

13
highest own payoff to lowest and from lowest own probability of winning to highest. The payoff
tables in Frame 1 were ordered top to bottom from lowest own payoff to highest and from highest
own probability of winning to lowest. If subjects start reading the tables at the top and their focus
is only pulled to the bottom by higher own payoffs, this may explain the differences in overall
results.
B. Stability of Choices
We ask whether subjects behave as pure hedonistic economic theory predicts: Do they
each consistently make a single (expected utility maximizing) choice on each of the five payoff
cards? Overwhelmingly not. Table 2 shows the frequencies with which individual subjects chose
one row in all five payoff cards, chose two rows, three rows, four rows and five rows. It also shows
the averages for Frame 1, Frame 2 and overall. The median number of unique choices is three
per subject. Only 10.00% of subjects made a single choice across all five payoff cards. In
contrast 18.33% made five unique choices across the five treatments.
C. Patterns in Individual Choices
Here, we develop a simple classification scheme based on subject choices and how
choices should vary across treatments depending on the subject's preferences. The scheme is
based simply on directional movements in choices between treatments. We find this scheme,
thought somewhat arbitrary, does an excellent job in organizing the data sensibly. Alternative
schemes based on derivatives or absolute levels of own and matched expected payoffs, variances
and cross moments perform similarly. We will use the directional movements scheme because
it is intuitive and computationally simple.

14
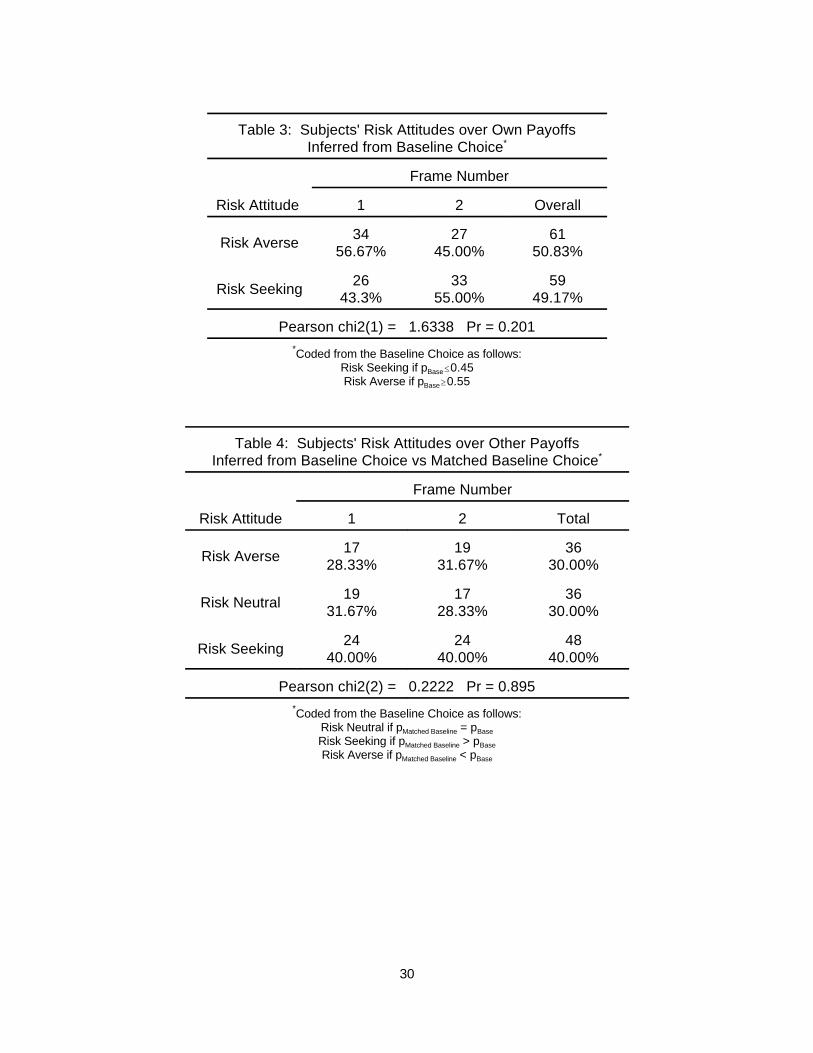
1. Risk Preferences in Own Payoffs
Using the Baseline choice, we classify subjects according to revealed risk preferences over
their own payoffs. We classify choices of p<0.5 as risk seeking and p>0.5 as risk averse. Table
3 shows how many subjects displayed each type of risk preference. Table 1 shows that the
average choice did not differ significantly from risk neutral in Frame 1 and was slightly risk averse
in Frame 2 and overall. Nevertheless, the frame did not make a significant difference when
classifying risk attitudes in this manner. Overall, about half the subjects appeared risk averse and
half appeared risk seeking.
One could conduct a similar exercise and infer risk preferences under an assumption of
pure hedonism in each other treatment. According to these measures risk preferences for many
individual subjects appear to change across treatments. Between the baseline and matched
baseline treatments, 45 subjects (37.5%) appear to "switch" between risk aversion and risk
seeking preferences. Respective numbers for apparent "switches" between the baseline and
partnership, bidding and bargaining choices are: 50 (41.67%), 43 (35.83%) and 43 (35.83%).
Thus, if one were to ignore the effect of participants' choices on others, one would conclude that
risk preferences are relatively unstable across institutions.
This evidence is consistent with Berg, Dickhaut and McCabe (1992) who measure apparent
risk preferences for subjects across three institutions. They find that subjects appear
overwhelmingly risk averse in sealed bid auctions to purchase risky assets. The same subjects
appear overwhelmingly risk seeking in clock auctions to sell similar assets and, on average, they
appear risk neutral when using the Becker, DeGroot, Marschak (1964) procedure to determine
purchase prices for these assets. Berg, Dickhaut and McCabe conclude that apparent risk
preferences change across institutions. However, many other factors change across their
institutions. The auction procedures entail new kinds of uncertainty (uncertainty about others’
values and strategic uncertainty) as well as interpersonal effects. Here, we find this apparent

Were we to classify subjects according to the more complex procedures discussed above, we would classify19
them as other risk seeking if they moved in the direction of the derivative of the other’s variance or if they actually(continued...)
15
instability of risk preferences remains without these new types of uncertainty. However, since the
only factor that changes in our design is the effect on others’ payoffs, we propose interpersonal
factors as an alternative explanation.
Next, we will classify subjects according to their responses to particular interpersonal
factors and look for patterns in these responses.
2. Risk Preferences in Matched Participant Payoffs
We compare the Baseline treatment to the Matched Baseline treatment to assess each
subject's response to affecting the risk faced by the matched participant. From comparing Figure
1 and Figure 2, notice that the expected payoffs for both subjects are the same for each choice.
Also, the subjects own impact on his or her own variance does not change between the
treatments. Finally, there is a zero cross moment between own and matched payoffs since the
subject and matched participant are never paid at the same time. If the subject is not
overwhelmingly malicious (u (x,y)>-u (x,y)), then the only choice-relevant factor that changes1 2
across the treatments is the effect the subject's choice has on the risk faced by the matched
participant. If the subject is risk averse in the matched participant’s payoffs, the optimal p should
fall relative to the baseline. If the subject is risk seeking in the matched participant’s payoffs, the
optimal p should rise relative to the baseline.
We classify subjects as risk averse, risk neutral or risk seeking in matched payoffs by
comparing the choice in the Matched Baseline treatment to the benchmark of the Baseline
treatment. We classify a subject as risk neutral in the matched payoff if the choices are the same
in the two treatments. We classify the subject as risk averse in the matched payoff if
p <p and as risk seeking if p >p . Table 4 shows how manyMatched Baseline Baseline Matched Baseline Baseline19

(...continued)19
increased the other’s variance. As mentioned above, it matters little for the results. These two measures havecorrelation coefficients of 0.9157 and 0.9527 with our simpler measure. This holds similarly for our other classifications. However, these other classifications become relatively complex in the bargaining treatment.
16
subjects were risk averse, risk neutral and risk seeking in matched payoffs across the two Frames
and overall. Again, the Frame did not matter. The distribution of risk preferences over matched
payoffs was tilted slightly to risk seeking with 30% risk averse, 30% risk neutral and 40% risk
seeking.
3. Correlation In Risk Preferences over Own and Matched Participant Payoffs
Having categorized subjects according to their risk preferences over own and matched
payoffs, we ask whether a systematic correlation between the two exists. Table 5 shows the
correlation between these measures. Most subjects who are risk averse in own payoffs are risk
neutral or risk averse in matched payoffs (with the mode being risk averse). Similarly, those who
are risk seeking in own payoffs are correspondingly risk neutral or risk seeking in matched payoffs
(with the mode being risk seeking). The correlation is striking with an P (4) statistic of 31.531. 2
(This is especially striking because the only way risk averse subjects could be classified as
matched risk averse is to decrease the risk of the matched participant at the expense of increasing
the risk they faced themselves. Similarly, the only way risk seeking subjects could be classified
as matched risk seeking is to increase the risk of the matched participant at the expense of
decreasing the risk they faced themselves.)
4. Fairness versus Distinction Seeking
The Baseline and Matched Baseline treatments tell us how the subject is affected by the
impact of his or her choice on the expected value and variance of own and matched payoffs. In
fact, the shift in choice between them shows how the subject changes because he or she affects

This is an approximation which is correct at p=0.5.20
17
the variance of own and matched payoffs in the opposite direction. (Increasing p decreases own
variance and increases matched variance.) Here, we use these shifts to create a benchmark for
the partnership choice. We make the simplifying assumption that, if the effect on the matched
variance is reversed, the shift his or her choice from the baseline by the same amount, but in the
opposite direction. Figures 2 and 3 show there are two differences between the check and20
partnership choices. First, the effect on matched variance works in the opposite direction.
Second, since both subjects are paid at the same time and lose at the same time, the choice of
p affects the correlation across payoffs in the partnership treatment.
To account for the effect on matched variance, we use the benchmark of
2p -p . This reflects the shift from the Baseline to Matched Baseline treatmentBaseline Matched Baseline
around the choice in the Baseline treatment. (That is, it assumes the subject will be affected by
the impact on matched variance by the same amount, but in the opposite direction.) Then, we
compare p to this benchmark and classify subjects as neutral (if p = p ),Partnership Partnership benchmark
fairness seeking (if p < p ) or distinction seeking (if p > p ).Partnership benchmark Partnership benchmark
Table 6 gives the results of this classification. The last two lines show subjects with
benchmarks that fall outside the admissible range of choices. We do not classify them. For the
subjects we do classify, many fall in each category. The Frame does appear to affect this
categorization. Fewer subjects appear neutral under Frame 2 than under Frame 1. Overall, the
median subject is neutral, but the modal subject seeks fairness.
5. Altruism versus Malice
Again, we will use the Baseline and Matched Baseline choices to create a benchmark for
the Bidding choice. Again, we make the simplifying assumption that, if the effect on the matched

18
variance is reversed, the subject's choice shifts from the baseline by the same amount, but in the
opposite direction. Figures 2 and 4 show there are two differences between the Matched Baseline
and Bidding choices. First, as in the Partnership choice, the effect on matched variance works
in the opposite direction. Second, the subject can affect the expected payoff of the matched
participant. If the subject decreases p , he or she increases both the probability and size ofBidding
the matched participant’s payoff. Essentially, at the expense of his or her own expected payoff,
the subject can hand money over to or take money away from the matched participant. An altruist
will decrease p and a malicious subject will increase p .Bidding Bidding
To account for the effect on matched variance, we again use the benchmark of
2p -p . This reflects the shift from the Baseline to the Matched Baseline treatmentBaseline Matched Baseline
around the choice in the Baseline treatment. (That is, it assumes the subject will be affected by
the impact on matched variance by the same amount, but in the opposite direction.) Then, we
compare p to this benchmark and classify subjects as neutral (if p = p ), altruisticBidding Bidding benchmark
(if p < p ) or malicious(if p > p ).Bidding benchmark Bidding benchmark
Table 7 gives the results of this classification. Again, the last two lines show subjects that
have benchmarks outside the admissible range of choices. Again, many subjects fall in each
category. The Frame does not make a significant difference. Overall, the median subject is
neutral, but the modal subject is altruistic.
6. Correlation between Altruism/Malice and Fairness/Distinction Seeking
Having categorized subjects along an Altruism/Malice dimension and Fairness/Distinction
dimension, we ask whether a systematic correlation between the two exists. Table 8 shows the
correlation between these measures. Most subjects who are altruistic are also fair. Similarly,
those who are or malicious are also distinction seeking. Finally, those who are neutral in the
altruism/malice dimension are also generally neutral in the fairness/distinction dimension. Again,

19
the correlation is striking with an P (4) statistic of 77.6147.2
7. Consistency Check using the Bargaining Choice
The Bargaining choice can be used to determine whether altruism/fairness seeking or
malice/distinction seeking dominates. Figure 5 shows that the Bargaining treatment has aspects
of all four other treatments. As with all the treatments, the impact of the choice on own expected
payoffs and variance in own payoffs is the same as in the Baseline treatment. The impact on
variance of own payoffs is the same as in the Matched Baseline treatment. The impact on
expected matched payoffs is the mirror image of the Bidding treatment. The impact on correlation
of own and matched is the mirror image of the Partnership treatment. Thus, subject preferences
along both altruism/maliciousness and fairness/distinction seeking dimensions can affect choice.
Here, the effect on matched variance is the same as in the Matched Baseline choice, so
we will use the Matched Baseline choice as the benchmark. Both altruism and fairness seeking
tend to increase the optimal p. Both maliciousness and distinction seeking tend to decrease the
optimal p. Thus, we will classify a subject as altruism/fairness seeking dominant if the Bargaining
choice exceeds the Matched Baseline choice. We will classify a subject as malicious/distinction
seeking dominant if the Bargaining choice falls below the Matched Baseline choice. We will
classify a subject as neither if the Bargaining and Matched Baseline choices equal each other.
We then compare this classification to a classification of both altruistic and fairness seeking or
both malicious and distinction seeking according to the other four choices.
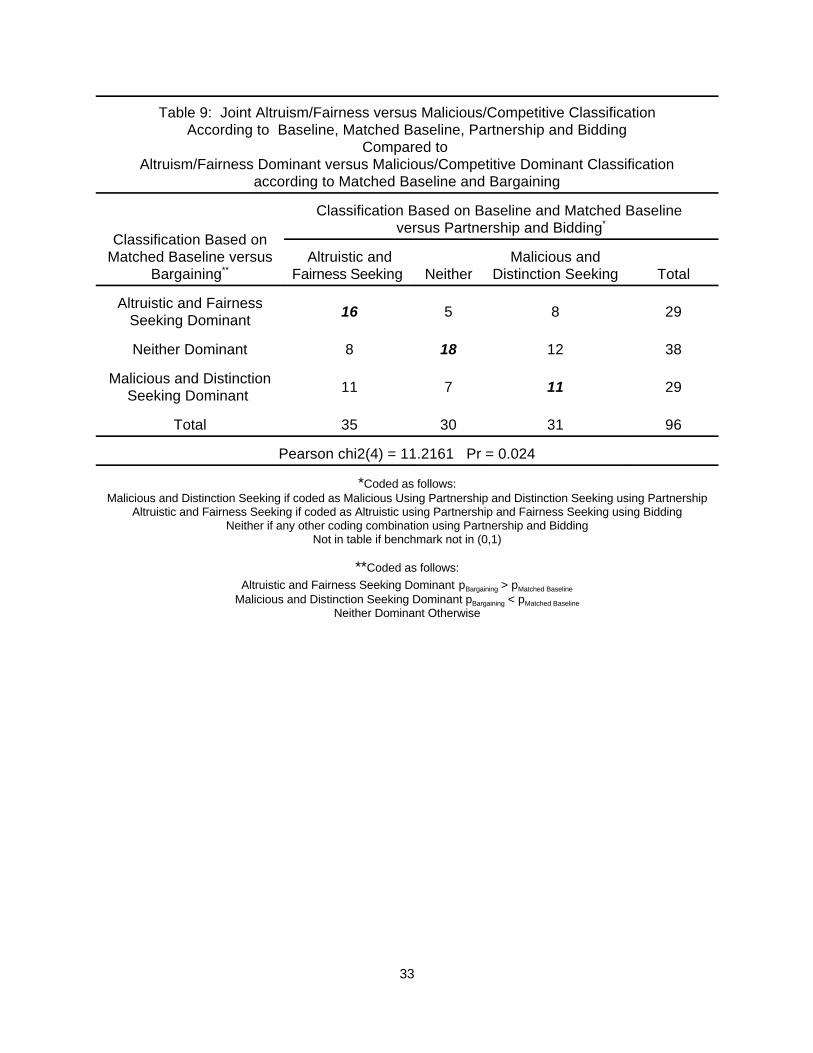
Table 9 shows the correlation between the classification according to the Bargaining choice
versus the classification using the other four choices. Generally, the modal subject who is
classified as both altruistic and fairness seeking according to the other four choices is also
classified as altruistic/fairness seeking dominant according to the Bargaining choice. Similarly,
the modal subject is neither according to the other choices is also neither according to the

20
Bargaining Choice. However, subjects who are classified as malicious/distinction seeking
according to the other four choices tend to be less so according to the bargaining choice. We
note that the incentive structure in the bargaining choice is the most complex here. In addition,
fairness and altruism can work in opposite directions relative to the baseline choice with a high p.
Alternatively, the correlation structure of payoffs in the bargaining situation may serve to
emphasize and bring out altruistic and fairness seeking traits.
V. Conclusions
To be Completed. Here are notes from the proposal:
Regardless of the results, this research should prove interesting. If interpersonal factors
do not exist, we can eliminate them when searching for explanations of the "sub-optimal" behavior
often observed in experimental games. Such results support the currently accepted notion of
"rational" self-interested decision making. Conversely, if the factors do exist, they may explain
apparent "sub-optimal" behavior in experiments or everyday life. This provides an explanation for
the apparent instability of risk preferences across institutions. It also may explain Berg and
Dickhaut’s (??) result that it is more difficult to induce apparent risk neutrality in some institutions
(e.g., sealed bid auctions) than in others (e.g., individual choice settings).
We should take these factors into consideration when making predictions about behavior.
Further, since we can often frame the same decisions in different terms (e.g., forming prices by
bidding, bargaining or market exchanges), we can select the frame to promote desired outcomes.
For example, if we want an equitable division of surplus from a transaction and we find that
individuals are likely to have a greater concern for fairness in bargaining situations, we may want
to arrange a transaction through bargaining instead of bidding. Conversely, if we prefer to
maximize surplus and we find that bidding encourages this outcome, we may want to arrange the
transaction through bidding.

21
REFERENCES
Allais, M., 1953, "Généralisation des Théories del l'Équilibre Économique Général et duRendement Social au cas du Risque," Econométrie, Colloque International XL, CNRS,Paris.
Arrow, K.J., 1953, "Le Rôle des Valeurs Boursiéres pour la Répartition la Meilleure des Risques,"Econométrie, Colloque International XL, CNRS, Paris; translated as "The Role ofSecurities in the Optimal Allocation of Risk-Bearing," Review of Economic Studies, XXXI,1964.
Battalio, R.C., J.H. Kagel and K. Jiranyakul, 1990, "Testing Between Alternative Models of ChoiceUnder Uncertainty: Some Initial Results," Journal of Risk and Uncertainty, 3, 25-50.
Becker, G.M., M.H. DeGroot and J. Marschak, 1964, "Measuring Utility by a Single-ResponseSequential Method," Behavioral Science, Vol. 9, July 1964, pp. 226-232.
Bell, D.E., 1982, "Regret in Decision making under Uncertainty," Operations Research, 30, 5, 961-981.
Bell, D.E., 1988, "Disappointment in Decision Making Under Uncertainty," Chapter 16 in D.E. Bell,H. Raiffa and A. Tversky, eds., Decision Making: Descriptive, Normative and PrescriptiveInteractions, Cambridge University Press, Cambridge.
Berg, J.E. and J.W. Dickhaut, ??, “??.”
Berg, J.E., J.W. Dickhaut and K. McCabe, 1992, "Risk Preference Instability Across Institutions:A Dilemma,” University of Iowa Working Paper.
Cooper, R.W., D.V. DeJong, R. Forsythe and T.W. Ross, 1992, "Communication in CoordinationGames," Quarterly Journal of Economics, 107, 2, 739-771.
Cooper, R.W., D.V. DeJong, R. Forsythe and T.W. Ross, 1990, "Selection Criteria in CoordinationGames: Some Experimental Results," American Economic Review, 80, 1, 218-233.
Galbraith, J.K., 1958, The Affluent Society, Houghton Mifflin, Boston.
Gul, F., 1991, "A Theory of Disappointment Aversion," Econometrica, 59, 667-686.
Hoffman, E., and M.L. Spitzer, 1982, "The Coase Theorem: Some Experimental Tests," Journalof Law and Economics, 25, 73-98.
Hoffman, E., K. McCabe, K. Shachat and V. Smith, 1992, "Preferences, property Rights andAnonymity in Bargaining Games," Mimeo, University of Arizona.
Kahneman, D., and A. Tversky, 1979, "Prospect Theory: An Analysis of Decision Under Risk,"Econometrica, 47, 263-291.
Loewenstein, G.F., L. Thompson and M.H. Bazerman, 1989, "Social Utility and Decision making

22
in Interpersonal Contexts," Journal of personality and Social Psychology, 57, 3, 426-441.
Loomes, G. and R. Sugden, 1982, "Regret Theory: An Alternative Theory of Rational ChoiceUnder Uncertainty," The Economic Journal, 92, 805-824.
Machina, M.J., 1982, "`Expected Utility' Analysis without the Independence Axiom," Econometrica,50, 277-323.
Machina, M.J., 1987, "Choice Under Uncertainty: Problems Solved and Unsolved," Journal ofEconomic Perspectives, 1, 121-154.
MacCrimmon, K.R., and D.M. Messick, 1976, "A Framework for Social Motives," BehavioralScience, 21, 86-100.
Neumann, J. von and O. Morgenstern, 1944, Theory of Games and Economic Behavior, PrincetonUniversity Press, Princeton, New Jersey.
Samuelson, W. and R. Zeckhauser, 1988, "Status Quo Bias in Decision Making," Journal of Riskand Uncertainty, 1, 7-59.
Scott, R.H., 1972, "Avarice, Altruism and Second Party Preferences," Quarterly Journal ofEconomics, 86, 1-18.
Sugden, R., 1986, "New Developments in the Theory of Choice Under Uncertainty," Bulletin ofEconomic Research, 38, 1-24.
Veblen, T., 1909, "The Limitations of Marginal Utility," The Journal of Political Economy, 19, 9,620-636.
Veblen, T., 1931, The Theory of the Leisure Class: An Economic Study of Institutions, The VikingPress, New York.
Weber, M., and C. Camerer, 1987, "Recent Developments in Modeling Risk Under Uncertainty,"OR Spectrum, 9, 129-151.
Treatment: Baseline
0
0.05
0.1
0.15
0.2
0.25
0.3
0.35
0.4
0.45
0.5
0
0.05 0.1
0.15 0.2
0.25 0.3
0.35 0.4
0.45 0.5
0.55 0.6
0.65 0.7
0.75 0.8
0.85 0.9
0.95 1
Choice (p)
Val
ue E(x)
V(x)
Risk Neutral
Risk AversionRisk Seeking
23
Figure 1: Payoff Structure in Baseline ChoiceFIGURES
Payoff Card for Baseline Treatment
Own Payoff Table Matched Participant Payoff Table
Cutoff CutoffChoice ChoicePrize Prob. Prize Prob. Prize Prob. Prize Prob.
Ticket $ Cutoff Ticket < Cutoff Ticket $ Cutoff Ticket < Cutoff
5 $0.25 0.95 $0.00 0.05 $0.00 0.95 $0.00 0.05 5
15 $0.75 0.85 $0.00 0.15 $0.00 0.85 $0.00 0.15 15
25 $1.25 0.75 $0.00 0.25 $0.00 0.75 $0.00 0.25 25
35 $1.75 0.65 $0.00 0.35 $0.00 0.65 $0.00 0.35 35
45 $2.25 0.55 $0.00 0.45 $0.00 0.55 $0.00 0.45 45
55 $2.75 0.45 $0.00 0.55 $0.00 0.45 $0.00 0.55 55
65 $3.25 0.35 $0.00 0.65 $0.00 0.35 $0.00 0.65 65
75 $3.75 0.25 $0.00 0.75 $0.00 0.25 $0.00 0.75 75
85 $4.25 0.15 $0.00 0.85 $0.00 0.15 $0.00 0.85 85
95 $4.75 0.05 $0.00 0.95 $0.00 0.05 $0.00 0.95 95
Treatment: Matched Baseline
0.00
0.05
0.10
0.15
0.20
0.25
0.30
0.35
0.40
0.45
0.500.
00
0.05
0.10
0.15
0.20
0.25
0.30
0.35
0.40
0.45
0.50
0.55
0.60
0.65
0.70
0.75
0.80
0.85
0.90
0.95
1.00
Choice (p)
Val
ue
E(x)V(x)
E(y)V(y)E(x,y)
Other Risk SeekingOther Risk Aversion
24
Figure 2: Payoff Structure for the Matched Baseline Treatment
Payoff Card for Matched Baseline Treatment
Own Payoff Table Matched Participant Payoff Table
Cutoff CutoffChoice ChoicePrize Prob. Prize Prob. Prize Prob. Prize Prob.
Ticket $ Cutoff Ticket < Cutoff Ticket $ Cutoff Ticket < Cutoff
5 $0.25 0.95 $0.00 0.05 $0.00 0.95 $4.75 0.05 5
15 $0.75 0.85 $0.00 0.15 $0.00 0.85 $4.25 0.15 15
25 $1.25 0.75 $0.00 0.25 $0.00 0.75 $3.75 0.25 25
35 $1.75 0.65 $0.00 0.35 $0.00 0.65 $3.25 0.35 35
45 $2.25 0.55 $0.00 0.45 $0.00 0.55 $2.75 0.45 45
55 $2.75 0.45 $0.00 0.55 $0.00 0.45 $2.25 0.55 55
65 $3.25 0.35 $0.00 0.65 $0.00 0.35 $1.75 0.65 65
75 $3.75 0.25 $0.00 0.75 $0.00 0.25 $1.25 0.75 75
85 $4.25 0.15 $0.00 0.85 $0.00 0.15 $0.75 0.85 85
95 $4.75 0.05 $0.00 0.95 $0.00 0.05 $0.25 0.95 95

Treatment: Partnership
0.00
0.05
0.10
0.15
0.20
0.25
0.30
0.35
0.40
0.45
0.500.
00
0.05
0.10
0.15
0.20
0.25
0.30
0.35
0.40
0.45
0.50
0.55
0.60
0.65
0.70
0.75
0.80
0.85
0.90
0.95
1.00
Choice (p)
Val
ue
E(x)V(x)
E(y)V(y)E(x,y)
Fairness
Other Risk AversionOther Risk Seeking
Distinction
25
Figure 3: Payoff Structure for Partnership Choice
Payoff Card for Partnership Treatment
Own Payoff Table Matched Participant Payoff Table
Cutoff CutoffChoice ChoicePrize Prob. Prize Prob. Prize Prob. Prize Prob.
Ticket $ Cutoff Ticket < Cutoff Ticket $ Cutoff Ticket < Cutoff
5 $0.25 0.95 $0.00 0.05 $0.25 0.95 $0.00 0.05 5
15 $0.75 0.85 $0.00 0.15 $0.75 0.85 $0.00 0.15 15
25 $1.25 0.75 $0.00 0.25 $1.25 0.75 $0.00 0.25 25
35 $1.75 0.65 $0.00 0.35 $1.75 0.65 $0.00 0.35 35
45 $2.25 0.55 $0.00 0.45 $2.25 0.55 $0.00 0.45 45
55 $2.75 0.45 $0.00 0.55 $2.75 0.45 $0.00 0.55 55
65 $3.25 0.35 $0.00 0.65 $3.25 0.35 $0.00 0.65 65
75 $3.75 0.25 $0.00 0.75 $3.75 0.25 $0.00 0.75 75
85 $4.25 0.15 $0.00 0.85 $4.25 0.15 $0.00 0.85 85
95 $4.75 0.05 $0.00 0.95 $4.75 0.05 $0.00 0.95 95

Treatment: Bidding
0.00
0.05
0.10
0.15
0.20
0.25
0.30
0.35
0.40
0.45
0.500.
00
0.05
0.10
0.15
0.20
0.25
0.30
0.35
0.40
0.45
0.50
0.55
0.60
0.65
0.70
0.75
0.80
0.85
0.90
0.95
1.00
Choice (p)
Val
ue
E(x)V(x)E(y)
V(y)E(x,y)
Altruism
Other Risk AversionOther Risk Seeking
Malice
26
Figure 4: Payoff Structure for Bidding Choice
Payoff Card for Bidding Treatment
Own Payoff Table Matched Participant Payoff Table
Cutoff CutoffChoice ChoicePrize Prob. Prize Prob. Prize Prob. Prize Prob.
Ticket $ Cutoff Ticket < Cutoff Ticket $ Cutoff Ticket < Cutoff
5 $0.25 0.95 $0.00 0.05 $0.00 0.95 $0.00 $0.25 5
15 $0.75 0.85 $0.00 0.15 $0.00 0.85 $0.00 $0.75 15
25 $1.25 0.75 $0.00 0.25 $0.00 0.75 $0.00 $1.25 25
35 $1.75 0.65 $0.00 0.35 $0.00 0.65 $0.00 $1.75 35
45 $2.25 0.55 $0.00 0.45 $0.00 0.55 $0.00 $2.25 45
55 $2.75 0.45 $0.00 0.55 $0.00 0.45 $0.00 $2.75 55
65 $3.25 0.35 $0.00 0.65 $0.00 0.35 $0.00 $3.25 65
75 $3.75 0.25 $0.00 0.75 $0.00 0.25 $0.00 $3.75 75
85 $4.25 0.15 $0.00 0.85 $0.00 0.15 $0.00 $4.25 85
95 $4.75 0.05 $0.00 0.95 $0.00 0.05 $0.00 $4.75 95

Treatment: Bargaining
0.00
0.05
0.10
0.15
0.20
0.25
0.30
0.35
0.40
0.45
0.500.
00
0.05
0.10
0.15
0.20
0.25
0.30
0.35
0.40
0.45
0.50
0.55
0.60
0.65
0.70
0.75
0.80
0.85
0.90
0.95
1.00
Choice (p)
Val
ue
E(x)V(x)
E(y)V(y)E(x,y)
Malice
Other Risk SeekingOther Risk Aversion
Altruism
FairnessDistinction
27
Figure 5: Payoff Structure for Bargaining Choice
Payoff Card for Bargaining Treatment
Own Payoff Table Matched Participant Payoff Table
Cutoff CutoffChoice ChoicePrize Prob. Prize Prob. Prize Prob. Prize Prob.
Ticket $ Cutoff Ticket < Cutoff Ticket $ Cutoff Ticket < Cutoff
5 $0.25 0.95 $0.00 0.05 $4.75 0.95 $0.00 0.05 5
15 $0.75 0.85 $0.00 0.15 $4.25 0.85 $0.00 0.15 15
25 $1.25 0.75 $0.00 0.25 $3.75 0.75 $0.00 0.25 25
35 $1.75 0.65 $0.00 0.35 $3.25 0.65 $0.00 0.35 35
45 $2.25 0.55 $0.00 0.45 $2.75 0.55 $0.00 0.45 45
55 $2.75 0.45 $0.00 0.55 $2.25 0.45 $0.00 0.55 55
65 $3.25 0.35 $0.00 0.65 $1.75 0.35 $0.00 0.65 65
75 $3.75 0.25 $0.00 0.75 $1.25 0.25 $0.00 0.75 75
85 $4.25 0.15 $0.00 0.85 $0.75 0.15 $0.00 0.85 85
95 $4.75 0.05 $0.00 0.95 $0.25 0.05 $0.00 0.95 95

-0.25
-0.20
-0.15
-0.10
-0.05
0.00
0.05
0.10
0.15
0.20
0.25
Neutralb=0c=0
Altruismb=0.25
c=0
Maliceb=-0.25
c=0
Fairnessb=0
c=0.25
Distinctionb=0
c=-0.25
Dev
iati
oin
fo
rm 0
.5
BaselineCheckPartnership
BiddingBargaining
28
Figure 6: Deviations in Optimal Probability Choices (p) from 0.5 for Risk Neutral UtilityFunctions with Moderate Levels of Altruism/Malice and Fairness/Distinction Seeking

29
TABLES
Table1: Summary Information
Session Baseline Bidding Partnership Bargaining Baseline
TreatmentMatched
F1S10.480 0.525 0.550 0.480 0.500
(0.117) (0.085) (0.138) (0.159) (0.185)
F1S20.460 0.500 0.440 0.505 0.495
(0.165) (0.105) (0.097) (0.161) (0.143)
**
F1S30.505 0.480 0.525 0.525 0.520
(0.167) (0.211) (0.112) (0.177) (0.103)
F2S10.415 0.445 0.385 0.375 0.425*
(0.201) (0.182) (0.193) (0.162) (0.202)
** **
F2S20.440 0.420 0.450 0.460 0.390
(0.234) (0.159) (0.145) (0.200) (0.179)
** **
F2S30.435 0.485 0.460 0.495 0.480*
(0.160) (0.179) (0.152) (0.115) (0.134)
Frame 10.482 0.502 0.505 0.503 0.505
(0.150) (0.143) (0.124) (0.164) (0.145)
Frame 20.430 0.450 0.432 0.443 0.432**
(0.197) (0.173) (0.165) (0.168) (0.175)
** ** ** **
Overall0.456 0.476 0.468 0.473 0.468**
(0.176) (0.160) (0.150) (0.168) (0.164)
* ** * **
Significantly different from 0.5 at the 90% level of confidence*
Significantly different from 0.5 at the 95% level of confidence**
Table 2: Frequency of Number of Unique Choices Made
Session Median1 2 3 4 5Number of Unique Choices
F1S1 2 5 6 5 2 3F1S2 2 5 7 5 1 3F1S3 3 4 5 3 5 3F2S1 2 4 6 4 4 3F2S2 0 3 6 3 8 4F2S3 3 7 5 3 2 2.5
Frame 1 2.33 4.67 6.33 4.33 2.67 3Frame 2 1.67 4.67 5.67 3.33 4.67 3Overall 2.00 4.67 6.00 3.83 3.67 3
30
Table 3: Subjects' Risk Attitudes over Own PayoffsInferred from Baseline Choice*
Risk Attitude 1 2 Overall
Frame Number
Risk Averse34 27 61
56.67% 45.00% 50.83%
Risk Seeking26 33 59
43.3% 55.00% 49.17%
Pearson chi2(1) = 1.6338 Pr = 0.201
Coded from the Baseline Choice as follows:*
Risk Seeking if p #0.45Base
Risk Averse if p $0.55Base
Table 4: Subjects' Risk Attitudes over Other PayoffsInferred from Baseline Choice vs Matched Baseline Choice*
Risk Attitude 1 2 Total
Frame Number
Risk Averse17 19 36
28.33% 31.67% 30.00%
Risk Neutral19 17 36
31.67% 28.33% 30.00%
Risk Seeking24 24 48
40.00% 40.00% 40.00%
Pearson chi2(2) = 0.2222 Pr = 0.895
Coded from the Baseline Choice as follows:*
Risk Neutral if p = pMatched Baseline Base
Risk Seeking if p > pMatched Baseline Base
Risk Averse if p < pMatched Baseline Base

31
Table 5: Correspondence of Risk Attitudes over Own vs Other Payoffs
Risk Attitude Risk Attitude over Other PayoffOver Own
Payoff Risk Averse Risk Neutral Risk Seeking Total
Risk Averse 29 22 10 61
Risk Seeking 7 14 38 59
Total 36 36 48 120
Pearson chi2(2) = 31.5310 Pr = 0.000
Table 6: Subjects’ Attitudes over Fairness vs DistinctionInferred from Partnership Choice vs Baseline and Matched Baseline Choices*
Attitude Displayed 1 2 Total
Frame Number
Fairness Seeking16 24 40
30.77% 54.55% 41.67%
Neutral16 6 22
30.77% 13.64% 22.92%
Distinction Seeking20 14 34
38.46% 31.82% 35.42%
Pearson chi2(2) = 6.4651 Pr = 0.039
2*p - p < 0 6 12 18Base Matched Baseline
10.00% 20.00% 15.00%
2*p - p > 0 2 4 6Base Matched Baseline
3.33% 6.67% 5.00%
Coded from the Partnership, Baseline and Matched Baseline Choices as follows:*
Neutral if p = 2*p - pPart Base Matched Baseline
Fairness Seeking if p < 2*p - pPart Base Matched Baseline
Distinction Seeking if p > 2*p - pPart Base Matched Baseline

32
Table 7: Subjects’ Attitudes over Altruism vs MaliceInferred from Bidding Choice vs Baseline and Matched Baseline Choices*
AttitudeFraming Number
1 2 Total
Altruistic 15 21 3128.85% 47.73% 37.50%
Neutral 12 8 2023.08% 18.18% 20.83%
Malicious 25 15 4048.08% 34.09% 41.67%
Pearson chi2(2) = 2.7589 Pr = 0.252
2*p - p < 0 6 12 18Base Matched Baseline
10.00% 20.00% 15.00%
2*p - p > 0 2 4 6Base Matched Baseline
3.33% 6.67% 5.00%
Coded from the Biding, Baseline and Matched Baseline Choices as follows:*
Neutral if p = 2*p - pBid Base Matched Baseline
Altruistic if p < 2*p - pBid Base Matched Baseline
Malicious if p > 2*p - pBid Base Matched Baseline
Table 8: Correspondence of Attitudes overAltruism vs Malice and Fairness vs Distinction
Fairness vsDistinction Altruistic Neutral Malicious Total
Altruism vs Malice
Fairness Seeking 29 4 7 40
Neutral 3 15 4 22
Distinction Seeking 4 1 29 34
Total 36 20 40 96
Pearson chi2(4) = 77.6147 Pr = 0.000
33
Table 9: Joint Altruism/Fairness versus Malicious/Competitive ClassificationAccording to Baseline, Matched Baseline, Partnership and Bidding
Compared to Altruism/Fairness Dominant versus Malicious/Competitive Dominant Classification
according to Matched Baseline and Bargaining
Classification Based onMatched Baseline versus Altruistic and Malicious and
Bargaining Fairness Seeking Neither Distinction Seeking Total**
Classification Based on Baseline and Matched Baseline versus Partnership and Bidding*
Altruistic and FairnessSeeking Dominant
16 5 8 29
Neither Dominant 8 18 12 38
Malicious and DistinctionSeeking Dominant
11 7 11 29
Total 35 30 31 96
Pearson chi2(4) = 11.2161 Pr = 0.024
*Coded as follows:Malicious and Distinction Seeking if coded as Malicious Using Partnership and Distinction Seeking using Partnership
Altruistic and Fairness Seeking if coded as Altruistic using Partnership and Fairness Seeking using BiddingNeither if any other coding combination using Partnership and Bidding
Not in table if benchmark not in (0,1)
**Coded as follows:
Altruistic and Fairness Seeking Dominant p > pBargaining Matched Baseline
Malicious and Distinction Seeking Dominant p < pBargaining Matched Baseline
Neither Dominant Otherwise

34
35
APPENDIX I
Instructions (Frame 1)
General Instructions
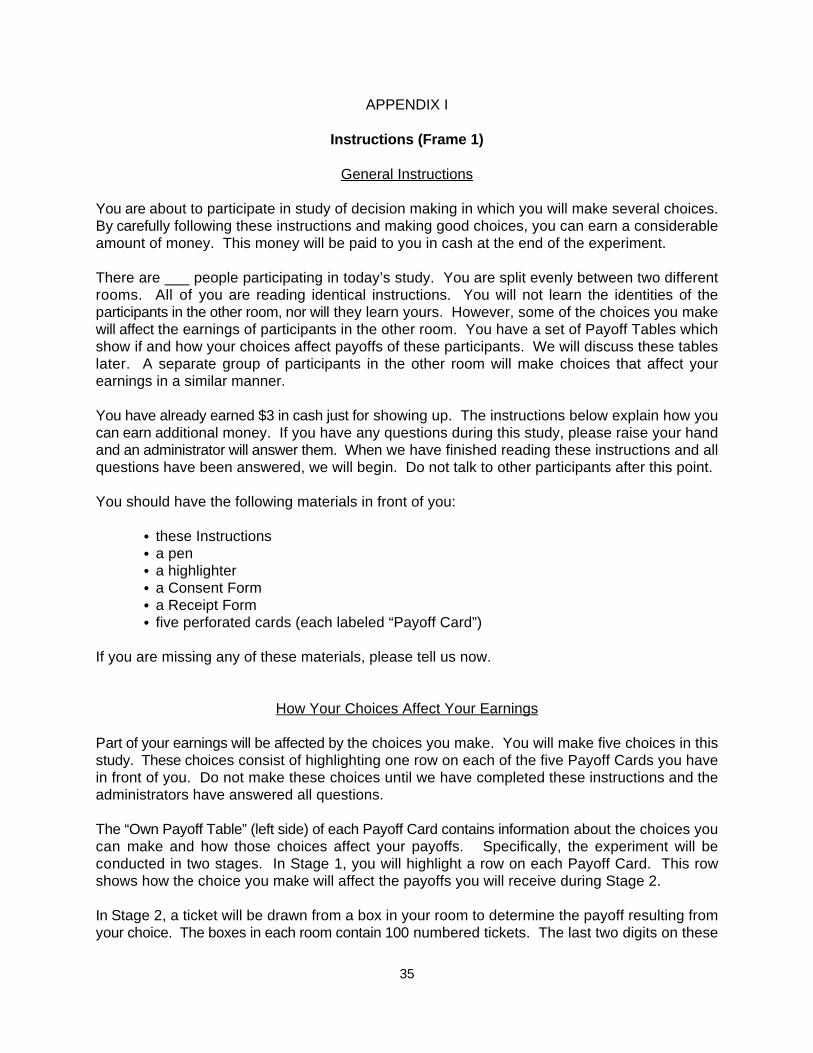
You are about to participate in study of decision making in which you will make several choices.By carefully following these instructions and making good choices, you can earn a considerableamount of money. This money will be paid to you in cash at the end of the experiment.
There are ___ people participating in today’s study. You are split evenly between two differentrooms. All of you are reading identical instructions. You will not learn the identities of theparticipants in the other room, nor will they learn yours. However, some of the choices you makewill affect the earnings of participants in the other room. You have a set of Payoff Tables whichshow if and how your choices affect payoffs of these participants. We will discuss these tableslater. A separate group of participants in the other room will make choices that affect yourearnings in a similar manner.
You have already earned $3 in cash just for showing up. The instructions below explain how youcan earn additional money. If you have any questions during this study, please raise your handand an administrator will answer them. When we have finished reading these instructions and allquestions have been answered, we will begin. Do not talk to other participants after this point.
You should have the following materials in front of you:
C these InstructionsC a penC a highlighterC a Consent FormC a Receipt FormC five perforated cards (each labeled “Payoff Card”)
If you are missing any of these materials, please tell us now.
How Your Choices Affect Your Earnings
Part of your earnings will be affected by the choices you make. You will make five choices in thisstudy. These choices consist of highlighting one row on each of the five Payoff Cards you havein front of you. Do not make these choices until we have completed these instructions and theadministrators have answered all questions.
The “Own Payoff Table” (left side) of each Payoff Card contains information about the choices youcan make and how those choices affect your payoffs. Specifically, the experiment will beconducted in two stages. In Stage 1, you will highlight a row on each Payoff Card. This rowshows how the choice you make will affect the payoffs you will receive during Stage 2.
In Stage 2, a ticket will be drawn from a box in your room to determine the payoff resulting fromyour choice. The boxes in each room contain 100 numbered tickets. The last two digits on these

36
tickets run from 00 to 99. For each choice, a participant in your room will be asked to draw a ticketfrom this box. The first ticket drawn will determine the payoff associated with Payoff Card 1. Ifthe ticket number is GREATER THAN OR EQUAL TO the Cutoff Choice specified in the row youhighlighted, you will receive the amount of cash shown in the column labeled “Ticket $ Cutoff” onyour Own Payoff Table. If the number on the ticket is LESS THAN the Cutoff you chose, you willreceive zero. Note that the row you choose in Stage 1 affects both the chances of receiving apayoff and the size of the payoff you receive. After the payoff for Card 1 has been determined,the ticket will be returned to the box and another ticket will be drawn to determine the payoff forCard 2. We will proceed in this fashion until the payoff for each card has been determined.
Each participant in the experiment will make exactly the same set of choices in Stage 1 as you do.However, their Payoff Tables may be in a different order. In Stage 2, five draws from the ticketbox in each participant's own room will determine payoffs for the five Payoff Cards her or she hasfilled out.
How Your Choices Affect Other Participants’ Payoffs
Your choices in Stage 1 may also affect the payoffs of five different participants in the other room.Every participant in this study has been assigned a participant number. You participant numberis shown at the top of each of your Payoff Cards. The participant number of the participant whosepayoff your choice may affect is also shown at the top of these cards. We call this participant your“Matched Participant” for that choice The identity of your Matched Participant changes for eachchoice you make.
The effect your choice has on this Matched Participant’s payoffs is shown in the MatchedParticipant Payoff Table on the right-hand side of the Payoff Card. The Matched ParticipantPayoff Table differs for each Payoff Card. The (single) row you choose on the Payoff Card willdetermine both how your choice affects your payoffs and how your choice affects your MatchedParticipant's payoffs.
For each choice, the ticket drawn from the box in your room will determine both payoffs. Theshading on the Payoff Card shows the association between your payoff and your MatchedParticipant's payoff. The shaded portions show payoffs received if the ticket number is greaterthan or equal to the cutoff you chose; the unshaded portions show payoffs received if the ticketnumber is less than the cutoff you chose.
At the end of the experiment, you will detach the Matched Participant Payoff Table from eachPayoff Card. The experimenter will give these tables to the appropriate Matched Participants inthe other room. Thus, your Matched Participant for each choice you make will learn how yourchoice affected his or her payoffs, the choice you made and the resulting payoffs he or sheearned.
How Others’ Choices Affect Your Payoffs
Just as your choices may affect the payoffs of participants in the other room, choices made by aseparate group of participants in the other room may affect your payoffs. You are the “MatchedParticipant” for five different participants in the other room. None of these participants are those
37
whose payoffs you affect.
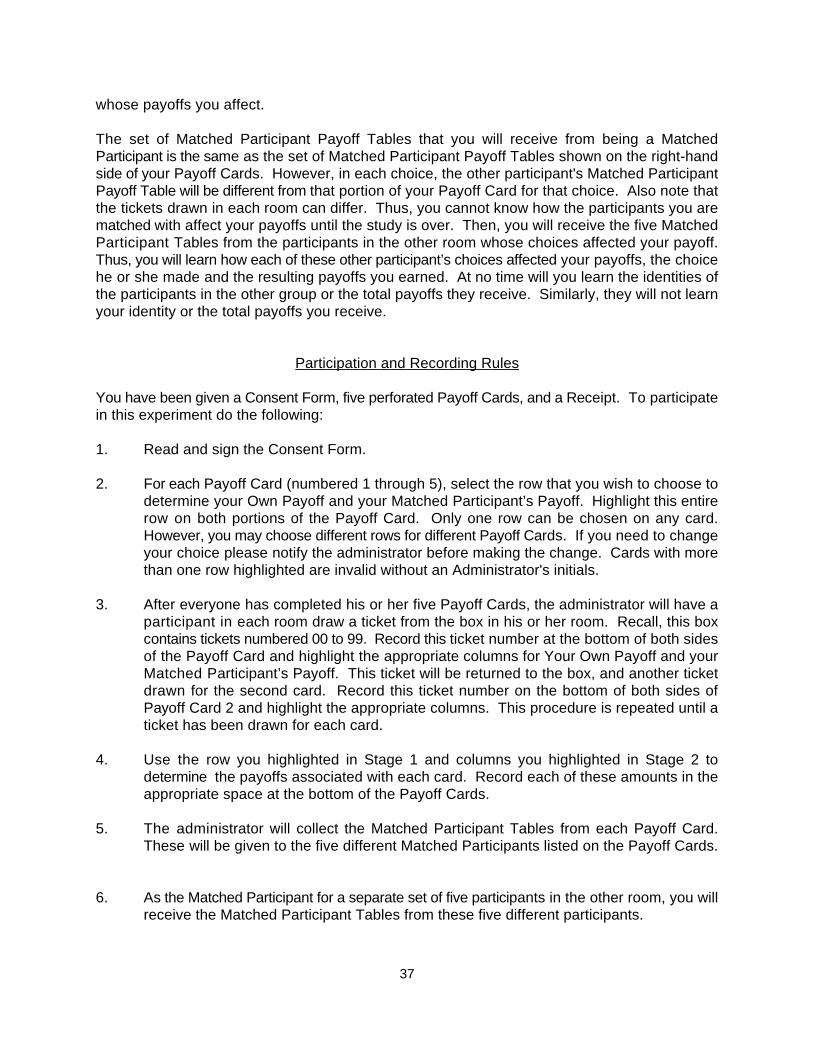
The set of Matched Participant Payoff Tables that you will receive from being a MatchedParticipant is the same as the set of Matched Participant Payoff Tables shown on the right-handside of your Payoff Cards. However, in each choice, the other participant's Matched ParticipantPayoff Table will be different from that portion of your Payoff Card for that choice. Also note thatthe tickets drawn in each room can differ. Thus, you cannot know how the participants you arematched with affect your payoffs until the study is over. Then, you will receive the five MatchedParticipant Tables from the participants in the other room whose choices affected your payoff.Thus, you will learn how each of these other participant’s choices affected your payoffs, the choicehe or she made and the resulting payoffs you earned. At no time will you learn the identities ofthe participants in the other group or the total payoffs they receive. Similarly, they will not learnyour identity or the total payoffs you receive.
Participation and Recording Rules
You have been given a Consent Form, five perforated Payoff Cards, and a Receipt. To participatein this experiment do the following:
1. Read and sign the Consent Form.
2. For each Payoff Card (numbered 1 through 5), select the row that you wish to choose todetermine your Own Payoff and your Matched Participant’s Payoff. Highlight this entirerow on both portions of the Payoff Card. Only one row can be chosen on any card.However, you may choose different rows for different Payoff Cards. If you need to changeyour choice please notify the administrator before making the change. Cards with morethan one row highlighted are invalid without an Administrator's initials.
3. After everyone has completed his or her five Payoff Cards, the administrator will have aparticipant in each room draw a ticket from the box in his or her room. Recall, this boxcontains tickets numbered 00 to 99. Record this ticket number at the bottom of both sidesof the Payoff Card and highlight the appropriate columns for Your Own Payoff and yourMatched Participant’s Payoff. This ticket will be returned to the box, and another ticketdrawn for the second card. Record this ticket number on the bottom of both sides ofPayoff Card 2 and highlight the appropriate columns. This procedure is repeated until aticket has been drawn for each card.
4. Use the row you highlighted in Stage 1 and columns you highlighted in Stage 2 todetermine the payoffs associated with each card. Record each of these amounts in theappropriate space at the bottom of the Payoff Cards.
5. The administrator will collect the Matched Participant Tables from each Payoff Card.These will be given to the five different Matched Participants listed on the Payoff Cards.
6. As the Matched Participant for a separate set of five participants in the other room, you willreceive the Matched Participant Tables from these five different participants.
38
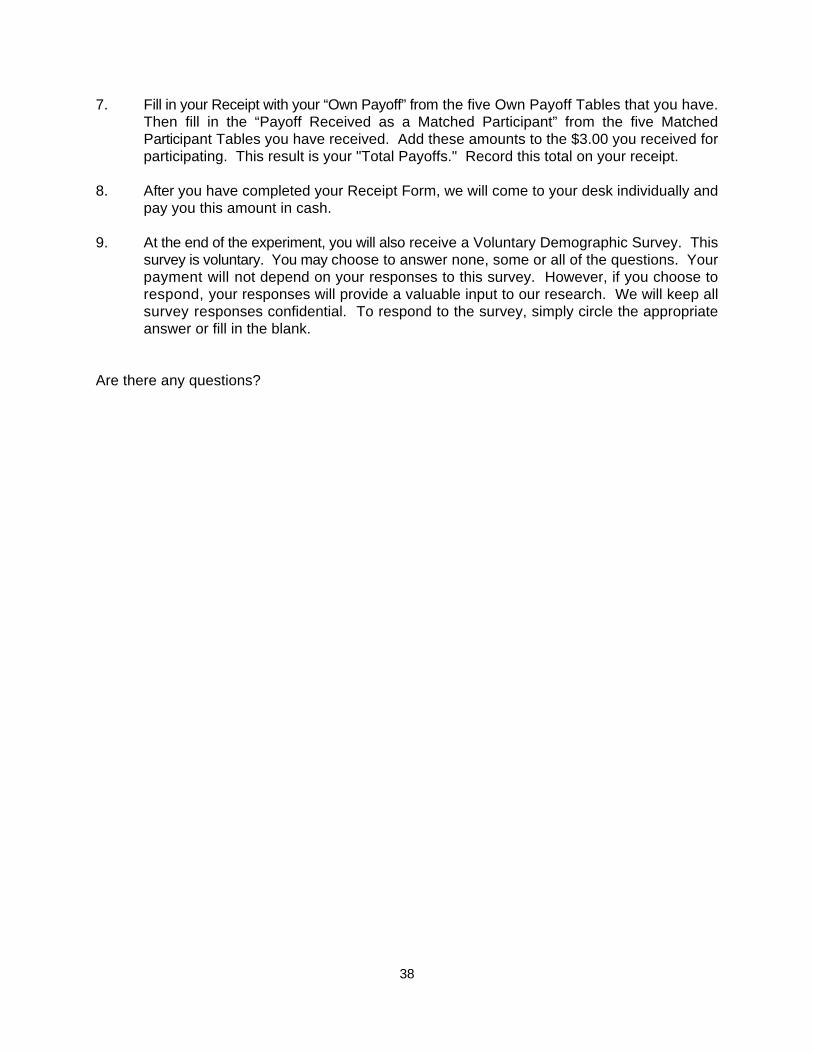
7. Fill in your Receipt with your “Own Payoff” from the five Own Payoff Tables that you have.Then fill in the “Payoff Received as a Matched Participant” from the five MatchedParticipant Tables you have received. Add these amounts to the $3.00 you received forparticipating. This result is your "Total Payoffs." Record this total on your receipt.
8. After you have completed your Receipt Form, we will come to your desk individually andpay you this amount in cash.
9. At the end of the experiment, you will also receive a Voluntary Demographic Survey. Thissurvey is voluntary. You may choose to answer none, some or all of the questions. Yourpayment will not depend on your responses to this survey. However, if you choose torespond, your responses will provide a valuable input to our research. We will keep allsurvey responses confidential. To respond to the survey, simply circle the appropriateanswer or fill in the blank.
Are there any questions?

39
Voluntary Demographic Survey
Participant Number
This survey is voluntary. You may choose to answer none, some or all of the questions. Yourpayment will not depend on your responses to this survey. However, if you choose to respond,your responses will provide a valuable input to our research. We will keep all survey responsesconfidential. To respond to the survey, simply circle the appropriate answer or fill in the blank.
We appreciate your taking the time to fill out this survey.
1. What is your gender? 1 Female 2 Male
2. What is your age?
3. What is your birth order? _______ out of ______ children
4. How may years have you lived in the Midwest? ________years
5. Do you have a lucky number? _________ If so, what is it? ______
Did it influence your choice in today’s study (if so, please describe how)?
6. What is your university status?
1 Freshman2 Sophomore3 Junior4 Senior5 MA/MBA candidate6 Law or Medical student7 Ph.D. candidate8 Other
7. What is your major?
1 Business2 Social Science3 Humanities4 Natural Science5 Mathematics or Engineering6 Other

40
8. Please indicate how strongly you agree or disagree with each of the following statementsabout yourself using the scale on the right, where 1 indicates strongly disagree strongly,2 indicates moderately disagree, 3 indicates slightly disagree, 4 indicates slightly agree,5 indicates moderately agree and 6 indicates strongly agree.
Disagree Agree
a. I am a very charitable person . . . . . . . . . . . . . . . . . . . . . . . . 1 2 3 4 5 6
b. I believe distinguishing oneself from peers is important . . . . 1 2 3 4 5 6
c. I strive for equitable solutions to problems . . . . . . . . . . . . . 1 2 3 4 5 6
d. I am very achievement oriented in reaching my own goals . 1 2 3 4 5 6
9. Have you ever been a member of any type of sports team? _______ (yes or no)
What kind of team(s)?
When?
10. Do you belong to any clubs or social organizations? _______ (yes or no)
Please describe:

u(x,y) '
u(x,y) % u1(x,y)(x&x) % u2(x,y)(y&y)
%1
2u11(x,y)(x&x)2 %
1
2u22(x,y)(y&y)2
% u12(x,y)(x&x)(y&y) % ...
E[u(x,y)] 'u(x,y) %
1
2u11(x,y)(Ex 2&x2) %
1
2u22(x,y)(Ey 2&y2)
% u12(x,y)(Exy&xy) % ...
u(x ),y )) '
u(x,y) % u1(x,y)(x )&x) % u2(x,y)(y )&y)
%1
2u11(x,y)(x )&x)2 %
1
2u22(x,y)(y )&y)2
% u12(x,y)(x )&x)(y )&y) % ...
E[u(x ),y ))] '
u(x,y) % u1(x,y)(x )&x) % u2(x,y)(y )&y)
%1
2u11(x,y)(Ex )2&2x )x%x 2) %
1
2u22(x,y)(Ey )2&2y )y%y 2)
% u12(x,y)(Ex )y )&y )x&x )y )%xy) % ...
E[u(x ),y ))]&E[u(x,y)] '
u1(x,y)(x )&x) % u2(x,y)(y )&y)
%1
2u11(x,y)(Ex )2&2x )x%2x 2&Ex 2)
%1
2u22(x,y)(Ey )2&2y )y%2y 2&Ey 2)
% u12(x,y)(Ex )y )&y )x&x )y )%2xy&Exy) % ...
41
APPENDIX II
Consider two gambles X and X' both in R . Denote sets of outcomes as (x,y) and (x',y')2
respectively. Determine the value of outcomes in the gamble X by approximation around its meanoutcome:
This implies that the expected utility of X is approximately:
Approximate the value of the outcomes of X' around the same point, giving:
This gives an expected utility of:
The difference is:
Now compare gambles X' close to X in the sens that the outcomes have different expected values,but the same second and higher moments. All terms but the first two drop out. The first termshows that a self interested person with prefer a higher expected value all else constant. Thesecond term shows that an altruistic person will prefer a higher expected value for the otherperson, all else constant. Similarly, a malicious person will prefer a lower expected value for theother person all else constant.

E[u(x ),y ))]&E[u(x,y)] '
1
2u11(x,y)((Ex )2&x )2)&(Ex 2&x 2))
%1
2u22(x,y)((Ey )2&y )2)&(Ey 2&y 2))
% u12(x,y)(Ex )y )&Exy)
42
Next, compare gambles X' close to X in the sense that outcomes have the same expected values,but vary only in the second moments. Using the equal means, the difference becomes:
The first term shows that, a risk averse person (u <0) will prefer lower variance gambles, all else11
constant. Similarly, a risk seeking person (u >0) will prefer higher variance gambles, all else11
constant. The second term shows, that a person risk averse in the other's payoffs (u <0) will22
prefer lower variance gambles for the other person, all else constant. Similarly, a person riskseeking in the other's payoffs (u >0) will prefer higher variance gambles for the other person, all22
else constant. The third term shows that a fairness seeking person (u >0) will prefer a higher first12
cross moment, all else constant. Similarly, a distinction seeking person (u <0) will prefer a lower12
first cross moment, all else constant.