Embed Size (px)
Citation preview
FRBNY Economic Policy Review / October 2015 19
• Economists’ understanding of the finances of U.S. consumers is based heavily on survey data, and on the Survey of Consumer Finances (SCF) in particular. However, recent research calls into question survey respondents' willingness and ability to report their debts accurately.
• This study compares U.S. household debt as reported by borrowers to the SCF with debt reported by lenders to Equifax using the FRBNY Consumer Credit Panel (CCP). Debt levels, distributions, and trends are compared by loan type, both in aggregate form and for age, region, and household-size subsamples.
• Our most striking finding is that, overall and in most disaggregated debt categories, debt levels reported in the SCF and CCP are quite similar. Even bankruptcy measures correspond well.
• The exceptions lie in the unsecured debts. Under our most inclusive assumptions, SCF-implied aggregate credit card debt is 37 percent lower than that implied by the CCP, and SCF-implied aggregate student debt is 25 percent lower.
Meta Brown is a senior economist, Andrew Haughwout a senior vice president, Donghoon Lee a research officer, and Wilbert van der Klaauw a senior vice president at the Federal Reserve Bank of New York.
[email protected]; [email protected]; [email protected]; [email protected]
The authors thank Sonia Gilbukh, John Grigsby, Maricar Mabutas, and David Yun for excellent research assistance. They are grateful to Neil Bhutta, Brian Bucks, Joanne Hsu, Dean Karlan, Arthur Kennickell, Annamaria Lusardi, Kevin Moore, Karen Pence, Robert Pollak, John Sabelhaus, John Karl Scholz, Hui Shan, Basit Zafar, Eastern and Midwest Economic Association meeting participants, seminar participants at the Federal Reserve Bank of New York and the Board of Governors of the Federal Reserve System, and particularly the editor and referee for helpful comments. The views expressed in this article are those of the authors and do not necessarily reflect the position of the Federal Reserve Bank of New York or the Federal Reserve System.
Meta Brown, Andrew Haughwout, Donghoon Lee, and Wilbert van der Klaauw
Do We Know What We Owe? Consumer Debt as Reported by Borrowers and Lenders
1. Introduction
The state of scientific knowledge regarding U.S. consumers’ affluence and relationship to financial markets is based in many ways on survey data, and, in particular, on the Survey of Consumer Finances (SCF) published by the Board of Governors of the Federal Reserve System. For example, an extensive and influential line of research establishes the prevalence and importance of consumer liquidity constraints in the United States using SCF debt and related data.1 Much of our understanding of U.S. wealth inequality over recent decades derives from analysis of SCF net worth figures.2 Recent papers use SCF debt data to address a wide variety of topics relating to consumer balance sheets, such as the use of debt by low-income, unemployed, and bankrupt households.3
1 This research includes Fissel and Jappelli (1990), Jappelli (1990), Cox and Jappelli (1993), Jappelli, Pischke, and Souleles (1998), Johnson and Li (2010), and others.2 See, for example, Wolff (1992), Davies and Shorrocks (1999), Keister (2000), Gokhale et al. (2001), Castañeda, Díaz-Giménez, and Ríos-Rull (2003), De Nardi (2004), and Cagetti and De Nardi (2008). Note that net worth calculations using the SCF rely on households’ debt reports.3 See Cagetti and De Nardi (2006), Bucks and Pence (2008), Iacoviello (2008), Sullivan (2008), Scholz and Seshadri (2009), Han and Li (2011), and Kiyotaki, Michaelides, and Nokolov (2011), among others.
20 Do We Know What We Owe?
However, other recent findings bring into question survey respondents’ propensity and ability to report debts accurately. Lusardi and Tufano (2009) pose simple questions to U.S. survey respondents on the functioning of debt contracts. They report discouraging findings: “Debt literacy is low: only about one-third of the population seems to comprehend interest compounding or the workings of credit cards.” Karlan and Zinman (2008) find that, among first-time borrowers from a leading South African “cash loan” firm, 50 percent fail to report their high-interest loans in a subsequent survey. Most pertinent to the question at hand is Zinman (2009), who compares the aggregate credit card debt levels implied by the SCF for 1989-2004 to aggregate credit card debt levels from the lender-reported Consumer Credit-G.19 data provided by the Federal Reserve Board of Governors. Zinman finds an undercounting of credit card debt in the SCF relative to the G.19 data of roughly 50 percent, and a divergence of the survey and the G.19 measures over the period.
The quality of survey-based debt data is of clear importance for researchers. An understanding of the debt behaviors on which households can and do report accurately, and those where they may not, is of use in evaluating the existing body of survey-based inference regarding household debt practices, and also in the design of future research. Identifying which questions are best answered using survey-based debt measures depends heavily on households’ reporting tendencies, including both their level of accuracy and the informativeness of any common inaccuracies.4
Further, information on the accuracy of household debt reporting may be relevant to understanding the nature and effectiveness of household financial decision-making. Households with limited awareness of their debt positions may both misreport debts in surveys and make less informed financial choices as a result. The possibility of intentional misreporting implies that households’ exact debt awareness cannot be inferred from evidence on the match between survey and administrative debt data. However, debt awareness is arguably a necessary precondition to closely matched survey and administrative debts.5
This article examines the correspondence between borrower- and lender-reported debts in recent years, at a relatively disaggregated level, with the objective of
4 For example, Bucks and Pence (2008) show that informative patterns exist in the “don’t know” responses to questions on mortgage characteristics.5 Here we assume that very similar debt findings are produced only in the case of accurate reporting on both sides. A remaining possibility is that borrowers and lenders make similar reporting errors. Given the very different nature of the reporting activities and objectives on the two sides, we judge this a low probability event and set aside the issue for the remainder of the article.
shedding light on both the quality and potential uses of survey-based debt data and the nature of household financial decision-making. We employ SCF data from 2001, 2004, 2007, and 2010 on household debts for the borrowers’ picture of consumer obligations. For the lenders’ side, we turn to the FRBNY Consumer Credit Panel/Equifax (CCP). The CCP is a panel of individual credit data drawn from Equifax, one of the three national credit reporting agencies. These data reported by lenders and servicers are classified as “administrative data” in much of the literature. The frequency and duration of the CCP data are sufficient to match the timing and, arguably, the representativeness of the SCF data for 2001, 2004, 2007, and 2010.
We compare consumer debt aggregates as well as moments—such as the mean and variance—of the household distributions of total debt, mortgage and home equity line of credit (HELOC) debt, vehicle loans, credit card debt, student loans, and other debts in the two sources. The latter comparisons are performed by year, household head age, household size, and region of the country. Differences between the samples are tested using standard methods; the large size of the administrative CCP data set permits a high degree of precision in such tests. We also compute household delinquency and bankruptcy rates in the two samples for the four years, noting that two of those years precede and two follow the implementation of a major bankruptcy law reform in 2005.
Our most striking finding is that, overall and in the majority of disaggregated debt categories and borrower characteristics, debt levels reported in the SCF and CCP are quite similar. Mortgages, HELOCs, and vehicle loans attain similar levels and follow similar age patterns in the SCF and CCP, for example. The growth of consumer debts over time and the accelerated growth rates of housing debt are similarly evident in the two samples. Overall, the weight of the evidence indicates a high level of accuracy in the correspondence between debts in the two sources.
A second central finding, echoing Zinman (2009), is that credit card debt appears to be up to 40 percent lower in the SCF than in the CCP. Two possible explanations for this raw difference are that (1) unlike the CCP households, SCF households may not have any member with a credit report, and (2) SCF households may not report business uses of personal credit cards that nevertheless appear on households’ combined credit reports. We make generous allowances for these explanations, and find that a 37-percentage-point gap in aggregate credit card debt remains.
Further, the aggregate student debt balances implied by the SCF are roughly 25 percent lower than those implied by the CCP, which, in turn, are similar to aggregates drawn
FRBNY Economic Policy Review / October 2015 21
from other student debt sources. Hence we see that, by far, the largest differences between borrowers’ debt reports in the SCF and lenders’ debt reports in the CCP lie in the unsecured debts. We discuss sampling differences that may contribute to the measured student loan reporting gap. Unfortunately, information available in the two sources provides less opportunity to reconcile the difference in the case of student loans than in the case of credit card debt.
Nevertheless, bankruptcy appears to be reported at similar frequencies in the SCF and the CCP (though differences in available measures of bankruptcy in the two data sets impose qualifications on this claim). We find that, among one- and two-adult households, the CCP’s two-year household bankruptcy rates in 2001, 2004, 2007, and 2010 fall comfortably between the SCF’s one- and three-year bankruptcy rates, and that, if anything, one- and three-year bankruptcy rates in the SCF appear to be a bit high relative to CCP two-year rates. All measures reflect the expected drop in bankruptcy following the 2005 reform.
Finally, the match between SCF and CCP debt levels on certain individual debt measures is significantly closer for households with one adult than for households with two or more adults. In particular, survey measures appear to fall further below administrative measures for larger households, especially in the case of auto and credit card debt. This suggests that survey respondents are more able to report their own debt levels than those of other household members. This insight might help to inform both the design of surveys eliciting consumer balance sheet information and the research applications of such survey data. Further, it may tell us something about the nature of household members’ interactions over financial matters.
2. Previous Studies
The SCF wealth data have been vetted in a number of studies produced both by the SCF survey staff and by others. The wealth data have been shown to be accurate, based on comparison with several administrative and survey sources.6 The debt data of the SCF have received somewhat less attention.
Bucks and Pence (2008) ask whether SCF respondents accurately report the terms of their mortgages (and their house prices). In distribution-level comparisons between
6 See, for example, Avery, Elliehausen, and Kennickell (1988), Johnson and Moore (2005), Antoniewicz (2000), Bucks and Pence (2008), and Sierminska, Michaud, and Rohwedder (2008).
the 2001 SCF and lender-reported data, they find that “most homeowners appear to report their . . . mortgage terms reasonably accurately.” Borrowers with adjustable-rate mortgages, however, may not be as well informed regarding potential interest rate changes.
Zinman (2009), as mentioned, compares credit card debt figures in the SCF to the Federal Reserve Board’s G.19 statistical releases on consumer debt. Zinman was the first study (of which we are aware) to demonstrate in print the gap between SCF and administrative data credit card debt findings.7 His lower bound estimate of the undercounting of credit card debt in the SCF is 50 percent. Further, he reports an increasing gap between credit card debt estimates from the SCF and the G.19 between 1989 and 2004, and suggests that such a trend might indicate individual heterogeneity in debt reporting that would undermine standard applications of survey-based debt data. In this study, we will generate further news on the trend in credit card debt reporting and evaluate the level of heterogeneity, by broad observable characteristics, in the extent of debt counting inaccuracies.
Johnson and Li (2009) vet the Consumer Expenditure Survey (CE) debt payments and limited debt balance data against the debt payment and balance measures in the SCF, taking the latter to be accurate. They find a match of within 5 percent on vehicle and credit card debt for the 1989-2004 waves of the SCF and comparable waves of the CE. However, they find that mortgage reports in the CE are substantially below those in the SCF, which, given the strong agreement between the SCF results and lender data for mortgages demonstrated by Bucks and Pence (2008), suggests an undercounting of mortgages in the CE.
Antoniewicz (2000) compares consumer assets and liabilities in the 1989-98 SCF fieldings to the Federal Reserve Board’s flow of funds statistical release. She finds similar aggregate liabilities, consumer credit, and home mortgage debt in the two sources for 1989 and 1992, and a divergence in measured consumer debt in subsequent years. By 1995, the flow of funds estimate of total consumer credit is more than $200 billion higher than the SCF estimate. This divergence aligns with the time patterns observed by Zinman in the SCF and lender-reported debt data.
By and large, the methods used by these studies involve comparing one data source’s estimates of aggregate debt or moments of debt distributions with those of another, either informally or using simple test statistics. Our approach is similar. But no other study of which we are aware has access to household-level matches of SCF data to other relevant debt
7 Informal discussion indicates that SCF staff and users were aware of some part of this difference before the publication of Zinman (2009).
22 Do We Know What We Owe?
data for the purpose of comparison. To our knowledge, this article represents the most recent, most granular, and broadest validation of SCF debt data available. All of this derives from the richness of the administrative data available to us for comparison, as described below.
3. Data and Comparability
3.1 Survey of Consumer Finances
The Federal Reserve Board’s Survey of Consumer Finances is a triennial survey of U.S. households, focusing primarily on household assets and liabilities. The survey was first fielded in 1983, and the present study covers the 2001, 2004, 2007, and 2010 surveys. The sample size of each survey was roughly constant through 2007, at about 4,500 households;8 in 2010, it rose to 6,492 households. The survey includes both a geographically based representative sample of households and an over-sample of wealthy households. All results for the SCF reported here are weighted to be representative of the population of U.S. households, using the Kennickell-Woodburn consistent weights provided by the survey.9 Further, we rely on the survey’s multiple imputation methods where relevant data are missing.10 Bucks et al. (2009) provide a detailed description of the 2001, 2004, and 2007 data. Bricker et al. (2012) detail the 2007 and 2010 data.
It may aid the reader’s interpretation of observed similarities and differences between the survey and administrative debt data to include a sketch of the survey process that produces the consumer-side debt measures. The SCF measures are the product of a richly designed and meticulously managed interview of relevant household members by a well-trained interviewer. Interviews may occur in person or via phone. In 2007, an unweighted 55.3 percent of interviews were conducted in person and the balance over the phone. In 2010, 70.4 percent of the interviews were conducted in person and the balance by phone. Of the 6,492 interviews in 2010, 185 were conducted in Spanish.
Interviewers are instructed to encourage respondents to rely on documentation to obtain the details necessary to answer the highly specific battery of financial questions
8 In 2001, the survey included 4,442 households, in 2004, 4,522 households, and in 2007, 4,422 households.9 We use the revised Kennickell-Woodburn consistent weights for the more recent data.10 Kennickell (1991, 1998) describes the imputation methods used in the SCF.
being fielded. They are also instructed to encourage the use of interview cards for keeping notes relevant to the sequence of questions. Specifically, interviewers are required to read each of the following statements to respondents at the start of the interview: “Feel free to consult any knowledgeable person or use any records and notes at any time during this interview. And please ask questions when anything is not clear;” and, “As we go through the interview, I will ask you to write a few things on this card to help keep us on track.” Further, the SCF provides variables indicating whether respondents referenced documentation during the course of the interview, and if so, what type, along with how credible the interviewer found the responses as a whole.
3.2 FRBNY Consumer Credit Panel
The FRBNY Consumer Credit Panel is based on data supplied to the Federal Reserve Bank of New York by Equifax, one of the three national credit reporting agencies. The CCP comprises a 5 percent random sample of U.S. individuals with credit files and all of the household members of those 5 percent.11 In all, the data set includes files on more than 15 percent of the population, or approximately 40 million individuals. We observe information from the credit reports for those individuals each quarter for the past sixteen years, and the data continue to be updated every quarter.
The sampling procedure generates a random sample of U.S. credit report holders, and ensures that the panel is dynamically updated in each quarter to reflect new entrants into credit markets. In addition, the data provider matches each primary individual’s mailing address to all records in the data in order to capture information about other members of the primary individual’s household. These individuals are also added to the sample. This procedure enables us to track individuals and households consistently over time, thus allowing us to study richer dynamics of consumer debt and related policy issues at both the individual and household levels.
The credit report data include residential location at the census block level and the individual’s year of birth. The data also contain detailed information on each individual home-secured loan, including origination date and balance, current balance, scheduled payment, and current repayment status. In addition to information on debts secured by
11 See Avery et al. (2003) for a detailed discussion of the contents, sources, and quality of credit report data. See Lee and van der Klaauw (2010) for a discussion of contents and sampling design of the FRBNY Consumer Credit Panel.
FRBNY Economic Policy Review / October 2015 23
residential real estate, the data set includes information on individuals’ and households’ other loans, such as credit cards and auto loans. The data include the following:
• total number of each type of account (for example, the total number of bank-issued credit cards),
• credit limit on each type of account (for example, the combined credit limit on all credit cards),12 and
• total balance on each type of account in each status (for example, the total auto loan balance that is current, thirty days delinquent, etc.).
More general information on the credit report includes the following:
• indicators for whether the individual has a foreclosure or bankruptcy, both within twenty-four months and ever, on the report,
• the number of collection accounts and the amount of collection, and
• Equifax’s credit score, analogous to the well-known FICO score.
In the present study, we use the primary sample members and associated household members to establish a representative sample of all U.S. households in which at least one adult has a credit record. Owing to computational demands, the findings reported in this article are based on a random subsample of CCP households: we retain a randomly determined 10 percent of CCP households.13 Thus, for example, the estimation sample for 2007 contains 1,090,880 households.
All figures reported below from the two data sources are denominated in 2010 U.S. dollars.
3.3 Comparability
An immediate difficulty arises from the fact that, while the (weighted) SCF is representative of all U.S. households, the CCP is a representative sample of U.S. households in
12 This field is known as the “high credit” amount in the credit report data. It refers to either the credit limit (for credit cards, HELOCs, and other revolving debt) or the highest balance (for mortgages, vehicle loans, and other installment debt). Credit limits on some revolving accounts are unreported, in which case the high credit variable reflects the historical high credit level for the account. Avery et al. (2003) and Hunt (2002) point out that the reporting of credit limits in credit reports has improved considerably in recent years.13 Though sampling is done at the individual level, which would generate overrepresentation of larger households, we reweight the sample based on probability of inclusion so as to be representative at the household level.
which at least one adult has a credit record. According to Jacob and Schneider (2006), 10 percent of U.S. adults had no credit record in 2005.
We observe that 75 percent of SCF households claim debts that would generally appear on a credit report, and 84 percent of CCP households’ collective reports include positive debt levels. Begin by assuming that these two groups represent the same population, namely U.S. households with any conventional debts. Further note that the CCP data represent two populations, those with conventional debts and credit reports (84 percent) and those without conventional debts but with credit reports (16 percent). The SCF represents the former population through the 75 percent of SCF households with conventional debts and credit reports. Define x as the percentage of SCF households without conventional debts but with credit reports. The SCF also represents those with neither conventional debts nor credit reports, who constitute 25 – x percent of the sample.
From the assumption that both the CCP and the SCF contain representative shares of both households with conventional debts and credit reports and households without conventional debts but with credit reports, we infer that the ratio of the sizes of the conventional debt and credit report and the no conventional debt and credit report populations must be the same in the two samples. This inference allows us to solve the relationship 16 __ 84 = x __ 75 for x, which is the share of SCF households with credit reports but no standard debts. If 84 percent of CCP households have reports and debt and 16 percent have reports and no debt, and 75 percent of SCF households have reports and debt, then it must be the case that 14.3 percent of SCF households have reports and no debt. The residual, 10.6 percent of SCF households, must then have no credit reports.14 Note that this figure is near the rate calculated by Jacob and Schneider.15
One difficulty remains: Whether SCF respondents report all of their debt, and hence all of their credit-report-generating debt, is precisely the question at hand. To establish methods based on an inference that assumes SCF reporting to be accurate threatens the credibility of our findings. Let us consider the consequences of assuming reporting accuracy in the above calculations in the event that SCF households in fact underreport their debt. Assuming some SCF households
14 Figures are rounded for ease of discussion, and hence contain some rounding error.15 Assuming households do not sort perfectly on the presence or absence of credit reports, we would expect the household-level rate of missing credit reports to be smaller. For the 2007 waves of the two data sets, which are considerably closer to Jacob and Schneider’s period of observation, we find a missing report rate of 8.33 percent, a figure in line with our expectations under imperfect sorting.
24 Do We Know What We Owe?
that have credit-report-generating debt report having none, 75 percent is an underestimate of the proportion of the sample with credit-report-generating debt. Suppose that the rate of underreporting in percentage terms is r > 0. Then 75 + r percent actually have credit-report-generating debt. We seek the percentage of SCF households with no credit-report-generating debt but with credit reports, x, that solves the expression 16 __ 84 = x ____ 75 + r . At r = 0, x = 14.3. From there, x increases with r. Hence, the share of SCF households with no conventional debt but with credit reports increases from 14.3 percent when SCF respondents underreport debt, and the residual share with no conventional debt and no credit reports has an upper bound of 10.6 percent.
Alternatively, one could attempt to infer the proportion of SCF households with no debt and no credit reports based on available SCF measures. For example, if we assume that only the 2010 wave SCF households that have no conventional debts, do not include property owners, and have no household member who reports holding a credit card, including store cards, have no credit reports, then we arrive at a no-credit-report rate below 10.6 percent. Since the validity criteria for this type of approach are unclear, we again focus on the 10.6 percent figure as an upper bound.
In the analysis that follows, we estimate aggregate debt levels, as well as debt holding rates and conditional median and mean balances, for total debt and various debt categories using the SCF and CCP data.16 The distinction between SCF non-debtors with and without credit reports is clearly irrelevant to our comparison of aggregate debt levels and of conditional mean and median debt levels; each category of non-debtors contributes zero to the aggregate and is omitted from the conditional calculations.
However, the proportion of SCF non-debtor households not represented in the CCP is crucial in the comparison of the rates at which households hold various types of debt. In what follows, we compare SCF and CCP debt rates in two ways: with no adjustment for households without credit reports, and after removing 10.6 percentage points’ worth of non-debtor households from the SCF calculations. Should underreporting of debt render the 10.6 percent figure an overestimate of the true rate at which SCF households have no credit reports, this method would cause the rate at which SCF households hold debt to be inflated relative to the rate at which CCP households hold debt.
16 Note that by “conditional mean,” we mean the average debt balance among those who hold positive balances in the debt category under consideration. “Conditional median,” similarly, is the median debt balance among those who hold positive balances in the debt category under consideration.
In the interest of establishing comparable dates of observation, we select CCP data for the third quarter of 2001, 2004, 2007, and 2010. The fielding dates of the SCF are roughly May to December of each survey year; our CCP data are drawn at the midpoint of this range of months, which we hope maximizes comparability. An alternative approach would be to average CCP figures for the final three quarters of each relevant year. The drawback to this method is that it would require constructing a short panel on each household, and the composition of those households could change from quarter to quarter. To avoid this issue, we have adopted a single-quarter approach, though we believe that each method has appealing features.
An additional comparability issue is who, exactly, constitutes the household. While the CCP includes all adults with credit reports living at the primary sample member’s address (up to an apartment number), most SCF debt questions concern the debt holdings of the “primary economic unit” (PEU) of the household. A PEU consists of the primary earner, the earner’s partner, and any agents dependent on this unit. Children or elderly parents dependent on a primary earning couple, for example, would be PEU members. However, households also at times contain non-PEU members, such as roommates and boarders.
The debts of these non-PEU members would appear in the CCP but not the SCF. We have limited opportunity to infer non-PEU members’ debts by category and add them into the household debt calculations, given the data collected on non-PEU members. However, it is possible to determine the overall level of debt held by non-PEU members, and hence to infer the likelihood that such debt changes could influence our conclusions.17 We return to this issue later in the article.
Other comparability issues related to specific debt categories and associated survey questions or credit reporting are addressed as they arise in the course of the analysis below. In general, we endeavor to make all appropriate adjustments where possible to ensure that the household debts in question are comparable across the two data sources. Where this is not possible, we attempt to understand the likely direction of the resulting bias in our comparison, and its likely effect on our conclusions.
17 Note that other observable characteristics of non-PEU members tend to be associated with low debt levels.
FRBNY Economic Policy Review / October 2015 25
4. Findings
4.1 The Match between SCF- and CCP-Derived Estimates of Aggregate Debt and Household-Level Debt Distributions Is Close
Though the data collection methods and respondent incentives in the SCF and CCP differ greatly, the primary insight that arises from their comparison is that the two sources generate strikingly similar debt patterns.
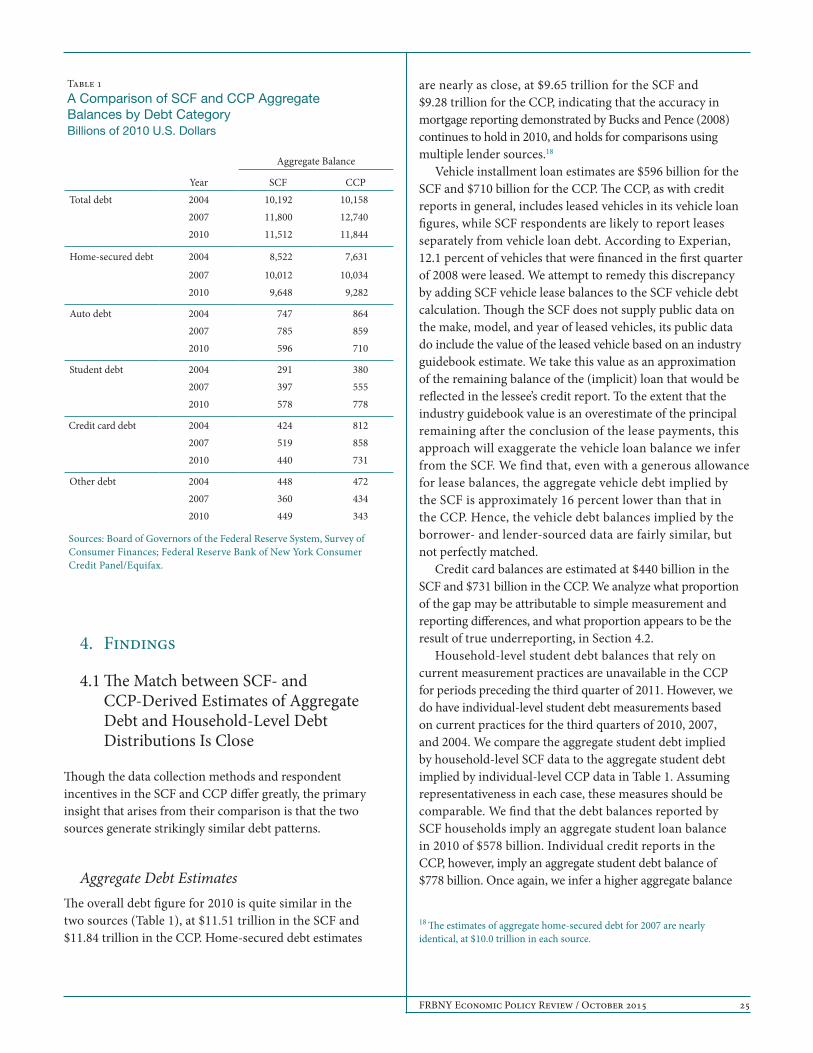
Aggregate Debt EstimatesThe overall debt figure for 2010 is quite similar in the two sources (Table 1), at $11.51 trillion in the SCF and $11.84 trillion in the CCP. Home-secured debt estimates
are nearly as close, at $9.65 trillion for the SCF and $9.28 trillion for the CCP, indicating that the accuracy in mortgage reporting demonstrated by Bucks and Pence (2008) continues to hold in 2010, and holds for comparisons using multiple lender sources.18
Vehicle installment loan estimates are $596 billion for the SCF and $710 billion for the CCP. The CCP, as with credit reports in general, includes leased vehicles in its vehicle loan figures, while SCF respondents are likely to report leases separately from vehicle loan debt. According to Experian, 12.1 percent of vehicles that were financed in the first quarter of 2008 were leased. We attempt to remedy this discrepancy by adding SCF vehicle lease balances to the SCF vehicle debt calculation. Though the SCF does not supply public data on the make, model, and year of leased vehicles, its public data do include the value of the leased vehicle based on an industry guidebook estimate. We take this value as an approximation of the remaining balance of the (implicit) loan that would be reflected in the lessee’s credit report. To the extent that the industry guidebook value is an overestimate of the principal remaining after the conclusion of the lease payments, this approach will exaggerate the vehicle loan balance we infer from the SCF. We find that, even with a generous allowance for lease balances, the aggregate vehicle debt implied by the SCF is approximately 16 percent lower than that in the CCP. Hence, the vehicle debt balances implied by the borrower- and lender-sourced data are fairly similar, but not perfectly matched.
Credit card balances are estimated at $440 billion in the SCF and $731 billion in the CCP. We analyze what proportion of the gap may be attributable to simple measurement and reporting differences, and what proportion appears to be the result of true underreporting, in Section 4.2.
Household-level student debt balances that rely on current measurement practices are unavailable in the CCP for periods preceding the third quarter of 2011. However, we do have individual-level student debt measurements based on current practices for the third quarters of 2010, 2007, and 2004. We compare the aggregate student debt implied by household-level SCF data to the aggregate student debt implied by individual-level CCP data in Table 1. Assuming representativeness in each case, these measures should be comparable. We find that the debt balances reported by SCF households imply an aggregate student loan balance in 2010 of $578 billion. Individual credit reports in the CCP, however, imply an aggregate student debt balance of $778 billion. Once again, we infer a higher aggregate balance
18 The estimates of aggregate home-secured debt for 2007 are nearly identical, at $10.0 trillion in each source.
Table 1A Comparison of SCF and CCP Aggregate Balances by Debt Category Billions of 2010 U.S. Dollars
Aggregate Balance
Year SCF CCPTotal debt 2004 10,192 10,158
2007 11,800 12,7402010 11,512 11,844
Home-secured debt 2004 8,522 7,631
2007 10,012 10,0342010 9,648 9,282
Auto debt 2004 747 8642007 785 8592010 596 710
Student debt 2004 291 3802007 397 5552010 578 778
Credit card debt 2004 424 8122007 519 8582010 440 731
Other debt 2004 448 4722007 360 4342010 449 343
Sources: Board of Governors of the Federal Reserve System, Survey of Consumer Finances; Federal Reserve Bank of New York Consumer Credit Panel/Equifax.
26 Do We Know What We Owe?
using lender-side data than we do using borrower-side data; in this case, borrowers appear to report 25.7 percent less debt than lenders do.
Other available measures of aggregate student debt for 2010 are limited but tend to be similar to the CCP figure. One estimate published in a Wall Street Journal economics blog in the summer of 2010 put aggregate student debt at roughly $830 billion.19 The Consumer Financial Protection Bureau estimates that aggregate student debt crossed the trillion-dollar threshold in late 2011 (Chopra 2012). The portfolio overseen by the Office of Federal Student Aid (FSA) at the start of 2011 was $722 billion (U.S. Department of Education 2011).
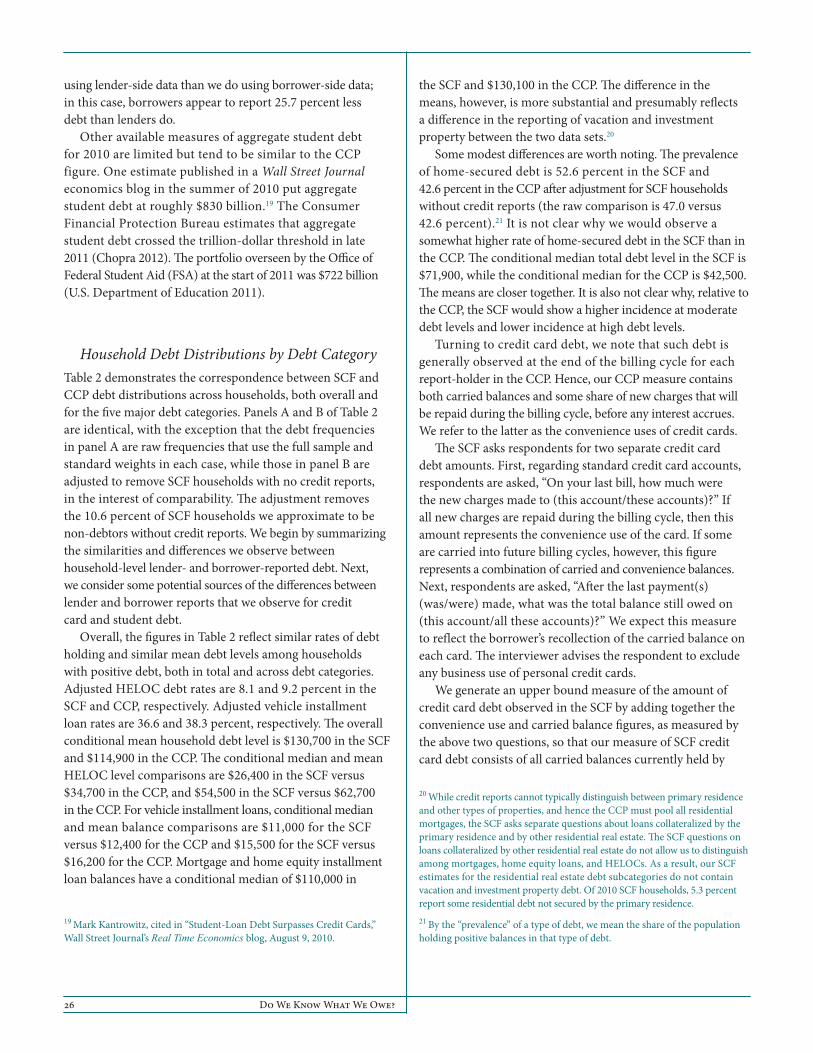
Household Debt Distributions by Debt CategoryTable 2 demonstrates the correspondence between SCF and CCP debt distributions across households, both overall and for the five major debt categories. Panels A and B of Table 2 are identical, with the exception that the debt frequencies in panel A are raw frequencies that use the full sample and standard weights in each case, while those in panel B are adjusted to remove SCF households with no credit reports, in the interest of comparability. The adjustment removes the 10.6 percent of SCF households we approximate to be non-debtors without credit reports. We begin by summarizing the similarities and differences we observe between household-level lender- and borrower-reported debt. Next, we consider some potential sources of the differences between lender and borrower reports that we observe for credit card and student debt.
Overall, the figures in Table 2 reflect similar rates of debt holding and similar mean debt levels among households with positive debt, both in total and across debt categories. Adjusted HELOC debt rates are 8.1 and 9.2 percent in the SCF and CCP, respectively. Adjusted vehicle installment loan rates are 36.6 and 38.3 percent, respectively. The overall conditional mean household debt level is $130,700 in the SCF and $114,900 in the CCP. The conditional median and mean HELOC level comparisons are $26,400 in the SCF versus $34,700 in the CCP, and $54,500 in the SCF versus $62,700 in the CCP. For vehicle installment loans, conditional median and mean balance comparisons are $11,000 for the SCF versus $12,400 for the CCP and $15,500 for the SCF versus $16,200 for the CCP. Mortgage and home equity installment loan balances have a conditional median of $110,000 in
19 Mark Kantrowitz, cited in “Student-Loan Debt Surpasses Credit Cards,” Wall Street Journal’s Real Time Economics blog, August 9, 2010.
the SCF and $130,100 in the CCP. The difference in the means, however, is more substantial and presumably reflects a difference in the reporting of vacation and investment property between the two data sets.20
Some modest differences are worth noting. The prevalence of home-secured debt is 52.6 percent in the SCF and 42.6 percent in the CCP after adjustment for SCF households without credit reports (the raw comparison is 47.0 versus 42.6 percent).21 It is not clear why we would observe a somewhat higher rate of home-secured debt in the SCF than in the CCP. The conditional median total debt level in the SCF is $71,900, while the conditional median for the CCP is $42,500. The means are closer together. It is also not clear why, relative to the CCP, the SCF would show a higher incidence at moderate debt levels and lower incidence at high debt levels.
Turning to credit card debt, we note that such debt is generally observed at the end of the billing cycle for each report-holder in the CCP. Hence, our CCP measure contains both carried balances and some share of new charges that will be repaid during the billing cycle, before any interest accrues. We refer to the latter as the convenience uses of credit cards.
The SCF asks respondents for two separate credit card debt amounts. First, regarding standard credit card accounts, respondents are asked, “On your last bill, how much were the new charges made to (this account/these accounts)?” If all new charges are repaid during the billing cycle, then this amount represents the convenience use of the card. If some are carried into future billing cycles, however, this figure represents a combination of carried and convenience balances. Next, respondents are asked, “After the last payment(s) (was/were) made, what was the total balance still owed on (this account/all these accounts)?” We expect this measure to reflect the borrower’s recollection of the carried balance on each card. The interviewer advises the respondent to exclude any business use of personal credit cards.
We generate an upper bound measure of the amount of credit card debt observed in the SCF by adding together the convenience use and carried balance figures, as measured by the above two questions, so that our measure of SCF credit card debt consists of all carried balances currently held by
20 While credit reports cannot typically distinguish between primary residence and other types of properties, and hence the CCP must pool all residential mortgages, the SCF asks separate questions about loans collateralized by the primary residence and by other residential real estate. The SCF questions on loans collateralized by other residential real estate do not allow us to distinguish among mortgages, home equity loans, and HELOCs. As a result, our SCF estimates for the residential real estate debt subcategories do not contain vacation and investment property debt. Of 2010 SCF households, 5.3 percent report some residential debt not secured by the primary residence.21 By the “prevalence” of a type of debt, we mean the share of the population holding positive balances in that type of debt.
FRBNY Economic Policy Review / October 2015 27
borrowers plus all new charges from the last completed billing cycle on each card held by the borrower. The total card debt inferred in this manner may, therefore, contain some double-counting.22,23 However, to the extent that respondents interpret the phrase “new charges” to indicate spending on the card but not finance charges, the measure obtained may understate the total balances one would expect lenders to report. The above approach is used in generating the Table 1 aggregate balances and the Table 2 distributional characteristics.
22 The authors thank Joanne Hsu and Kevin Moore for suggesting this approach.23 We infer that this approach is generous from other SCF data. The 2007 SCF asks respondents with credit cards whether they “always or almost always,” “sometimes,” or “hardly ever” pay off the full billing cycle balance on their credit cards. Among households with credit cards, the answers were 68 percent, 15 percent, and 17 percent, respectively. These rates are at odds with the 46.1 percent of SCF households that report positive credit card balances following their most recent payments.
The credit card debt rates, conditional median, and conditional mean comparisons suggest greater agreement between the borrower- and lender-side measures than one might infer from the aggregates. Table 2, panel B, indicates that, once we correct for SCF households without credit reports, 74.0 percent of SCF households and 73.6 percent of CCP households hold some credit card debt. The conditional medians and means reflect some difference in balances, however, with $2,000 (SCF) versus $3,500 (CCP) in credit card debt at the median, and $5,700 versus $9,600 at the mean. So it appears that less credit card debt is reported in the SCF than in the CCP, and that the major source of the difference in reporting (and presumably the difference in the aggregates evident in Table 1) is the low balances reported by SCF credit card users (or high balances reported by CCP lenders), as opposed to a failure among SCF credit card users to report any credit card use at all.
Table 2SCF and CCP Household Debt by Account Type, 2010
Percent of Households Median (U.S. Dollars) Mean (U.S. Dollars)
SCF CCP SCF CCP SCF CCP
Panel A: Raw Frequencies
Overall debt 75.1 84.0 71,900 42,500 130,700 114,900Overall home-secured debt 47.0 42.6 109,600 123,400 154,300 181,400Mortgages or home equity loans 45.2 40.3 110,000 130,100 151,800 186,700Home equity lines of credit 7.2 9.2 26,400 34,700 54,500 62,700Vehicle installment loans 32.7 38.3 11,000 12,400 15,500 16,200Education installment loans 19.2 — 13,000 — 5,500 7,500Credit card balances 66.2 73.6 2,000 3,500 5,700 9,600
Panel B: Corrected Prevalence
Overall debt 84.0 84.0 71,900 42,500 130,700 114,900Overall home-secured debt 52.6 42.6 109,600 123,400 154,300 181,400Mortgages or home equity loans 50.6 40.3 110,000 130,100 151,800 186,700Home equity lines of credit 8.1 9.2 26,400 34,700 54,500 62,700Vehicle installment loans 36.6 38.3 11,000 12,400 15,500 16,200Education installment loans 21.5 — 13,000 — 5,500 7,500Credit card balances 74.0 73.6 2,000 3,500 5,700 9,600
Sources: Board of Governors of the Federal Reserve System, Survey of Consumer Finances; Federal Reserve Bank of New York Consumer Credit Panel/Equifax.
Note: The per capita student loan balance for the CCP is calculated by dividing the aggregate student balance measured for the third quarter of 2010 by the number of households represented by the CCP in that quarter. It is an unconditional figure, and hence is compared with the unconditional per household student debt in the SCF.
28 Do We Know What We Owe?
Turning to student debt, we note that our ability to compare student debt distributions in the two sources suffers from the above-mentioned restrictions in the availability of household-level student debt measures in the CCP. We have chosen to generate the aggregate U.S. student debt balances implied by the SCF household-level and CCP individual-level observations for 2010. We infer from these measures, and the numbers of households represented by the two data sets, the household-level mean student loan balance (Table 2). Unlike other figures in Table 2, these reported means are not conditioned on holding positive debt in the category, because we are unable to determine the proportion of CCP households with positive student debt balances in the third quarter of 2010.
The SCF respondents are asked, “Do you (and your family living here) owe any money or have any loans for educational expenses?” The interviewer instructs the respondents to exclude any credit card or other loans previously recorded in the survey.24 The respondents are then asked to supply estimates of the balance on each of their first six reported education loans, and the total balance on the seventh and any additional loans: “How much (in total) is still owed on (this loan/all the remaining loans)?” The sum of these values constitutes our student debt measure for the household.
The SCF question format may generate smaller debt responses than those we observe from lenders because while it asks about the debt of all primary economic unit members, the question is put only to the respondent. We explore the possibility of underreporting in large families later in the article.
As suggested by the 25.7-percentage-point gap in aggregate student debt between the SCF and CCP, the mean household-level student debt we infer for the SCF in 2010 is markedly lower than the debt we infer for the CCP in 2010. When households without credit reports are removed from the calculation, SCF households claim $5,500 in student debt balances on average, while CCP households show an average balance of $7,500.
Though the discussion in this section emphasizes prevalence, medians, and means, other moments of the SCF and CCP debt distributions may be of interest. Appendix Chart A1 depicts the mortgage and credit card balance densities in the SCF and CCP, after adjusting the SCF data for the 10.6 percent of households whose members have no credit reports. The results are fairly similar in the two data sources,
24 The debt questions preceding this one cover financial institutions, credit cards, the principal residence, other housing lines of credit, investment and vacation properties, businesses, and vehicles; hence, the exclusion of previously reported loans is quite comprehensive. Of course, these other categories typically do not include explicit school loans.
except for a higher reported mortgage prevalence in the SCF than in the CCP, and a lower credit card debt in the SCF than in the CCP, as described above.
We conclude that the prevalence of consumer use of each major debt category is similar in the two sources. The pattern of conditional median and mean balances is also similar. However, reported household balances tend to be lower in the borrower-sourced data than in the lender-sourced data. The two categories in which we observe substantial mean balance gaps between the SCF and the CCP are credit card and student loan debt. Even under our most inclusive assumptions regarding SCF debt levels, unconditional mean credit card balances are 40 percent lower in the SCF than in the CCP, and unconditional mean student loan balances are 27 percent lower in the SCF than in the CCP.
Patterns by Age, Region, and YearCredit reports contain limited demographic information, and hence we are unable to use a more detailed household-level matching estimator to examine the difference between debt reported in the SCF and in the CCP. But the reports do contain the date of observation, the borrower’s location, and in many instances, the borrower’s age, and we exploit these data to produce a more granular comparison of the debt distributions in the two samples.
First, we consider age. In the SCF, we are able to identify a household head (defined to be the single adult in PEUs with one adult, the male partner in male-female couple PEUs, and the older member of the pair in same-sex PEUs). The SCF data contain ages of household members, and so we have a self-reported age of the household head available. In the CCP, as in credit reports, we cannot identify a household head. But we do have ages of household members. In response, we experiment with a variety of rules for predicting household head and evaluate their effectiveness in the SCF data. The most effective simple rule we developed was to assign the household head age as the median age among adult household members (implying the age of the one adult household member in single-headed households, the average of the two ages in two-adult households, the middle of three ages in three-adult households, and so on). This approach generates the age of household head distribution reported for the third-quarter 2007 CCP in Table 3.25 Table 3 then compares this household head age distribution with the actual age of household head distributions in both the
25 As elsewhere in this article, we use household weights in the comparison of CCP household head ages to those in the SCF and Census.
FRBNY Economic Policy Review / October 2015 29
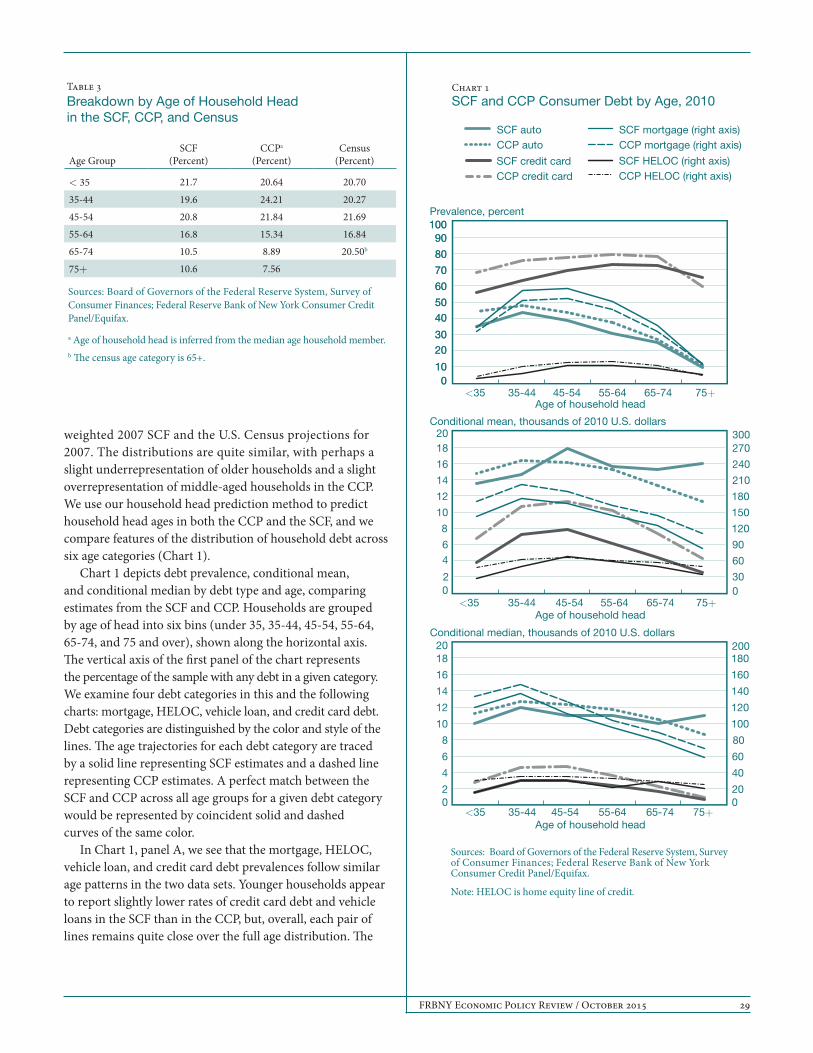
weighted 2007 SCF and the U.S. Census projections for 2007. The distributions are quite similar, with perhaps a slight underrepresentation of older households and a slight overrepresentation of middle-aged households in the CCP. We use our household head prediction method to predict household head ages in both the CCP and the SCF, and we compare features of the distribution of household debt across six age categories (Chart 1).
Chart 1 depicts debt prevalence, conditional mean, and conditional median by debt type and age, comparing estimates from the SCF and CCP. Households are grouped by age of head into six bins (under 35, 35-44, 45-54, 55-64, 65-74, and 75 and over), shown along the horizontal axis. The vertical axis of the first panel of the chart represents the percentage of the sample with any debt in a given category. We examine four debt categories in this and the following charts: mortgage, HELOC, vehicle loan, and credit card debt. Debt categories are distinguished by the color and style of the lines. The age trajectories for each debt category are traced by a solid line representing SCF estimates and a dashed line representing CCP estimates. A perfect match between the SCF and CCP across all age groups for a given debt category would be represented by coincident solid and dashed curves of the same color.
In Chart 1, panel A, we see that the mortgage, HELOC, vehicle loan, and credit card debt prevalences follow similar age patterns in the two data sets. Younger households appear to report slightly lower rates of credit card debt and vehicle loans in the SCF than in the CCP, but, overall, each pair of lines remains quite close over the full age distribution. The
Table 3Breakdown by Age of Household Head in the SCF, CCP, and Census
Age GroupSCF
(Percent)CCPa
(Percent)Census
(Percent)
< 35 21.7 20.64 20.70
35-44 19.6 24.21 20.2745-54 20.8 21.84 21.6955-64 16.8 15.34 16.8465-74 10.5 8.89 20.50b
75+ 10.6 7.56
Sources: Board of Governors of the Federal Reserve System, Survey of Consumer Finances; Federal Reserve Bank of New York Consumer Credit Panel/Equifax.
a Age of household head is inferred from the median age household member.b The census age category is 65+.
010
2030
4050
60
70
80
90100
CCP credit card
SCF credit card
CCP auto
SCF auto
CCP HELOC rate
SCF HELOC rate
CCP mortgage
SCF mortgage
75+65-7455-6445-5435-44<35
Prevalence, percent
Conditional median, thousands of 2010 U.S. dollars
CCP credit card
SCF credit card
CCP auto
SCF auto
Conditional mean, thousands of 2010 U.S. dollars
PANEL A PANEL B
PANEL DPANEL C
CCP credit card
SCF credit card
CCP auto
SCF auto
75+65-7455-6445-5435-44<35
Sources: Board of Governors of the Federal Reserve System, Survey of Consumer Finances; Federal Reserve Bank of New York Consumer Credit Panel/Equifax.
Note: HELOC is home equity line of credit.
Age of household head
Age of household head
Age of household head
CCP HELOC rate
SCF HELOC rate
CCP mortgage
SCF mortgage
CCP HELOC rate
SCF HELOC rate
CCP mortgage
SCF mortgage
Chart 1 SCF and CCP Consumer Debt by Age, 2010
75+65-7455-6445-5435-44<35
CCP autoSCF auto
CCP mortgage (right axis)SCF mortgage (right axis)
CCP HELOC (right axis)SCF HELOC (right axis)
CCP credit cardSCF credit card
010
2030
4050
60
70
80
90100
02
46
8
10
12
14
16
1820
02
4
6
8
10
12
14
16
1820
020
40
60
80
100
120
140
160
180200
300
60
90
120
150
180
210
240
270300
30 Do We Know What We Owe?
prevalence for credit card debt shows the widest discrepancy. The differences in reported credit card debt rates range from -6 to 13 percentage points for the various age groups, and conventional tests of means reject, with high degrees of confidence, the null hypothesis that credit card debt prevalence is the same in the two sources for most age groups. However, the economic significance of the largest observed differences in debt rates is comparatively modest, and the similarity in the levels and shapes of each pair of age profiles is striking.
For the conditional mean and median debt levels in the two samples, several of the line pairs are nearly coincident (Chart 1, panels B and C). The SCF mortgage and HELOC amounts lie below the CCP amounts for most age groups, but these differences are of a magnitude that may largely be explained by the exclusion of vacation and investment properties from the SCF measures.26 The age patterns of conditional debt balances are remarkably similar in the two data sets. The single exception to this pattern is credit card debt, whose levels again differ meaningfully in the two sources.27
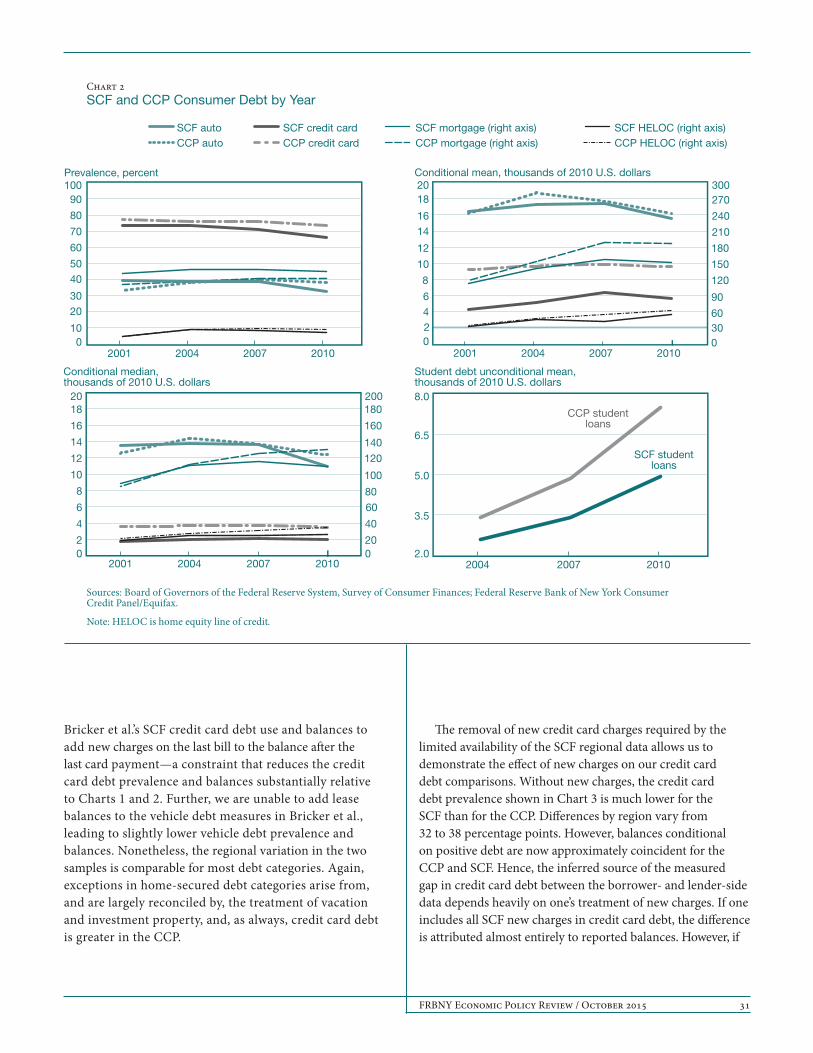
When comparing data by year (Chart 2), we find that the levels and time trends in the prevalence and sizes of the various debt categories match well in the two data sets. Some minor variations in mortgage and HELOC patterns arise from the data sets’ differing treatment of vacation and investment property: mortgage prevalence is a bit higher in the CCP,
26 However, the mortgage differences are approximately constant across the age groups, a profile somewhat at odds with what we expect for vacation and investment properties.27 Appendix Chart A2 demonstrates very similar age profiles of debt for 2007, indicating a high degree of stability of the age dependence of debt, and of the SCF-CCP similarity in these patterns, over the three years.
and recent increases in the dollar amounts of mortgages and HELOCs in the CCP are muted in the SCF. However, we find that the majority of the difference in each of these cases does not appear in the case of total home-secured debt, where we are able to account for vacation and investment properties more comparably.28 Vehicle debt was significantly more prevalent in the SCF in 2001, and then significantly more prevalent in the CCP in 2010. Credit card amounts in the SCF remain well below those in the CCP. By and large, however, the time trends in the two data sets are quite similar.
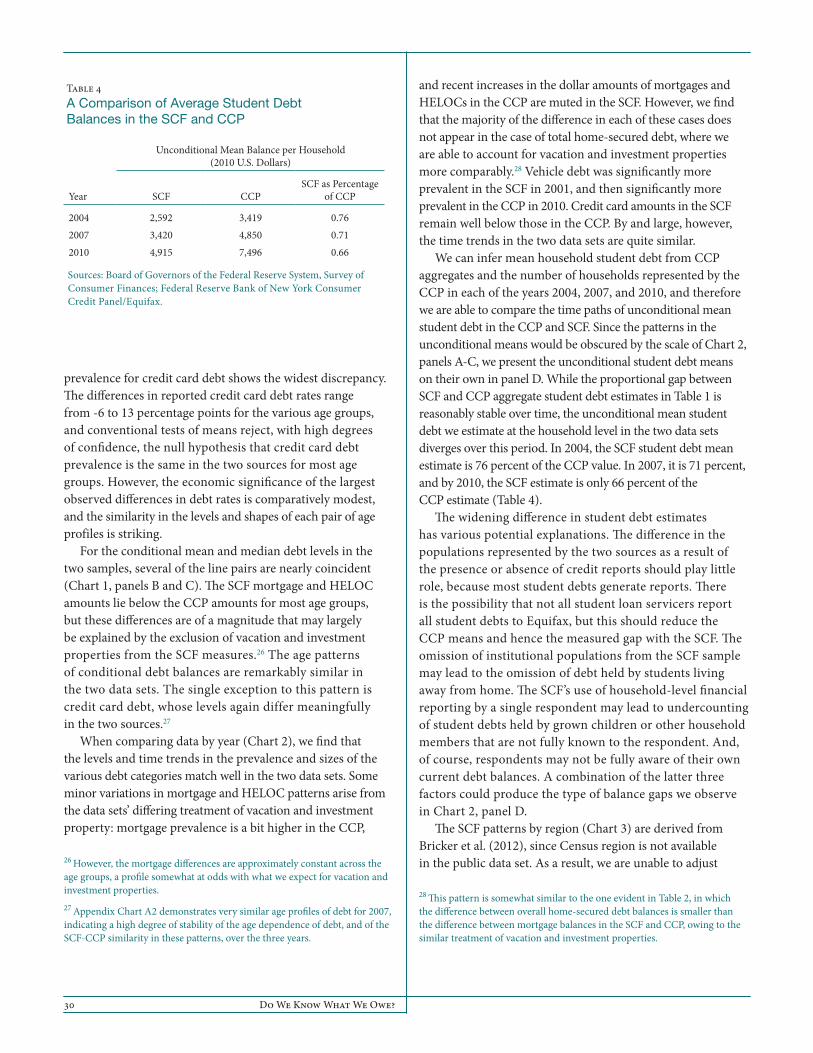
We can infer mean household student debt from CCP aggregates and the number of households represented by the CCP in each of the years 2004, 2007, and 2010, and therefore we are able to compare the time paths of unconditional mean student debt in the CCP and SCF. Since the patterns in the unconditional means would be obscured by the scale of Chart 2, panels A-C, we present the unconditional student debt means on their own in panel D. While the proportional gap between SCF and CCP aggregate student debt estimates in Table 1 is reasonably stable over time, the unconditional mean student debt we estimate at the household level in the two data sets diverges over this period. In 2004, the SCF student debt mean estimate is 76 percent of the CCP value. In 2007, it is 71 percent, and by 2010, the SCF estimate is only 66 percent of the CCP estimate (Table 4).
The widening difference in student debt estimates has various potential explanations. The difference in the populations represented by the two sources as a result of the presence or absence of credit reports should play little role, because most student debts generate reports. There is the possibility that not all student loan servicers report all student debts to Equifax, but this should reduce the CCP means and hence the measured gap with the SCF. The omission of institutional populations from the SCF sample may lead to the omission of debt held by students living away from home. The SCF’s use of household-level financial reporting by a single respondent may lead to undercounting of student debts held by grown children or other household members that are not fully known to the respondent. And, of course, respondents may not be fully aware of their own current debt balances. A combination of the latter three factors could produce the type of balance gaps we observe in Chart 2, panel D.
The SCF patterns by region (Chart 3) are derived from Bricker et al. (2012), since Census region is not available in the public data set. As a result, we are unable to adjust
28 This pattern is somewhat similar to the one evident in Table 2, in which the difference between overall home-secured debt balances is smaller than the difference between mortgage balances in the SCF and CCP, owing to the similar treatment of vacation and investment properties.
Table 4 A Comparison of Average Student Debt Balances in the SCF and CCP
Unconditional Mean Balance per Household (2010 U.S. Dollars)
Year SCF CCPSCF as Percentage
of CCP
2004 2,592 3,419 0.762007 3,420 4,850 0.712010 4,915 7,496 0.66
Sources: Board of Governors of the Federal Reserve System, Survey of Consumer Finances; Federal Reserve Bank of New York Consumer Credit Panel/Equifax.
FRBNY Economic Policy Review / October 2015 31
Bricker et al.’s SCF credit card debt use and balances to add new charges on the last bill to the balance after the last card payment—a constraint that reduces the credit card debt prevalence and balances substantially relative to Charts 1 and 2. Further, we are unable to add lease balances to the vehicle debt measures in Bricker et al., leading to slightly lower vehicle debt prevalence and balances. Nonetheless, the regional variation in the two samples is comparable for most debt categories. Again, exceptions in home-secured debt categories arise from, and are largely reconciled by, the treatment of vacation and investment property, and, as always, credit card debt is greater in the CCP.
The removal of new credit card charges required by the limited availability of the SCF regional data allows us to demonstrate the effect of new charges on our credit card debt comparisons. Without new charges, the credit card debt prevalence shown in Chart 3 is much lower for the SCF than for the CCP. Differences by region vary from 32 to 38 percentage points. However, balances conditional on positive debt are now approximately coincident for the CCP and SCF. Hence, the inferred source of the measured gap in credit card debt between the borrower- and lender-side data depends heavily on one’s treatment of new charges. If one includes all SCF new charges in credit card debt, the difference is attributed almost entirely to reported balances. However, if
CCP credit card
CCP auto
CCP HELOC rate
CCP mortgage
SCF credit card
SCF auto
SCF HELOC rate
SCF mortgage
2010200720042001
Chart 2SCF and CCP Consumer Debt by Year
Prevalence, percent
Conditional median, thousands of 2010 U.S. dollars
CCP credit card
SCF credit card
CCP auto
SCF auto
2010200720042001
Conditional mean, thousands of 2010 U.S. dollars
CCP
SCF
201020072004
Student debt unconditional mean, thousands of 2010 U.S. dollars
Sources: Board of Governors of the Federal Reserve System, Survey of Consumer Finances; Federal Reserve Bank of New York Consumer Credit Panel/Equifax.
Note: HELOC is home equity line of credit.
PANEL A PANEL B
PANEL DPANEL C
CCP credit card
SCF credit card
CCP auto
SCF auto
CCP HELOC rate
SCF HELOC rate
CCP mortgage
SCF mortgage
2010200720042001
CCP studentloans
SCF studentloans
CCP HELOC rate
SCF HELOC rate
CCP mortgage
SCF mortgage
CCP autoSCF auto
CCP credit cardSCF credit card
CCP mortgage (right axis)SCF mortgage (right axis)
CCP HELOC (right axis)SCF HELOC (right axis)
010
2030
4050
60
70
80
90100
0246
8
10
12
1416
1820
2.0
3.5
5.0
6.5
8.0
02
4
6
8
10
12
14
16
1820
200
40
60
80
100
120
140
160
180200
03060
90
120
150
180
210
240
270300
32 Do We Know What We Owe?
one omits new charges from SCF balances, then the difference is attributed almost entirely to the rate at which borrowers report any credit card use.
Our tests of the pairwise difference in means (Table 2, panel B, and Charts 1-3) generally reinforce the observations above.29 Differences in the mean balances for credit card and student loan debt are large and statistically significant. Given sample sizes, most other prevalence and mean comparisons in Table 2, panel B, and Charts 1-3 meet standard significance criteria. In other words, credit card and student debt balances aside, the differences are both small (as the point estimates indicate) and precisely measured. Examples of the rare cases in which the difference in means is insignificant include the prevalence of credit card debt and vehicle loans (Table 2, panel B) and the prevalence of HELOC debt in 2001 and 2004 (Chart 2, panel A).
4.2 Borrower-Reported Credit Card Debt in the SCF Is Substantially Lower Than Lender-Reported Credit Card Debt in the CCP
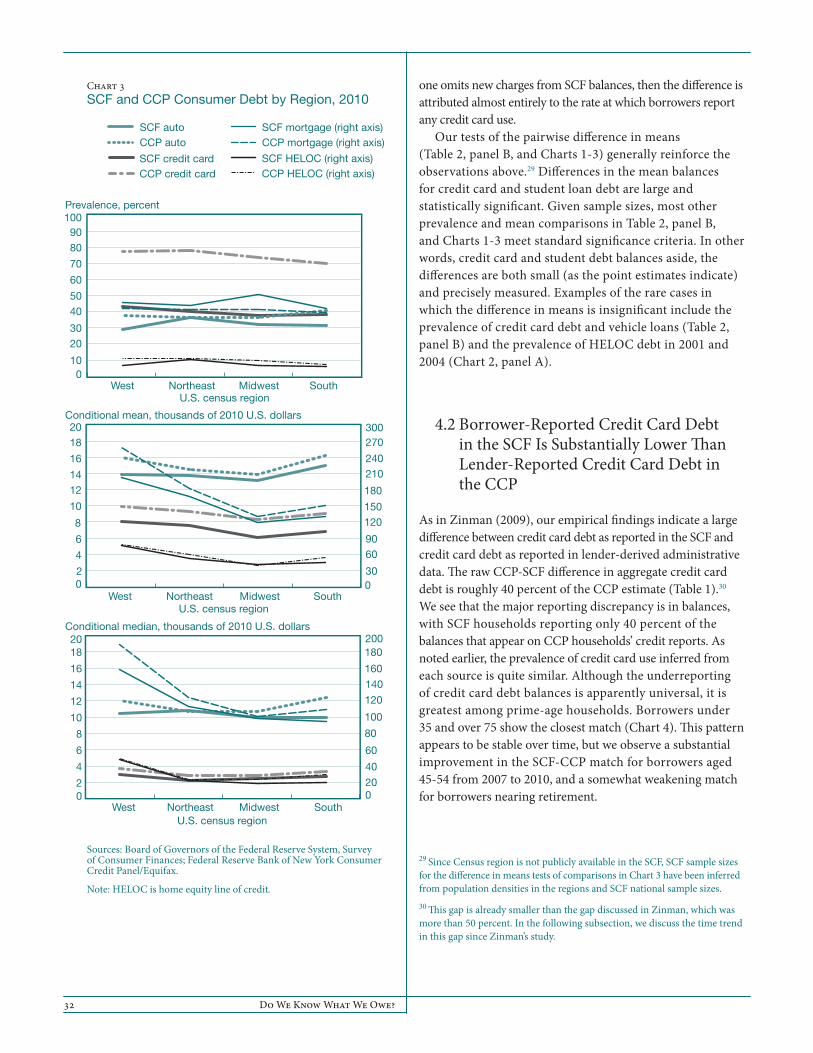
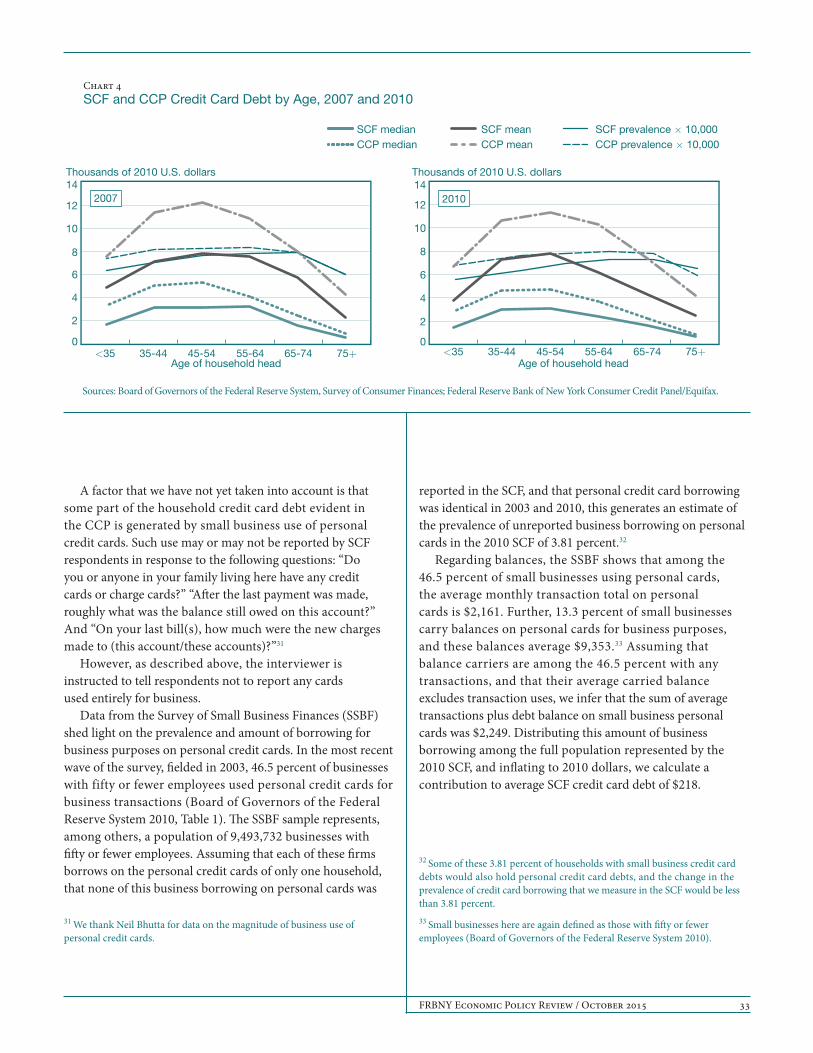
As in Zinman (2009), our empirical findings indicate a large difference between credit card debt as reported in the SCF and credit card debt as reported in lender-derived administrative data. The raw CCP-SCF difference in aggregate credit card debt is roughly 40 percent of the CCP estimate (Table 1).30 We see that the major reporting discrepancy is in balances, with SCF households reporting only 40 percent of the balances that appear on CCP households’ credit reports. As noted earlier, the prevalence of credit card use inferred from each source is quite similar. Although the underreporting of credit card debt balances is apparently universal, it is greatest among prime-age households. Borrowers under 35 and over 75 show the closest match (Chart 4). This pattern appears to be stable over time, but we observe a substantial improvement in the SCF-CCP match for borrowers aged 45-54 from 2007 to 2010, and a somewhat weakening match for borrowers nearing retirement.
29 Since Census region is not publicly available in the SCF, SCF sample sizes for the difference in means tests of comparisons in Chart 3 have been inferred from population densities in the regions and SCF national sample sizes.30 This gap is already smaller than the gap discussed in Zinman, which was more than 50 percent. In the following subsection, we discuss the time trend in this gap since Zinman’s study.
CCP credit card
SCF credit card
CCP auto
SCF auto
CCP HELOC rate
SCF HELOC rate
CCP mortgage
SCF mortgage
SouthMidwestNortheastWest
Prevalence, percent
Conditional median, thousands of 2010 U.S. dollars CCP credit card
SCF credit card
CCP auto
SCF auto
Conditional mean, thousands of 2010 U.S. dollars
PANEL A PANEL B
PANEL DPANEL C
CCP credit card
SCF credit card
CCP auto
SCF auto
SouthMidwestNortheastWest
Chart 3SCF and CCP Consumer Debt by Region, 2010
U.S. census region
U.S. census region
U.S. census region
Sources: Board of Governors of the Federal Reserve System, Survey of Consumer Finances; Federal Reserve Bank of New York Consumer Credit Panel/Equifax.
Note: HELOC is home equity line of credit.
CCP HELOC rate
SCF HELOC rate
CCP mortgage
SCF mortgage
CCP HELOC rate
SCF HELOC rate
CCP mortgage
SCF mortgageSouthMidwestNortheastWest
CCP autoSCF auto
CCP mortgage (right axis)SCF mortgage (right axis)
CCP HELOC (right axis)SCF HELOC (right axis)
CCP credit cardSCF credit card
010
2030
4050
60
70
8090
100
02
4
6
8
10
1214
16
1820
02
4
6
8
10
12
14
16
1820
200
40
60
80
100
120
140
160
180200
030
6090
120150
180
210240
270300
FRBNY Economic Policy Review / October 2015 33
A factor that we have not yet taken into account is that some part of the household credit card debt evident in the CCP is generated by small business use of personal credit cards. Such use may or may not be reported by SCF respondents in response to the following questions: “Do you or anyone in your family living here have any credit cards or charge cards?” “After the last payment was made, roughly what was the balance still owed on this account?” And “On your last bill(s), how much were the new charges made to (this account/these accounts)?”31
However, as described above, the interviewer is instructed to tell respondents not to report any cards used entirely for business.
Data from the Survey of Small Business Finances (SSBF) shed light on the prevalence and amount of borrowing for business purposes on personal credit cards. In the most recent wave of the survey, fielded in 2003, 46.5 percent of businesses with fifty or fewer employees used personal credit cards for business transactions (Board of Governors of the Federal Reserve System 2010, Table 1). The SSBF sample represents, among others, a population of 9,493,732 businesses with fifty or fewer employees. Assuming that each of these firms borrows on the personal credit cards of only one household, that none of this business borrowing on personal cards was
31 We thank Neil Bhutta for data on the magnitude of business use of personal credit cards.
reported in the SCF, and that personal credit card borrowing was identical in 2003 and 2010, this generates an estimate of the prevalence of unreported business borrowing on personal cards in the 2010 SCF of 3.81 percent.32
Regarding balances, the SSBF shows that among the 46.5 percent of small businesses using personal cards, the average monthly transaction total on personal cards is $2,161. Further, 13.3 percent of small businesses carry balances on personal cards for business purposes, and these balances average $9,353.33 Assuming that balance carriers are among the 46.5 percent with any transactions, and that their average carried balance excludes transaction uses, we infer that the sum of average transactions plus debt balance on small business personal cards was $2,249. Distributing this amount of business borrowing among the full population represented by the 2010 SCF, and inflating to 2010 dollars, we calculate a contribution to average SCF credit card debt of $218.
32 Some of these 3.81 percent of households with small business credit card debts would also hold personal credit card debts, and the change in the prevalence of credit card borrowing that we measure in the SCF would be less than 3.81 percent.33 Small businesses here are again defined as those with fifty or fewer employees (Board of Governors of the Federal Reserve System 2010).
CCP prevelance x 10,000
SCF prevelance x 10,000
SCF CCP mean
SCF mean
CCP median
SCF median
75+65-7455-6445-5435-44<35
Thousands of 2010 U.S. dollars Thousands of 2010 U.S. dollars
PANEL A PANEL B
PANEL DPANEL C
CCP prevelance x 10,000
SCF prevelance x 10,000
SCF CCP mean
SCF mean
CCP median
SCF median75+65-7455-6445-5435-44<35
Chart 4SCF and CCP Credit Card Debt by Age, 2007 and 2010
Sources: Board of Governors of the Federal Reserve System, Survey of Consumer Finances; Federal Reserve Bank of New York Consumer Credit Panel/Equifax.
CCP medianSCF median
CCP meanSCF mean
CCP prevalence × 10,000SCF prevalence × 10,000
Age of household head Age of household head
2007 2010
0
2
4
6
8
10
12
14
0
2
4
6
8
10
12
14
34 Do We Know What We Owe?
Adding this generous estimate of small business usage, and removing the inferred portion of SCF households without credit reports, results in a 2010 SCF unconditional mean credit card balance of $4,437, which may be compared with the CCP unconditional mean of $7,066. This calculation leaves a gap of 37 percent between the SCF and CCP mean household balances.
One final possibility worth mentioning, noted by a lead SCF investigator, is that SCF respondents do not report debt in long-dormant accounts, which they may regard as no longer relevant or may have forgotten. This is not a measurement explanation, but rather an aspect of underreporting. The CCP data include information on accounts that have been updated by the creditor within three months of the date on which the quarter’s data were collected. This standard may result in the inclusion of some dormant account balances that lenders continue to report, and the exclusion of other dormant account balances lenders no longer report.34 This inconsistency may explain some of the difference in aggregate balances. It does not address the question of what consumer behaviors generate dormant, forgotten accounts.
4.3 The Gap between SCF and CCP Credit Card Debt Narrowed from 2001 to 2007
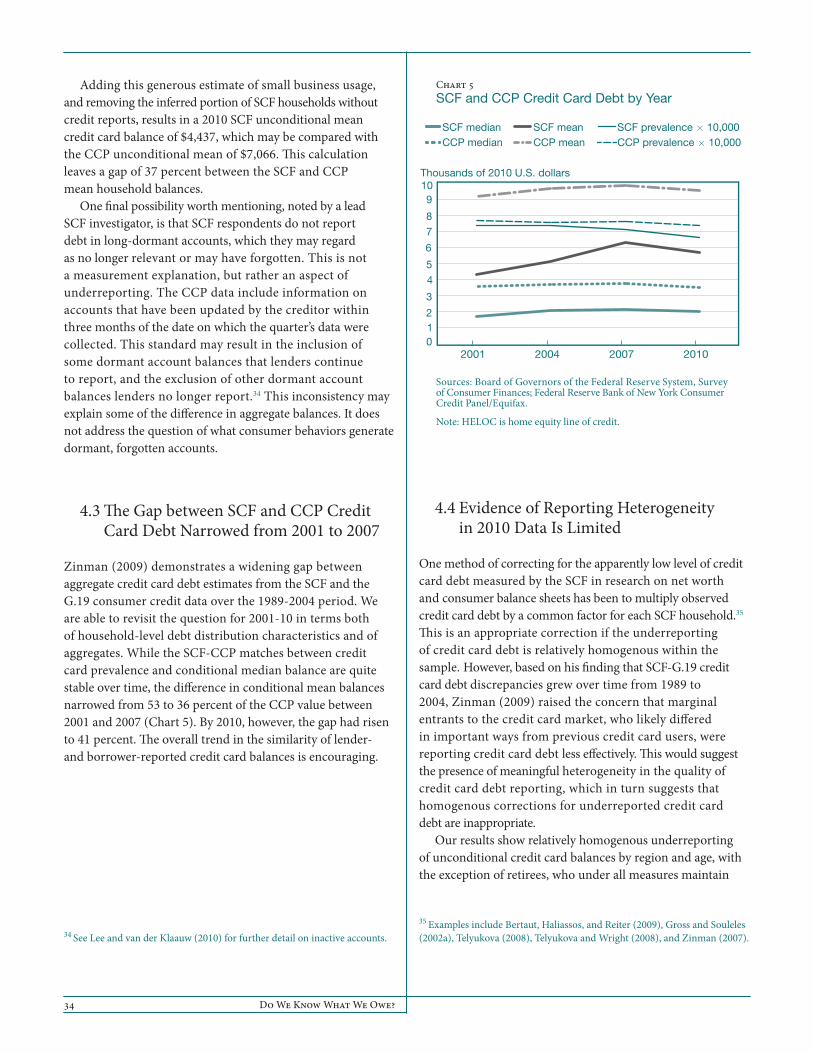
Zinman (2009) demonstrates a widening gap between aggregate credit card debt estimates from the SCF and the G.19 consumer credit data over the 1989-2004 period. We are able to revisit the question for 2001-10 in terms both of household-level debt distribution characteristics and of aggregates. While the SCF-CCP matches between credit card prevalence and conditional median balance are quite stable over time, the difference in conditional mean balances narrowed from 53 to 36 percent of the CCP value between 2001 and 2007 (Chart 5). By 2010, however, the gap had risen to 41 percent. The overall trend in the similarity of lender- and borrower-reported credit card balances is encouraging.
34 See Lee and van der Klaauw (2010) for further detail on inactive accounts.
4.4 Evidence of Reporting Heterogeneity in 2010 Data Is Limited
One method of correcting for the apparently low level of credit card debt measured by the SCF in research on net worth and consumer balance sheets has been to multiply observed credit card debt by a common factor for each SCF household.35 This is an appropriate correction if the underreporting of credit card debt is relatively homogenous within the sample. However, based on his finding that SCF-G.19 credit card debt discrepancies grew over time from 1989 to 2004, Zinman (2009) raised the concern that marginal entrants to the credit card market, who likely differed in important ways from previous credit card users, were reporting credit card debt less effectively. This would suggest the presence of meaningful heterogeneity in the quality of credit card debt reporting, which in turn suggests that homogenous corrections for underreported credit card debt are inappropriate.
Our results show relatively homogenous underreporting of unconditional credit card balances by region and age, with the exception of retirees, who under all measures maintain
35 Examples include Bertaut, Haliassos, and Reiter (2009), Gross and Souleles (2002a), Telyukova (2008), Telyukova and Wright (2008), and Zinman (2007).
CCP prevelance x 10,000
SCF prevelance x 10,000
SCF CCP mean
SCF mean
CCP median
SCF median
2010200720042001
Thousands of 2010 U.S. dollars
PANEL A PANEL B
PANEL DPANEL C
Chart 5SCF and CCP Credit Card Debt by Year
Sources: Board of Governors of the Federal Reserve System, Survey of Consumer Finances; Federal Reserve Bank of New York Consumer Credit Panel/Equifax.
Note: HELOC is home equity line of credit.
CCP medianSCF median
CCP meanSCF mean
CCP prevalence × 10,000SCF prevalence × 10,000
012
3
45
6
78
910
FRBNY Economic Policy Review / October 2015 35
low credit card balances. Further, we find these patterns to be very stable over time. Though these findings fall far short of being sufficient to rule out all (observable and unobservable) types of reporting heterogeneity, we fail to find evidence that making a common adjustment for SCF credit card debt underreporting is inappropriate.
4.5 Bankruptcy
The two prominent potential explanations for the remaining gap between SCF and CCP credit card debt levels are the possibility of social stigma attaching to the use of uncollateralized debt, and the possibility that borrowers are not well informed about their credit card debt levels. In 2007, 64 percent of SCF interviews were conducted in person and the remainder over the phone.36 In both types of interview, the respondent interacts over a long period of time with an interviewer, who grows increasingly familiar with the respondent’s personal and financial circumstances. If the respondent suspects that credit card debt, or other consumer attributes, might be looked upon unfavorably by the interviewer, then the respondent may have reason to answer questions regarding such attributes inaccurately. As in most surveys, respondents in the SCF incur no material cost for responding inaccurately. These factors together could lead to inaccurately low reports of credit card debt.
Being uninformed could result from several factors, including willful ignorance, given that large credit card balances are not welcome information; difficulty understanding the growth of credit card balances, as described in Lusardi and Tufano (2009); limited information on other household members’ debts; or other cognition and information costs. While stigma issues in reporting are primarily a data quality concern, being uninformed regarding one’s debt position may have consequences both for data quality and for the effectiveness of consumers’ decision-making. Therefore, it would be valuable to find a way to distinguish between responding to a stigma and being uninformed.
Bankruptcy is a consumer behavior that is both memorable and relatively likely to be stigmatized. Hence, we may be able to learn something about the importance of stigma in debt reporting in the SCF by assessing the accuracy of the survey’s bankruptcy figures.
A new literature has emerged on consumers’ post-bankruptcy experiences, an increasingly important issue as rates of consumer bankruptcy by 2010 approached
36 The unweighted figure is 55 percent in person.
levels observed prior to bankruptcy reform.37 Han and Li (2011) look at post-bankruptcy access to credit using the SCF. Cohen-Cole, Duygan-Bump, and Montoriol-Garriga (2009) examine post-bankruptcy experiences using credit bureau data. We believe that information on the relative quality of bankruptcy measures in the two data sources would be of value to this discussion.
Past default is possibly the most relevant consumer behavior for potential lenders, and hence the accurate reporting of bankruptcy is a leading concern of credit reporting agencies. Given the care taken in recording and reporting bankruptcies, we believe the bankruptcy data in the CCP are fairly accurate. In this section, we examine the similarity between self-reported bankruptcy in the SCF and credit-bureau-reported bankruptcy in the CCP.
One difficulty we face in comparing bankruptcy rates in the two surveys is a difference in the terms of measurement. The SCF asks whether the respondent or the respondent’s spouse/partner has filed for bankruptcy, and if so how long ago. The publicly available SCF data report time frames of less than one year as -1, and then round all durations since bankruptcy to the nearest odd integer. Hence, we can identify the proportion of responding individuals or couples who have declared bankruptcy less than two years ago, less than four years ago, and so on. If respondents answer in years, then this allows us to identify the proportion who have declared bankruptcy in the past year, past three years, and so on. The CCP, on the other hand, reports whether an individual has filed for bankruptcy within the past twenty-four months. We can aggregate these CCP individuals into households but, as noted above, we cannot identify the relationships among the household members. Therefore, we are unable to restrict household-level bankruptcies to those of a single household head or married/partnered couple.
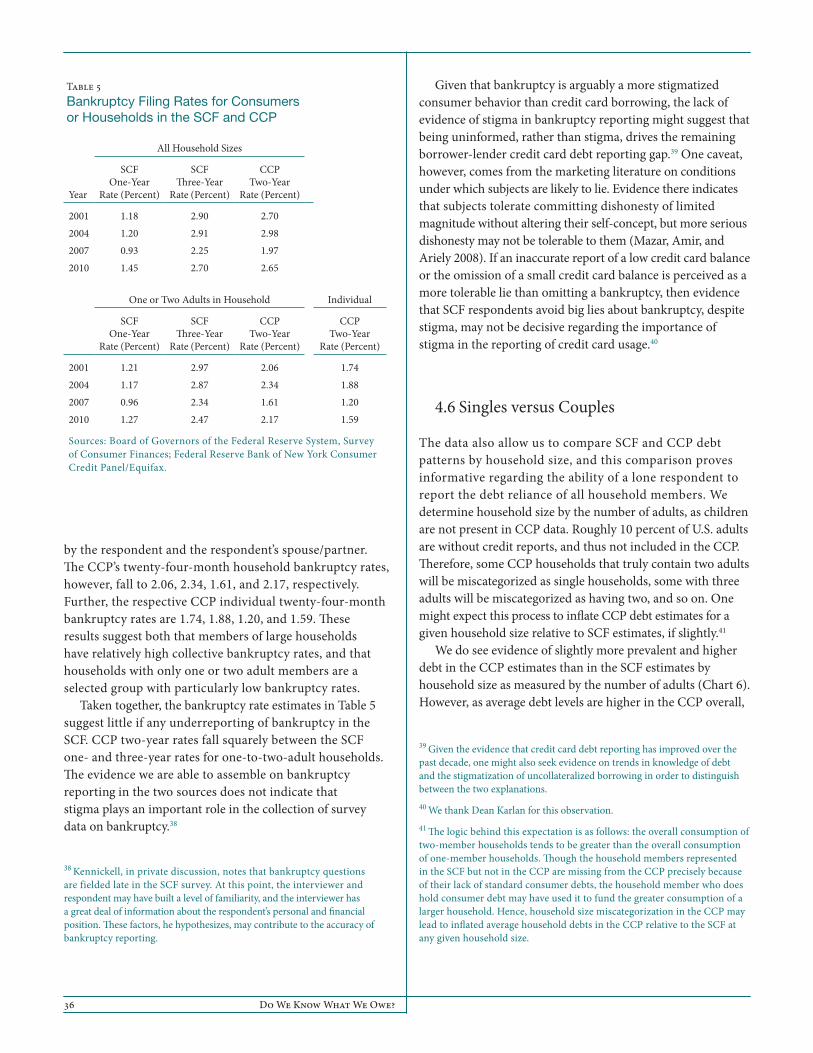
We find that the SCF three-year bankruptcy rates— 2.90, 2.91, 2.25, and 2.70 in 2001, 2004, 2007, and 2010, respectively—are very similar to the twenty-four-month household bankruptcy rates in the CCP of 2.70, 2.98, 1.97, and 2.65 (Table 5). This appears to indicate that bankruptcy is underreported in the SCF. Significantly, however, this comparison does not account for the difference in the members of the household whose bankruptcy experiences are being reported. When we restrict each sample to households with either one or two adult members, we find little change in the SCF three-year bankruptcy rates. Presumably this is because the SCF asks only about bankruptcies experienced
37 See Federal Reserve Bank of New York, “Quarterly Report on Household Debt and Credit” (2011).
36 Do We Know What We Owe?
by the respondent and the respondent’s spouse/partner. The CCP’s twenty-four-month household bankruptcy rates, however, fall to 2.06, 2.34, 1.61, and 2.17, respectively. Further, the respective CCP individual twenty-four-month bankruptcy rates are 1.74, 1.88, 1.20, and 1.59. These results suggest both that members of large households have relatively high collective bankruptcy rates, and that households with only one or two adult members are a selected group with particularly low bankruptcy rates.
Taken together, the bankruptcy rate estimates in Table 5 suggest little if any underreporting of bankruptcy in the SCF. CCP two-year rates fall squarely between the SCF one- and three-year rates for one-to-two-adult households. The evidence we are able to assemble on bankruptcy reporting in the two sources does not indicate that stigma plays an important role in the collection of survey data on bankruptcy.38
38 Kennickell, in private discussion, notes that bankruptcy questions are fielded late in the SCF survey. At this point, the interviewer and respondent may have built a level of familiarity, and the interviewer has a great deal of information about the respondent’s personal and financial position. These factors, he hypothesizes, may contribute to the accuracy of bankruptcy reporting.
Given that bankruptcy is arguably a more stigmatized consumer behavior than credit card borrowing, the lack of evidence of stigma in bankruptcy reporting might suggest that being uninformed, rather than stigma, drives the remaining borrower-lender credit card debt reporting gap.39 One caveat, however, comes from the marketing literature on conditions under which subjects are likely to lie. Evidence there indicates that subjects tolerate committing dishonesty of limited magnitude without altering their self-concept, but more serious dishonesty may not be tolerable to them (Mazar, Amir, and Ariely 2008). If an inaccurate report of a low credit card balance or the omission of a small credit card balance is perceived as a more tolerable lie than omitting a bankruptcy, then evidence that SCF respondents avoid big lies about bankruptcy, despite stigma, may not be decisive regarding the importance of stigma in the reporting of credit card usage.40
4.6 Singles versus Couples
The data also allow us to compare SCF and CCP debt patterns by household size, and this comparison proves informative regarding the ability of a lone respondent to report the debt reliance of all household members. We determine household size by the number of adults, as children are not present in CCP data. Roughly 10 percent of U.S. adults are without credit reports, and thus not included in the CCP. Therefore, some CCP households that truly contain two adults will be miscategorized as single households, some with three adults will be miscategorized as having two, and so on. One might expect this process to inflate CCP debt estimates for a given household size relative to SCF estimates, if slightly.41
We do see evidence of slightly more prevalent and higher debt in the CCP estimates than in the SCF estimates by household size as measured by the number of adults (Chart 6). However, as average debt levels are higher in the CCP overall,
39 Given the evidence that credit card debt reporting has improved over the past decade, one might also seek evidence on trends in knowledge of debt and the stigmatization of uncollateralized borrowing in order to distinguish between the two explanations.40 We thank Dean Karlan for this observation.41 The logic behind this expectation is as follows: the overall consumption of two-member households tends to be greater than the overall consumption of one-member households. Though the household members represented in the SCF but not in the CCP are missing from the CCP precisely because of their lack of standard consumer debts, the household member who does hold consumer debt may have used it to fund the greater consumption of a larger household. Hence, household size miscategorization in the CCP may lead to inflated average household debts in the CCP relative to the SCF at any given household size.
Table 5Bankruptcy Filing Rates for Consumers or Households in the SCF and CCP
All Household Sizes
Year
SCF One-Year
Rate (Percent)
SCF Three-Year
Rate (Percent)
CCP Two-Year
Rate (Percent)
2001 1.18 2.90 2.702004 1.20 2.91 2.982007 0.93 2.25 1.972010 1.45 2.70 2.65
One or Two Adults in Household Individual
SCF One-Year
Rate (Percent)
SCF Three-Year
Rate (Percent)
CCP Two-Year
Rate (Percent)
CCP Two-Year
Rate (Percent)
2001 1.21 2.97 2.06 1.742004 1.17 2.87 2.34 1.882007 0.96 2.34 1.61 1.202010 1.27 2.47 2.17 1.59
Sources: Board of Governors of the Federal Reserve System, Survey of Consumer Finances; Federal Reserve Bank of New York Consumer Credit Panel/Equifax.
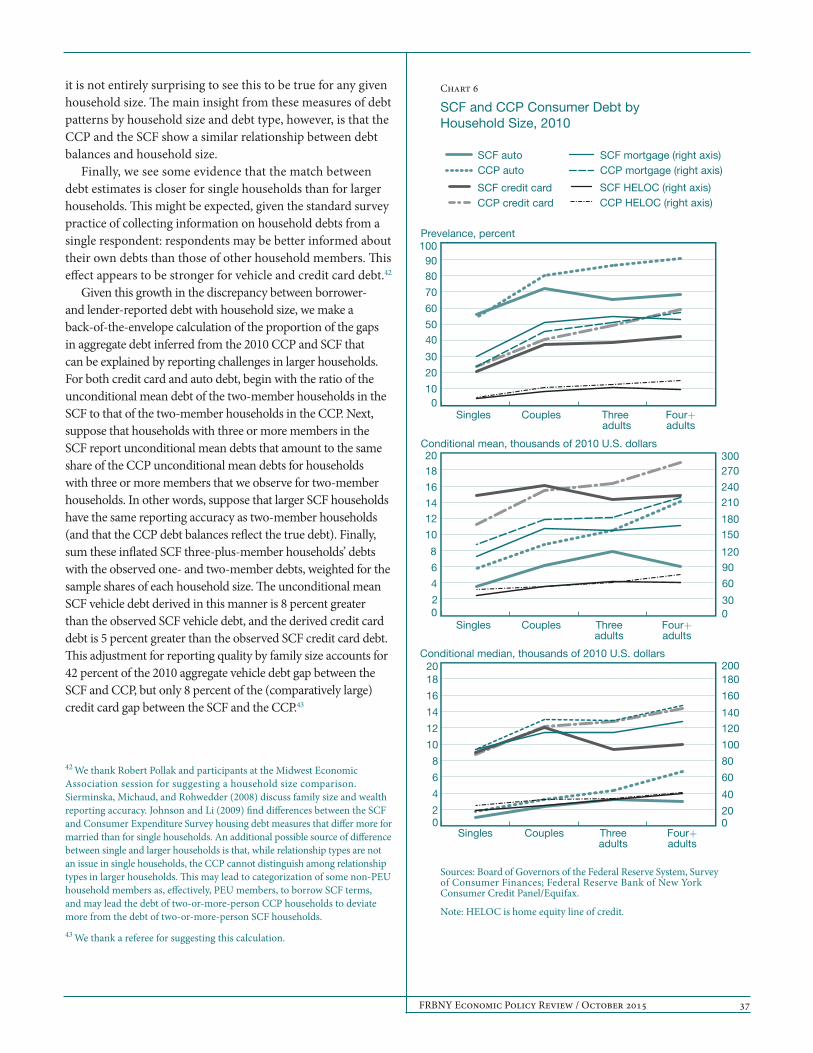
FRBNY Economic Policy Review / October 2015 37
it is not entirely surprising to see this to be true for any given household size. The main insight from these measures of debt patterns by household size and debt type, however, is that the CCP and the SCF show a similar relationship between debt balances and household size.
Finally, we see some evidence that the match between debt estimates is closer for single households than for larger households. This might be expected, given the standard survey practice of collecting information on household debts from a single respondent: respondents may be better informed about their own debts than those of other household members. This effect appears to be stronger for vehicle and credit card debt.42
Given this growth in the discrepancy between borrower- and lender-reported debt with household size, we make a back-of-the-envelope calculation of the proportion of the gaps in aggregate debt inferred from the 2010 CCP and SCF that can be explained by reporting challenges in larger households. For both credit card and auto debt, begin with the ratio of the unconditional mean debt of the two-member households in the SCF to that of the two-member households in the CCP. Next, suppose that households with three or more members in the SCF report unconditional mean debts that amount to the same share of the CCP unconditional mean debts for households with three or more members that we observe for two-member households. In other words, suppose that larger SCF households have the same reporting accuracy as two-member households (and that the CCP debt balances reflect the true debt). Finally, sum these inflated SCF three-plus-member households’ debts with the observed one- and two-member debts, weighted for the sample shares of each household size. The unconditional mean SCF vehicle debt derived in this manner is 8 percent greater than the observed SCF vehicle debt, and the derived credit card debt is 5 percent greater than the observed SCF credit card debt. This adjustment for reporting quality by family size accounts for 42 percent of the 2010 aggregate vehicle debt gap between the SCF and CCP, but only 8 percent of the (comparatively large) credit card gap between the SCF and the CCP.43
42 We thank Robert Pollak and participants at the Midwest Economic Association session for suggesting a household size comparison. Sierminska, Michaud, and Rohwedder (2008) discuss family size and wealth reporting accuracy. Johnson and Li (2009) find differences between the SCF and Consumer Expenditure Survey housing debt measures that differ more for married than for single households. An additional possible source of difference between single and larger households is that, while relationship types are not an issue in single households, the CCP cannot distinguish among relationship types in larger households. This may lead to categorization of some non-PEU household members as, effectively, PEU members, to borrow SCF terms, and may lead the debt of two-or-more-person CCP households to deviate more from the debt of two-or-more-person SCF households.43 We thank a referee for suggesting this calculation.
CCP credit cards
SCF credit cards
CCP auto
SCF auto
SCF HELOC
SCF HELOC
CCP mortgage
SCF morgage
Four+adults
Three adults
CouplesSingles
Prevelance, percent
Conditional median, thousands of 2010 U.S. dollars CCP credit cards
SCF credit cards
CCP auto
SCF auto
Four+adults
Threeadults
CouplesSingles
Conditional mean, thousands of 2010 U.S. dollars
PANEL A PANEL B
PANEL DPANEL C
CCP credit cards
SCF credit cards
CCP auto
SCF auto
Four+adults
Threeadults
CouplesSingles
Chart 6
SCF and CCP Consumer Debt by Household Size, 2010
Sources: Board of Governors of the Federal Reserve System, Survey of Consumer Finances; Federal Reserve Bank of New York Consumer Credit Panel/Equifax.
Note: HELOC is home equity line of credit.
SCF HELOC
SCF HELOC
CCP mortgage
SCF morgage
SCF HELOC
SCF HELOC
CCP mortgage
SCF morgage
CCP autoSCF auto
CCP mortgage (right axis)SCF mortgage (right axis)
CCP HELOC (right axis)SCF HELOC (right axis)
CCP credit cardSCF credit card
010
20
30
4050
60
70
8090
100
02
4
6
8
10
1214
16
1820
02
4
6
8
10
12
14
16
1820
020
40
60
80
100
120
140
160
180200
030
60
90120
150180
210240
270300
38 Do We Know What We Owe?
Finally, note that it is not obvious that the CCP reflects the truth, and the SCF a less accurate self-report, when it comes to the debt of larger households. While the sense that a single household respondent answering on behalf of several consumers might overlook some obligations is intuitive, here, as elsewhere in this article, we should keep in mind the potential limitations of the CCP. Chief among these for the case of larger households is the possibility that addresses may be updated imperfectly by lenders, while SCF survey respondents presumably have an accurate picture of the current members of a household. Grown children who leave their parents’ homes, for example, may take time to update their addresses with their lenders, and lenders may take time to report the changes to the credit bureaus. This would shift some two-person households into the three-or-more-person category in the CCP and lead to inaccuracy in the measurement of debt by household size, though the direction of the bias in measurement for each group is unclear.44
4.7 Primary Economic Unit (PEU) Members
One remaining comparability issue is that, while the CCP data contain debt information for all adults with credit reports residing at a given address, the SCF data typically exclude the debt of non-Primary Economic Unit (PEU) members, where PEU members are as described in Section 3 on data and comparability. The SCF does ask about the presence and amount of any debt held by non-PEU members, and whether the respondent included any of this debt in his or her previous debt responses. The answer to the latter question is not included in the public access SCF data, and hence we are not able to correct even total debt figures for the subset of non-PEU debts that were previously unreported. However, we can use the reported prevalence and amounts of non-PEU members’ debt to infer the effect of omitting it on our central conclusions.
We find that 4.4 percent of 2007 SCF households contain a non-PEU member with positive debt. The unconditional mean of non-PEU member debt among our SCF households is $619. Hence, non-PEU member debt is a concern where our conclusions regarding debt comparisons might be swayed
44 Further, while it is clear that this measurement concern regarding the CCP complicates the analysis of debt by household size, we do not believe that it should have a substantial influence on the comparison of aggregate debt. The young adults changing residence, and their debt, should be caught by both the CCP and the SCF sampling scheme in one household or another.
by the addition of $619 to the SCF debt level in question or 4.4 percentage points to the relevant debt prevalence. We find that such instances are rare.45
5. Implications of Reporting Accuracy for Debt Repayment
As explained above, the match between borrower and lender credit card and student loan debt reports is shown to be weak relative to other debt categories in our SCF-CCP comparison, and elsewhere. Credit card and student debt are generally recognized to be of relatively low repayment quality.46 Mortgages, HELOCs, and vehicle loans carry substantially lower delinquency rates. Given that reporting quality for credit card and student debt appears to be substantially worse than reporting quality for mortgages, HELOCs, and vehicle loans, the relationship we observe between reporting quality and repayment quality by debt type is consistent with a claim that inaccurate debt reporting is associated with poor repayment outcomes.
One might also consider reporting and delinquency by borrower characteristics. In Chart 1, panels A-C, we observe debt reporting matches that, in many cases, strengthen slightly with age. In the CCP, as well as other sources, we see that delinquency declines almost monotonically with the age of the household head, or the age of the borrower. These observations may suggest a modest positive association between debt reporting accuracy and repayment, when comparisons are made across consumer age groups. But the association is modest indeed. On net, there appears to be some evidence of a positive association between debt reporting quality and repayment. This may be unsurprising, given that one expects borrowers with limited knowledge of their debts to have more difficulties with financial decision making.
45 We focus on 2007 in determining the possible magnitude of non-PEU members’ debt because it is near the peak of consumer debt for the 2001-10 period. However, the 2010 figures are similar to those for 2007.46 Gross and Souleles (2002b), for example, report an 8.2 percent three-cycle delinquency rate among a large, representative pool of 1995 U.S. credit card accounts. Further evidence is available in Federal Reserve Bank of New York, “Quarterly Report on Household Debt and Credit” (2011).
FRBNY Economic Policy Review / October 2015 39
6. Conclusion
This article reports the results of the most complete vetting of SCF debt information to date, to our knowledge. Our central finding is the surprising similarity in the patterns of debt-holding evident in the borrower-reported SCF and lender-reported CCP, both in the aggregate and by debt category, year, region, age, and household structure.
Nevertheless, we also find a substantial gap in credit card debt reporting between the SCF and the CCP, with the raw gap equal to roughly 40 percent of the lender-reported debt level. Generous accounting for differences in the two data sources’ sampling design and for small business uses of credit cards narrows the difference in unconditional average household credit card debt to 37 percent of the lender-reported debt level. However, more realistic assumptions would presumably leave a somewhat larger difference, and these adjustments stop far short of reconciling the two measures.
We also find a noteworthy gap in the lender- and borrower-reported levels of the other major uncollateralized debt category, student loans. Aggregate student loans inferred from the SCF are 25.7 percent lower than those inferred from the CCP. This gap may be explained by various measurement differences that would lead debts evident in the CCP not to appear in the SCF.47 Outside measures of aggregate student debt, though limited, tend to be similar to, or greater than, the CCP figure, and hence far larger than the SCF figure.
47 However, any limitation in servicer reporting could result in the omission from the CCP of some debts that appear in the SCF.
Overall, we observe a pattern of (evident) underreporting of uncollateralized debts, along with comparatively reliable reporting of collateralized debts. The poorer repayment rates we observe for uncollateralized debts may suggest an association between debt awareness and debt repayment quality.
Bankruptcy, like heavy reliance on uncollateralized debt, is arguably a stigmatized consumer behavior. Despite the mismatch in credit card debt reporting, SCF borrowers and CCP lenders report recent personal bankruptcy filings at similar rates (though differences in available measures of bankruptcy in the two data sets impose some qualifications on this claim). We infer from this finding that not all stigmatized consumer behaviors are similarly underreported. Whether this indicates that something other than stigma, such as ignorance of debt positions, underlies the credit card debt discrepancy, or that consumers feel differently about reporting major life events, such as bankruptcy, in contrast to more marginal financial position changes, remains an open question.
Clearly all of this analysis relies on the validity of comparisons at the distributional level. It would be preferable to make the lender-borrower debt report comparison at the level of the household or individual. Therefore, we continue to seek opportunities to observe linked consumer self-reports and lender-reported data.48 Until such data are available, however, the detailed comparisons permitted by the rich SCF and CCP data provide our most complete picture of the reliability of debt reporting. Finally, while existing survey data provide limited opportunity to separate unwillingness to report financial information from lack of knowledge of financial information, experimental data might permit a distinction between knowledge of debt and willingness to report debt.
48 Unfortunately, even a direct match of CCP to SCF households would be of limited value, because coverage by the CCP of the 4,422-6,492 SCF households in each wave would be restricted to a small sample representing somewhat more than a 5 percent match rate.
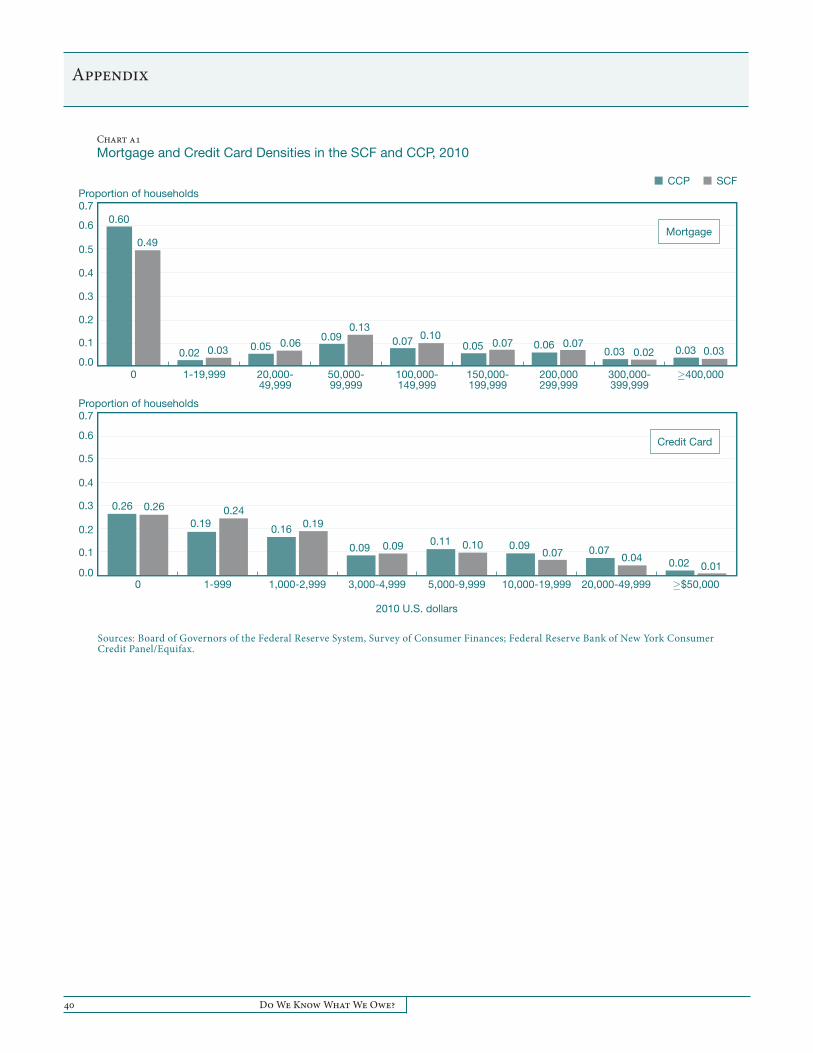
40 Do We Know What We Owe?
Appendix
0.0
0.1
0.2
0.3
0.4
0.5
0.6
0.7
SCF
CCP
≥400,000300,000-399,999
200,000299,999
150,000-199,999
100,000-149,999
50,000-99,999
20,000-49,999
1-19,9990
Proportion of households
Sources: Board of Governors of the Federal Reserve System, Survey of Consumer Finances; Federal Reserve Bank of New York Consumer Credit Panel/Equifax.
SCFCCP
2010 U.S. dollars
Chart a1Mortgage and Credit Card Densities in the SCF and CCP, 2010
0.60
0.49
0.02 0.03 0.05 0.060.09
0.130.07 0.10
0.05 0.07 0.06 0.070.03 0.02 0.03 0.03
0.0
0.1
0.2
0.3
0.4
0.5
0.6
0.7
SCF
CCP
≥$50,00020,000-49,99910,000-19,9995,000-9,9993,000-4,9991,000-2,9991-9990
Proportion of households
0.26 0.26
0.190.24
0.16 0.19
0.09 0.09 0.11 0.10 0.090.07 0.07
0.04 0.02 0.01
Mortgage
Credit Card
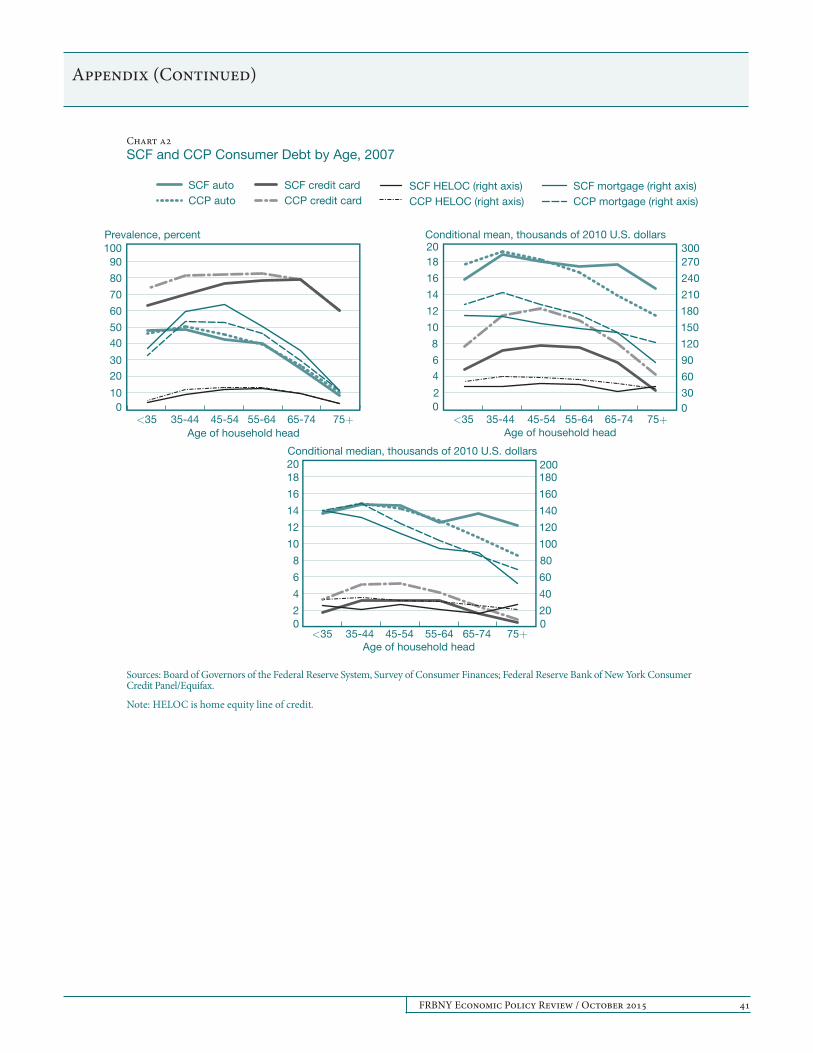
FRBNY Economic Policy Review / October 2015 41
Appendix (Continued)
010
2030
4050
60
70
80
90100
CCP credit card
SCF credit card
CCP auto
SCF auto
CCP HELOC rate
SCF HELOC rate
CCP mortgage
SCF mortgage
75+65-7455-6445-5435-44<35
Prevalence, percent
Conditional median, thousands of 2010 U.S. dollars
CCP credit card
SCF credit card
CCP auto
SCF auto
Conditional mean, thousands of 2010 U.S. dollars
PANEL A PANEL B
PANEL DPANEL C
CCP credit card
SCF credit card
CCP auto
SCF auto
75+65-7455-6445-5435-44<35
Sources: Board of Governors of the Federal Reserve System, Survey of Consumer Finances; Federal Reserve Bank of New York Consumer Credit Panel/Equifax.
Note: HELOC is home equity line of credit.
Age of household head Age of household head
Age of household head
CCP HELOC rate
SCF HELOC rate
CCP mortgage
SCF mortgage
CCP HELOC rate
SCF HELOC rate
CCP mortgage
SCF mortgage
Chart a2 SCF and CCP Consumer Debt by Age, 2007
75+65-7455-6445-5435-44<35
CCP autoSCF auto
CCP credit cardSCF credit card
CCP mortgage (right axis)SCF mortgage (right axis)
CCP HELOC (right axis)SCF HELOC (right axis)
02
46
8
10
12
14
16
1820
02
4
6
8
10
12
14
16
1820
020
40
60
80
100
120
140
160
180200
030
60
90
120
150
180
210
240
270300
42 Do We Know What We Owe?
References
Antoniewicz, R. L. 2000. “A Comparison of the Household Sector from the Flow of Funds Accounts and the Survey of Consumer Finances.” Board of Governors of the Federal Reserve System Occasional Staff Studies working paper.
Avery, R. B., G. E. Elliehausen, and A. B. Kennickell. 1988. “Measuring Wealth with Survey Data: An Evaluation of the 1983 Survey of Consumer Finances.” Review of Income and Wealth 34, no. 4: 339–69.
Avery, R. B., P. S. Calem, G. B. Canner, and R.W. Bostic. 2003. “An Overview of Consumer Data and Credit Reporting.” Federal Reserve Bulletin 89, no. 2 (February): 47-73.
Bertaut, C., M. Haliassos, and M. Reiter. 2009. “Credit Card Debt Puzzles and Debt Revolvers for Self Control.” Review of Finance 13, no. 4: 657-92.
Board of Governors of the Federal Reserve System. 2007. Survey of Consumer Finances Chartbook.
Board of Governors of the Federal Reserve System. 2010. “Report to the Congress on the Use of Credit Cards by Small Businesses and the Credit Card Market for Small Businesses.” May. Available at http://www.federalreserve.gov/BoardDocs/RptCongress/smallbusinesscredit/smallbusinesscredit.pdf.
Bound, J. 2001. “Measurement Error in Survey Data.” In J. Heckman and E. Leamer, eds., Handbook of Econometrics. Vol. 5. Amsterdam: Elsevier.
Bricker, J., A. B. Kennickell, K. B. Moore, and J. Sabelhaus. 2012. “Changes in U.S. Family Finances from 2007 to 2010: Evidence from the Survey of Consumer Finances.” Federal Reserve Bulletin 98, no. 2 (February): 1-80.
Bruine de Bruin, W., W. van der Klaauw, J. S. Downs, B. Fischhoff, G. Topa, and O. Armantier. 2010. “Expectations of Inflation: The Role of Financial Literacy and Demographic Variables.” Journal of Consumer Affairs 44, no. 2 (Summer): 381-402.
Bucks, B. K., A. B. Kennickell, T. L. Mach, and K. B. Moore. 2009. “Changes in U.S. Family Finances from 2004 to 2007: Evidence from the Survey of Consumer Finances.” Federal Reserve Bulletin 95 (February): A1-A55.
Bucks, B. K., and K. M. Pence. 2008. “Do Borrowers Know Their Mortgage Terms?” Journal of Urban Economics 64, no. 2: 218-33.
Cagetti, M., and M. DeNardi. 2006. “Entrepreneurship, Frictions, and Wealth.” Journal of Political Economy 114, no. 5 (October): 835-70.
—— . 2008. “Wealth Inequality: Data and Models.” Macroeconomic Dynamics 12, no. S2: 285-313.
Castañeda, A., J. Díaz-Giménez, J. V. Ríos-Rull. 2003. “Accounting for Wealth and Income Inequality.” Journal of Political Economy 111, no. 4 (August): 818-57.
Chopra, R. 2012. “Too Big to Fail: Student Debt Hits a Trillion.” Consumer Financial Protection Bureau blog. Available at http://www.consumerfinance.gov/blog/too-big-to-fail-student-debt-hits-a-trillion (last visited August 29, 2013).
Cohen-Cole, E., B. Duygan-Bump, and J. Montoriol-Garriga. 2009. “Forgive and Forget: Who Gets Credit after Bankruptcy and Why.” Federal Reserve Bank of Boston Working Paper no. QAU09-2, July.
Cox, D., and T. Jappelli. 1993. “The Effect of Borrowing Constraints on Consumer Liabilities.” Journal of Money, Credit, and Banking 25, no. 2 (May): 197-213.
Davies, J. B., and A. F. Shorrocks. 1999. “The Distribution of Wealth.” In A. B. Atkinson and F. Bourguignon, eds., Handbook of Income Distribution. Vol. 1. Amsterdam: Elsevier.
De Nardi, M. 2004. “Wealth Inequality and Intergenerational Links.” Review of Economic Studies 71, no. 3 (July): 743-68.
Federal Reserve Bank of New York. 2011. Quarterly Report on Household Debt and Credit. August.
Fissel, G. S., and T. Jappelli. 1990. “Do Liquidity Constraints Vary over Time? Evidence from Survey and Panel Data: Note.” Journal of Money, Credit, and Banking 22, no. 2 (May): 253-62.
FRBNY Economic Policy Review / October 2015 43
References (Continued)
Gokhale, J., L. J. Kotlikoff, J. Sefton, and M. Wheale. 2001. “Simulating the Transmission of Inequality across Generations.” Journal of Public Economics 79, no. 1 (January): 93-128.
Gross, D., and N. Souleles. 2002a. “Do Liquidity Constraints and Interest Rates Matter for Consumer Behavior? Evidence from Credit Card Data.” Quarterly Journal of Economics 117, no. 1 (February): 149–85.
—— . 2002b. “An Empirical Analysis of Personal Bankruptcy and Delinquency.” Review of Financial Studies 15, no. 1 (Spring): 319-347.
Han, S., and G. Li. 2011. “Household Borrowing after Personal Bankruptcy.” Journal of Money, Credit, and Banking 43, no. 2-3 (March-April): 491-517.
Hunt, R. M. 2002. “What’s in the File? The Economics and Law of Consumer Credit Bureaus.” Federal Reserve Bank of Philadelphia Business Review. Second Quarter: 17–24.
Iacoviello, M. 2008. “Household Debt and Income Inequality, 1963–2003.” Journal of Money, Credit, and Banking 40, no. 5 (August): 929–65.
Jacob, K., and R. Schneider. 2006. Market Interest in Alternative Data Sources and Credit Scoring. Center for Financial Services Innovation. December.
Jappelli, T. 1990. “Who Is Credit Constrained in the U. S. Economy?” Quarterly Journal of Economics 105, no. 1: 219-34.
Jappelli, T., J. S. Pischke, and N. S. Souleles. 1998. “Testing for Liquidity Constraints in Euler Equations with Complementary Data Sources.” Review of Economics and Statistics 80, no. 2 (February): 251-62.
Johnson, B., and K. Moore. 2005. “Consider the Source: Differences in Estimates of Income and Wealth from Survey and Tax Data.” Board of Governors of the Federal Reserve System Occasional Staff Studies working paper.
Johnson, K. W. 2007. “The Transactions Demand for Credit Cards.” B.E. Journal of Economic Analysis and Policy 7, no. 1 (March): Article 16.
Johnson, K. W., and G. Li. 2009. “Household Liability Data in the Consumer Expenditure Survey.” Monthly Labor Review 132, no. 12 (December): 18-27.
—— . 2010. “The Debt-Payment-to-Income Ratio as an Indicator of Borrowing Constraints: Evidence from Two Household Surveys.” Journal of Money, Credit, and Banking 42, no. 7 (October): 1373-90.
Karlan, D., and J. Zinman. 2008. “Lying About Borrowing.” Journal of the European Economic Association 6, no. 2-3 (April-May): 510–21.
Keister, L. A. 2000. Wealth in America: Trends in Wealth Inequality. Cambridge: Cambridge University Press.
Kennickell, A. B. 1991. “Imputation of the 1989 Survey of Consumer Finances,” Proceedings of the Section on Survey Research Methods. 1990 Joint Statistical Meetings, Atlanta, Georgia.
—— . 1998. “Multiple Imputation in the Survey of Consumer Finances.” Board of Governors of the Federal Reserve System Occasional Staff Studies working paper. Available at http://www.federalreserve.gov/pubs/oss/oss2/method.html.
Keys, B. J. 2010. “The Credit Market Consequences of Job Displacement.” Board of Governors of the Federal Reserve System Finance and Economics Discussion Series, no. 24, March.
Kiyotaki, N., A. Michaelides, and K. Nokolov. 2011. “Winners and Losers in Housing Markets.” Journal of Money, Credit, and Banking 43, no. 2-3 (March-April): 255–96.
Kreider, R. M., and D. B. Elliott. 2009. “America’s Families and Living Arrangements: 2007.” Current Population Reports. U.S. Bureau of the Census, September.
Lee, D., and W. van der Klaauw. 2010. “An Introduction to the FRBNY Consumer Credit Panel.” Federal Reserve Bank of New York Staff Reports, no. 479, November.
Lusardi, A., and P. Tufano. 2009. “Debt Literacy, Financial Experiences, and Overindebtedness.” NBER Working Paper no. 14808, March.
44 Do We Know What We Owe?
References (Continued)
Mazar, N., O. Amir, and D. Ariely. 2008. “The Dishonesty of Honest People: A Theory of Self-Concept Maintenance.” Journal of Marketing Research 45, no. 6 (December): 633-44.
Meier, S., and C. Sprenger. 2010. “Present-Biased Preferences and Credit Card Borrowing.” American Economic Journal: Applied Economics 2, no. 1 (January): 193–210.
Scholz, J. K., and A. Seshadri. 2009. “The Assets and Liabilities Held By Low-Income Families.” In R. Blank and M. Barr, eds., Insufficient Funds. New York: Russell Sage Foundation.
Sierminska, E., P. C. Michaud, and S. Rohwedder. 2008. “Measuring Wealth Holdings of Older Households in the U.S.: A Comparison using the HRS, PSID, and SCF.” Paper presented at the Pensions, Private Accounts, and Retirement Savings over the Life Course workshop, Ann Arbor, Michigan. Available at http:// psidonline.isr.umich.edu/Publications/Workshops/2008/ LC/MRS_WealthCompsv10.pdf.
Sullivan, J. X. 2008. “Borrowing during Unemployment: Unsecured Debt as a Safety Net.” Journal of Human Resources 43, no. 2 (Spring): 383-412.
Telyukova, I. 2008. “Household Need for Liquidity and the Credit Card Debt Puzzle.” University of California at San Diego Economics Working Paper Series, December.
Telyukova, I., and R. Wright. 2008. “A Model of Money and Credit, with Application to the Credit Card Debt Puzzle.” Review of Economic Studies 75, no. 2 (April): 629–47.
U.S. Bureau of the Census. 2010. “Projections of the Number of Households and Families in the United States: 1995 to 2010.” Current Population Reports, no. P25-1129.
U.S. Department of Education. 2011. FY 2011 Federal Student Aid Annual Report. November.
Wolff, E. N. 1992. “Changing Inequality of Wealth.” American Economic Review 82, no. 2 (May): 552-8.
Zinman, J. 2007. “Household Borrowing High and Lending Low under No-Arbitrage.” Dartmouth College working paper.
—— . 2009. “Where is the Missing Credit Card Debt?” Review of Income and Wealth 55, no. 2 (June): 249-65.
The views expressed are those of the authors and do not necessarily reflect the position of the Federal Reserve Bank of New York or the Federal Reserve System. The Federal Reserve Bank of New York provides no warranty, express or implied, as to the accuracy, timeliness, completeness, merchantability, or fitness for any particular purpose of any information contained in documents produced and provided by the Federal Reserve Bank of New York in any form or manner whatsoever.