Embed Size (px)
Citation preview
PSNP PLUS
LINKING POOR RURAL HOUSEHOLDS TO MICROFINANCE AND MARKETS
Impact Assessment of Microfinance Honey and Crop Value Chain Interventions
Final Impact Assessment of the PSNP Plus in Doba Woreda September 2011
John Burns and Solomon Bogale
! "#$ "#%&'(()&)*)+!&,(*-.,(!/-& &0(&1"2)(3"#+#2.&+#/&1+)$.0- & &
!"#$%&'()!"($**+(%&(+,+-#(")!%*$%-('+-.,-)"(/+*0($+*.,1)%2"(3-/")4(&")($+*'+-0(
566785699(
'-#'&!"#$&

2
3
Acknowledgements The PSNP Plus Program “Linking Poor Rural Households to Microfinance and Markets in Ethiopia’ was funded by the United States Agency for International Development (USAID). The Program was led by CARE, and implemented by CARE, Save the Children (UK), Catholic Relief Services (CRS) and partners, and the Relief Society of Tigray (REST). The Netherlands Development Organizations (SNV) and the Feinstein International Center at Tufts University provided technical support to the implementing partners. The authors would like to acknowledge the members of the research team; Tesfaye Disasa, Abdisa Hatewu, Habib Abu and Sinan Olani. We would also like to thank the CARE office in West Hararghe for supporting the assessment. In particular we would like to thank Lulu Taye, Wubeshet Demissie and Zerihun Dibabe. Special thanks to CARE community facilitators, Samrawit Dagnachew, Getachew Fikadu, Senait Alemayehu, Senait Haile, Temane Alemayehu, Murad Ayub and Abduleziz Ahmed. We would also like to thank the community development agents and assessment participants for their support and valuable contributions to the research, and for their wonderful hospitality. We would also like to thank Jay Banjade and Yetnayet Girma from CARE Ethiopia for their support. This report and the associated study were made possible by the generous support of the American people through the United States Agency for International Development (USAID). The contents are the responsibility of CARE and its PSNP PLUS partners and do not necessarily reflect the views of USAID or the United States Government. The content of this report is derived from research carried out by the Feinstein International Center, Tufts University under the USAID funded PSNP Plus project. The contents of this report have not been endorsed by the other PSNP Plus partners, and do not necessarily reflect the views of these organizations.
4
CONTENTS SUMMARY .............................................................................................................................................. 7 1. INTRODUCTION ........................................................................................................................... 10
1.1 Background to the PSNP Plus Program ..................................................................................... 10 1.2 PSNP Plus Overview .................................................................................................................. 11 1.3 Background to the Study in Doba ............................................................................................... 14
1.3.1 Study Area General Characteristics .................................................................................... 14 1.3.2 PSNP Plus Interventions in Doba ........................................................................................ 14
2. ASSESMENT METHODOLOGY ................................................................................................... 16 2.1 Study Design ........................................................................................................................... 16
2.1.1 Research Questions ........................................................................................................ 16 2.1.2 Study Components .............................................................................................................. 16 2.1.3 Indicator Selection ............................................................................................................... 17
2.2 Sampling ................................................................................................................................. 17 2.2.1 Method and Size .............................................................................................................. 17 2.2.2 Study Locations ............................................................................................................... 18
2.3 Data Collection Methods ......................................................................................................... 19 2.3.1 Household Interviews ...................................................................................................... 19 2.3.2 Focus Group Methods ......................................................................................................... 20
2.4 Data Analysis .......................................................................................................................... 20 3. RESULTS ...................................................................................................................................... 21
3.1 Context and Background ......................................................................................................... 21 3.2 Income ........................................................................................................................................ 24
3.2.1 Income Sources ................................................................................................................... 24 3.3 Expenditure ............................................................................................................................. 26
3.4 Credit and Savings ...................................................................................................................... 28 3.5 Asset Levels and Changes ......................................................................................................... 32
3.5.1 Land Holdings ...................................................................................................................... 32 3.5.2 Livestock holdings ............................................................................................................... 33 3.5.3 Productive Assets/Tools ...................................................................................................... 35 3.5.4 Household Items .................................................................................................................. 36
3.6 Changes in Household Food Security ......................................................................................... 38 3.7 Value Chain Production and Sales ............................................................................................. 39 3.8 Scoring of Project Benefits .......................................................................................................... 42 3.9 Strengths and Weaknesses of Program Interventions ................................................................ 46
4. DISCUSSION .................................................................................................................................... 49 4.1 Methodological Issues ................................................................................................................. 49 4.2 Changes in Household Income and Expenditure ........................................................................ 49
4.2.1 Income Sources ................................................................................................................... 49 4.2.2 Actual Income and Expenditure ........................................................................................... 50
4.3 Changes in Access to Microfinance ............................................................................................ 51 4.4 Changes in Assets ...................................................................................................................... 51
4.4.1 Land Holdings ...................................................................................................................... 51 4.4.2 Livestock Holdings ............................................................................................................... 52 4.4.3 Productive Assets and Household Items ............................................................................. 52
4.5 Changes in Food Security ........................................................................................................... 53 4.6 Utilization of Project Derived Income and Credit ......................................................................... 53
4.6.1 Savings and Loan Utilization ............................................................................................... 53 4.6.2 Utilization of Income from White Pea Bean and Honey Sales ............................................. 54
4.7 Other Program Benefits .............................................................................................................. 54 CONCLUSION ....................................................................................................................................... 55 ANNEXES ............................................................................................................................................. 60
Annex I Community Wealth Indicators in Doba ................................................................................. 60 Annex II Household Checklist ........................................................................................................... 61
5
List of Tables Table 1: Value chain outputs under PSNP Plus .................................................................................... 13 Table 2 Sampling frame and actual sample .......................................................................................... 17 Table 3: Final assessment coverage ..................................................................................................... 18 Table 4 Summary of household questionnaire themes and methods ................................................... 19 Table 5: Recent Food Security and Livelihoods Interventions in Doba ................................................. 21 Table 6 Time-line of PSNP and other related interventions in Doba ..................................................... 22 Table 7: Characteristics and background data on assessment participants ......................................... 23 Table 8: Factors Contributing to PSNP Graduation ............................................................................... 23 Table 9: Total Expenditure Before and After ......................................................................................... 27 Table 10 Matrix scoring of microfinance service providers .................................................................... 29 Table 11: Value of savings and loans by source ................................................................................... 29 Table 12: Changes in land holdings ...................................................................................................... 32 Table 13: Livestock sales and mortality 2010-2011 .............................................................................. 34 Table 14 Food Security Calendar (n=15 groups) .................................................................................. 38 Table 15 Factors contributing to improvements in food security ........................................................... 38 Table 16 White pea bean sales ............................................................................................................. 39 Table 17: Honey sales ........................................................................................................................... 40 Table 18: Factors contributing to an increase in income ....................................................................... 44 Table 19: Scoring of other project outcomes (WPB participants) .......................................................... 44 Table 20: Scoring of other project outcomes (Honey participants) ........................................................ 45 Table 21 SWOT analysis of Village Saving and Loan Associations ...................................................... 46 Table 22 SWOT analysis of the White Pea Bean Value Chain ............................................................. 47 Table 23 SWOT analysis of the Honey Value Chain ............................................................................. 48 List of Figures Figure 1: Changes in relative contributions of different income sources (Old) ...................................... 24 Figure 2: Changes in relative contributions of different income sources (New) .................................... 24 Figure 3: Changes in relative contributions of different income sources (Honey) ................................. 25 Figure 4: Expenditure on Key Items (Old) ............................................................................................. 26 Figure 5: Expenditure on Key Items (New) ............................................................................................ 26 Figure 6: Expenditure on Key Items (Honey) ........................................................................................ 27 Figure 7: Savings & Loans Sources (2008 and 2011) ........................................................................... 28 Figure 8: Utilization of savings and credit .............................................................................................. 30 Figure 9 Comparison of loan utilization and total expenditure on key items (WPB) .............................. 31 Figure 10 Comparison of loan utilization and total expenditure on key items (Honey) ......................... 32 Figure 11: Changes in livestock holdings (Old) ..................................................................................... 33 Figure 12: Changes in livestock holdings (New) ................................................................................... 33 Figure 13: Changes in livestock holdings (Honey) ................................................................................ 34 Figure 14: Changes in productive assets (Old) ..................................................................................... 35 Figure 15: Changes in productive assets (New) .................................................................................... 35 Figure 16: Changes in productive assets (Honey) ................................................................................ 36 Figure 17: Changes in household items (Old) ....................................................................................... 36 Figure 18: Changes in household items (New) ..................................................................................... 37 Figure 19: Changes in household items (Honey) .................................................................................. 37 Figure 20: Changes in white pea bean sales 2008-2010 ...................................................................... 39 Figure 21: Utilization of income from white pea bean sales (2010 Harvest) ......................................... 40 Figure 22: Changes in honey sales 2008-2010 ..................................................................................... 40 Figure 23: Utilization of income from honey sales (2010 harvest) ......................................................... 41 Figure 24: Factors contributing to an increase in livestock holdings (WPB) .......................................... 42 Figure 25: Factors contributing to an increase in livestock holdings (Honey) ....................................... 42 Figure 26: Factors contributing to an increase in ‘other’ assets (WPB) ................................................. 43 Figure 27: Factors contributing to an increase in ‘other’ assets (Honey) .............................................. 43
6
Acronyms and Abbreviations ACSI Amhara Credit and Saving Institute Agric. Inputs Farming Inputs CARE Cooperative for Assistance and Relief Everywhere CI Confidence Interval CRS Catholic Relief Services DA Development Agent DECSI Dedebit Credit and Saving Institution DPPA Disaster Preparedness and Prevention Agency ETB Ethiopian Birr FGD Focus Group Discussion FSP Food Security Program GRAD Graduation with Resilience to Achieve Sustainable Graduation GFDRE Government of the Federal Democratic Republic of Ethiopia HABP Household Asset Building Program HH Household HI Home Improvement Honey Honey sample IGA Income Generating Activity Kg Kilogram LIS Longitudinal Impact Study LIU Livelihoods Information Unit (DPPA) MDTCS Micro Development Training and Consultancy Services MFI Micro Finance Institute MoARD Ministry of Agriculture and Rural Development NGO Non Governmental Organization New New (VSLA) and white pea bean sample OCSSCO Oromia Credit and Saving Share Company OFSP Other Food Security Programs Old Old (VSLA) and white pea bean sample PA Peasant Association (administrative unit) P. Trade/IGA Petty Trade/Income Generating Activities PSNP Productive Safety Net Program PSNP-PIM PSNP Program Implementation Manual PSNP Plus Linking Poor Rural Households to Microfinance & Markets (Program) REST Relief Society of Tigray RFA Request for Applications SCUK Save the Children Fund (UK) SR Small Ruminants SNV Netherlands Development Organization Social. Oblig Social Obligations (wedding/funeral contributions etc) SPSS Statistics Package for Social Sciences SWOT (analysis) Strengths, Weaknesses, Opportunities, Threats USAID United States Agency for International Development VSLA Village Savings and Lending Association WPB White Pea Beans
7
SUMMARY
The USAID funded PSNP Plus program ‘Linking Poor Rural Households to Microfinance and Markets in Ethiopia’ was launched in late 2008 and will run until December 2011. The PSNP Plus was designed as a three-year program in support of the Government of Ethiopia’s Productive safety Net Program (PSNP) which provides food and or cash to chronically food insecure households in exchange for labor on rural infrastructure projects, or direct transfers to households unable to participate in physical labor activities. A consortium of international and national Non Governmental Organizations led by CARE is implementing the program. The program was initially implemented in nine pilot woredas’ in Tigray, Amhara, Oromia and Dire Dawa regional states, with the overall goal of building household resilience and household assets through market linkages and access to microfinance. This goal is directly linked to the objective of facilitating the graduation of households from the PSNP and out of chronic food insecurity. Since it was launched, the program has been linking PSNP households to both formal and informal microfinance. These interventions have included the establishment of Village Saving and Loan Associations, and the provision of credit for agricultural inputs. Complementary to these activities, the program has been linking participating households to market opportunities by supporting the development of livestock, cereal, white pea bean and honey value chains. Ultimately, the combination of the programs microfinance and value chain interventions is expected to contribute towards livelihoods diversification, household resilience, and an increase in household income and assets with associated improvements in PSNP graduation. These outcomes and impacts are reflected in the programs causal model, which in summary proposes that increased access to markets and the enhanced use of microfinance leads to asset accumulation and improvements in PSNP graduation. In order to test this causal logic, a longitudinal impact study (LIS) was included under one of the programs strategic objectives. The LIS included a baseline mid-term and final impact assessment in four of the program study areas. This report presents the results from the final impact assessment of the program in Doba woreda, implemented by CARE. The study in Doba was designed to assess the programs Village Saving and Loan Association (VSLA), white pea bean and honey value chain interventions. The final assessment was carried out during the final year of the project from April to May 2011. A pre-post test design was used to assess changes in assets since the project started. However, the use of a control group of non-project participants was rejected for this particular case study. In the absence of a control, project attribution was assessed using standardized participatory scoring exercises to determine the relative contribution of project factors to any assessed impact. The results show that there has been some positive impact on livelihoods since the mid term assessment in 2009. The results from the mid term assessment showed little to no impact on income or assets with a significant reduction in a number of key household assets. This was mostly due to rain-failure and a poor harvest in 2009, but also in part due to delays in project implementation. The final results suggest that people have to some extent recovered from the impact of the failed harvest in 2009 and the program has contributed towards this recovery. Across the three samples assessed, between 66-70% of participants reported an increase in actual income since the project started. Although this mostly had to do with non-project factors, interventions such as the VSLA component and the honey and white pea bean value
8
chains did contribute to this increase in income. Overall however, the potential income benefits from the honey and white pea bean value chain interventions have yet to be realized. For example the results show that honey sales from the 2010 harvest only translated into 268 Ethiopian birr (mean value) for assessment participants in the honey value chain. Similarly, income from white pea bean sales from the 2010 harvest translated into between 140-142 Ethiopian birr (mean value) for respondents in this value chain. As such participants scored value chain income lower than all other project benefits assessed. Nonetheless, income from the sale of value chain products was utilized on a variety of livelihoods investments including education, food, and clothes, livestock purchases and farming inputs. The results also show that there has been a significant increase in the overall contribution of income from white pea bean sales relative to other income sources for participants in this value chain suggesting that the project has helped improve household resiliency through livelihoods diversification. The findings show both positive and negative changes in physical and financial assets such as land, livestock and productive assets (tools). For example, a significant increase in modern beehives was observed for participants in the honey value chain, which can be directly attributed to project related value chain transfers. There has also been a significant increase in certain types of farming tools and a significant decrease for other types of tools. Where an increase in productive assets and household items was reported, participants scored the projects VSLA component as a major factor contributing to this increase. The honey value chain participants also scored the honey value chain as somewhat important in contributing towards this increase. The results also show a significant decrease in specific types of livestock holdings and no significant increase. On one level this result is quite discouraging as livestock are considered a key indicator of wealth and resiliency in the study area. However, when analyzed in the context of the midterm results the overall picture is not quite as alarming. The midterm results showed a significant decrease in livestock assets against the baseline as people sold their livestock to compensate for the income and production losses associated with the rain and harvest failure in 2009. The final results therefore show a decrease in livestock against pre-project levels, but a slight increase against the 2009 levels. Although this increase has not been statistically significant, between 45-58% of assessment participants reported an increase in livestock assets since 2009. Although the value chains only played a minor contribution towards this increase, the projects VSLA component was scored as major contributing factor. The results show no change in land holdings for the participants in the white pea bean sample, and a significant decrease for honey participants. Land size is typically measured as the amount of land cultivated by a household, and this is determined by factors such as household labor capacity and access to draft animals. Therefore, the main reasons for this decrease is that less land is actually being utilized than before due to the lack of draft animals, as well as the subdivision of land for participants children. Consistent with this the midterm results showed a significant decrease in oxen for the honey value chain sample. The project has also been instrumental in linking participants to formal microfinance although formal credit still represents a fairly low percentage of overall credit in comparison to other sources. The projects informal microfinance component on the other hand seems to have had a considerable impact on asset accumulation and household resiliency. As mentioned, where an increase in assets was reported, the projects VSLA component was scored as a major contributing factor. Similarly, of the factors contributing to an overall increase in household income, the VSLA component scored significantly higher than either of the project value chains. Across the different samples assessed, the combination of credit and savings for the
9
past year ranged between Ethiopian Birr 582-725 (mean value) allowing for investments in a variety of livelihoods assets and income generating activities such as livestock, education and petty trade. Investments in livestock from savings and loans represents between 24-54% of total expenditure on livestock for the past year suggesting that the projects microfinance component has been important in contributing to the restocking and recovery process. Overall the project appears to have contributed to asset accumulation and improved resiliency to drought and other livelihoods shocks, with these being scored as important project benefits by assessment participants. The findings appear to suggest that the perceived impact of the projects microfinance component has been more encouraging than the marketing component, although this would strictly be in terms of asset and income accumulation, and not necessarily in terms of the skills and knowledge transfers derived from the value chain component. Furthermore this only reflects the short to medium term impact of the project, as value chain benefits would be expected to extend and even increase over successive production cycles. Although the project in Doba has faced a number of external and internal challenges such as the failed harvest in 2009 and delays in implementation, the findings from this case study indicate that the combination of microfinance and value chain interventions can contribute towards increased income and assets for PSNP households and help households recover from external livelihoods shocks. However, given the experience of the failed harvest in 2009, in all likelihood this trajectory would only be sustained in the absence of persistent and repetitive income and production related shocks.
10
1. INTRODUCTION
1.1 Background to the PSNP Plus Program
In recent years considerable progress has been made in addressing chronic food insecurity and the risk of repeated crisis in Ethiopia, much of this can be attributed to the Government of Ethiopia’s Food Security Program (FSP). The overall goal of the FSP is to attain food security for both chronically and transitory food insecure households in rural Ethiopia (MoARD, 2009). When it was launched in 2005, the program was built around three key components, a Productive Safety Net Program (PSNP), a Voluntary Resettlement Program and Other Food Security Programs (OFSP). Under the 2010-2015 FSP program, a Capital Intensive Community Infrastructure Component has been included, and the OFSP has been replaced with the Household Asset Building Program (HABP). The PSNP component of the FSP was specifically designed to assist chronically or ‘predictably’ food insecure households as opposed to households affected by transitory food deficits. The program provides either cash or food in exchange for labor on rural infrastructure projects, or direct cash and food transfers for households unable to participate in physical labor. The primary objectives of the PSNP are therefore to prevent chronically food insecure households from selling their assets during times of drought, and to build community assets through involving these households in public works programs (Pankhurst, 2009). In 2006 the PSNP provided support to an estimated 8.6 million people, making it the second largest social transfer program in Africa (Sabates-Wheeler and Devereux, 2010). Ultimately participating households are expected to ‘graduate’ from the PSNP and out of chronic food insecurity. However, although the PSNP has had a significant impact on smoothing consumption, and protecting the assets of the chronically food insecure (Sharp et al, 2006, Devereux et al, 2006), little progress has been made in terms of graduating households from the program (MoARD, 2009). Various definitions for graduation have been proposed, most of these involve the concept of households moving out of chronic food insecurity (for example see, PSNP-PIM, 2006, Slater et al, 2006, and Devereux et al, 2006). A PSNP graduation guidance note defines graduation as follows (MoARD, 2007: 2): “A household has graduated when, in the absence of receiving PSNP transfers, it can meet its food needs for all 12 months and is able to withstand modest shocks. This state is described as being food sufficient”. Essentially graduation involves a two-stage process: the first stage is graduation from the PSNP program, and the second stage involves graduation from the Food Security Program. In order for households to graduate it is recognized that they need to be linked to Other Food Security Programs that go beyond the PSNP food and cash safety net transfers (MoARD, 2006). The OFSP include interventions that provide credit and loans for agriculture as well as non-farm income generating activities, and the provision of ‘agricultural technologies’ such as extension services, and inputs (Gilligan et al, 2009). While the overall goal of the PSNP is to address food insecurity through household asset protection and community asset creation, the OFSP were designed to increase participant’s income from agricultural production, and build up household assets (Gilligan et al, 2009). In theory, this accumulation of income and assets enables households
11
to graduate from food insecurity and out of the PSNP. In recognition of this, and in support of the Government of Ethiopia’s FSP, in 2008, USAID issued a $ US 12,000,000 Request for Proposals (RFA) entitled “Linking Poor Rural Households to Microfinance and Markets in Ethiopia”. The RFA was launched with the objective of demonstrating that the “adoption of market –led livelihood options for the persistently poor through sustainable links to markets and microfinance services” results “in increased assets at the household level and therefore more resilient households” (USAID, 2008: 18). The RFA also suggests that the value chain approach be considered as an appropriate methodology for linking poor households to markets. More specifically, the RFA called for projects that would contribute to the following higher goals (USAID, 2008: 18-19): • Reduced food insecurity and improved resiliency in vulnerable households • Increased rural economic growth opportunities for the poor to diversify livelihoods • Demonstrate a new market-driven approach to poverty reduction in Ethiopia • Expanded adoption and scaling up of market-driven approaches by new actors such as
the Government of the Federal Democratic Republic of Ethiopia (GFDRE) • Improved access to microfinance services through a graduated assistance program
The RFA also required that proposals demonstrate how project results, outcomes, and the ‘replicability’ and sustainability of interventions would be measured and documented. Consistent with this, the RFA called for a preliminary causal model presenting the logic of how the project would achieve the desired outputs, outcomes and impacts, and how these would be measured (USAID, 2008). In response to the RFA, the PSNP Plus program was specifically designed to provide alternative and accelerated pathways to PSNP graduation for chronically food insecure households lacking access to other food security and microfinance interventions (PSNP Plus, 2008).
1.2 PSNP Plus Overview
The original PSNP Plus program was launched in late 2008 as a three-year program implemented by a consortium of six international and national NGO’s led by CARE. The program was initially implemented in nine pilot woredas’ in Tigray, Amhara, Oromia and Dire Dawa regional states. The program strategy is based on a push-pull causal model designed to link 42,414 participating households to microfinance and markets through the provision and integration of contextually relevant financial services and value chain interventions. The proposed causal model is based on the assumption that ‘improved linkages between poor households and commodity markets, plus enhanced use of microfinance services leads to asset accumulation at household level with associated improvements in PSNP graduation and resilience’ (CARE, 2008). Consistent with this causal logic, the overall program goal states that: “Targeted PSNP households’ resiliency improved and livelihood assets enhanced as a means towards achieving graduation.” In order to achieve this goal, the program strategy was structured around three interlinked objectives designed to bring immediate positive impact to participants (PSNP Plus, 2008). Objective 1: Targeted PSNP households have increased their financial assets as a result of access to financial products and services. Objective 2: Targeted PSNP households are engaged in functioning markets.
12
Objective 3: Government and private sector strategies show greater support for engaging PSNP participants in market-based activities.
Under the first objective, the program provides both formal and informal financial products and services such as credit and savings. Under the second objective, the program has been supporting value chain interventions in honey, white pea beans, cereals and livestock. The combination of these interventions was specifically designed to enable participants to enter markets and accumulate assets, with the expectation that after three years eighty percent of PSNP Plus households would meet the criteria for PSNP graduation (PSNP Plus, 2008).
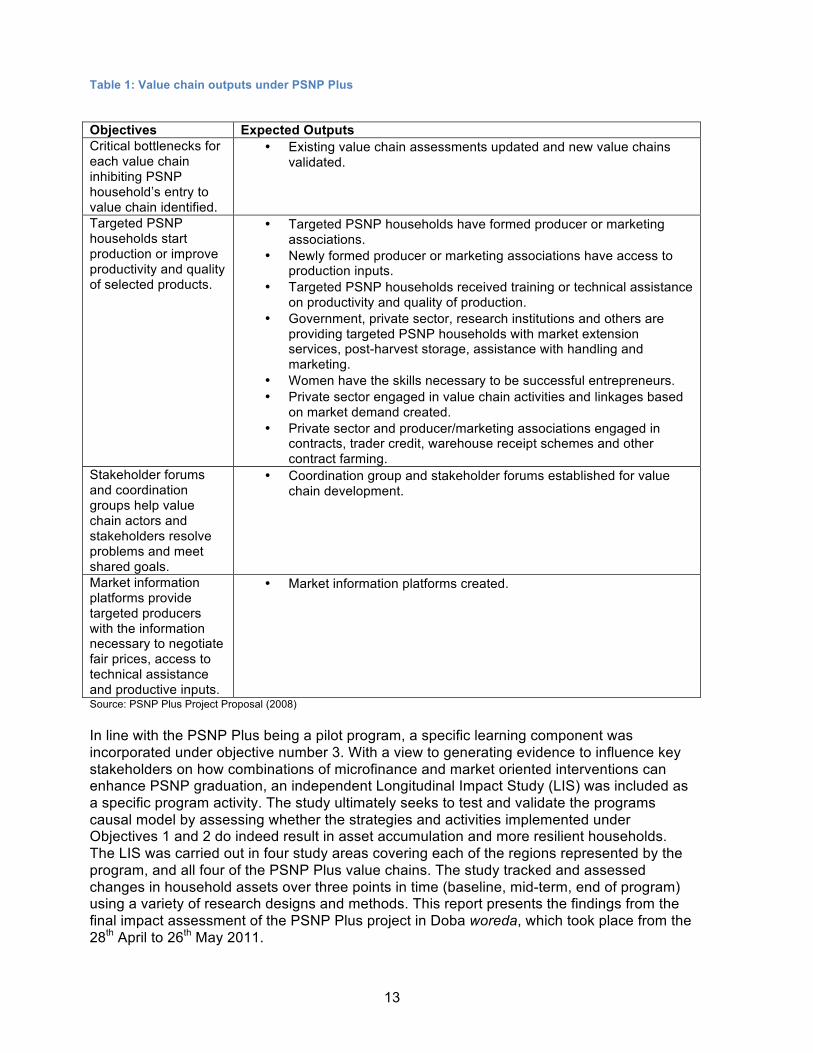
The provision of financial services is ultimately geared towards assisting people in building up assets by utilizing loans and savings to invest in high return productive and other income generating activities. For example, the program is designed to assist participants in securing loans for value chain inputs. In the absence of formal microfinance, the program has been promoting the establishment of Village Saving and Loan Associations (VSLA) based on the village agent model developed by CARE. This approach typically involves a group of between 10-25 members. The project provides training and resources to these groups to enable them to manage, maintain and increase their own financial assets such as savings and loans. Under the VSLA approach, members use their own cash resources to lend funds to one another, charge an acceptable interest rate, and re-lend funds on a rotating basis. The program strategy also involves using these groups as a vehicle to link members to formal microfinance. By demonstrating that group members’ financial literacy and knowledge on savings increases over time, the project aims to convince MFI’s to accept groups and individuals as clients. As such, the VSLA groups are intended as a catalyst to provide the linkage between informal and formal microfinance (MDTCS, 2010). Under the market linkage component, the program has been supporting four-commodity value chains viz. livestock, honey, white pea beans, and cereals. Among other criteria, the value chains were selected by consortium partners based on the anticipated production potential of these commodities in the project areas, income earning potential, and market potential in terms of demand and growth. The program aims to assist PSNP Plus participants in the production and marketing of these commodities. On the supply side, the objective of these interventions is not only to increase production, but also to improve the quality of these products with a view to adding to their market value. On the production side, the program provides technical support such as training, as well as certain types of specific inputs such as honey production accessories, livestock and improved seed varieties. The training components and transfer of inputs is facilitated through producer or marketing associations established under the program. The production side of the value chains is also complemented by the microfinance component, in that production inputs such as seeds, livestock and beehives are supplied to project participants on a credit basis from formal microfinance institutions such as Oromia Credit and Saving Share Company (OCSSCO), Dedebit Credit and Saving Institution (DECSI) and Amhara Credit and Saving Institution (ACSI). Under the market linkage component the program has been establishing facilities such as storage and collection centers to prevent spoilage and facilitate marketing, linking farmers to government extension services and the private sector, and establishing market information platforms. Table (1) gives a summary of the objectives and expected outputs of the value chain activities.
13
Table 1: Value chain outputs under PSNP Plus
Objectives Expected Outputs Critical bottlenecks for each value chain inhibiting PSNP household’s entry to value chain identified.
• Existing value chain assessments updated and new value chains validated.
Targeted PSNP households start production or improve productivity and quality of selected products.
• Targeted PSNP households have formed producer or marketing associations.
• Newly formed producer or marketing associations have access to production inputs.
• Targeted PSNP households received training or technical assistance on productivity and quality of production.
• Government, private sector, research institutions and others are providing targeted PSNP households with market extension services, post-harvest storage, assistance with handling and marketing.
• Women have the skills necessary to be successful entrepreneurs. • Private sector engaged in value chain activities and linkages based
on market demand created. • Private sector and producer/marketing associations engaged in
contracts, trader credit, warehouse receipt schemes and other contract farming.
Stakeholder forums and coordination groups help value chain actors and stakeholders resolve problems and meet shared goals.
• Coordination group and stakeholder forums established for value chain development.
Market information platforms provide targeted producers with the information necessary to negotiate fair prices, access to technical assistance and productive inputs.
• Market information platforms created.
Source: PSNP Plus Project Proposal (2008)
In line with the PSNP Plus being a pilot program, a specific learning component was incorporated under objective number 3. With a view to generating evidence to influence key stakeholders on how combinations of microfinance and market oriented interventions can enhance PSNP graduation, an independent Longitudinal Impact Study (LIS) was included as a specific program activity. The study ultimately seeks to test and validate the programs causal model by assessing whether the strategies and activities implemented under Objectives 1 and 2 do indeed result in asset accumulation and more resilient households. The LIS was carried out in four study areas covering each of the regions represented by the program, and all four of the PSNP Plus value chains. The study tracked and assessed changes in household assets over three points in time (baseline, mid-term, end of program) using a variety of research designs and methods. This report presents the findings from the final impact assessment of the PSNP Plus project in Doba woreda, which took place from the 28th April to 26th May 2011.
14
1.3 Background to the Study in Doba
1.3.1 Study Area General Characteristics Doba woreda is situated in West Hararghe; it is predominantly rural with only 1.5% of the estimated population of 126,840 being urban dwellers (Anon, 20101). The woreda is estimated to be over 700 square kilometers, the majority of the population is Muslim (86 %) and the primary language spoken is Oromiffa. The main livelihood strategies involve crop and livestock production, however elevations range from lowland to midland to highland, each with its own unique characteristics. The Livelihoods Information Unit (LIU) classifies three different livelihoods zones in the area; Sorghum, Maize and Chat Livelihood Zone, Wheat, Barley and Potato Livelihood Zone, and North East Agro Pastoralist Zone (DPPA, 2008). Although maps for the LIU Livelihoods were not available at the time of the baseline assessment, comparisons with the LIU profiles and the study findings suggest that the study area was limited to the first two livelihoods zones.
1.3.2 PSNP Plus Interventions in Doba
CARE Ethiopia has been implementing the PSNP Plus project in 33 out of the 40 Peasant Associations (PAs) in Doba. The project activities, which started in early 2009, fall under two complementary components, namely microfinance and value chains. Under the microfinance component the project in Doba aims to improve access to financial products and services by linking participants to formal microfinance institutions (MFI). Because no MFIs existed in Doba prior to the PSNP Plus project, the project has been working with the Oromia Credit and Savings Share Company (OCSSCO) to establish an office in Doba. Prior to this, the project worked with OCSSCO to provide credit services to PSNP Plus participants involved in the program’s value chain activities. The program has also been promoting informal microfinance based on the Village Saving and Loan Association (VSLA) model. This has involved supporting the establishment of new VSLA groups, and the re-training and strengthening of existing groups. Under the market linkage component the Doba project is supporting four commodity value chains, namely honey, white pea beans, cereals and livestock. Among other criteria, the value chains were selected by CARE and partners based on the anticipated production potential of these commodities in the project area, income earning potential, and market potential in terms of demand and growth. However, the cereal value chain was substituted for a small ruminant fattening value chain towards the end of 2010, based on recommendations from the mid term assessment. The project in Doba aims to assist PSNP Plus participants in the production and marketing of these commodities. On the production side the project has provided technical support including training, as well as specific inputs such as honey production accessories. The training components and transfer of inputs were facilitated through producer or marketing associations established by the project. The production side is complemented by the microfinance component, with production inputs such as seeds and beehives being supplied to project participants on a credit basis. These loans were provided by OCSCCO using a project credit guarantee fund.
1 Wikipedia
15
Market information systems and platforms have been established under the project in Doba, as have facilities such as storage and collection centers to prevent spoilage and facilitate marketing, as well as to link farmers to government extension services and the private sector.
16
2. ASSESMENT METHODOLOGY
2.1 Study Design
2.1.1 Research Questions The LIS was designed to test the programs causal model and validate whether improved linkages between poor households and commodity markets, plus enhanced use of microfinance leads to asset accumulation at the household level with associated improvements in PSNP graduation. In order to test this model, the final assessment in Doba tracked changes in household assets across three points in time (baseline, mid-term and final) using the same household participants for each stage of the study. The final assessment essentially set out to answer the following key research questions: 1. What changes in household assets has occurred since the project started? 2. What factors contributed to any assessed change in these assets? 3. What was the relative contribution of project factors to any assessed change? The study focused on measuring changes in physical and financial assets such as land, livestock and productive assets, these being benchmarks for PSNP graduation. The study in Doba focused on the programs white pea bean and honey value chains, with a specific emphasis on the informal microfinance (VSLA) activities. The study also assessed changes in income and the relative contribution of different income sources. This was done with a view to capturing the relative impact of the project value chains on household income, and to capture livelihoods diversification, which might be considered a useful proxy for resilience. Actual changes in certain key investments and expenditures were also measured as a proxy for real income, and to capture investments in livelihoods assets such as health, education, livestock and farming inputs. More specifically, the study measured actual project-derived income from both credit and savings, and value chain profits, and assessed the utilization of this income as an alternative way of measuring impact.
2.1.2 Study Components The assessment in Doba used a pre-post test design to assess livelihood changes of households participating in the programs VSLA, white pea bean and honey value chain interventions. For the purpose of the study, impact is broadly defined in terms of significant and measurable changes that have taken place since the program started that can at least in part be attributed to the programs microfinance and value chain interventions. The study also considers impact in terms of the utilization of project transfers such as credit and project derived income and the livelihoods investments and benefits obtained in relation to these. There were two main components to the final impact assessment in Doba, household interviews and focus group discussions. As implied, the household component used an individual household as the unit of analysis - the household also being the unit for PSNP
17
participation and graduation. The household component was designed to collect mostly quantitative data using a conventional questionnaire format, and including a number of standardized participatory assessment methods. For example, in the absence of a reliable control, attribution was assessed through the systematic application of participatory scoring methods as described by Catley et al, (2008). The focus group component was designed to collect mostly qualitative contextual data on the project activities, communities, and areas. The focus group discussions were structured around a set of standardized participatory assessment tools providing some complementary numerical data. A number of key informant interviews were also carried out. These were used to collect secondary data on the project and study area.
2.1.3 Indicator Selection The choice of indicators was largely based on PSNP graduation benchmarks at the time of the baseline assessment. A number of additional indicators were also collected during pre-baseline scoping visits to the study area. These included additional indicators on assets, sources of income, and common household expenditures. These indicators were then further refined during the pre-testing for the baseline assessment, and validated during the actual baseline study.
2.2 Sampling
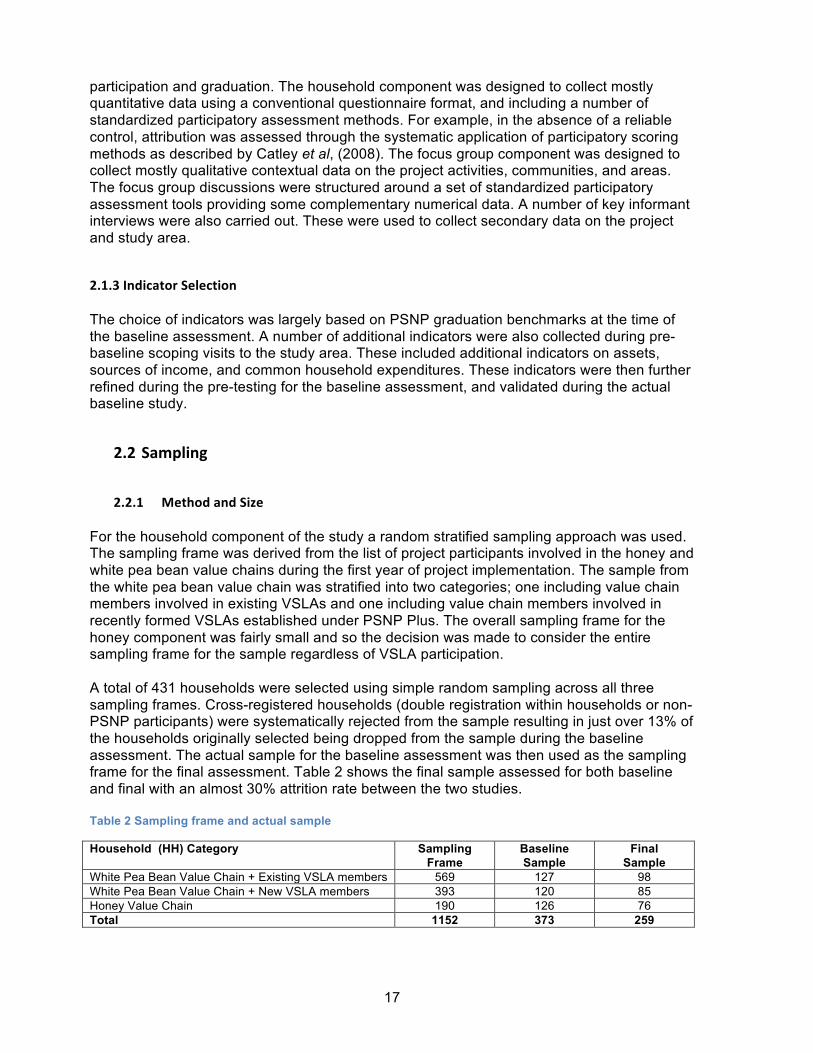
2.2.1 Method and Size For the household component of the study a random stratified sampling approach was used. The sampling frame was derived from the list of project participants involved in the honey and white pea bean value chains during the first year of project implementation. The sample from the white pea bean value chain was stratified into two categories; one including value chain members involved in existing VSLAs and one including value chain members involved in recently formed VSLAs established under PSNP Plus. The overall sampling frame for the honey component was fairly small and so the decision was made to consider the entire sampling frame for the sample regardless of VSLA participation. A total of 431 households were selected using simple random sampling across all three sampling frames. Cross-registered households (double registration within households or non-PSNP participants) were systematically rejected from the sample resulting in just over 13% of the households originally selected being dropped from the sample during the baseline assessment. The actual sample for the baseline assessment was then used as the sampling frame for the final assessment. Table 2 shows the final sample assessed for both baseline and final with an almost 30% attrition rate between the two studies. Table 2 Sampling frame and actual sample
Household (HH) Category Sampling Frame
Baseline Sample
Final Sample
White Pea Bean Value Chain + Existing VSLA members 569 127 98 White Pea Bean Value Chain + New VSLA members 393 120 85 Honey Value Chain 190 126 76 Total 1152 373 259
18
The three categories are hereafter summarized in this report as “Old” (white pea bean + existing VSLA), “New” (white pea bean + newly established VSLA), and “honey” (honey value chain). A total of 82 focus group discussions were carried out over the course of the study. Participants were largely selected based on participation in the programs VSLA activities. The focus groups typically excluded participants involved in the household component although over time some contamination might be expected. Participation in the focus groups was voluntary and although no attempt was made to systematically quantify the actual number of participants, this ranged from a minimum of six people per discussion, to over thirty. Focus group participants included an unspecified number of participants from all three of the project’s value chains (honey, white pea beans, and cereals).
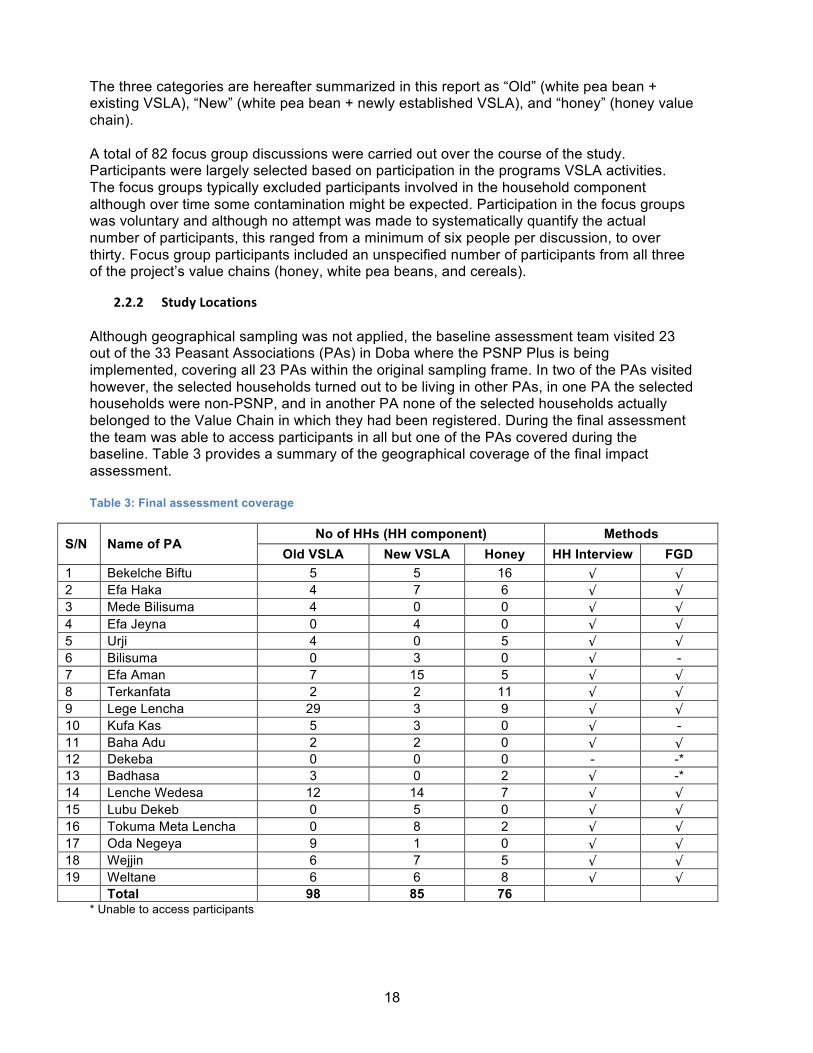
2.2.2 Study Locations Although geographical sampling was not applied, the baseline assessment team visited 23 out of the 33 Peasant Associations (PAs) in Doba where the PSNP Plus is being implemented, covering all 23 PAs within the original sampling frame. In two of the PAs visited however, the selected households turned out to be living in other PAs, in one PA the selected households were non-PSNP, and in another PA none of the selected households actually belonged to the Value Chain in which they had been registered. During the final assessment the team was able to access participants in all but one of the PAs covered during the baseline. Table 3 provides a summary of the geographical coverage of the final impact assessment. Table 3: Final assessment coverage
S/N Name of PA No of HHs (HH component) Methods
Old VSLA New VSLA Honey HH Interview FGD 1 Bekelche Biftu 5 5 16 √ √ 2 Efa Haka 4 7 6 √ √ 3 Mede Bilisuma 4 0 0 √ √ 4 Efa Jeyna 0 4 0 √ √ 5 Urji 4 0 5 √ √ 6 Bilisuma 0 3 0 √ - 7 Efa Aman 7 15 5 √ √ 8 Terkanfata 2 2 11 √ √ 9 Lege Lencha 29 3 9 √ √ 10 Kufa Kas 5 3 0 √ - 11 Baha Adu 2 2 0 √ √ 12 Dekeba 0 0 0 - -* 13 Badhasa 3 0 2 √ -* 14 Lenche Wedesa 12 14 7 √ √ 15 Lubu Dekeb 0 5 0 √ √ 16 Tokuma Meta Lencha 0 8 2 √ √ 17 Oda Negeya 9 1 0 √ √ 18 Wejjin 6 7 5 √ √ 19 Weltane 6 6 8 √ √ Total 98 85 76
* Unable to access participants
19
2.3 Data Collection Methods
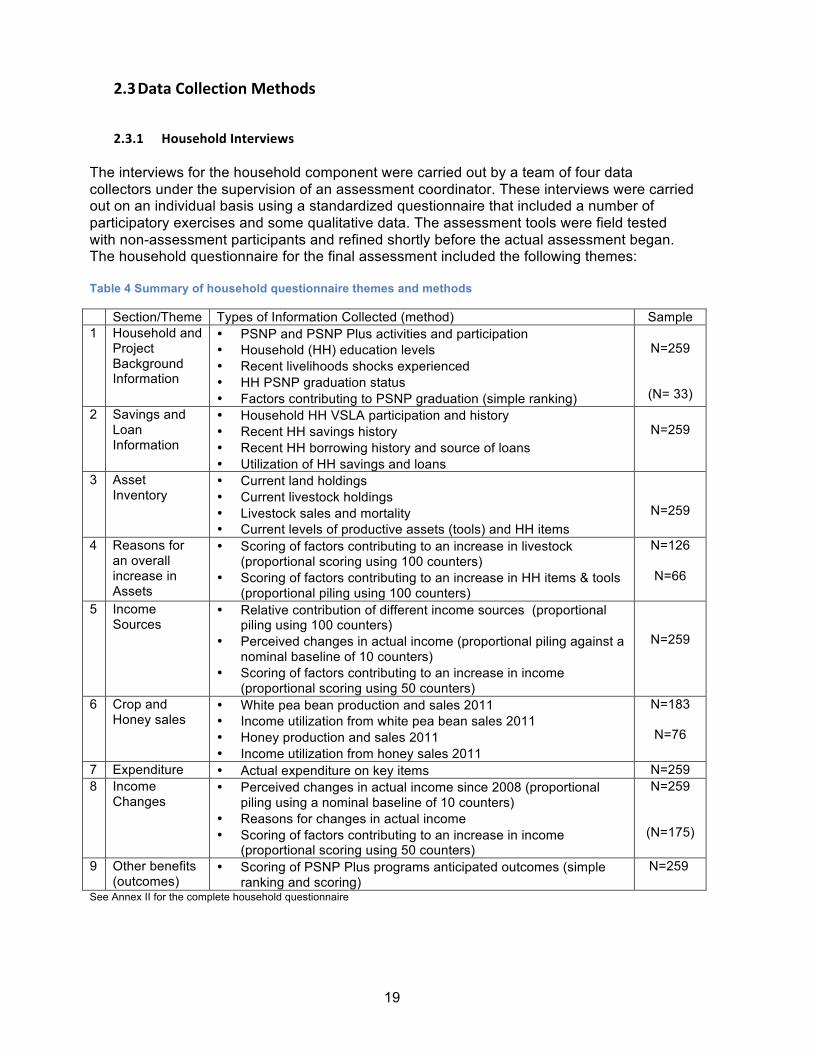
2.3.1 Household Interviews The interviews for the household component were carried out by a team of four data collectors under the supervision of an assessment coordinator. These interviews were carried out on an individual basis using a standardized questionnaire that included a number of participatory exercises and some qualitative data. The assessment tools were field tested with non-assessment participants and refined shortly before the actual assessment began. The household questionnaire for the final assessment included the following themes: Table 4 Summary of household questionnaire themes and methods
Section/Theme Types of Information Collected (method) Sample 1 Household and
Project Background Information
• PSNP and PSNP Plus activities and participation • Household (HH) education levels • Recent livelihoods shocks experienced • HH PSNP graduation status • Factors contributing to PSNP graduation (simple ranking)
N=259
(N= 33) 2 Savings and
Loan Information
• Household HH VSLA participation and history • Recent HH savings history • Recent HH borrowing history and source of loans • Utilization of HH savings and loans
N=259
3 Asset Inventory
• Current land holdings • Current livestock holdings • Livestock sales and mortality • Current levels of productive assets (tools) and HH items
N=259
4 Reasons for an overall increase in Assets
• Scoring of factors contributing to an increase in livestock (proportional scoring using 100 counters)
• Scoring of factors contributing to an increase in HH items & tools (proportional piling using 100 counters)
N=126
N=66
5 Income Sources
• Relative contribution of different income sources (proportional piling using 100 counters)
• Perceived changes in actual income (proportional piling against a nominal baseline of 10 counters)
• Scoring of factors contributing to an increase in income (proportional scoring using 50 counters)
N=259
6 Crop and Honey sales
• White pea bean production and sales 2011 • Income utilization from white pea bean sales 2011 • Honey production and sales 2011 • Income utilization from honey sales 2011
N=183
N=76
7 Expenditure • Actual expenditure on key items N=259 8 Income
Changes • Perceived changes in actual income since 2008 (proportional
piling using a nominal baseline of 10 counters) • Reasons for changes in actual income • Scoring of factors contributing to an increase in income
(proportional scoring using 50 counters)
N=259
(N=175)
9 Other benefits (outcomes)
• Scoring of PSNP Plus programs anticipated outcomes (simple ranking and scoring)
N=259
See Annex II for the complete household questionnaire
20
2.3.2 Focus Group Methods The focus group component of the final assessment used a mixture of qualitative, quantitative, and participatory data collection methods. These discussions were primarily used to collect descriptive contextual information on the PSNP Plus program and more general information on the project area. The focus groups were structured around a checklist, which included a set of standardized participatory exercises. These included (1) A SWOT (Strengths, Weaknesses, Opportunities, Threats) analysis of the different program interventions being assessed (2) A scoring exercise comparing the project and non-project factors contributing to an overall increase in wealth (3) A matrix scoring of different financial service providers (4) A value chain ranking exercise (5) A credit preference ranking exercise.
2.4 Data Analysis The household results were analyzed collectively with the baseline and mid-term results, and summarized using Statistical Packages for Social Sciences (SPSS version 19) Mean expenditure, honey and crop sales, savings and loan values and utilization and income utilization were calculated at ninety five percent confidence interval using SPSS, as was the data derived from scoring of project and non-project factors contributing to any assessed impact. For changes in assets a comparison of mean scores was calculated at ninety five percent confidence interval using SPSS. When available, results were compared with project monitoring data and other program reports.
21
3. RESULTS
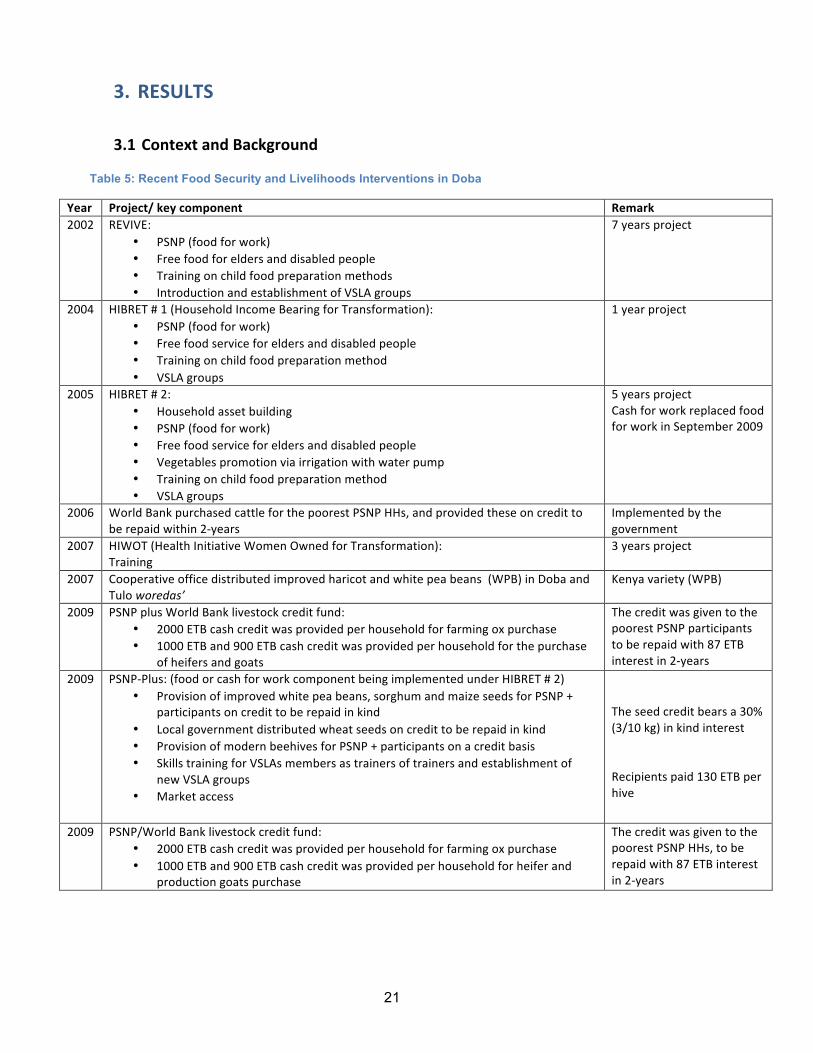
3.1 Context and Background Table 5: Recent Food Security and Livelihoods Interventions in Doba
Year Project/ key component Remark 2002 REVIVE:
• PSNP (food for work) • Free food for elders and disabled people • Training on child food preparation methods • Introduction and establishment of VSLA groups
7 years project
2004 HIBRET # 1 (Household Income Bearing for Transformation): • PSNP (food for work) • Free food service for elders and disabled people • Training on child food preparation method • VSLA groups
1 year project
2005 HIBRET # 2: • Household asset building • PSNP (food for work) • Free food service for elders and disabled people • Vegetables promotion via irrigation with water pump • Training on child food preparation method • VSLA groups
5 years project Cash for work replaced food for work in September 2009
2006 World Bank purchased cattle for the poorest PSNP HHs, and provided these on credit to be repaid within 2-‐years
Implemented by the government
2007 HIWOT (Health Initiative Women Owned for Transformation): Training
3 years project
2007 Cooperative office distributed improved haricot and white pea beans (WPB) in Doba and Tulo woredas’
Kenya variety (WPB)
2009 PSNP plus World Bank livestock credit fund: • 2000 ETB cash credit was provided per household for farming ox purchase • 1000 ETB and 900 ETB cash credit was provided per household for the purchase
of heifers and goats
The credit was given to the poorest PSNP participants to be repaid with 87 ETB interest in 2-‐years
2009 PSNP-‐Plus: (food or cash for work component being implemented under HIBRET # 2) • Provision of improved white pea beans, sorghum and maize seeds for PSNP +
participants on credit to be repaid in kind • Local government distributed wheat seeds on credit to be repaid in kind • Provision of modern beehives for PSNP + participants on a credit basis • Skills training for VSLAs members as trainers of trainers and establishment of
new VSLA groups • Market access
The seed credit bears a 30% (3/10 kg) in kind interest Recipients paid 130 ETB per hive
2009 PSNP/World Bank livestock credit fund: • 2000 ETB cash credit was provided per household for farming ox purchase • 1000 ETB and 900 ETB cash credit was provided per household for heifer and
production goats purchase
The credit was given to the poorest PSNP HHs, to be repaid with 87 ETB interest in 2-‐years
22
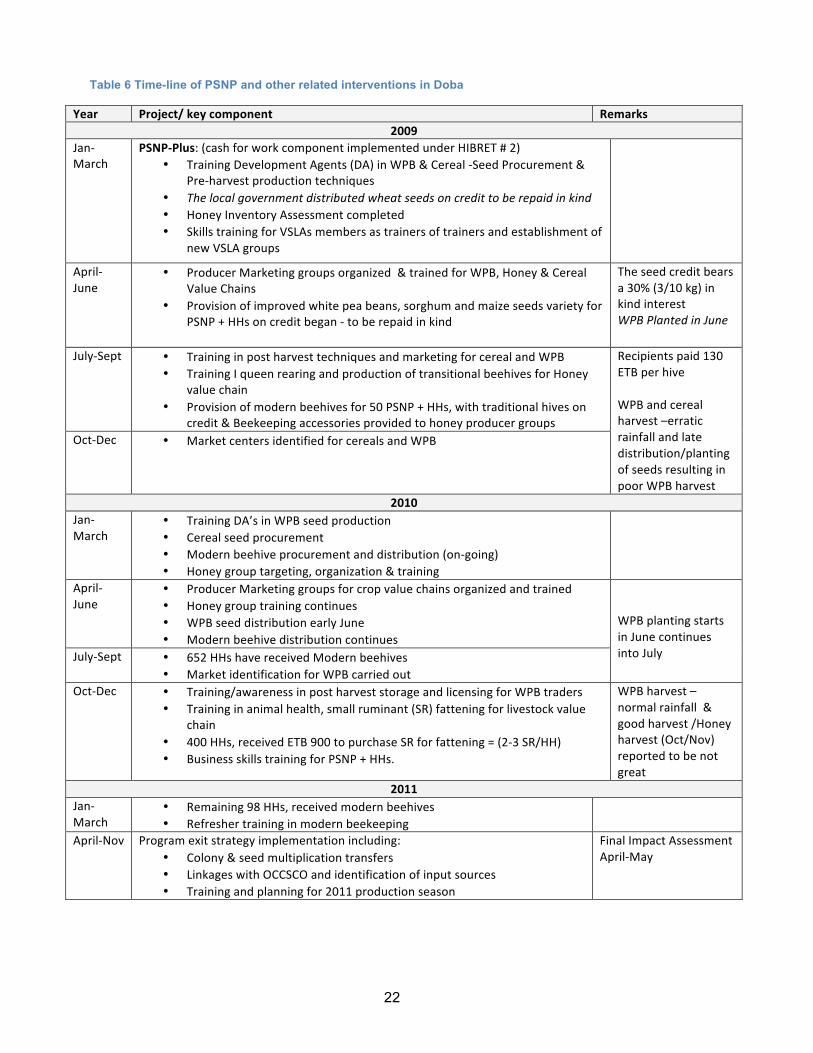
Table 6 Time-line of PSNP and other related interventions in Doba
Year Project/ key component Remarks 2009
Jan-‐March
PSNP-‐Plus: (cash for work component implemented under HIBRET # 2) • Training Development Agents (DA) in WPB & Cereal -‐Seed Procurement &
Pre-‐harvest production techniques • The local government distributed wheat seeds on credit to be repaid in kind • Honey Inventory Assessment completed • Skills training for VSLAs members as trainers of trainers and establishment of
new VSLA groups
April-‐June
• Producer Marketing groups organized & trained for WPB, Honey & Cereal Value Chains
• Provision of improved white pea beans, sorghum and maize seeds variety for PSNP + HHs on credit began -‐ to be repaid in kind
The seed credit bears a 30% (3/10 kg) in kind interest WPB Planted in June
July-‐Sept • Training in post harvest techniques and marketing for cereal and WPB • Training I queen rearing and production of transitional beehives for Honey
value chain • Provision of modern beehives for 50 PSNP + HHs, with traditional hives on
credit & Beekeeping accessories provided to honey producer groups
Recipients paid 130 ETB per hive WPB and cereal harvest –erratic rainfall and late distribution/planting of seeds resulting in poor WPB harvest
Oct-‐Dec • Market centers identified for cereals and WPB
2010 Jan-‐March
• Training DA’s in WPB seed production • Cereal seed procurement • Modern beehive procurement and distribution (on-‐going) • Honey group targeting, organization & training
April-‐June
• Producer Marketing groups for crop value chains organized and trained • Honey group training continues • WPB seed distribution early June • Modern beehive distribution continues
WPB planting starts in June continues into July July-‐Sept • 652 HHs have received Modern beehives
• Market identification for WPB carried out Oct-‐Dec • Training/awareness in post harvest storage and licensing for WPB traders
• Training in animal health, small ruminant (SR) fattening for livestock value chain
• 400 HHs, received ETB 900 to purchase SR for fattening = (2-‐3 SR/HH) • Business skills training for PSNP + HHs.
WPB harvest – normal rainfall & good harvest /Honey harvest (Oct/Nov) reported to be not great
2011 Jan-‐March
• Remaining 98 HHs, received modern beehives • Refresher training in modern beekeeping
April-‐Nov Program exit strategy implementation including: • Colony & seed multiplication transfers • Linkages with OCCSCO and identification of input sources • Training and planning for 2011 production season
Final Impact Assessment April-‐May
23
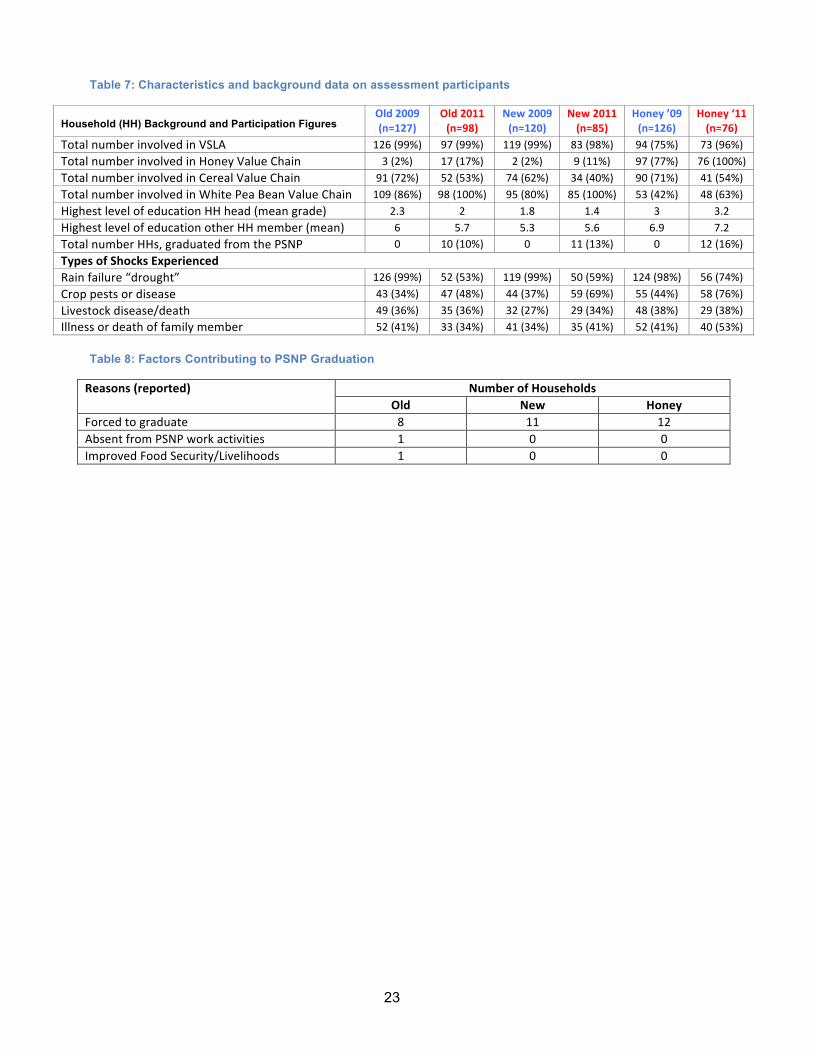
Table 7: Characteristics and background data on assessment participants
Household (HH) Background and Participation Figures
Old 2009 (n=127)
Old 2011 (n=98)
New 2009 (n=120)
New 2011 (n=85)
Honey ’09 (n=126)
Honey ‘11 (n=76)
Total number involved in VSLA 126 (99%) 97 (99%) 119 (99%) 83 (98%) 94 (75%) 73 (96%) Total number involved in Honey Value Chain 3 (2%) 17 (17%) 2 (2%) 9 (11%) 97 (77%) 76 (100%) Total number involved in Cereal Value Chain 91 (72%) 52 (53%) 74 (62%) 34 (40%) 90 (71%) 41 (54%) Total number involved in White Pea Bean Value Chain 109 (86%) 98 (100%) 95 (80%) 85 (100%) 53 (42%) 48 (63%) Highest level of education HH head (mean grade) 2.3 2 1.8 1.4 3 3.2 Highest level of education other HH member (mean) 6 5.7 5.3 5.6 6.9 7.2 Total number HHs, graduated from the PSNP 0 10 (10%) 0 11 (13%) 0 12 (16%) Types of Shocks Experienced Rain failure “drought” 126 (99%) 52 (53%) 119 (99%) 50 (59%) 124 (98%) 56 (74%) Crop pests or disease 43 (34%) 47 (48%) 44 (37%) 59 (69%) 55 (44%) 58 (76%) Livestock disease/death 49 (36%) 35 (36%) 32 (27%) 29 (34%) 48 (38%) 29 (38%) Illness or death of family member 52 (41%) 33 (34%) 41 (34%) 35 (41%) 52 (41%) 40 (53%)
Table 8: Factors Contributing to PSNP Graduation
Reasons (reported) Number of Households Old New Honey
Forced to graduate 8 11 12 Absent from PSNP work activities 1 0 0 Improved Food Security/Livelihoods 1 0 0
24
3.2 Income
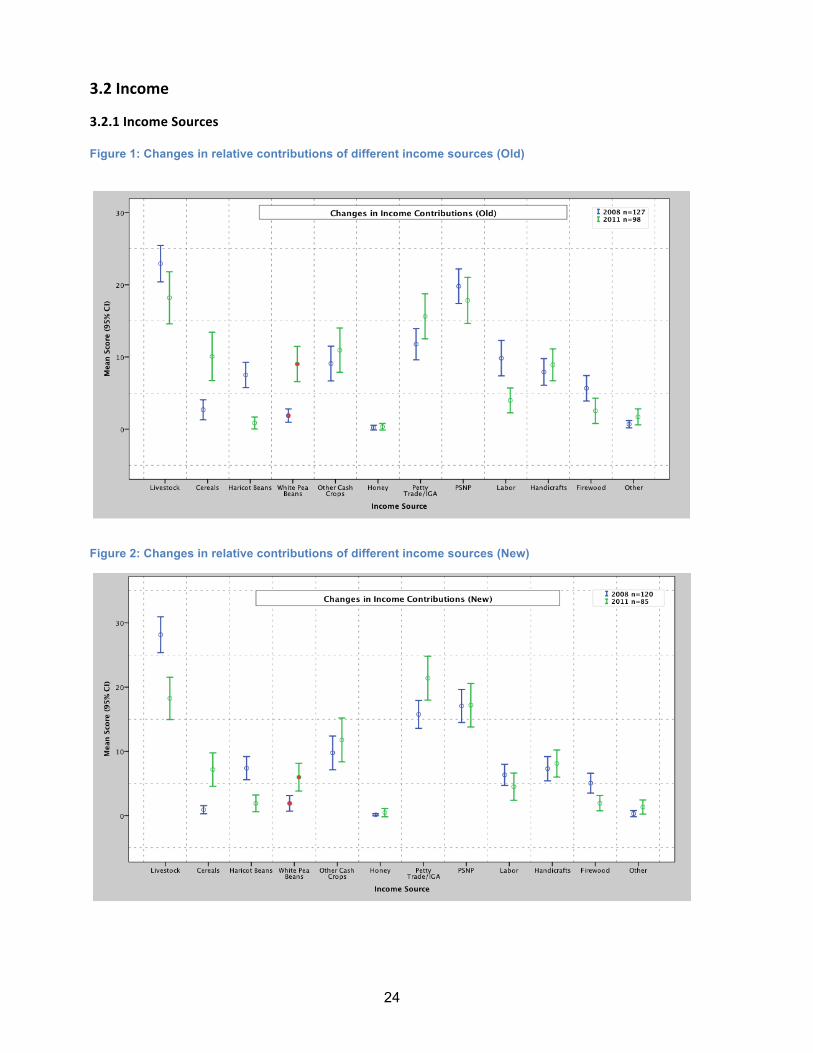
3.2.1 Income Sources Figure 1: Changes in relative contributions of different income sources (Old)
Figure 2: Changes in relative contributions of different income sources (New)
25
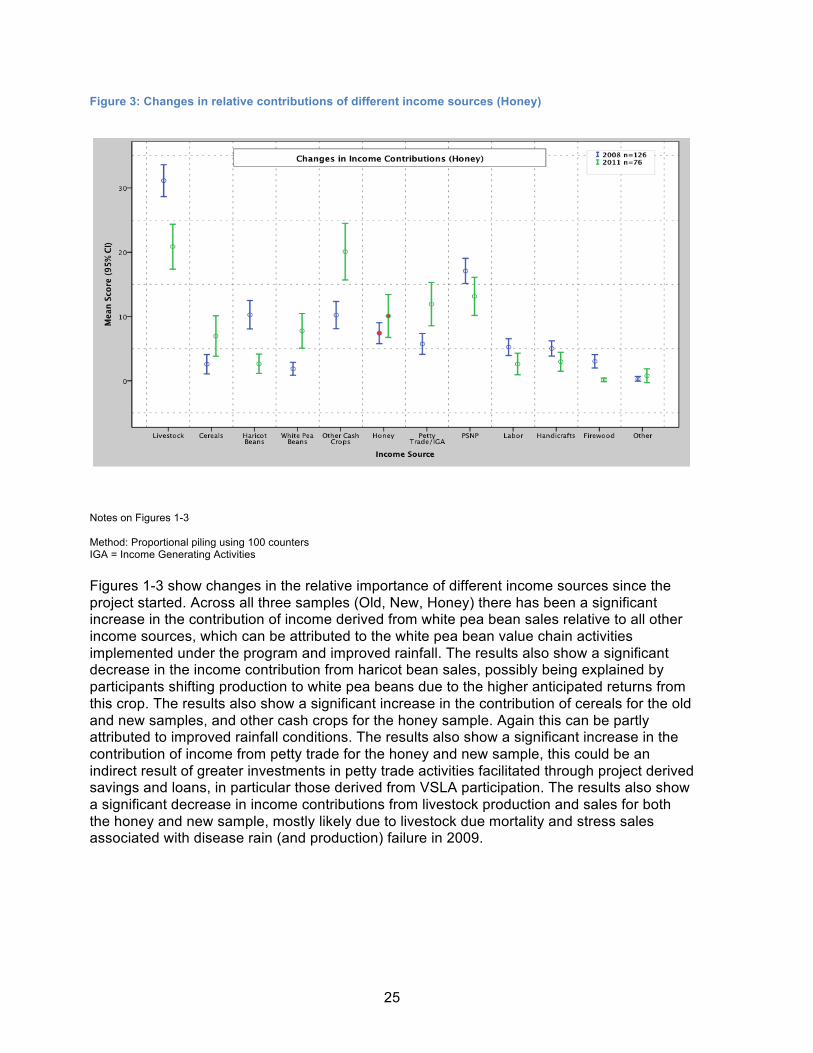
Figure 3: Changes in relative contributions of different income sources (Honey)
Notes on Figures 1-3 Method: Proportional piling using 100 counters IGA = Income Generating Activities Figures 1-3 show changes in the relative importance of different income sources since the project started. Across all three samples (Old, New, Honey) there has been a significant increase in the contribution of income derived from white pea bean sales relative to all other income sources, which can be attributed to the white pea bean value chain activities implemented under the program and improved rainfall. The results also show a significant decrease in the income contribution from haricot bean sales, possibly being explained by participants shifting production to white pea beans due to the higher anticipated returns from this crop. The results also show a significant increase in the contribution of cereals for the old and new samples, and other cash crops for the honey sample. Again this can be partly attributed to improved rainfall conditions. The results also show a significant increase in the contribution of income from petty trade for the honey and new sample, this could be an indirect result of greater investments in petty trade activities facilitated through project derived savings and loans, in particular those derived from VSLA participation. The results also show a significant decrease in income contributions from livestock production and sales for both the honey and new sample, mostly likely due to livestock due mortality and stress sales associated with disease rain (and production) failure in 2009.
26
3.3 Expenditure Figure 4: Expenditure on Key Items (Old)
Figure 5: Expenditure on Key Items (New)
27
Figure 6: Expenditure on Key Items (Honey)
Notes on Figures 4-6 Agric Inputs = Agricultural/farming inputs Land/HI = Land rent and or Home Improvement (construction/maintenance) Livestock = All livestock related expenses (includes animal purchases, vaccines/treatment, feed etc.) HH Items = Household Items Social Oblig. = Social Obligations (weddings/funerals/contributions etc.)
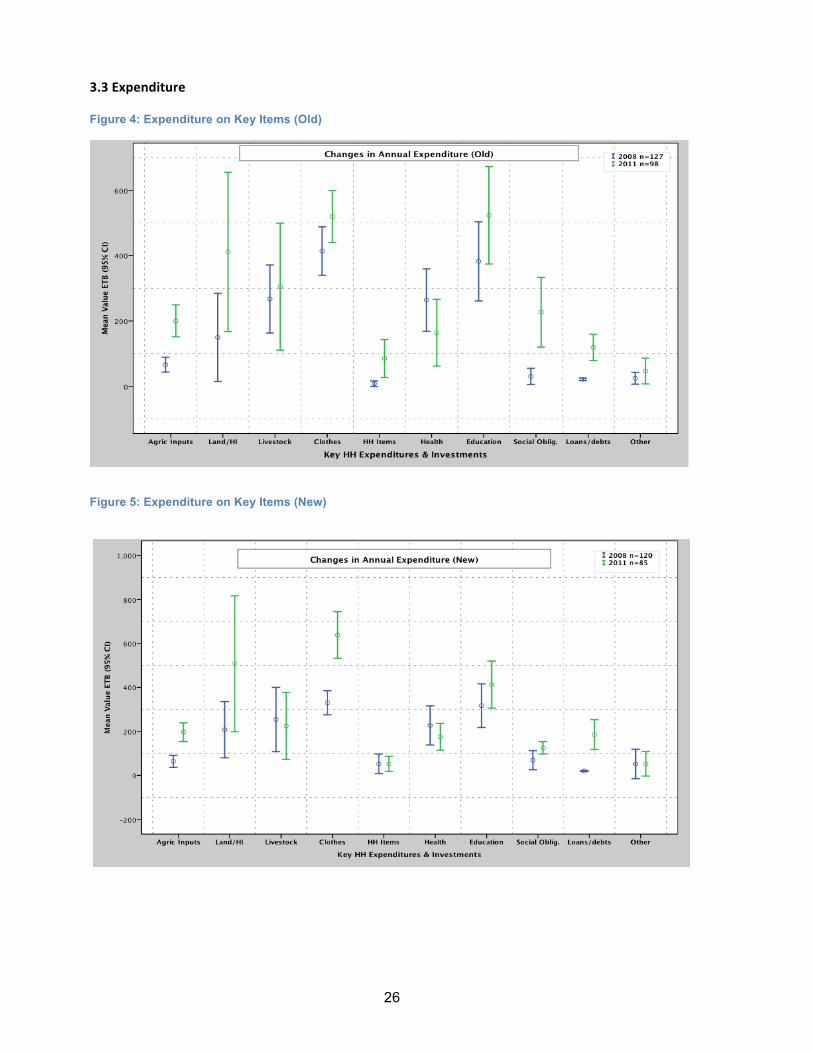
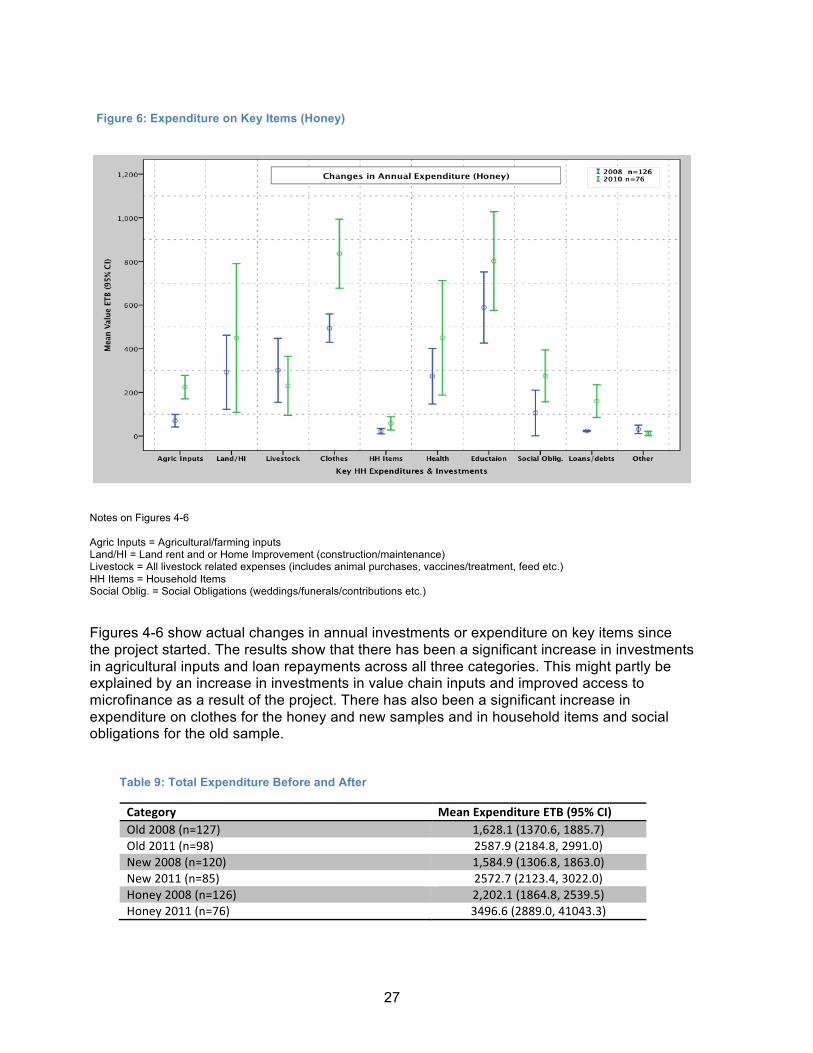
Figures 4-6 show actual changes in annual investments or expenditure on key items since the project started. The results show that there has been a significant increase in investments in agricultural inputs and loan repayments across all three categories. This might partly be explained by an increase in investments in value chain inputs and improved access to microfinance as a result of the project. There has also been a significant increase in expenditure on clothes for the honey and new samples and in household items and social obligations for the old sample. Table 9: Total Expenditure Before and After
Category Mean Expenditure ETB (95% CI) Old 2008 (n=127) 1,628.1 (1370.6, 1885.7) Old 2011 (n=98) 2587.9 (2184.8, 2991.0) New 2008 (n=120) 1,584.9 (1306.8, 1863.0) New 2011 (n=85) 2572.7 (2123.4, 3022.0) Honey 2008 (n=126) 2,202.1 (1864.8, 2539.5) Honey 2011 (n=76) 3496.6 (2889.0, 41043.3)
28
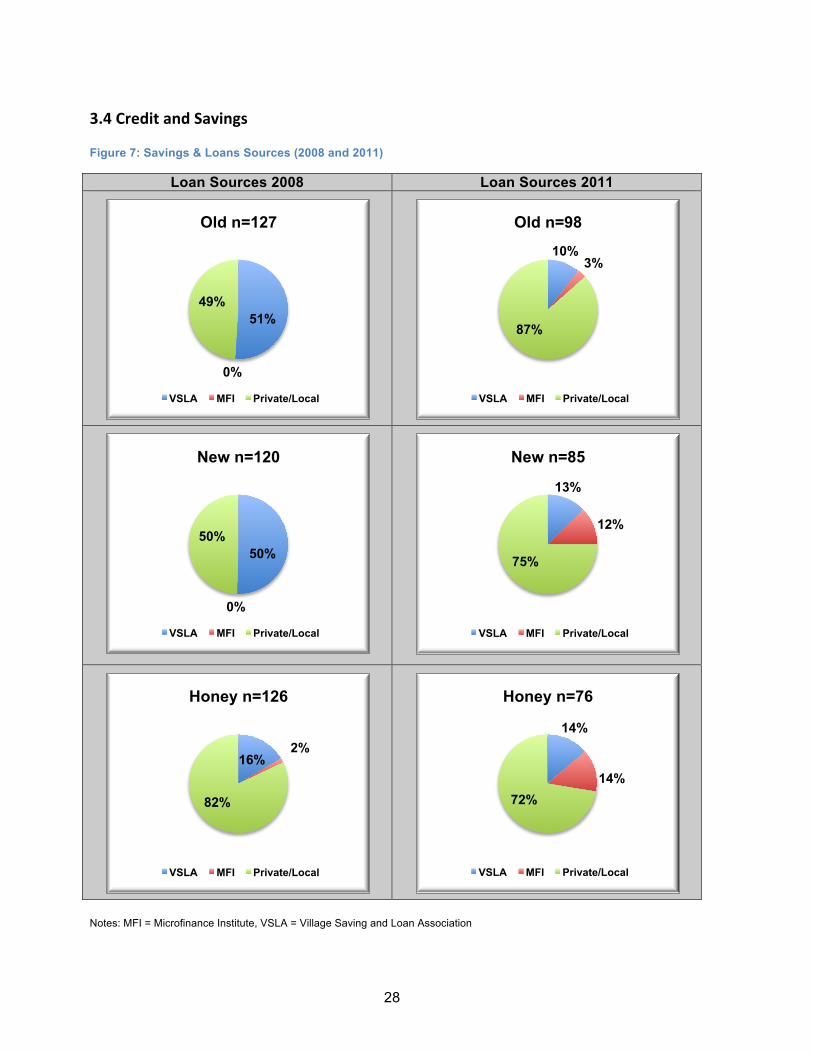
3.4 Credit and Savings Figure 7: Savings & Loans Sources (2008 and 2011)
Loan Sources 2008 Loan Sources 2011
Notes: MFI = Microfinance Institute, VSLA = Village Saving and Loan Association
51%
0%
49%
Old n=127
VSLA MFI Private/Local
10% 3%
87%
Old n=98
VSLA MFI Private/Local
50%
0%
50%
New n=120
VSLA MFI Private/Local
13%
12%
75%
New n=85
VSLA MFI Private/Local
16% 2%
82%
Honey n=126
VSLA MFI Private/Local
14%
14% 72%
Honey n=76
VSLA MFI Private/Local
29
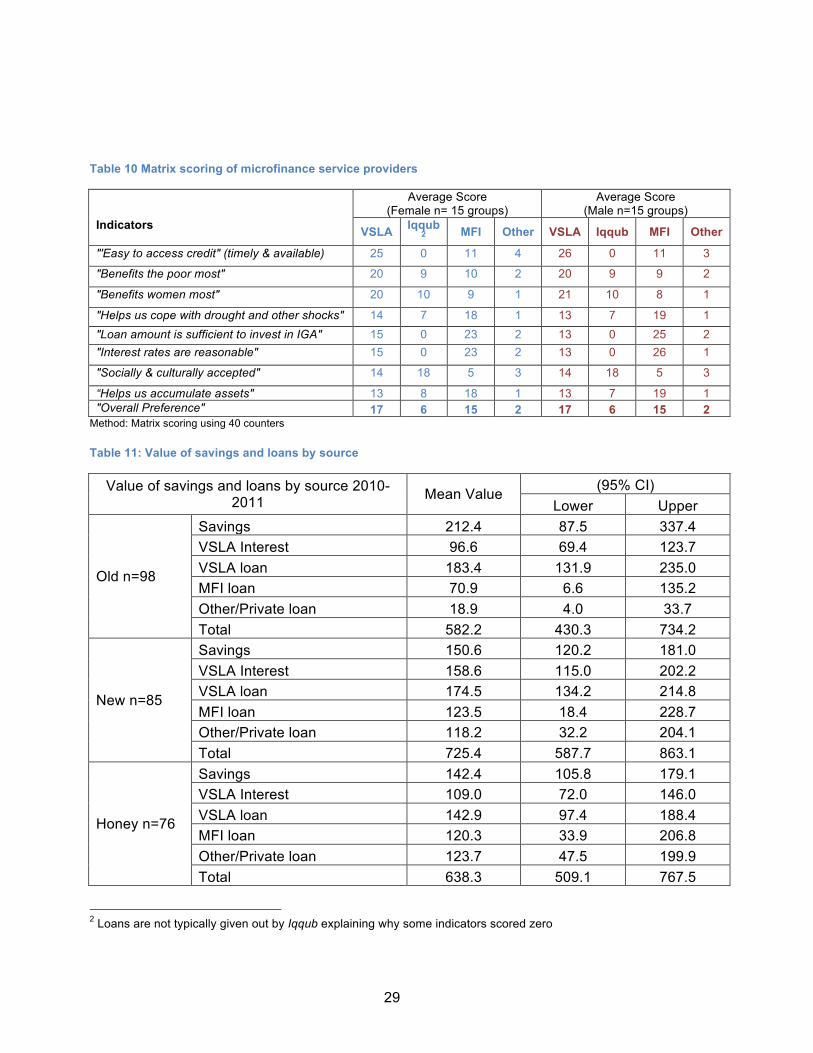
Table 10 Matrix scoring of microfinance service providers
Indicators
Average Score (Female n= 15 groups)
Average Score (Male n=15 groups)
VSLA Iqqub2 MFI Other VSLA Iqqub MFI Other
"'Easy to access credit" (timely & available) 25 0 11 4 26 0 11 3
"Benefits the poor most" 20 9 10 2 20 9 9 2
"Benefits women most" 20 10 9 1 21 10 8 1
"Helps us cope with drought and other shocks" 14 7 18 1 13 7 19 1 "Loan amount is sufficient to invest in IGA" 15 0 23 2 13 0 25 2 "Interest rates are reasonable" 15 0 23 2 13 0 26 1
"Socially & culturally accepted" 14 18 5 3 14 18 5 3
“Helps us accumulate assets" 13 8 18 1 13 7 19 1 "Overall Preference" 17 6 15 2 17 6 15 2
Method: Matrix scoring using 40 counters Table 11: Value of savings and loans by source
Value of savings and loans by source 2010-2011 Mean Value (95% CI)
Lower Upper
Old n=98
Savings 212.4 87.5 337.4 VSLA Interest 96.6 69.4 123.7 VSLA loan 183.4 131.9 235.0 MFI loan 70.9 6.6 135.2 Other/Private loan 18.9 4.0 33.7 Total 582.2 430.3 734.2
New n=85
Savings 150.6 120.2 181.0 VSLA Interest 158.6 115.0 202.2 VSLA loan 174.5 134.2 214.8 MFI loan 123.5 18.4 228.7 Other/Private loan 118.2 32.2 204.1 Total 725.4 587.7 863.1
Honey n=76
Savings 142.4 105.8 179.1 VSLA Interest 109.0 72.0 146.0 VSLA loan 142.9 97.4 188.4 MFI loan 120.3 33.9 206.8 Other/Private loan 123.7 47.5 199.9 Total 638.3 509.1 767.5
2 Loans are not typically given out by Iqqub explaining why some indicators scored zero
30
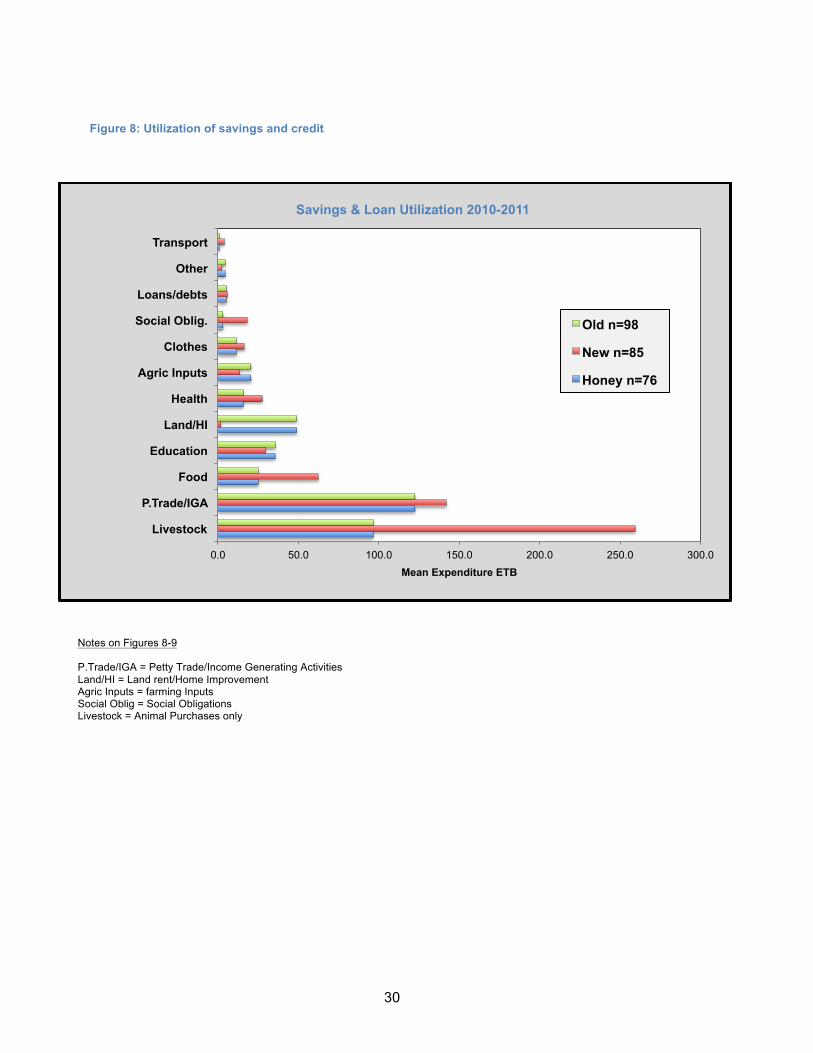
Figure 8: Utilization of savings and credit
Notes on Figures 8-9 P.Trade/IGA = Petty Trade/Income Generating Activities Land/HI = Land rent/Home Improvement Agric Inputs = farming Inputs Social Oblig = Social Obligations Livestock = Animal Purchases only
0.0 50.0 100.0 150.0 200.0 250.0 300.0
Livestock
P.Trade/IGA
Food
Education
Land/HI
Health
Agric Inputs
Clothes
Social Oblig.
Loans/debts
Other
Transport
Mean Expenditure ETB
Savings & Loan Utilization 2010-2011
Old n=98
New n=85
Honey n=76
31
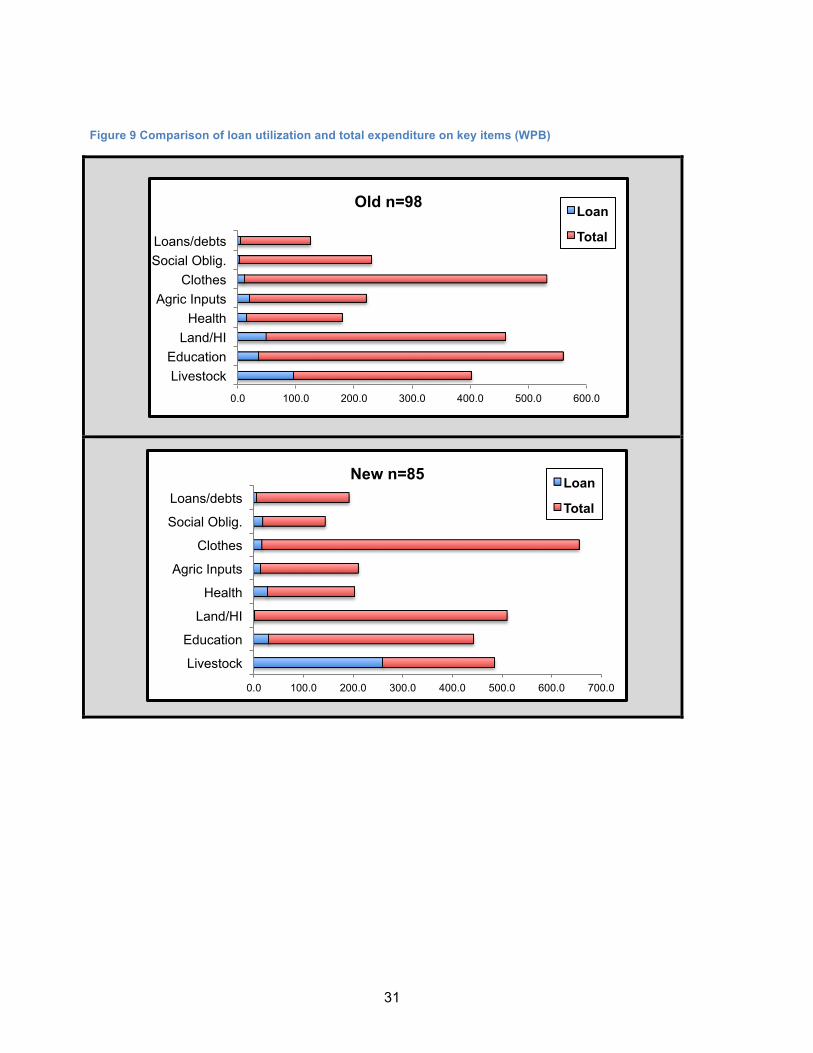
Figure 9 Comparison of loan utilization and total expenditure on key items (WPB)
0.0 100.0 200.0 300.0 400.0 500.0 600.0
Livestock Education
Land/HI Health
Agric Inputs Clothes
Social Oblig. Loans/debts
Old n=98 Loan
Total
0.0 100.0 200.0 300.0 400.0 500.0 600.0 700.0
Livestock
Education
Land/HI
Health
Agric Inputs
Clothes
Social Oblig.
Loans/debts
New n=85 Loan
Total
32
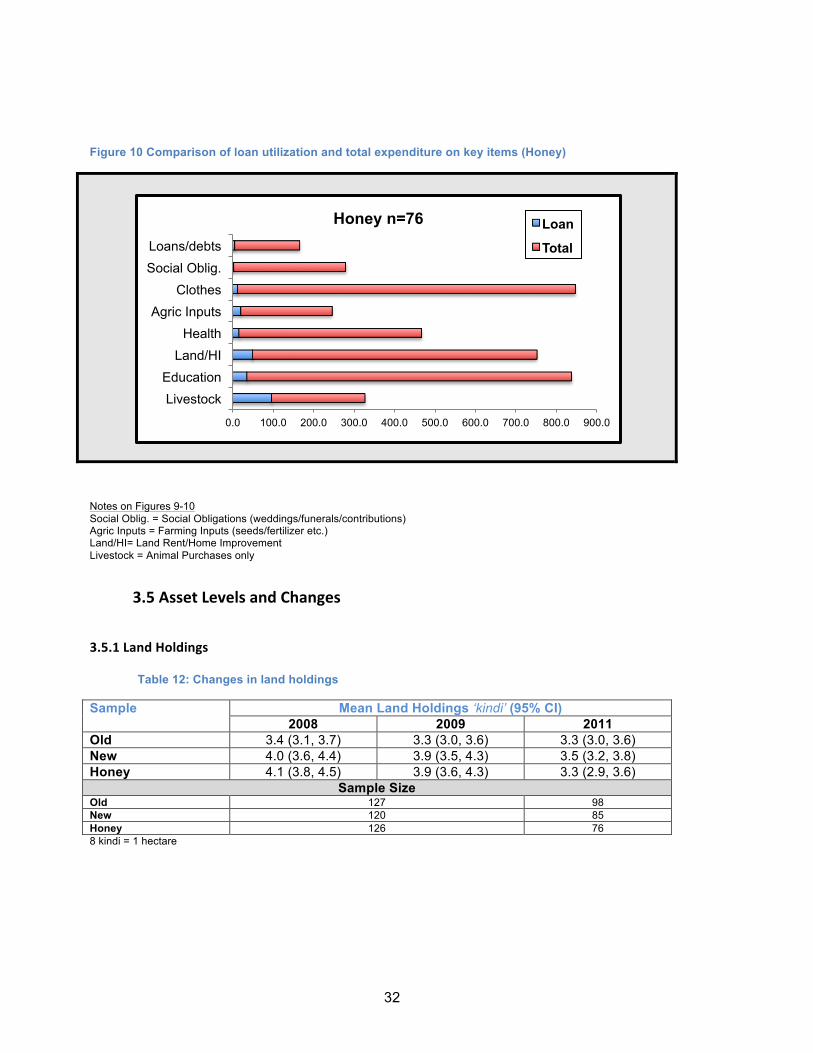
Figure 10 Comparison of loan utilization and total expenditure on key items (Honey)
Notes on Figures 9-10 Social Oblig. = Social Obligations (weddings/funerals/contributions) Agric Inputs = Farming Inputs (seeds/fertilizer etc.) Land/HI= Land Rent/Home Improvement Livestock = Animal Purchases only
3.5 Asset Levels and Changes
3.5.1 Land Holdings
Table 12: Changes in land holdings
Sample Mean Land Holdings ‘kindi’ (95% CI) 2008 2009 2011
Old 3.4 (3.1, 3.7) 3.3 (3.0, 3.6) 3.3 (3.0, 3.6) New 4.0 (3.6, 4.4) 3.9 (3.5, 4.3) 3.5 (3.2, 3.8) Honey 4.1 (3.8, 4.5) 3.9 (3.6, 4.3) 3.3 (2.9, 3.6)
Sample Size Old 127 98 New 120 85 Honey 126 76 8 kindi = 1 hectare
0.0 100.0 200.0 300.0 400.0 500.0 600.0 700.0 800.0 900.0
Livestock Education
Land/HI Health
Agric Inputs Clothes
Social Oblig. Loans/debts
Honey n=76 Loan
Total
33
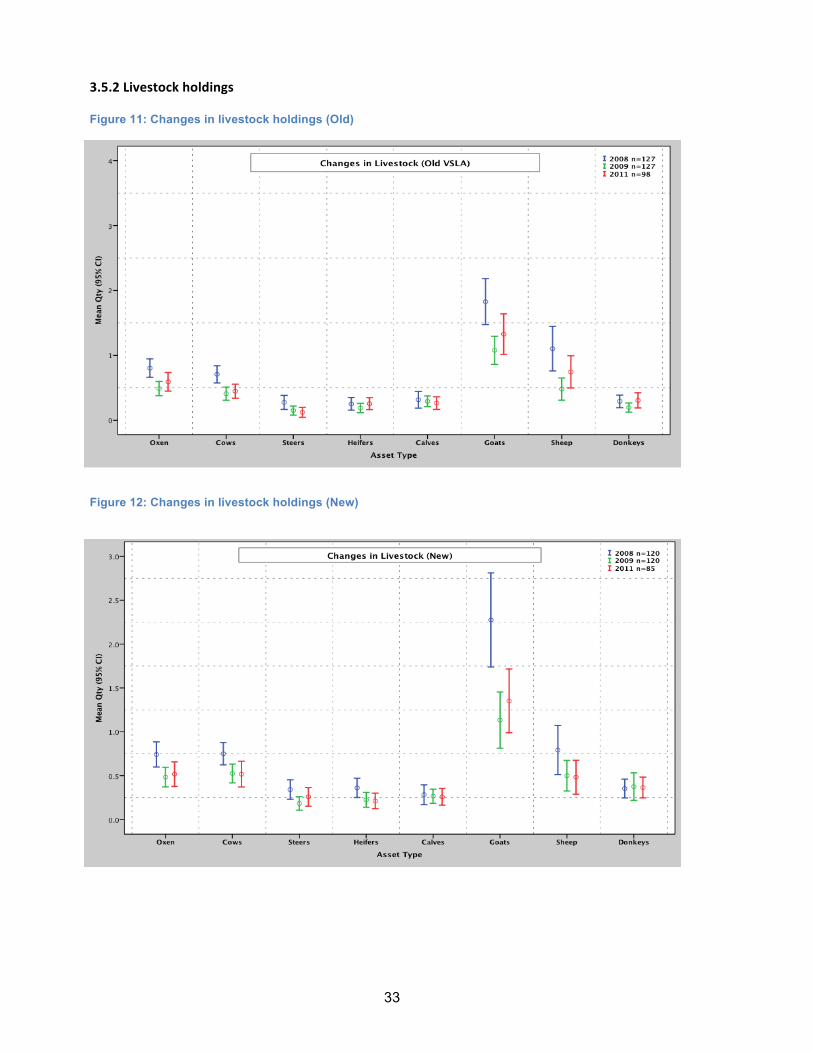
3.5.2 Livestock holdings
Figure 11: Changes in livestock holdings (Old)
Figure 12: Changes in livestock holdings (New)
34
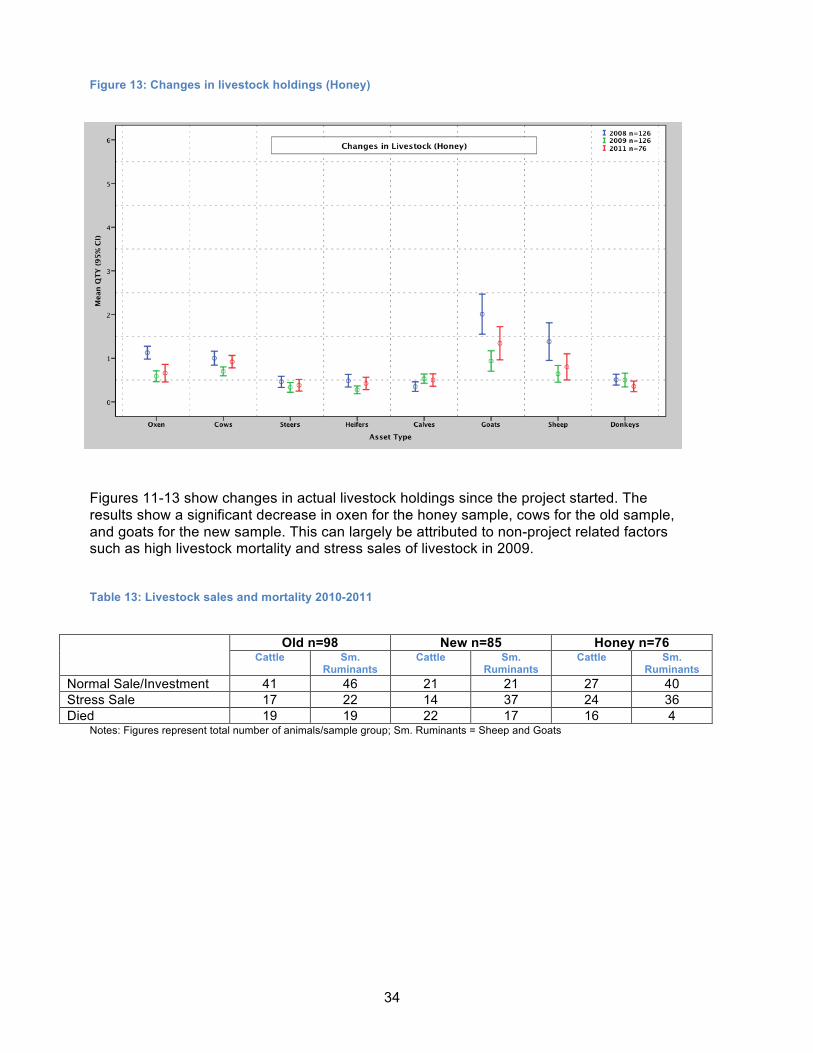
Figure 13: Changes in livestock holdings (Honey)
Figures 11-13 show changes in actual livestock holdings since the project started. The results show a significant decrease in oxen for the honey sample, cows for the old sample, and goats for the new sample. This can largely be attributed to non-project related factors such as high livestock mortality and stress sales of livestock in 2009. Table 13: Livestock sales and mortality 2010-2011
Old n=98 New n=85 Honey n=76
Cattle Sm. Ruminants
Cattle Sm. Ruminants
Cattle Sm. Ruminants
Normal Sale/Investment 41 46 21 21 27 40 Stress Sale 17 22 14 37 24 36 Died 19 19 22 17 16 4
Notes: Figures represent total number of animals/sample group; Sm. Ruminants = Sheep and Goats
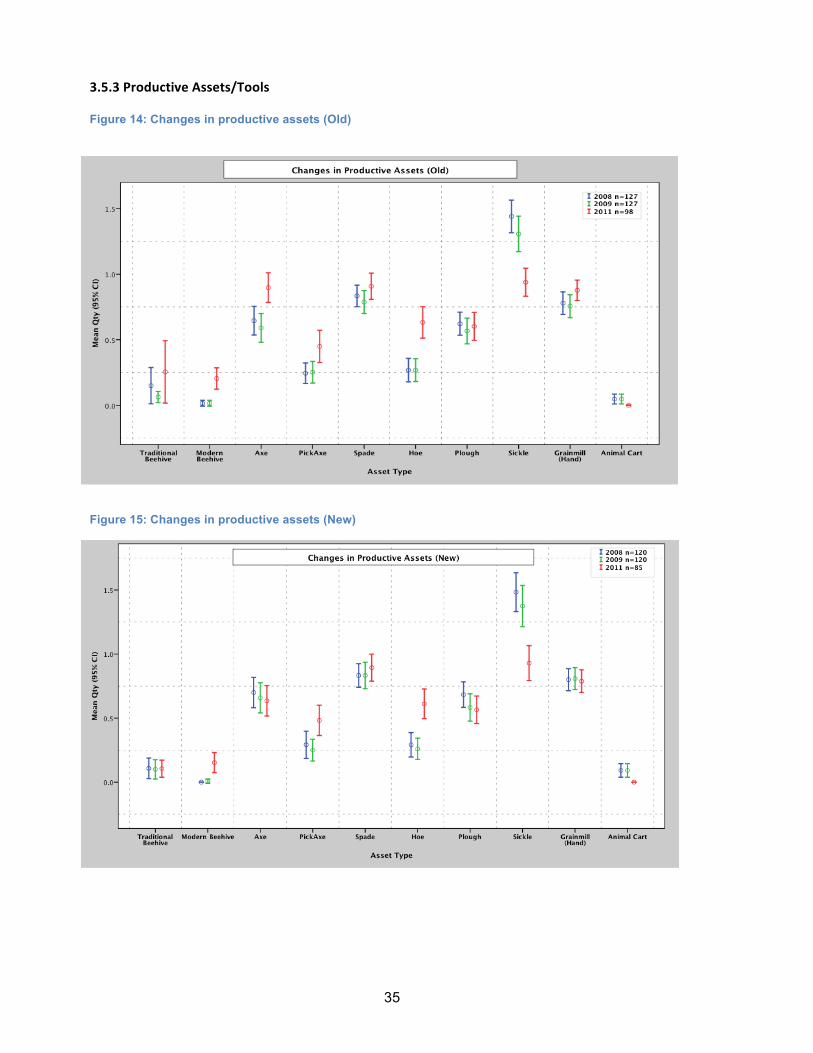
35
3.5.3 Productive Assets/Tools Figure 14: Changes in productive assets (Old)
Figure 15: Changes in productive assets (New)
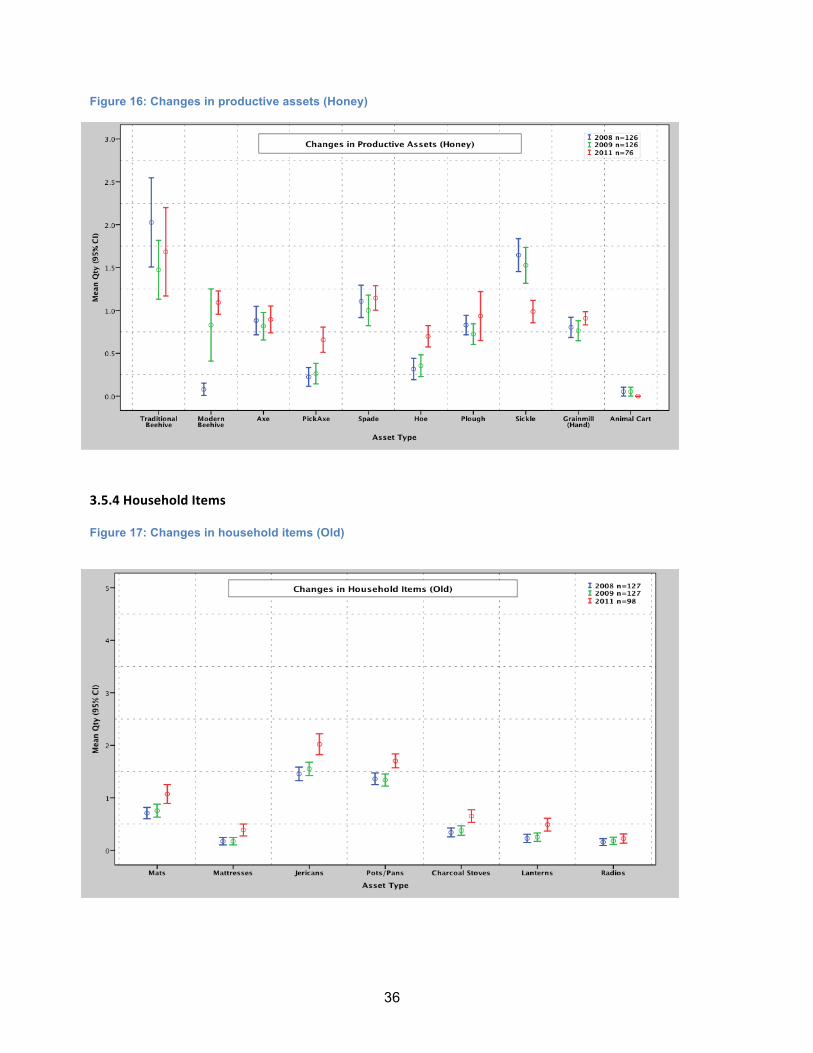
36
Figure 16: Changes in productive assets (Honey)
3.5.4 Household Items Figure 17: Changes in household items (Old)
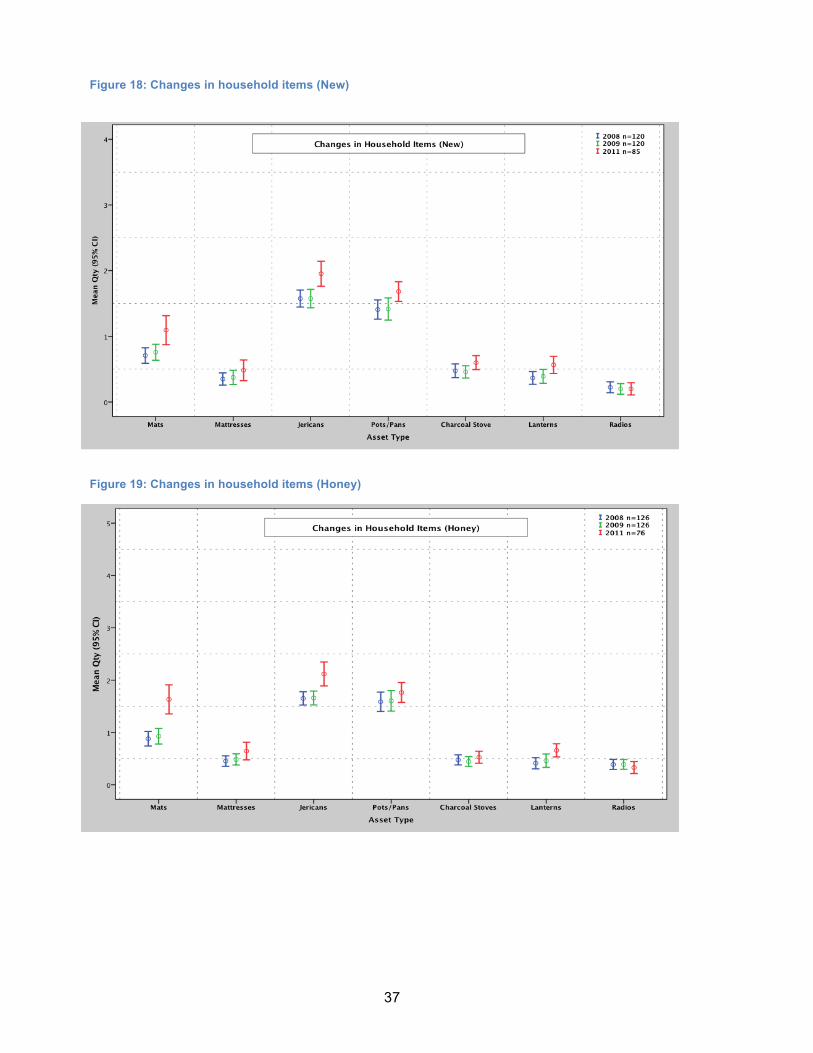
37
Figure 18: Changes in household items (New)
Figure 19: Changes in household items (Honey)
38
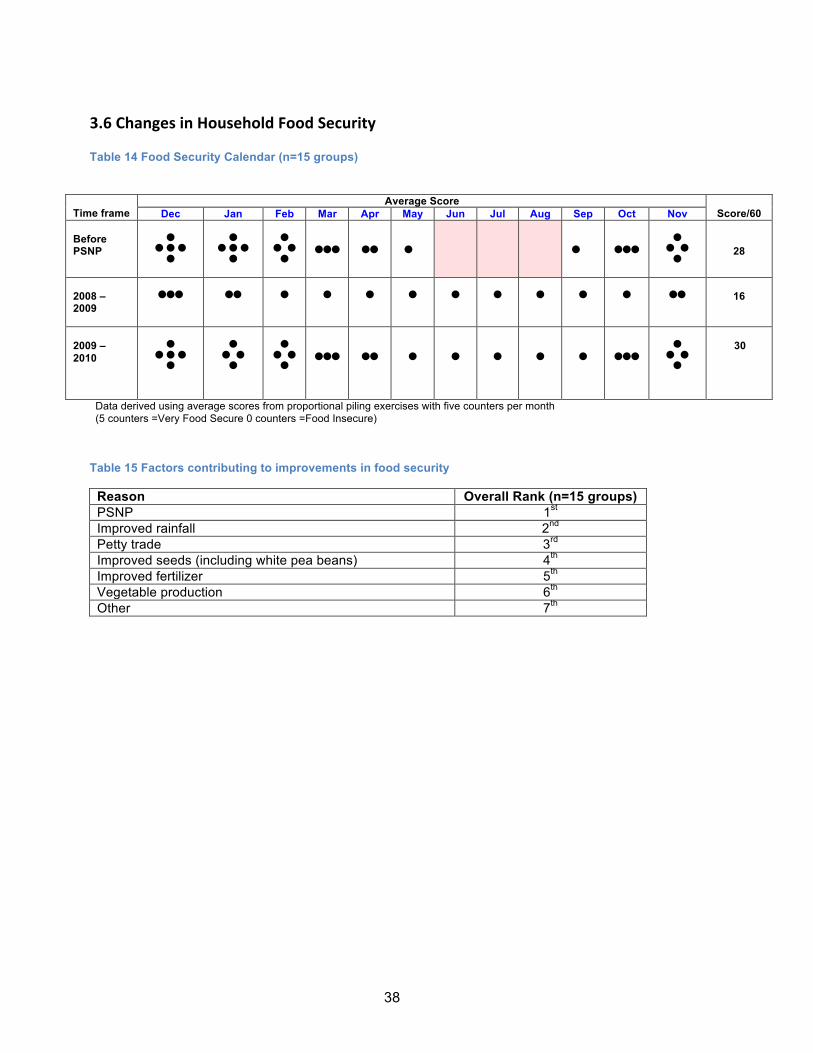
3.6 Changes in Household Food Security Table 14 Food Security Calendar (n=15 groups)
Time frame
Average Score Score/60 Dec Jan Feb Mar Apr May Jun Jul Aug Sep Oct Nov
Before PSNP
28
2008 – 2009
16
2009 – 2010
30
Data derived using average scores from proportional piling exercises with five counters per month (5 counters =Very Food Secure 0 counters =Food Insecure)
Table 15 Factors contributing to improvements in food security
Reason Overall Rank (n=15 groups) PSNP 1st Improved rainfall 2nd Petty trade 3rd Improved seeds (including white pea beans) 4th Improved fertilizer 5th Vegetable production 6th Other 7th
39
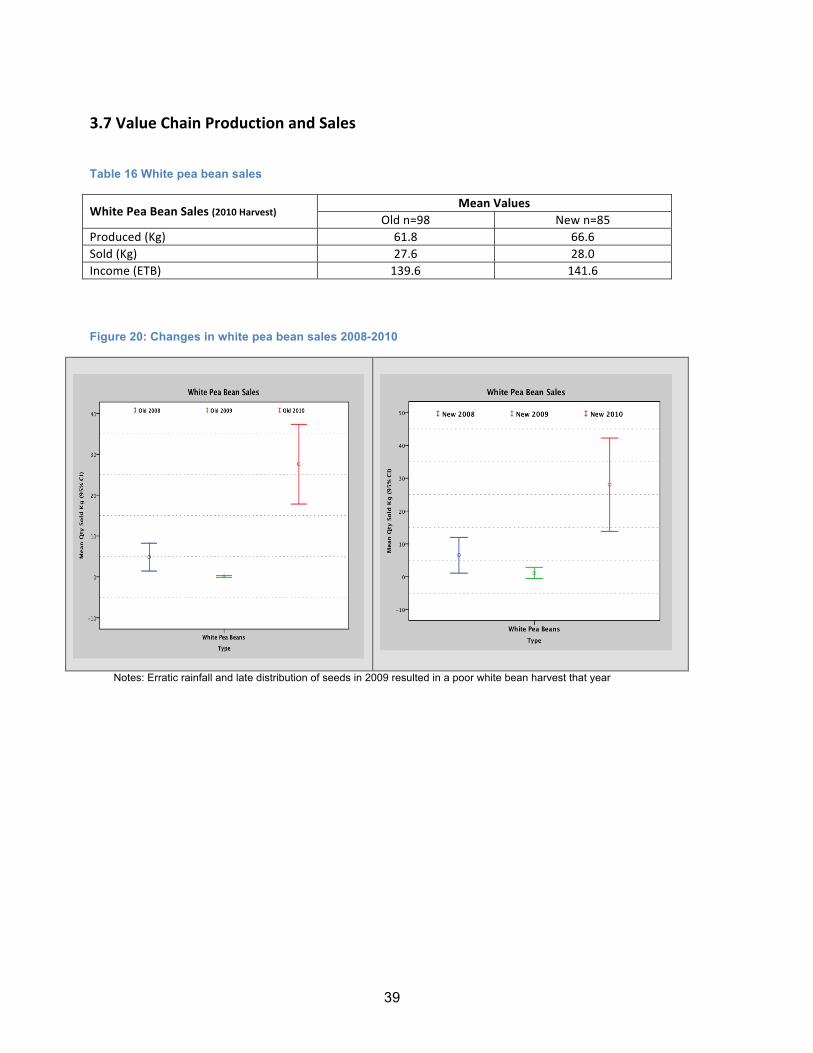
3.7 Value Chain Production and Sales Table 16 White pea bean sales
White Pea Bean Sales (2010 Harvest) Mean Values Old n=98 New n=85
Produced (Kg) 61.8 66.6 Sold (Kg) 27.6 28.0 Income (ETB) 139.6 141.6 Figure 20: Changes in white pea bean sales 2008-2010
Notes: Erratic rainfall and late distribution of seeds in 2009 resulted in a poor white bean harvest that year
40
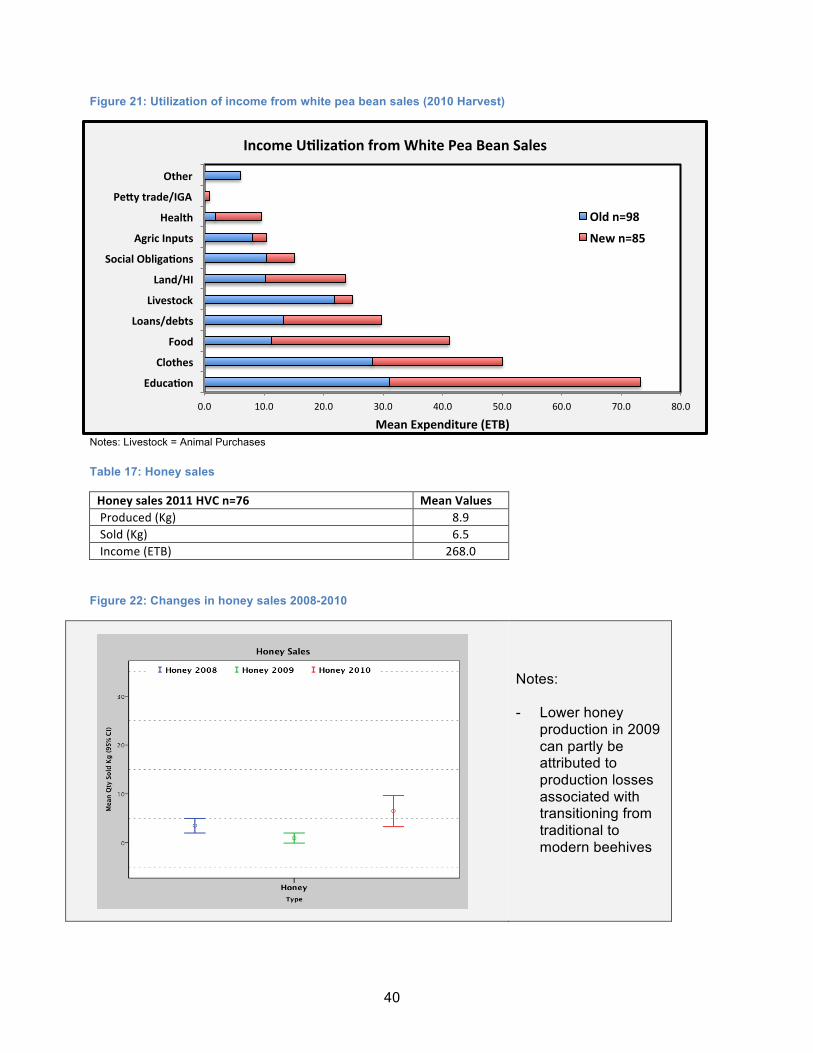
Figure 21: Utilization of income from white pea bean sales (2010 Harvest)
Notes: Livestock = Animal Purchases Table 17: Honey sales
Honey sales 2011 HVC n=76 Mean Values Produced (Kg) 8.9 Sold (Kg) 6.5 Income (ETB) 268.0
Figure 22: Changes in honey sales 2008-2010
Notes: - Lower honey
production in 2009 can partly be attributed to production losses associated with transitioning from traditional to modern beehives
0.0 10.0 20.0 30.0 40.0 50.0 60.0 70.0 80.0
Educadon
Clothes
Food
Loans/debts
Livestock
Land/HI
Social Obligadons
Agric Inputs
Health
Peey trade/IGA
Other
Mean Expenditure (ETB)
Income Udlizadon from White Pea Bean Sales
Old n=98
New n=85

41
Figure 23: Utilization of income from honey sales (2010 harvest)
Notes: Livestock = Animal Purchases
0.0 10.0 20.0 30.0 40.0 50.0 60.0 70.0 80.0 90.0
Educadon
Food
Loans/debts
Clothes
Livestock
Agric. Inputs
Land /HI
Peey Trade/IGA
Social Obligadons
Other
Mean Expenditure (ETB)
Income Udlizadon from Honey Sales
Honey n=76
42
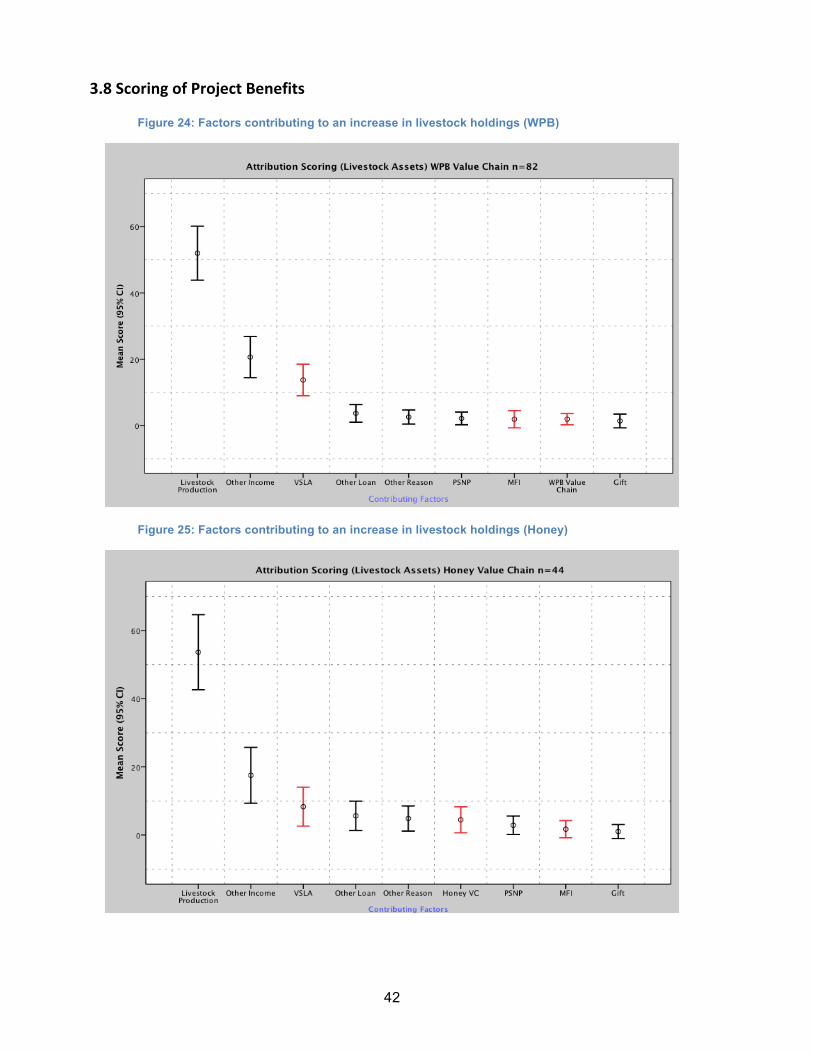
3.8 Scoring of Project Benefits
Figure 24: Factors contributing to an increase in livestock holdings (WPB)
Figure 25: Factors contributing to an increase in livestock holdings (Honey)

43
Figure 26: Factors contributing to an increase in ‘other’ assets (WPB)
Figure 27: Factors contributing to an increase in ‘other’ assets (Honey)
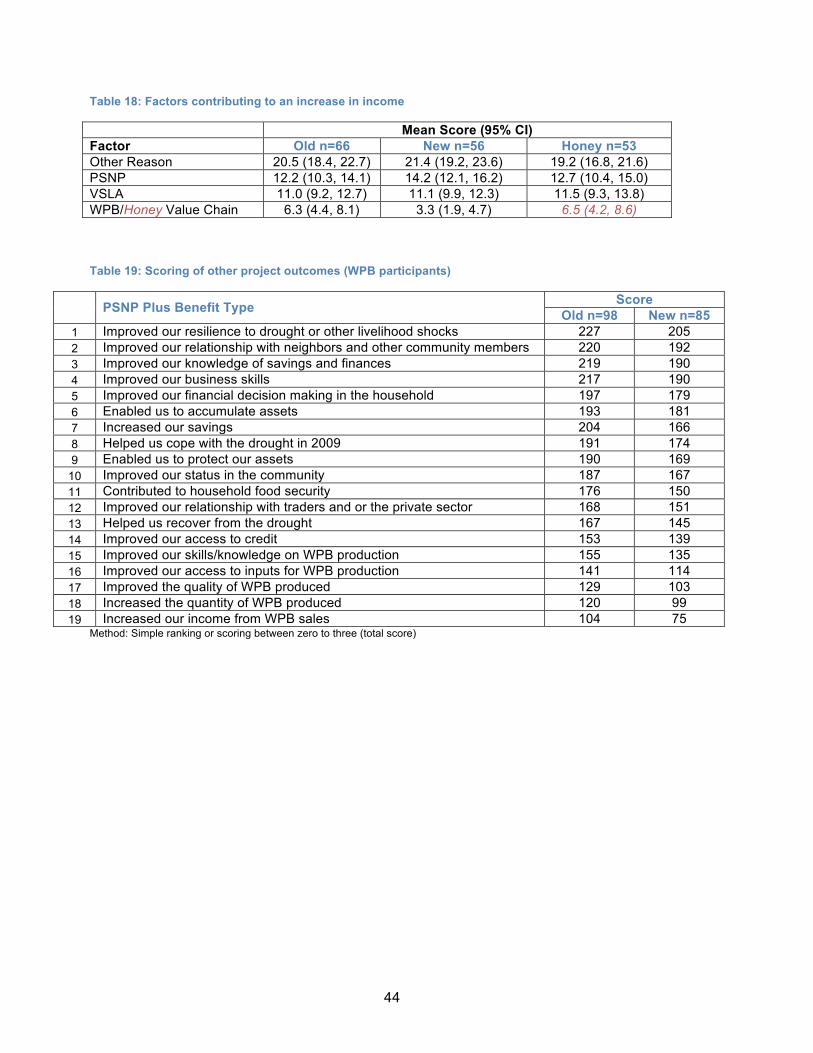
44
Table 18: Factors contributing to an increase in income
Mean Score (95% CI) Factor Old n=66 New n=56 Honey n=53 Other Reason 20.5 (18.4, 22.7) 21.4 (19.2, 23.6) 19.2 (16.8, 21.6) PSNP 12.2 (10.3, 14.1) 14.2 (12.1, 16.2) 12.7 (10.4, 15.0) VSLA 11.0 (9.2, 12.7) 11.1 (9.9, 12.3) 11.5 (9.3, 13.8) WPB/Honey Value Chain 6.3 (4.4, 8.1) 3.3 (1.9, 4.7) 6.5 (4.2, 8.6) Table 19: Scoring of other project outcomes (WPB participants)
PSNP Plus Benefit Type Score Old n=98 New n=85
1 Improved our resilience to drought or other livelihood shocks 227 205 2 Improved our relationship with neighbors and other community members 220 192 3 Improved our knowledge of savings and finances 219 190 4 Improved our business skills 217 190 5 Improved our financial decision making in the household 197 179 6 Enabled us to accumulate assets 193 181 7 Increased our savings 204 166 8 Helped us cope with the drought in 2009 191 174 9 Enabled us to protect our assets 190 169
10 Improved our status in the community 187 167 11 Contributed to household food security 176 150 12 Improved our relationship with traders and or the private sector 168 151 13 Helped us recover from the drought 167 145 14 Improved our access to credit 153 139 15 Improved our skills/knowledge on WPB production 155 135 16 Improved our access to inputs for WPB production 141 114 17 Improved the quality of WPB produced 129 103 18 Increased the quantity of WPB produced 120 99 19 Increased our income from WPB sales 104 75
Method: Simple ranking or scoring between zero to three (total score)
45
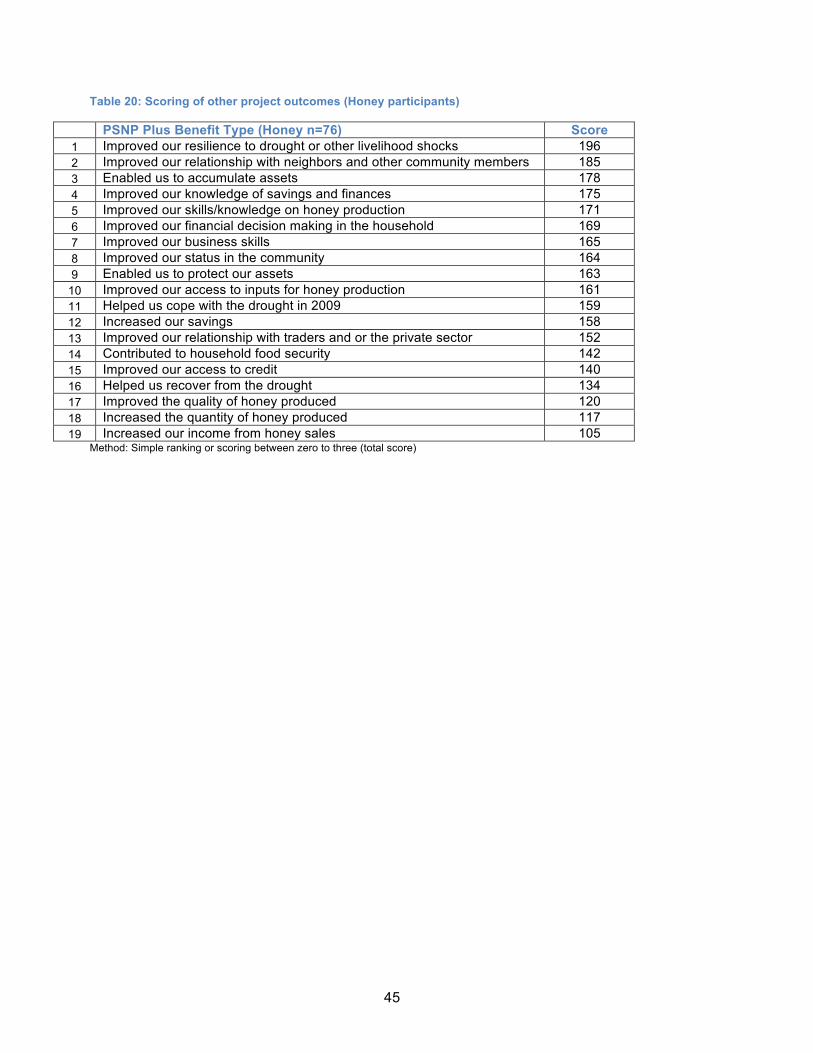
Table 20: Scoring of other project outcomes (Honey participants)
PSNP Plus Benefit Type (Honey n=76) Score 1 Improved our resilience to drought or other livelihood shocks 196 2 Improved our relationship with neighbors and other community members 185 3 Enabled us to accumulate assets 178 4 Improved our knowledge of savings and finances 175 5 Improved our skills/knowledge on honey production 171 6 Improved our financial decision making in the household 169 7 Improved our business skills 165 8 Improved our status in the community 164 9 Enabled us to protect our assets 163
10 Improved our access to inputs for honey production 161 11 Helped us cope with the drought in 2009 159 12 Increased our savings 158 13 Improved our relationship with traders and or the private sector 152 14 Contributed to household food security 142 15 Improved our access to credit 140 16 Helped us recover from the drought 134 17 Improved the quality of honey produced 120 18 Increased the quantity of honey produced 117 19 Increased our income from honey sales 105
Method: Simple ranking or scoring between zero to three (total score)
46
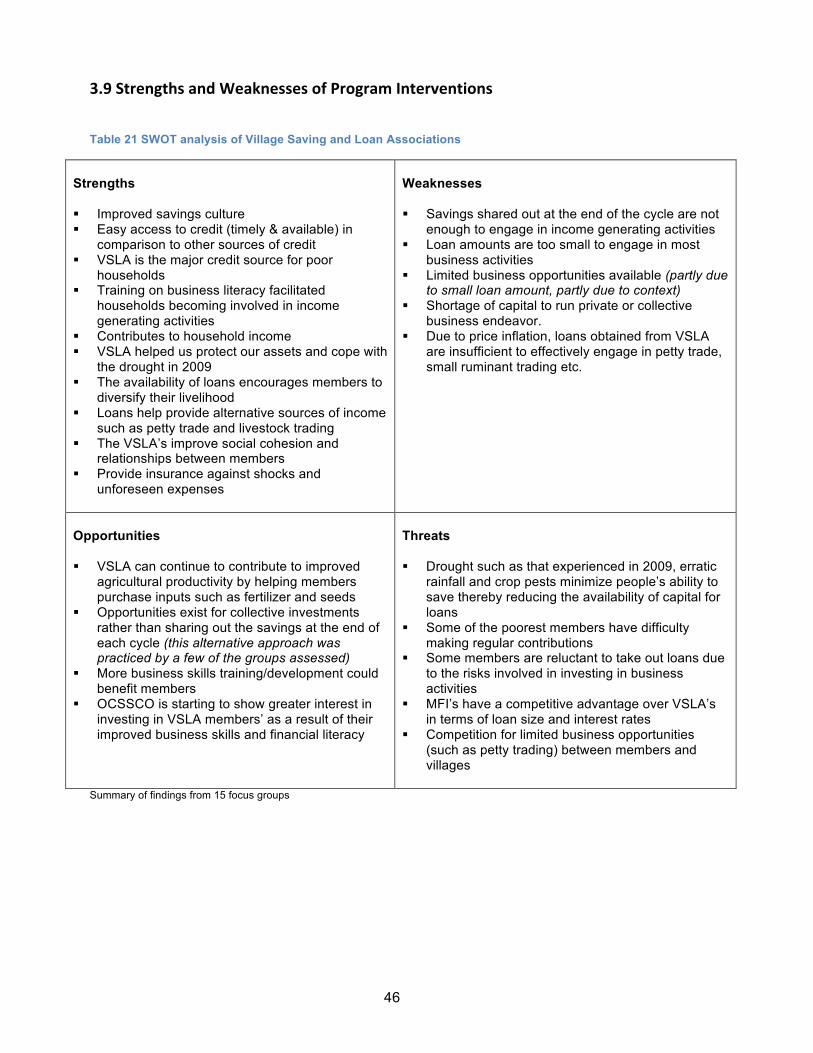
3.9 Strengths and Weaknesses of Program Interventions Table 21 SWOT analysis of Village Saving and Loan Associations
Strengths § Improved savings culture § Easy access to credit (timely & available) in
comparison to other sources of credit § VSLA is the major credit source for poor
households § Training on business literacy facilitated
households becoming involved in income generating activities
§ Contributes to household income § VSLA helped us protect our assets and cope with
the drought in 2009 § The availability of loans encourages members to
diversify their livelihood § Loans help provide alternative sources of income
such as petty trade and livestock trading § The VSLA’s improve social cohesion and
relationships between members § Provide insurance against shocks and
unforeseen expenses
Weaknesses § Savings shared out at the end of the cycle are not
enough to engage in income generating activities § Loan amounts are too small to engage in most
business activities § Limited business opportunities available (partly due
to small loan amount, partly due to context) § Shortage of capital to run private or collective
business endeavor. § Due to price inflation, loans obtained from VSLA
are insufficient to effectively engage in petty trade, small ruminant trading etc.
Opportunities § VSLA can continue to contribute to improved
agricultural productivity by helping members purchase inputs such as fertilizer and seeds
§ Opportunities exist for collective investments rather than sharing out the savings at the end of each cycle (this alternative approach was practiced by a few of the groups assessed)
§ More business skills training/development could benefit members
§ OCSSCO is starting to show greater interest in investing in VSLA members’ as a result of their improved business skills and financial literacy
Threats § Drought such as that experienced in 2009, erratic
rainfall and crop pests minimize people’s ability to save thereby reducing the availability of capital for loans
§ Some of the poorest members have difficulty making regular contributions
§ Some members are reluctant to take out loans due to the risks involved in investing in business activities
§ MFI’s have a competitive advantage over VSLA’s in terms of loan size and interest rates
§ Competition for limited business opportunities (such as petty trading) between members and villages
Summary of findings from 15 focus groups
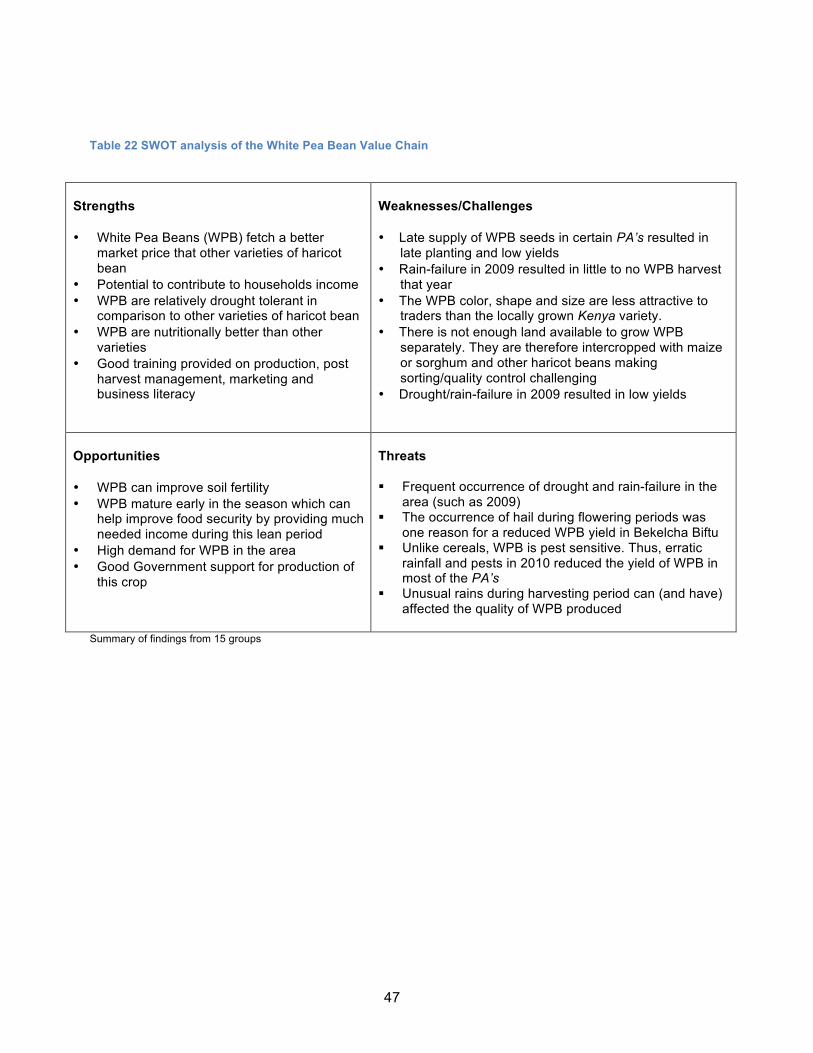
47
Table 22 SWOT analysis of the White Pea Bean Value Chain
Strengths
• White Pea Beans (WPB) fetch a better
market price that other varieties of haricot bean
• Potential to contribute to households income • WPB are relatively drought tolerant in
comparison to other varieties of haricot bean • WPB are nutritionally better than other
varieties • Good training provided on production, post
harvest management, marketing and business literacy
Weaknesses/Challenges • Late supply of WPB seeds in certain PA’s resulted in
late planting and low yields • Rain-failure in 2009 resulted in little to no WPB harvest
that year • The WPB color, shape and size are less attractive to
traders than the locally grown Kenya variety. • There is not enough land available to grow WPB
separately. They are therefore intercropped with maize or sorghum and other haricot beans making sorting/quality control challenging
• Drought/rain-failure in 2009 resulted in low yields
Opportunities • WPB can improve soil fertility • WPB mature early in the season which can
help improve food security by providing much needed income during this lean period
• High demand for WPB in the area • Good Government support for production of
this crop
Threats § Frequent occurrence of drought and rain-failure in the
area (such as 2009) § The occurrence of hail during flowering periods was
one reason for a reduced WPB yield in Bekelcha Biftu § Unlike cereals, WPB is pest sensitive. Thus, erratic
rainfall and pests in 2010 reduced the yield of WPB in most of the PA’s
§ Unusual rains during harvesting period can (and have) affected the quality of WPB produced
Summary of findings from 15 groups
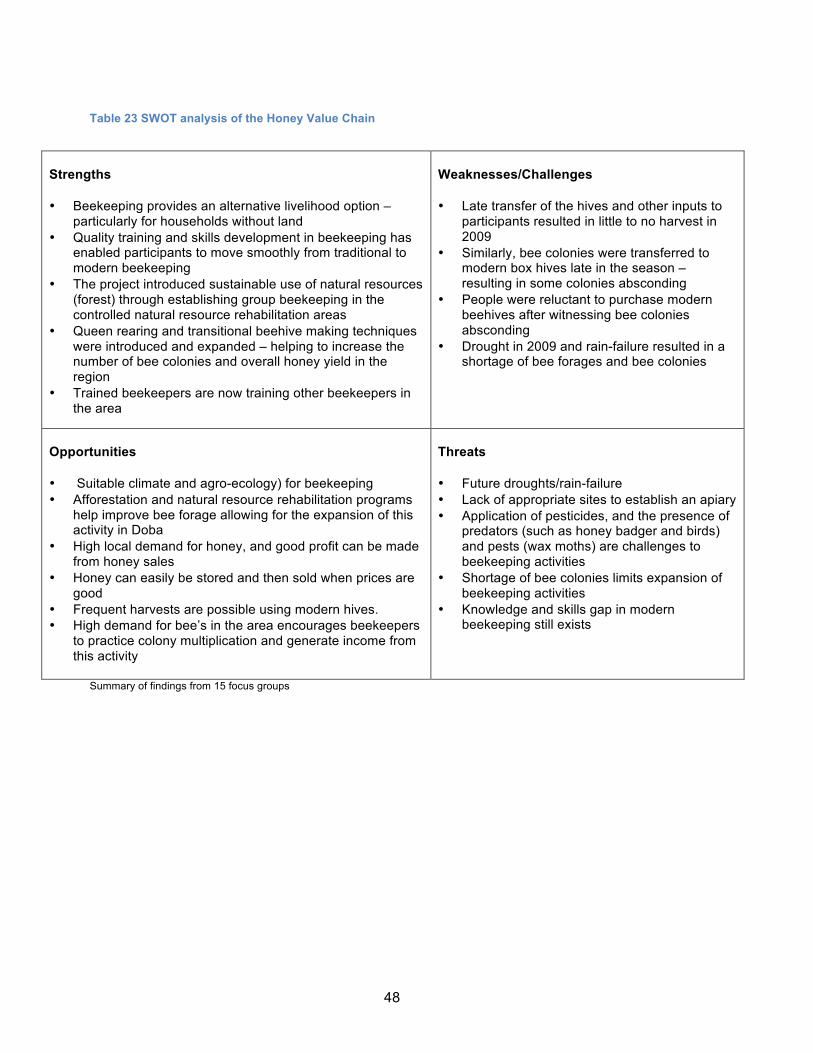
48
Table 23 SWOT analysis of the Honey Value Chain
Strengths • Beekeeping provides an alternative livelihood option –
particularly for households without land • Quality training and skills development in beekeeping has
enabled participants to move smoothly from traditional to modern beekeeping
• The project introduced sustainable use of natural resources (forest) through establishing group beekeeping in the controlled natural resource rehabilitation areas
• Queen rearing and transitional beehive making techniques were introduced and expanded – helping to increase the number of bee colonies and overall honey yield in the region
• Trained beekeepers are now training other beekeepers in the area
Weaknesses/Challenges • Late transfer of the hives and other inputs to
participants resulted in little to no harvest in 2009
• Similarly, bee colonies were transferred to modern box hives late in the season – resulting in some colonies absconding
• People were reluctant to purchase modern beehives after witnessing bee colonies absconding
• Drought in 2009 and rain-failure resulted in a shortage of bee forages and bee colonies
Opportunities • Suitable climate and agro-ecology) for beekeeping • Afforestation and natural resource rehabilitation programs
help improve bee forage allowing for the expansion of this activity in Doba
• High local demand for honey, and good profit can be made from honey sales
• Honey can easily be stored and then sold when prices are good
• Frequent harvests are possible using modern hives. • High demand for bee’s in the area encourages beekeepers
to practice colony multiplication and generate income from this activity
Threats • Future droughts/rain-failure • Lack of appropriate sites to establish an apiary • Application of pesticides, and the presence of
predators (such as honey badger and birds) and pests (wax moths) are challenges to beekeeping activities
• Shortage of bee colonies limits expansion of beekeeping activities
• Knowledge and skills gap in modern beekeeping still exists
Summary of findings from 15 focus groups
49
4. DISCUSSION
4.1 Methodological Issues In terms of rigorous impact assessment of the PSNP Plus program in Doba, the assessment team faced a number of major constraints. Firstly, due to delays in project implementation and the availability of project participant lists, the baseline assessment was carried out 10 months after the project started. Although little impact could be expected at this point in time, the assessment team opted to use a retrospective baseline approach and a certain level of recall bias can be expected in the baseline results. Although the results from the assessment proved to be normally distributed, it is unclear whether a recall bias may have resulted in a positive or negative exaggeration of household assets. Secondly, although all field research can be expected to have some level of bias, conventional impact assessments typically overcome bias through the use of controls and representative sampling techniques. For a number of reasons, the assessment in Doba opted not to use a control, most importantly because a reliable comparison group could not be identified given the long history of similar interventions in the area and the likelihood of control group contamination over the course of the study. The study therefore addressed validity issues by using methods such as participatory ranking and scoring of factors contributing to any assessed impact. Nonetheless, such comparisons do not completely solve the problem of bias. Other assessment and methodological constraints included issues around sampling, timing and logistics, possible respondent bias, and secondary data limitations. A more detailed discussion on the assessment constraints is presented in the baseline and mid term report.
4.2 Changes in Household Income and Expenditure
4.2.1 Income Sources The results from the assessment in Doba indicate that there have been some significant changes in household income since the PSNP Plus started which can be attributed to both program interventions and external factors. Across all three samples (Old, New, Honey) there has been a significant increase in the contribution of income derived from white pea bean sales relative to all other income sources (figures 1-3). Arguably this can be attributed to the white pea bean value chain activities implemented under the program. Although on the surface this would appear not to apply to the honey sample, by the third year of the project 63% of the honey sample was also involved in this value chain and would have been in a position to benefit from this intervention (table 7). This is particularly encouraging considering that the first white pea bean harvest under the program was largely considered a failure due to a number of reasons but most importantly as a result of rain-failure in 2009. Consequently, the mid term assessment of the project questioned the appropriateness of this intervention in this particular context given the high probability of rain-failure in the area amongst other reasons (see Burns et al, 2010). However, improved rainfall in concert with progress in program implementation has evidently resulted in better production and sales of white pea beans. The results also show a significant decrease in the income contribution from haricot
50
bean sales (figures 1-3). This might be explained by the fact that participants have shifted production to white pea beans due to the higher anticipated returns from this crop. The results also show a significant increase in the contribution of cereals for the old and new samples, and other cash crops for the honey sample (figures 1-3). Again this can be partly attributed to improved rainfall conditions. Between 40-54% of participants across all three samples were involved in the cereal value chain activities (table 7). Although this value chain was not assessed, the improved seed varieties distributed under this value chain may have contributed to this increase. The results also show a significant increase in the contribution of income from petty trade for the honey and new sample (figures 1-3). Again this could be an indirect result of greater investments in petty trade activities facilitated through project derived savings and loans, in particular those derived from VSLA participation. For example, the results indicate that investments in petty trade represent the second most important use of savings and loans (figure 8). Consistent with this, 96% and 99% of participants in the honey and new sample were involved in VSLA groups (table 7). The results also show a significant decrease in income contributions from livestock production and sales for both the honey and new sample (figures 2-3). The results from the midterm assessment showed a significant decrease in livestock due to both mortality and stress sales as people sold there livestock assets in order to cope with the production and income losses associated with rain-failure in 2009 (see Burns et al, 2010). As such, in the short term, income from livestock sales would be expected to decrease which might explain this result. Given the improved conditions in 2010, over time households would be expected to build up their herds as insurance against future shocks. A significant decrease in income from firewood sales (honey & new) and labor (old) was also observed (figures 1-3). During the baseline assessment participants indicated that that they typically expand on these options as an economic coping strategy during times of food and income shortages (Burns et al, 2010). Therefore, a reduced dependency on these sources of income reflects an improvement in overall livelihoods. Although this can largely be attributed to improved rainfall conditions, it might also suggest that the PSNP Plus program has contributed towards improving people’s resiliency by reducing their dependency on these sources of income.
4.2.2 Actual Income and Expenditure The results show that there have been some significant changes in total expenditure and actual expenditure on certain items since the project started. For example, there has been a significant increase in investments in agricultural inputs and loan repayments across all three categories (figures 4-6). This might partly be explained by an increase in investments in value chain inputs and improved access to microfinance as a result of the project. There has also been a significant increase in expenditure on clothes for the honey and new samples (figures 5-6) and in household items and social obligations for the old sample (figure 4). This trend can be explained by the fact that between 66-70% of households across all three samples reported an increase in income since 2008 which can partly be attributed to project interventions (table 18). There has also been a significant increase in mean expenditure on key items since the project started (table 9). If we consider expenditure as a proxy for income, this would suggest that actual income has increased significantly. However, this may not necessarily indicate a major improvement in purchasing power once inflation and increasing food prices have been taken into account.
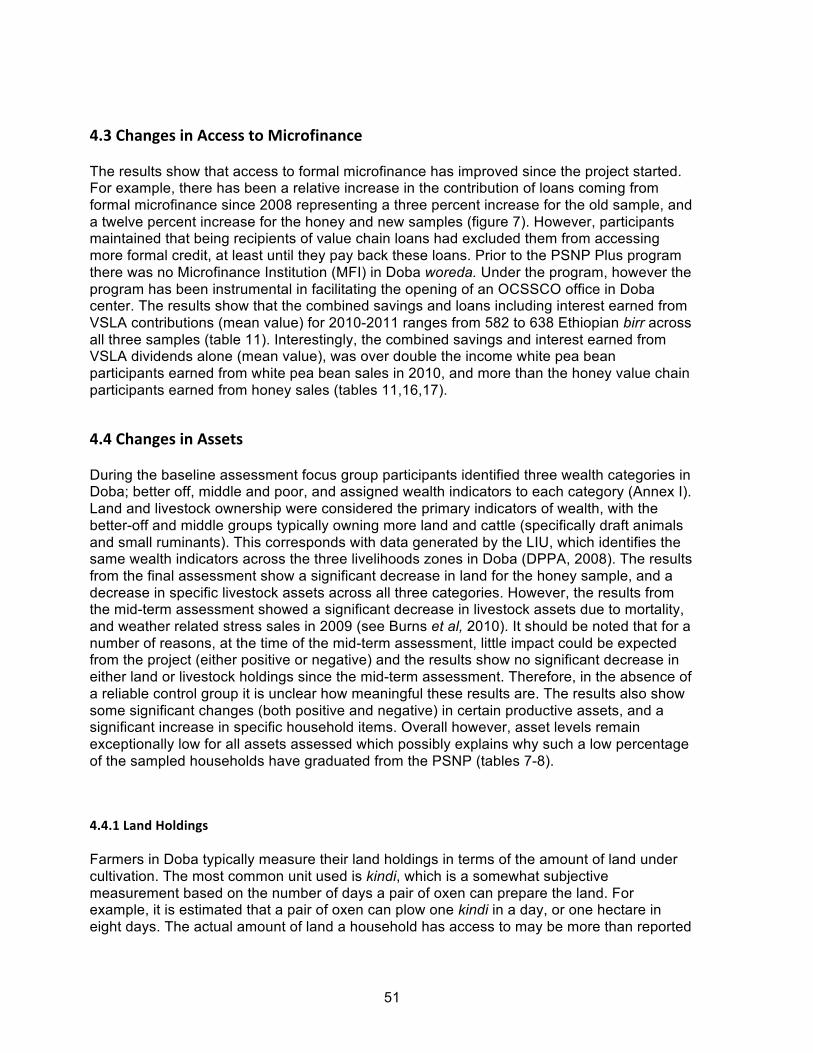
51
4.3 Changes in Access to Microfinance The results show that access to formal microfinance has improved since the project started. For example, there has been a relative increase in the contribution of loans coming from formal microfinance since 2008 representing a three percent increase for the old sample, and a twelve percent increase for the honey and new samples (figure 7). However, participants maintained that being recipients of value chain loans had excluded them from accessing more formal credit, at least until they pay back these loans. Prior to the PSNP Plus program there was no Microfinance Institution (MFI) in Doba woreda. Under the program, however the program has been instrumental in facilitating the opening of an OCSSCO office in Doba center. The results show that the combined savings and loans including interest earned from VSLA contributions (mean value) for 2010-2011 ranges from 582 to 638 Ethiopian birr across all three samples (table 11). Interestingly, the combined savings and interest earned from VSLA dividends alone (mean value), was over double the income white pea bean participants earned from white pea bean sales in 2010, and more than the honey value chain participants earned from honey sales (tables 11,16,17).
4.4 Changes in Assets During the baseline assessment focus group participants identified three wealth categories in Doba; better off, middle and poor, and assigned wealth indicators to each category (Annex I). Land and livestock ownership were considered the primary indicators of wealth, with the better-off and middle groups typically owning more land and cattle (specifically draft animals and small ruminants). This corresponds with data generated by the LIU, which identifies the same wealth indicators across the three livelihoods zones in Doba (DPPA, 2008). The results from the final assessment show a significant decrease in land for the honey sample, and a decrease in specific livestock assets across all three categories. However, the results from the mid-term assessment showed a significant decrease in livestock assets due to mortality, and weather related stress sales in 2009 (see Burns et al, 2010). It should be noted that for a number of reasons, at the time of the mid-term assessment, little impact could be expected from the project (either positive or negative) and the results show no significant decrease in either land or livestock holdings since the mid-term assessment. Therefore, in the absence of a reliable control group it is unclear how meaningful these results are. The results also show some significant changes (both positive and negative) in certain productive assets, and a significant increase in specific household items. Overall however, asset levels remain exceptionally low for all assets assessed which possibly explains why such a low percentage of the sampled households have graduated from the PSNP (tables 7-8).
4.4.1 Land Holdings Farmers in Doba typically measure their land holdings in terms of the amount of land under cultivation. The most common unit used is kindi, which is a somewhat subjective measurement based on the number of days a pair of oxen can prepare the land. For example, it is estimated that a pair of oxen can plow one kindi in a day, or one hectare in eight days. The actual amount of land a household has access to may be more than reported
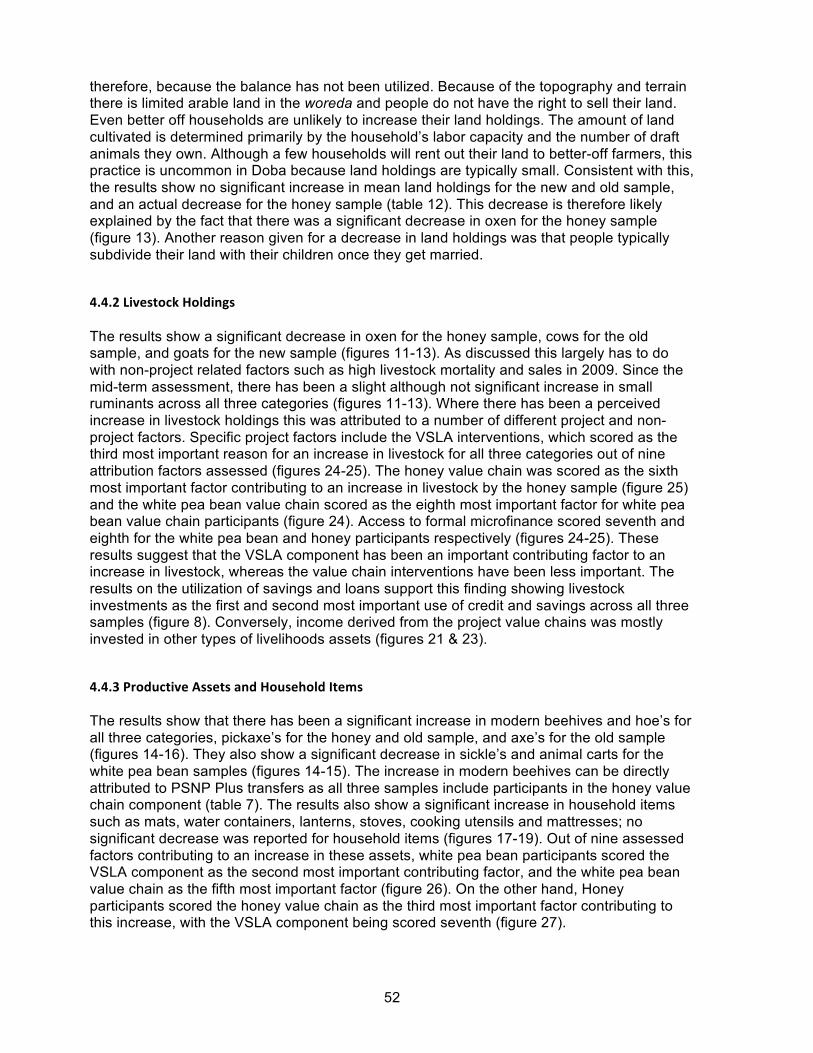
52
therefore, because the balance has not been utilized. Because of the topography and terrain there is limited arable land in the woreda and people do not have the right to sell their land. Even better off households are unlikely to increase their land holdings. The amount of land cultivated is determined primarily by the household’s labor capacity and the number of draft animals they own. Although a few households will rent out their land to better-off farmers, this practice is uncommon in Doba because land holdings are typically small. Consistent with this, the results show no significant increase in mean land holdings for the new and old sample, and an actual decrease for the honey sample (table 12). This decrease is therefore likely explained by the fact that there was a significant decrease in oxen for the honey sample (figure 13). Another reason given for a decrease in land holdings was that people typically subdivide their land with their children once they get married.
4.4.2 Livestock Holdings The results show a significant decrease in oxen for the honey sample, cows for the old sample, and goats for the new sample (figures 11-13). As discussed this largely has to do with non-project related factors such as high livestock mortality and sales in 2009. Since the mid-term assessment, there has been a slight although not significant increase in small ruminants across all three categories (figures 11-13). Where there has been a perceived increase in livestock holdings this was attributed to a number of different project and non-project factors. Specific project factors include the VSLA interventions, which scored as the third most important reason for an increase in livestock for all three categories out of nine attribution factors assessed (figures 24-25). The honey value chain was scored as the sixth most important factor contributing to an increase in livestock by the honey sample (figure 25) and the white pea bean value chain scored as the eighth most important factor for white pea bean value chain participants (figure 24). Access to formal microfinance scored seventh and eighth for the white pea bean and honey participants respectively (figures 24-25). These results suggest that the VSLA component has been an important contributing factor to an increase in livestock, whereas the value chain interventions have been less important. The results on the utilization of savings and loans support this finding showing livestock investments as the first and second most important use of credit and savings across all three samples (figure 8). Conversely, income derived from the project value chains was mostly invested in other types of livelihoods assets (figures 21 & 23).
4.4.3 Productive Assets and Household Items The results show that there has been a significant increase in modern beehives and hoe’s for all three categories, pickaxe’s for the honey and old sample, and axe’s for the old sample (figures 14-16). They also show a significant decrease in sickle’s and animal carts for the white pea bean samples (figures 14-15). The increase in modern beehives can be directly attributed to PSNP Plus transfers as all three samples include participants in the honey value chain component (table 7). The results also show a significant increase in household items such as mats, water containers, lanterns, stoves, cooking utensils and mattresses; no significant decrease was reported for household items (figures 17-19). Out of nine assessed factors contributing to an increase in these assets, white pea bean participants scored the VSLA component as the second most important contributing factor, and the white pea bean value chain as the fifth most important factor (figure 26). On the other hand, Honey participants scored the honey value chain as the third most important factor contributing to this increase, with the VSLA component being scored seventh (figure 27).
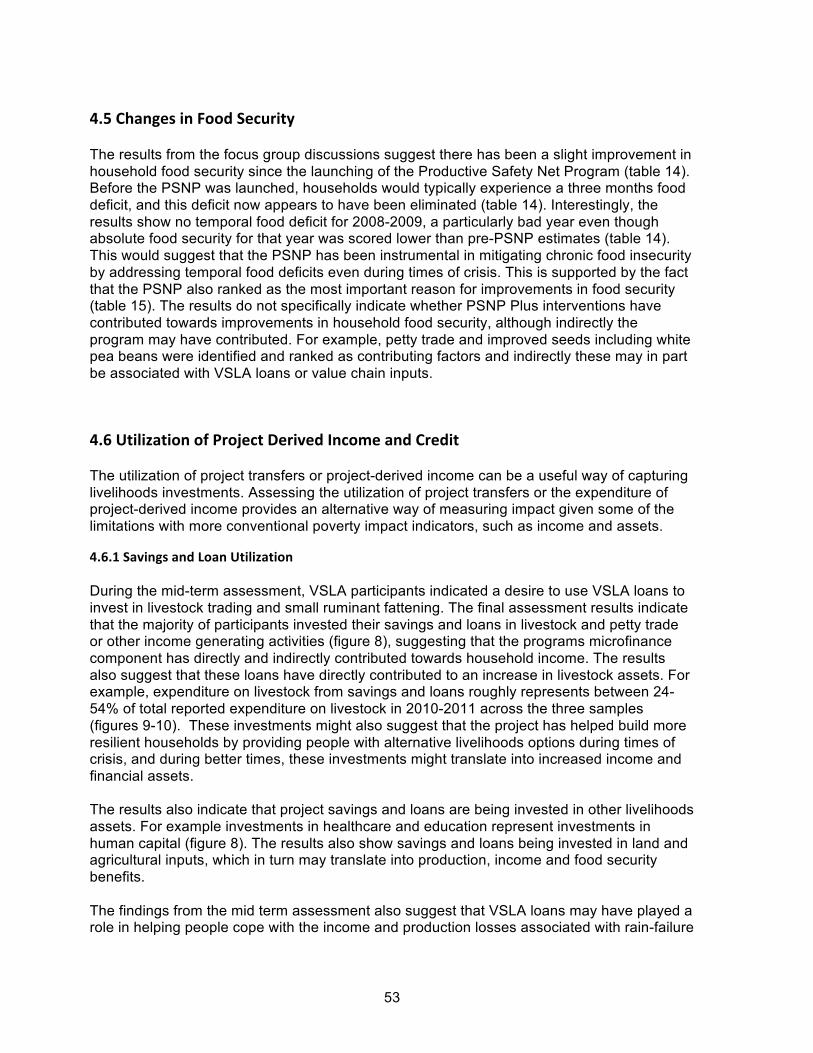
53
4.5 Changes in Food Security The results from the focus group discussions suggest there has been a slight improvement in household food security since the launching of the Productive Safety Net Program (table 14). Before the PSNP was launched, households would typically experience a three months food deficit, and this deficit now appears to have been eliminated (table 14). Interestingly, the results show no temporal food deficit for 2008-2009, a particularly bad year even though absolute food security for that year was scored lower than pre-PSNP estimates (table 14). This would suggest that the PSNP has been instrumental in mitigating chronic food insecurity by addressing temporal food deficits even during times of crisis. This is supported by the fact that the PSNP also ranked as the most important reason for improvements in food security (table 15). The results do not specifically indicate whether PSNP Plus interventions have contributed towards improvements in household food security, although indirectly the program may have contributed. For example, petty trade and improved seeds including white pea beans were identified and ranked as contributing factors and indirectly these may in part be associated with VSLA loans or value chain inputs.
4.6 Utilization of Project Derived Income and Credit The utilization of project transfers or project-derived income can be a useful way of capturing livelihoods investments. Assessing the utilization of project transfers or the expenditure of project-derived income provides an alternative way of measuring impact given some of the limitations with more conventional poverty impact indicators, such as income and assets.
4.6.1 Savings and Loan Utilization During the mid-term assessment, VSLA participants indicated a desire to use VSLA loans to invest in livestock trading and small ruminant fattening. The final assessment results indicate that the majority of participants invested their savings and loans in livestock and petty trade or other income generating activities (figure 8), suggesting that the programs microfinance component has directly and indirectly contributed towards household income. The results also suggest that these loans have directly contributed to an increase in livestock assets. For example, expenditure on livestock from savings and loans roughly represents between 24-54% of total reported expenditure on livestock in 2010-2011 across the three samples (figures 9-10). These investments might also suggest that the project has helped build more resilient households by providing people with alternative livelihoods options during times of crisis, and during better times, these investments might translate into increased income and financial assets. The results also indicate that project savings and loans are being invested in other livelihoods assets. For example investments in healthcare and education represent investments in human capital (figure 8). The results also show savings and loans being invested in land and agricultural inputs, which in turn may translate into production, income and food security benefits. The findings from the mid term assessment also suggest that VSLA loans may have played a role in helping people cope with the income and production losses associated with rain-failure
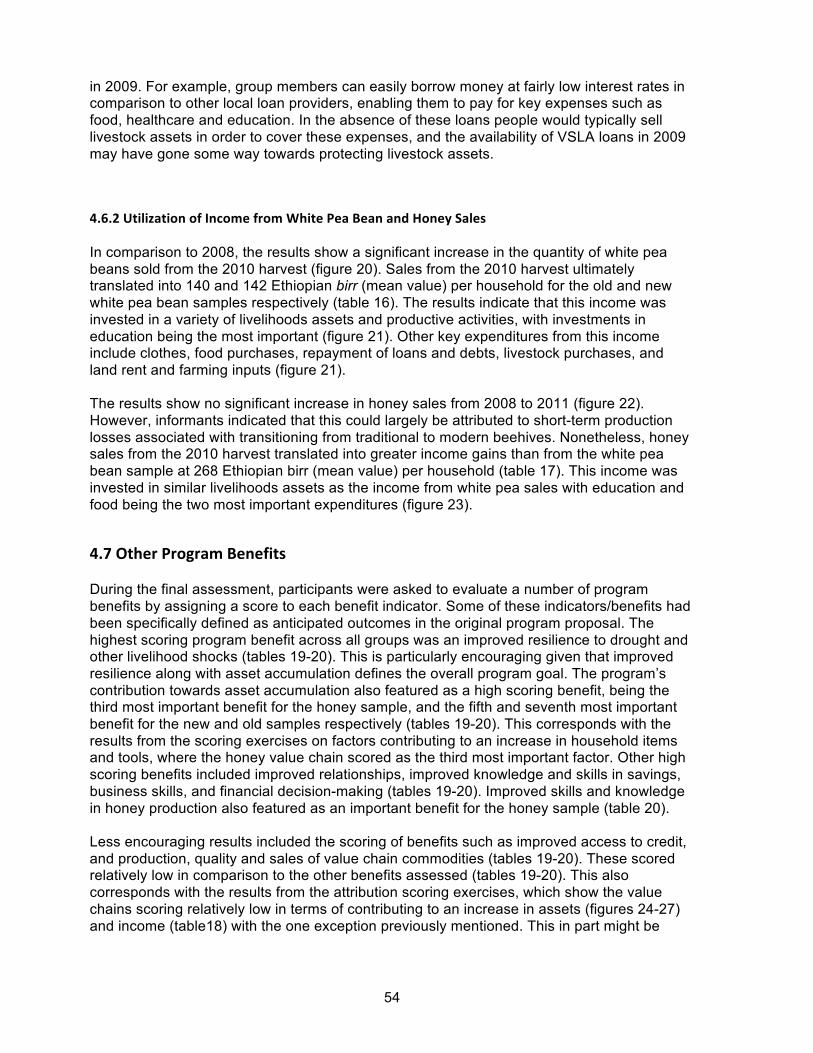
54
in 2009. For example, group members can easily borrow money at fairly low interest rates in comparison to other local loan providers, enabling them to pay for key expenses such as food, healthcare and education. In the absence of these loans people would typically sell livestock assets in order to cover these expenses, and the availability of VSLA loans in 2009 may have gone some way towards protecting livestock assets.
4.6.2 Utilization of Income from White Pea Bean and Honey Sales In comparison to 2008, the results show a significant increase in the quantity of white pea beans sold from the 2010 harvest (figure 20). Sales from the 2010 harvest ultimately translated into 140 and 142 Ethiopian birr (mean value) per household for the old and new white pea bean samples respectively (table 16). The results indicate that this income was invested in a variety of livelihoods assets and productive activities, with investments in education being the most important (figure 21). Other key expenditures from this income include clothes, food purchases, repayment of loans and debts, livestock purchases, and land rent and farming inputs (figure 21). The results show no significant increase in honey sales from 2008 to 2011 (figure 22). However, informants indicated that this could largely be attributed to short-term production losses associated with transitioning from traditional to modern beehives. Nonetheless, honey sales from the 2010 harvest translated into greater income gains than from the white pea bean sample at 268 Ethiopian birr (mean value) per household (table 17). This income was invested in similar livelihoods assets as the income from white pea sales with education and food being the two most important expenditures (figure 23).
4.7 Other Program Benefits During the final assessment, participants were asked to evaluate a number of program benefits by assigning a score to each benefit indicator. Some of these indicators/benefits had been specifically defined as anticipated outcomes in the original program proposal. The highest scoring program benefit across all groups was an improved resilience to drought and other livelihood shocks (tables 19-20). This is particularly encouraging given that improved resilience along with asset accumulation defines the overall program goal. The program’s contribution towards asset accumulation also featured as a high scoring benefit, being the third most important benefit for the honey sample, and the fifth and seventh most important benefit for the new and old samples respectively (tables 19-20). This corresponds with the results from the scoring exercises on factors contributing to an increase in household items and tools, where the honey value chain scored as the third most important factor. Other high scoring benefits included improved relationships, improved knowledge and skills in savings, business skills, and financial decision-making (tables 19-20). Improved skills and knowledge in honey production also featured as an important benefit for the honey sample (table 20). Less encouraging results included the scoring of benefits such as improved access to credit, and production, quality and sales of value chain commodities (tables 19-20). These scored relatively low in comparison to the other benefits assessed (tables 19-20). This also corresponds with the results from the attribution scoring exercises, which show the value chains scoring relatively low in terms of contributing to an increase in assets (figures 24-27) and income (table18) with the one exception previously mentioned. This in part might be
55
explained by the fact that the value chains faced considerable challenges on the production side during the first year of the program3. Furthermore, one of the lessons learned from the PSNP Plus program is that it would be unrealistic to expect significant short-term impact from white pea bean or honey value chain interventions, particularly where these commodities are being introduced for the first time. Alternatively, participants may simply have perceived the other outcomes and benefits assessed as more important benchmarks of project impact, and scored these accordingly.
CONCLUSION The overall findings from the study show some positive impact on livelihoods although the results are somewhat mixed. For example, there have been positive changes in income and in certain assets but negative changes in other key assets and little impact in terms of PSNP graduation. When analyzing these results it is important to examine them in the context of the rain-failure in 2009 and other project challenges faced during project implementation. The failed harvest in 2009 ultimately resulted in a significant decrease in household income and livestock assets. It also resulted in the failure of the first white pea bean crop planted under this value chain project component in Doba. Delays in the procurement of both seeds and beekeeping accessories also translated into little or no productivity during the first production cycle, and ultimately, significant production benefits for both honey and white pea beans were only realized towards the end of the project. As such, the study findings show considerably greater impact from the projects informal microfinance activities than from the value chain component. In order to effectively capture the impact of these interventions, the final impact study would ideally take place in the absence of any external production shocks, and after at least two consecutive production cycles. Nonetheless, even though the potential impact from the honey and white pea bean interventions is yet to be realized, these two value chains have had some impact and contributed towards improved household resiliency. For example, the honey value chain was scored as a moderately important factor contributing towards household asset accumulation and the overall income contribution from white pea beans has increased significantly relative to other income sources. These results suggest that the potential long-term impact of these value chains could be considerable, particularly in the absence of any major production shock. On the other hand the projects microfinance interventions, notably the VSLA component, appears to have had a fairly immediate impact. The results from the mid term assessment suggested that the projects VSLA activities helped people cope with the impact of rain-failure in 2009, and possibly even helped people protect some of their assets. (Burns et al, 2010). As mentioned the VSLA also scored as an important factor contributing to any assessed increase in income and assets. The combined impact of the project interventions has helped people recover from the effects of rain-failure in 2009. The project has also improved the resilience of participating households and allowed for some physical and financial asset accumulation. Possibly of greater importance, the project appears to have had a considerable impact on both human 3 See Burns et al, 2010 for more details
56
and social capital, with project outcomes such as knowledge and skills transfers, and improved relationships being scored higher by participants than some of the more anticipated production and income benefits. Although perhaps less tangible than financial and physical capital, these benefits might be considered a useful proxy for resiliency in that they have the potential to be converted into future income and production benefits. The evidence from this case study shows that the combination of microfinance and market oriented interventions can help improve resiliency, and contribute towards improved income and asset accumulation. The study findings also indicate that over time the potential benefits from honey and white pea bean production could be even greater, and the longer-term impact from these interventions could be significant. For future programs such as the HABP and Graduation with Resiliency to Achieve Sustainable Graduation (GRAD), a number of key challenges have been identified and certain lessons can be drawn from the PSNP Plus in Doba. One of the key lessons from this case study is that the potential impact from certain types of value chain interventions is likely to take longer than desired given the challenges involved in procuring inputs and delays associated with training farmers and establishing viable market linkages amongst other factors. As such, for honey and white pea bean value chains, impact should be seen as a longer-term intervention goal requiring several successful harvests. Preparation and timing are also critical if inputs are to be transferred and effectively utilized by value chain participants - in time for them to benefit from a particular planting/production season. Pertaining to this, careful consideration needs to be given before committing to input transfers, and the evidence from this case study suggests that in some cases the first year of project implementation may be too early for these transfers to take place. Similar considerations should be factored into GRAD and HABP, although the longer time frame for these initiatives will be an advantage. The results from the study indicate that the most significant event affecting the livelihoods of project participants was rain-failure in 2009. Although there has been considerable recovery since then, and in part this can be attributed to the PSNP Plus program, it does raise a number of concerns. Firstly, in contexts like Doba, rain-failure is common, and as such rain dependent value chains and agricultural credit can be extremely risky, particularly for poor food insecure households without insurance or the financial resources to absorb this kind of risk. Fortunately, project participants in Doba appear to have partially recovered from the 2009 harvest failure with more favorable conditions in 2010. The fundamental question however is whether they will continue to recover and accumulate assets in the event that another major livelihood shock occurs in the next few years. When identifying potential microfinance and value chain interventions in similar contexts, rain or production failure should be assumed, and risk mitigation measures factored into the design. For both GRAD and HABP, crop insurance mechanisms and flexible loan repayment procedures should be considered to minimize the risks faced by vulnerable households participating in rain dependent value chains. Without these mechanisms there is a possibility that credit and value chain interventions could potentially leave people indebted and more vulnerable. The study in Doba also highlighted some of the major constraints to productive capacity and how these constraints can undermine the impact of production based interventions. One of the key constraints identified was the lack of land and associated with this the ability to utilize this land due to time and labor shortages and lack of draft animals. The lack of draft animals
57
is typically associated with the poorest households who are also less likely to have cash to pay for labor or inputs, and time as they are involved in a variety of livelihood strategies to ensure their short-term food and cash needs. Consequently these households typically produce less food for their own consumption, spend more on food purchases, and are effectively caught in a trap of poverty and food insecurity. Although this is hardly an original or startling finding, it raises the question of whether these particular households can benefit from value chain interventions that require a certain level of resources and productive capacity. For the HABP and GRAD programs it is recommended that efforts be made to identify which households have the capacity to fully participate and benefit in a specific value chain and target accordingly. Where options exist to enhance productive capacity, such as Oxen credit, these should be explored and alternative credit and livelihoods interventions should be considered for households without the skills and capacity to effectively engage in agricultural production. Where crop based value chains are not appropriate for certain households, both livestock fattening and honey production offer possibilities that may be better suited to certain households. One advantage is that neither of these options requires much land although for honey production both technical capacity and locality will limit targeting to certain localities and households4. In terms of livestock, the results from other LIS case studies indicate that livestock credit appears to be a more flexible arrangement for a wider variety of household typologies in allowing them to engage in livestock rearing, trading, speculating, partial fattening or complete body fattening – depending on their capacity, needs, and the extent in which they were willing to invest. The results also indicate that livestock value chains appear to be more resilient to drought and weather related shocks than rain dependent crop value chains. In part this also has to do with the flexibility and options mentioned. For many of these reasons, in Doba, the cereal value chain was actually replaced with a livestock fattening value chain based on the preferences of participants identified during the mid-term assessment. This evidence would suggest that for both GRAD and HABP, livestock credit may well provide a suitable alternative to crop based value chains for households with limited land, labor and draft animals. On a side note, where feasible and realistic, intervention preferences should be canvased from participants in both GRAD and HABP ideally before an intervention is designed. Furthermore, the flexibility to refine and even abandon or include activities based on evidence as to what’s working or not should also be incorporated into all future value chain projects.
4 Interestingly however, honey producers in this study appeared to be better off than other participants and by all indications had greater capacity to engage in crop production as well.
58
References and Further Reading Burns, J., Bogale, S., and Bekele, G (2010) Linking Poor Rural Households to Microfinance and Markets in Ethiopia; Baseline and Mid-Term Assessment of the PSNP Plus project in Doba, Feinstein International Center, Medford, MA CARE (2009) PSNP Plus Project, Linking Poor Rural Households to Microfinance and Markets: Year One Annual Report and 4th Quarter Programmatic Report; July 2009 to September 2009. Addis Ababa. Catley, A. Burns, J, Abebe, D, and Omeno, W. 2008: Participatory Impact Assessment: A Guide for Practitioners, Feinstein International Center, Medford, MA 2008 Devereux, S., Sabates-Wheeler, R., Tefera, M and Taye, H. (2006) Ethiopia’s Productive Safety Net Programme (PSNP), Trends in PSNP Transfers Within Targeted Households, Final Report. IDS: Brighton UK, Indak, International, Addis Ababa 2006. Disaster Preparedness and Prevention Agency (2008) Livelihood Profile Oromiya Region, Ethiopia: Sorghum Maize and Chat (SMC) Livelihood Zone. Report from the Livelihoods Information Unit, Disaster Preparedness and Prevention Agency (DPPA) Addis Ababa, April 2008 Disaster Preparedness and Prevention Agency (2008) Livelihood Profile Oromiya Region, Ethiopia: Wheat Barley and Potato Livelihood Zone. Report from the Livelihoods Information Unit, Disaster Preparedness and Prevention Agency (DPPA) Addis Ababa, April 2008 Disaster Preparedness and Prevention Agency (2008) Livelihood Profile Oromiya Region, Ethiopia: North East Agro Pastoralist (NAP) Livelihood Zone. Report from the Livelihoods Information Unit, Disaster Preparedness and Prevention Agency (DPPA) Addis Ababa March 2008 Gilligan, D., Hodinott, J., Kumar, N., Taffasse, A, S., Dejene, S., Gezahegn, F., and Yohannes, Y. (2009) Ethiopia Food Security Program: Report on 2008 Survey. International Food Policy Research Institute (IFPRI). Washington, D.C. Micro Development Training and Consultancy Services (2010) Final Report – Financial Product Development and Linkage Mechanism – PSNP Plus, Addis Ababa. Ministry of Agriculture and Rural Development (MoARD, 2009), Food Security Programme 2010-2014: Household Asset Building. Ministry of Agriculture and Rural Development, Addis Ababa, August 2009 Ministry of Agriculture and Rural Development (2007), Productive Safety net Programme: Graduation Guidance Note, Food Security Co-ordination Bureau, Ministry of Agriculture and Rural Development, Addis Ababa, December, 2007 Ministry of Agriculture and Rural Development (2006) Productive Safety Net Programme: Programme Implementation Manual. Addis Ababa, Ministry of Agriculture and Rural Development, Government of the Federal Democratic Republic of Ethiopia. Pankhurst (2009) Rethinking Safetynets and Household Vulnerability in Ethiopia: Implications of Household Cycles, Types and Shocks. Paper presented at the World Conference of Humanitarian Studies, Groningen, Netherlands. 4-7 February 2009 PSNP Plus Project Proposal (2008) Bringing Ultimate Yields through Integrated Networks (BUY IN): Linking Poor Rural Households to Microfinance and Markets Sabates- Wheeler, R., and Devereux, S. (2010) Cash transfers and high food prices: Explaining
59
outcomes on Ethiopia’s Productive Safety Net Programme. Food Policy article in press (2010) Sharp, K., Brown, T, and Teshome, A. (2006) Targeting Ethiopia’s Productive Safety Net Programme (PSNP) Overseas Development Institute (ODI) August 2006.
Slater, R., Adhley, S., Tefera, M., Butta, M, and Esubalew. (2006). PSNP Policy, Programmes and Institutional Linkages, Final Report. USAID (2008) Linking Poor Rural Households to Microfinance and Markets; RFA No: 663-A-08-015. USAID, Ethiopia, Addis Ababa, March 2008. Wikipedia (2010) Doba (woreda) accessed on 20th February 2010 from http://en.wikipedia.org/wiki/Doba_%28woreda%29
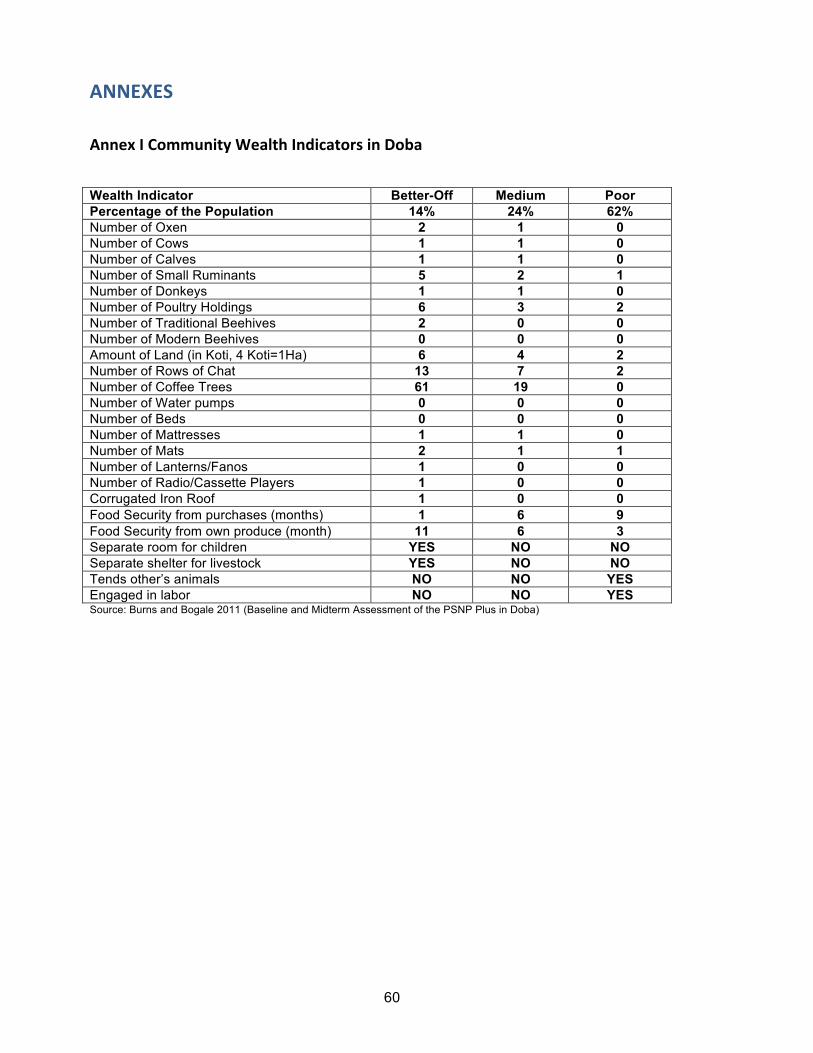
60
ANNEXES
Annex I Community Wealth Indicators in Doba Wealth Indicator Better-Off Medium Poor Percentage of the Population 14% 24% 62% Number of Oxen 2 1 0 Number of Cows 1 1 0 Number of Calves 1 1 0 Number of Small Ruminants 5 2 1 Number of Donkeys 1 1 0 Number of Poultry Holdings 6 3 2 Number of Traditional Beehives 2 0 0 Number of Modern Beehives 0 0 0 Amount of Land (in Koti, 4 Koti=1Ha) 6 4 2 Number of Rows of Chat 13 7 2 Number of Coffee Trees 61 19 0 Number of Water pumps 0 0 0 Number of Beds 0 0 0 Number of Mattresses 1 1 0 Number of Mats 2 1 1 Number of Lanterns/Fanos 1 0 0 Number of Radio/Cassette Players 1 0 0 Corrugated Iron Roof 1 0 0 Food Security from purchases (months) 1 6 9 Food Security from own produce (month) 11 6 3 Separate room for children YES NO NO Separate shelter for livestock YES NO NO Tends other’s animals NO NO YES Engaged in labor NO NO YES Source: Burns and Bogale 2011 (Baseline and Midterm Assessment of the PSNP Plus in Doba)
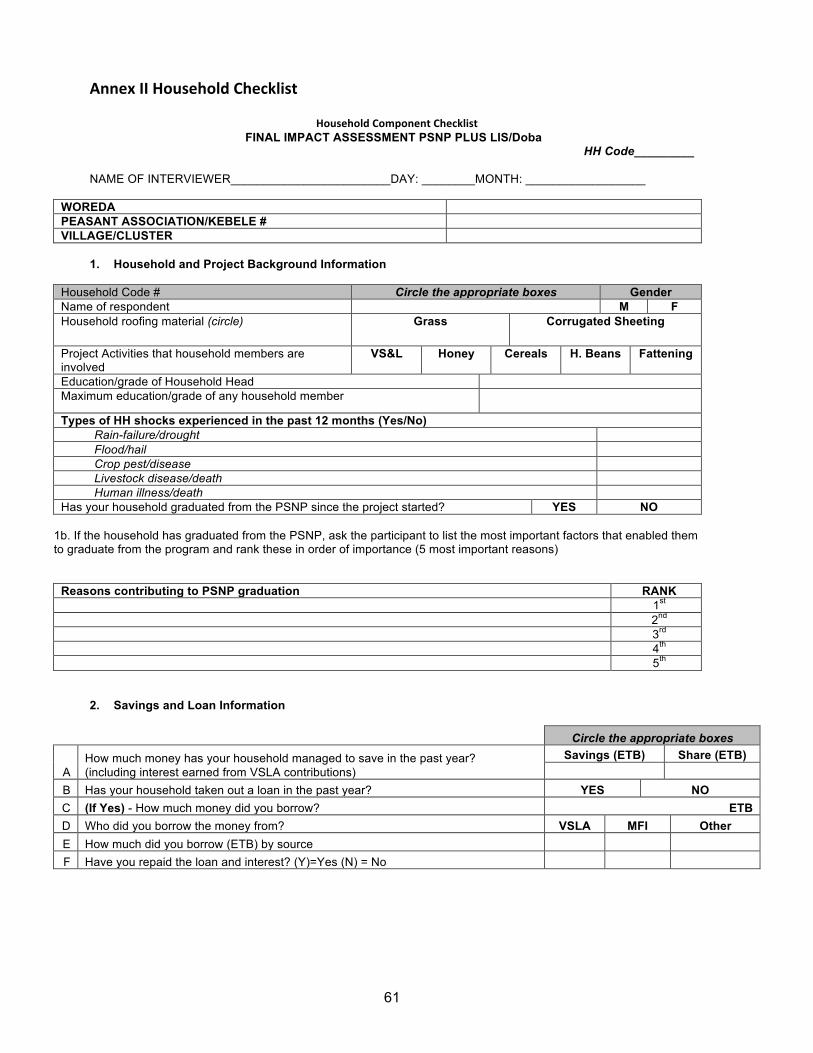
61
Annex II Household Checklist
Household Component Checklist FINAL IMPACT ASSESSMENT PSNP PLUS LIS/Doba
HH Code_________ NAME OF INTERVIEWER________________________DAY: ________MONTH: __________________
WOREDA PEASANT ASSOCIATION/KEBELE # VILLAGE/CLUSTER
1. Household and Project Background Information
Household Code # Circle the appropriate boxes Gender Name of respondent M F Household roofing material (circle) Grass Corrugated Sheeting
Project Activities that household members are involved
VS&L Honey Cereals H. Beans Fattening
Education/grade of Household Head Maximum education/grade of any household member
Types of HH shocks experienced in the past 12 months (Yes/No) Rain-failure/drought Flood/hail Crop pest/disease Livestock disease/death Human illness/death Has your household graduated from the PSNP since the project started? YES NO
1b. If the household has graduated from the PSNP, ask the participant to list the most important factors that enabled them to graduate from the program and rank these in order of importance (5 most important reasons)
Reasons contributing to PSNP graduation RANK 1st 2nd 3rd 4th 5th
2. Savings and Loan Information
Circle the appropriate boxes
A How much money has your household managed to save in the past year? (including interest earned from VSLA contributions)
Savings (ETB) Share (ETB)
B Has your household taken out a loan in the past year? YES NO C (If Yes) - How much money did you borrow? ETB D Who did you borrow the money from? VSLA MFI Other E How much did you borrow (ETB) by source F Have you repaid the loan and interest? (Y)=Yes (N) = No
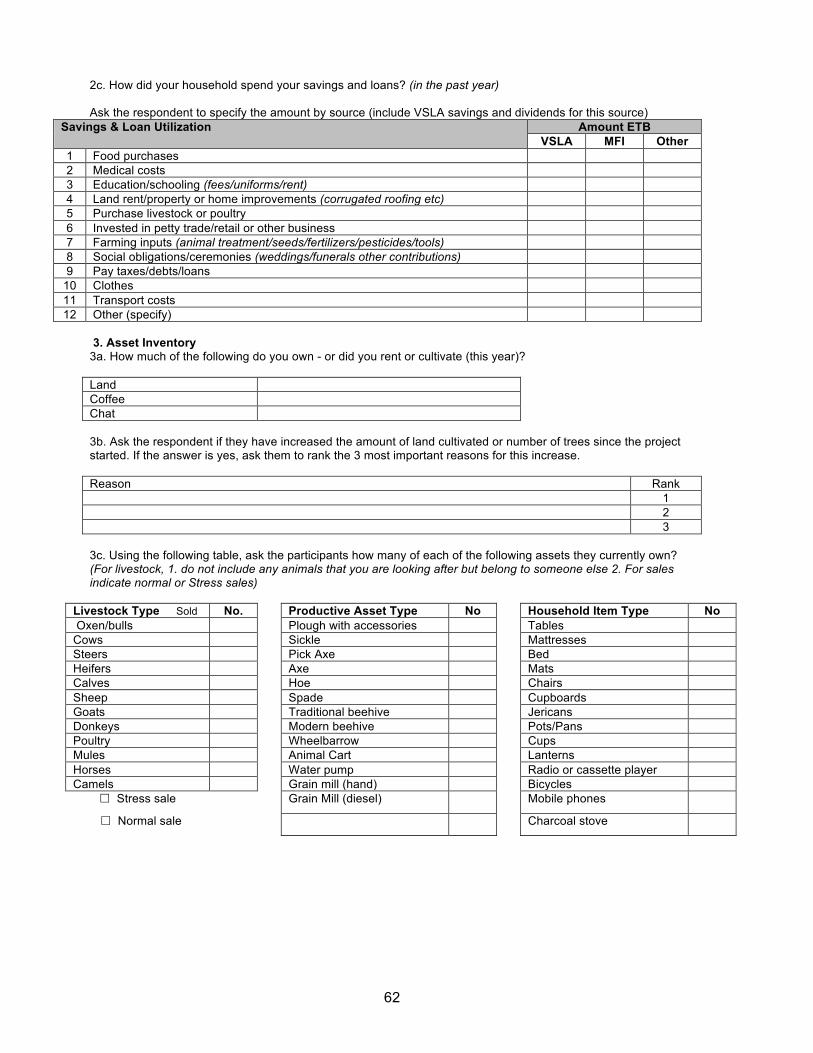
62
2c. How did your household spend your savings and loans? (in the past year) Ask the respondent to specify the amount by source (include VSLA savings and dividends for this source)
Savings & Loan Utilization Amount ETB VSLA MFI Other
1 Food purchases 2 Medical costs 3 Education/schooling (fees/uniforms/rent) 4 Land rent/property or home improvements (corrugated roofing etc) 5 Purchase livestock or poultry 6 Invested in petty trade/retail or other business 7 Farming inputs (animal treatment/seeds/fertilizers/pesticides/tools) 8 Social obligations/ceremonies (weddings/funerals other contributions) 9 Pay taxes/debts/loans
10 Clothes 11 Transport costs 12 Other (specify)
3. Asset Inventory 3a. How much of the following do you own - or did you rent or cultivate (this year)? Land Coffee Chat 3b. Ask the respondent if they have increased the amount of land cultivated or number of trees since the project started. If the answer is yes, ask them to rank the 3 most important reasons for this increase. Reason Rank 1 2 3 3c. Using the following table, ask the participants how many of each of the following assets they currently own? (For livestock, 1. do not include any animals that you are looking after but belong to someone else 2. For sales indicate normal or Stress sales)
Livestock Type Sold No. Productive Asset Type No Household Item Type No Oxen/bulls Plough with accessories Tables Cows Sickle Mattresses Steers Pick Axe Bed Heifers Axe Mats Calves Hoe Chairs Sheep Spade Cupboards Goats Traditional beehive Jericans Donkeys Modern beehive Pots/Pans Poultry Wheelbarrow Cups Mules Animal Cart Lanterns Horses Water pump Radio or cassette player Camels Grain mill (hand) Bicycles
£ Stress sale Grain Mill (diesel) Mobile phones
£ Normal sale Charcoal stove
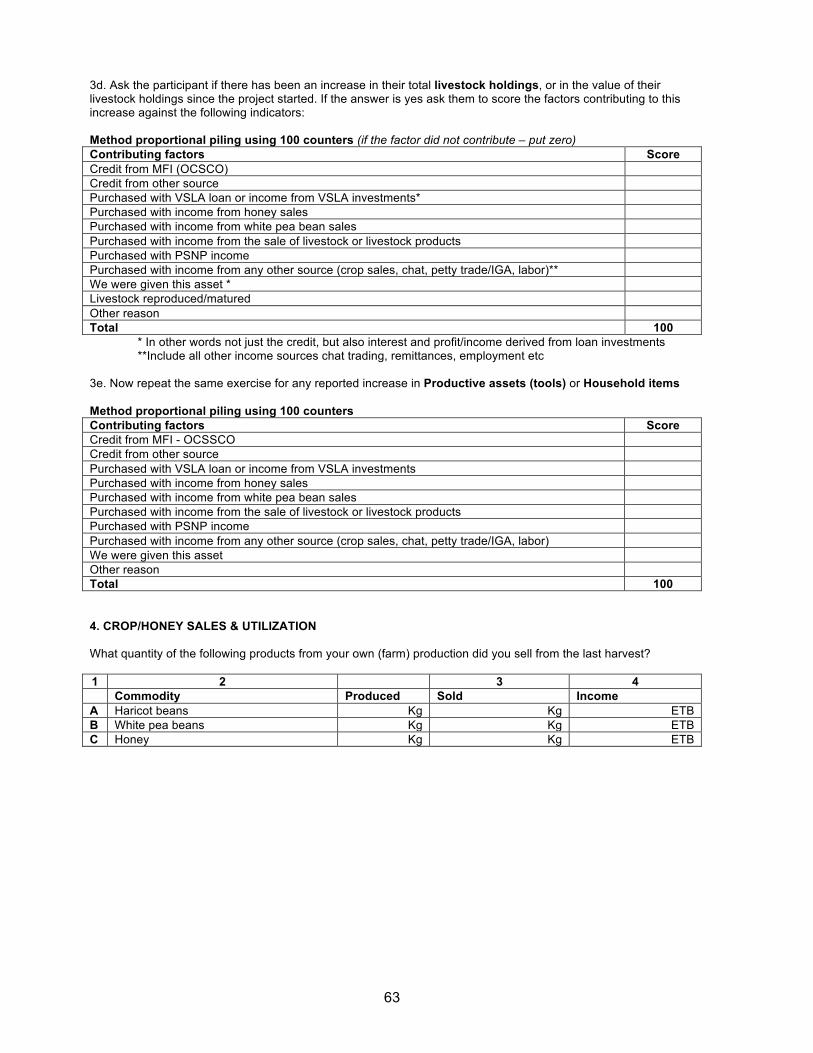
63
3d. Ask the participant if there has been an increase in their total livestock holdings, or in the value of their livestock holdings since the project started. If the answer is yes ask them to score the factors contributing to this increase against the following indicators: Method proportional piling using 100 counters (if the factor did not contribute – put zero) Contributing factors Score Credit from MFI (OCSCO) Credit from other source Purchased with VSLA loan or income from VSLA investments* Purchased with income from honey sales Purchased with income from white pea bean sales Purchased with income from the sale of livestock or livestock products Purchased with PSNP income Purchased with income from any other source (crop sales, chat, petty trade/IGA, labor)** We were given this asset * Livestock reproduced/matured Other reason Total 100
* In other words not just the credit, but also interest and profit/income derived from loan investments **Include all other income sources chat trading, remittances, employment etc
3e. Now repeat the same exercise for any reported increase in Productive assets (tools) or Household items Method proportional piling using 100 counters Contributing factors Score Credit from MFI - OCSSCO Credit from other source Purchased with VSLA loan or income from VSLA investments Purchased with income from honey sales Purchased with income from white pea bean sales Purchased with income from the sale of livestock or livestock products Purchased with PSNP income Purchased with income from any other source (crop sales, chat, petty trade/IGA, labor) We were given this asset Other reason Total 100 4. CROP/HONEY SALES & UTILIZATION What quantity of the following products from your own (farm) production did you sell from the last harvest? 1 2 3 4 Commodity Produced Sold Income A Haricot beans Kg Kg ETB B White pea beans Kg Kg ETB C Honey Kg Kg ETB
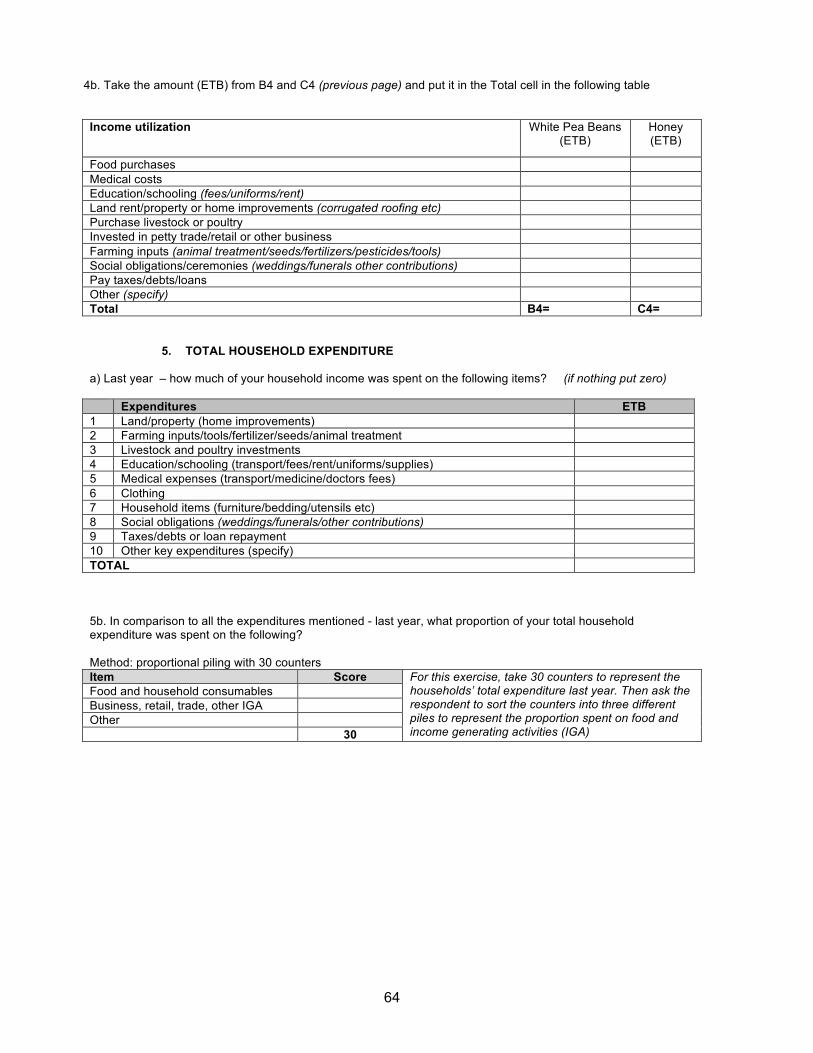
64
4b. Take the amount (ETB) from B4 and C4 (previous page) and put it in the Total cell in the following table
Income utilization White Pea Beans
(ETB) Honey (ETB)
Food purchases Medical costs Education/schooling (fees/uniforms/rent) Land rent/property or home improvements (corrugated roofing etc) Purchase livestock or poultry Invested in petty trade/retail or other business Farming inputs (animal treatment/seeds/fertilizers/pesticides/tools) Social obligations/ceremonies (weddings/funerals other contributions) Pay taxes/debts/loans Other (specify) Total B4= C4=
5. TOTAL HOUSEHOLD EXPENDITURE a) Last year – how much of your household income was spent on the following items? (if nothing put zero) Expenditures ETB 1 Land/property (home improvements) 2 Farming inputs/tools/fertilizer/seeds/animal treatment 3 Livestock and poultry investments 4 Education/schooling (transport/fees/rent/uniforms/supplies) 5 Medical expenses (transport/medicine/doctors fees) 6 Clothing 7 Household items (furniture/bedding/utensils etc) 8 Social obligations (weddings/funerals/other contributions) 9 Taxes/debts or loan repayment 10 Other key expenditures (specify) TOTAL 5b. In comparison to all the expenditures mentioned - last year, what proportion of your total household expenditure was spent on the following? Method: proportional piling with 30 counters Item Score For this exercise, take 30 counters to represent the
households’ total expenditure last year. Then ask the respondent to sort the counters into three different piles to represent the proportion spent on food and income generating activities (IGA)
Food and household consumables Business, retail, trade, other IGA Other 30
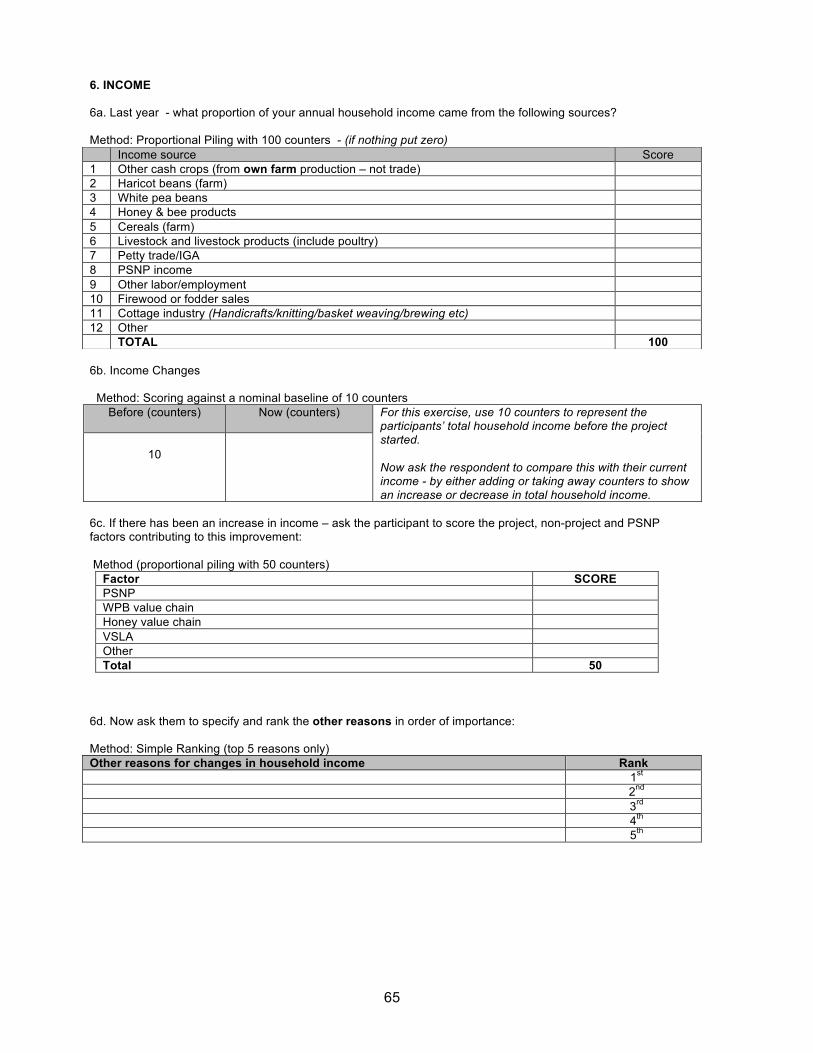
65
6. INCOME 6a. Last year - what proportion of your annual household income came from the following sources? Method: Proportional Piling with 100 counters - (if nothing put zero)
6b. Income Changes Method: Scoring against a nominal baseline of 10 counters
Before (counters)
Now (counters)
For this exercise, use 10 counters to represent the participants’ total household income before the project started. Now ask the respondent to compare this with their current income - by either adding or taking away counters to show an increase or decrease in total household income.
10
6c. If there has been an increase in income – ask the participant to score the project, non-project and PSNP factors contributing to this improvement: Method (proportional piling with 50 counters)
Factor SCORE PSNP WPB value chain Honey value chain VSLA Other Total 50
6d. Now ask them to specify and rank the other reasons in order of importance: Method: Simple Ranking (top 5 reasons only) Other reasons for changes in household income Rank 1st 2nd 3rd 4th 5th
Income source Score 1 Other cash crops (from own farm production – not trade) 2 Haricot beans (farm) 3 White pea beans 4 Honey & bee products 5 Cereals (farm) 6 Livestock and livestock products (include poultry) 7 Petty trade/IGA 8 PSNP income 9 Other labor/employment 10 Firewood or fodder sales 11 Cottage industry (Handicrafts/knitting/basket weaving/brewing etc) 12 Other TOTAL 100
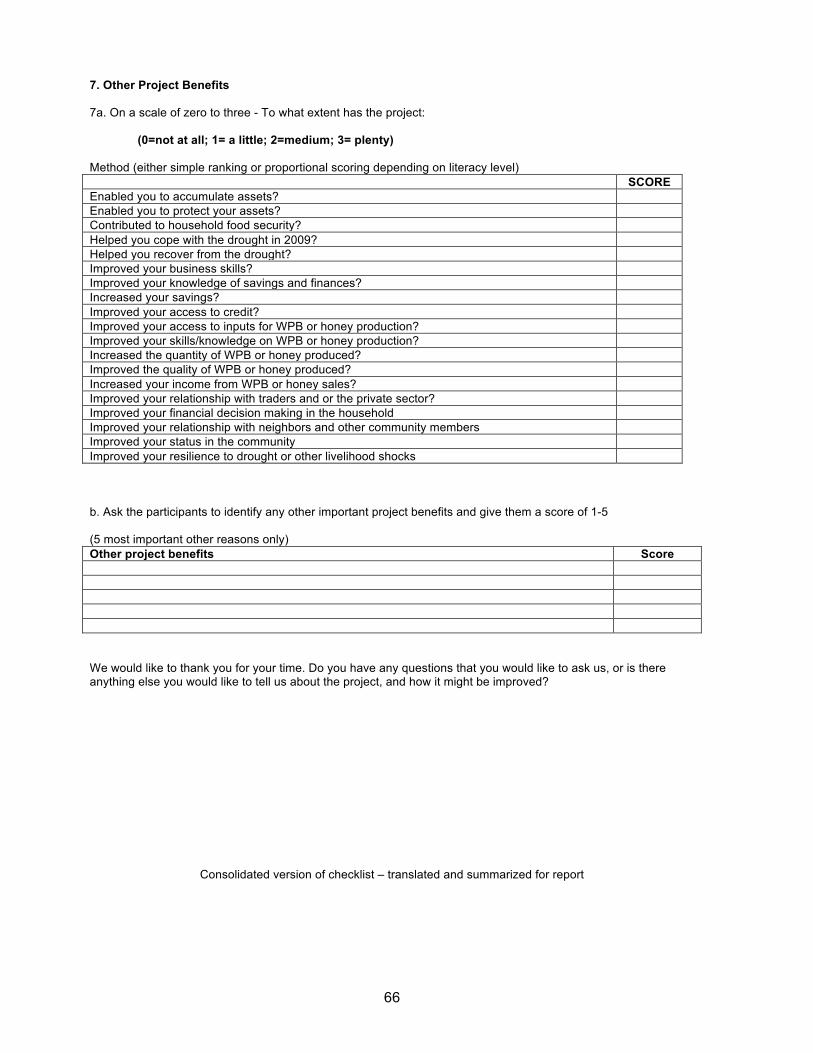
66
7. Other Project Benefits 7a. On a scale of zero to three - To what extent has the project:
(0=not at all; 1= a little; 2=medium; 3= plenty) Method (either simple ranking or proportional scoring depending on literacy level) SCORE Enabled you to accumulate assets? Enabled you to protect your assets? Contributed to household food security? Helped you cope with the drought in 2009? Helped you recover from the drought? Improved your business skills? Improved your knowledge of savings and finances? Increased your savings? Improved your access to credit? Improved your access to inputs for WPB or honey production? Improved your skills/knowledge on WPB or honey production? Increased the quantity of WPB or honey produced? Improved the quality of WPB or honey produced? Increased your income from WPB or honey sales? Improved your relationship with traders and or the private sector? Improved your financial decision making in the household Improved your relationship with neighbors and other community members Improved your status in the community Improved your resilience to drought or other livelihood shocks b. Ask the participants to identify any other important project benefits and give them a score of 1-5 (5 most important other reasons only) Other project benefits Score We would like to thank you for your time. Do you have any questions that you would like to ask us, or is there anything else you would like to tell us about the project, and how it might be improved?
Consolidated version of checklist – translated and summarized for report

67