Embed Size (px)
Citation preview
Table of contents
EXECUTIVE SUMMARY.................................................................................................................................1
MISSION STATEMENT..................................................................................................................................2
AIRCRAFT DESIGN MISSION.........................................................................................................................2
SELECTED BEST AIRCRAFT CONCEPT............................................................................................................3
ADVANCED TECHNOLOGIES................................................................................................................7
RESULTS OF AIRCRAFT SIZING AND CARPET PLOTS.....................................................................................9
MAJOR DESIGN TRADEOFFS......................................................................................................................15
AIRCRAFT DESCRIPTION.............................................................................................................................16
AERODYNAMIC DESIGN ANALYSIS.............................................................................................................25
PERFORMANCE..........................................................................................................................................32
STRUCTURES..............................................................................................................................................35
WEIGHTS AND BALANCE............................................................................................................................45
STABILITY AND WEIGHTS...........................................................................................................................46
NOISE.........................................................................................................................................................51
SUMMARY.................................................................................................................................................63
REFERENCES..............................................................................................................................................66
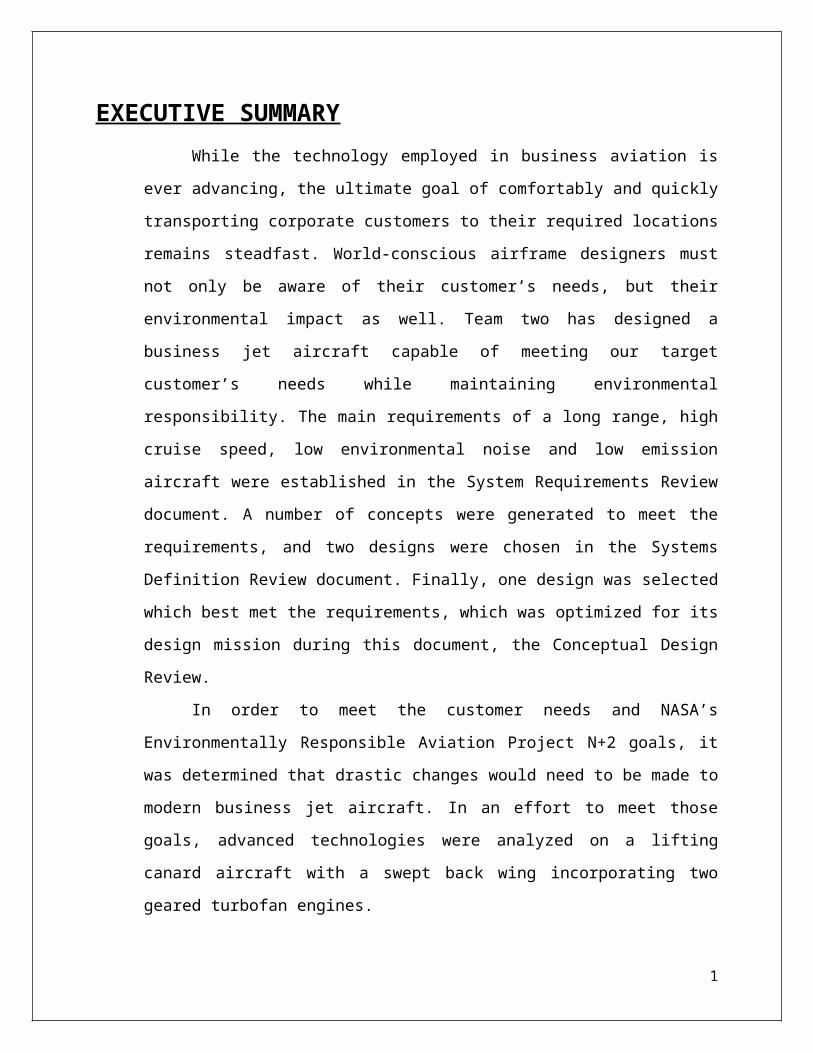
EXECUTIVE SUMMARYWhile the technology employed in business aviation is ever advancing, the
ultimate goal of comfortably and quickly transporting corporate customers to their
required locations remains steadfast. World-conscious airframe designers must not only
be aware of their customer’s needs, but their environmental impact as well. Team two has
designed a business jet aircraft capable of meeting our target customer’s needs while
maintaining environmental responsibility. The main requirements of a long range, high
cruise speed, low environmental noise and low emission aircraft were established in the
System Requirements Review document. A number of concepts were generated to meet
the requirements, and two designs were chosen in the Systems Definition Review
document. Finally, one design was selected which best met the requirements, which was
optimized for its design mission during this document, the Conceptual Design Review.
In order to meet the customer needs and NASA’s Environmentally Responsible
Aviation Project N+2 goals, it was determined that drastic changes would need to be
made to modern business jet aircraft. In an effort to meet those goals, advanced
technologies were analyzed on a lifting canard aircraft with a swept back wing
incorporating two geared turbofan engines.
A sizing code was developed, and historical and advanced concept data was
researched. Aircraft weights and balance, aerodynamics, engine selection, and noise were
analyzed in the design process. Major structural component locations were investigated,
the noise produced by the aircraft was predicted, and a cost analysis has been conducted
for our aircraft. The aircraft’s performance was also determined, and consideration was
given to the major design tradeoffs used throughout the design process.
Our aircraft is capable of transporting 16 passengers in a luxury cabin with a
maximum still air range of 7,100 nm. Our aircraft will weigh 71,300 lbs, and requires
3,900 feet of ground roll. All of the customer needs were met or exceeded, but the NASA
N+2 goals proved too difficult to meet with our design. Though not obtaining the NASA
N+2 goals, our aircraft provided a 20db reduction in environmental noise, a 50%
emissions reduction, a 25% fuel burn reduction, and a 33% takeoff field length reduction
over modern aircraft of the same class. While unsuccessful in reaching the NASA N+2
1
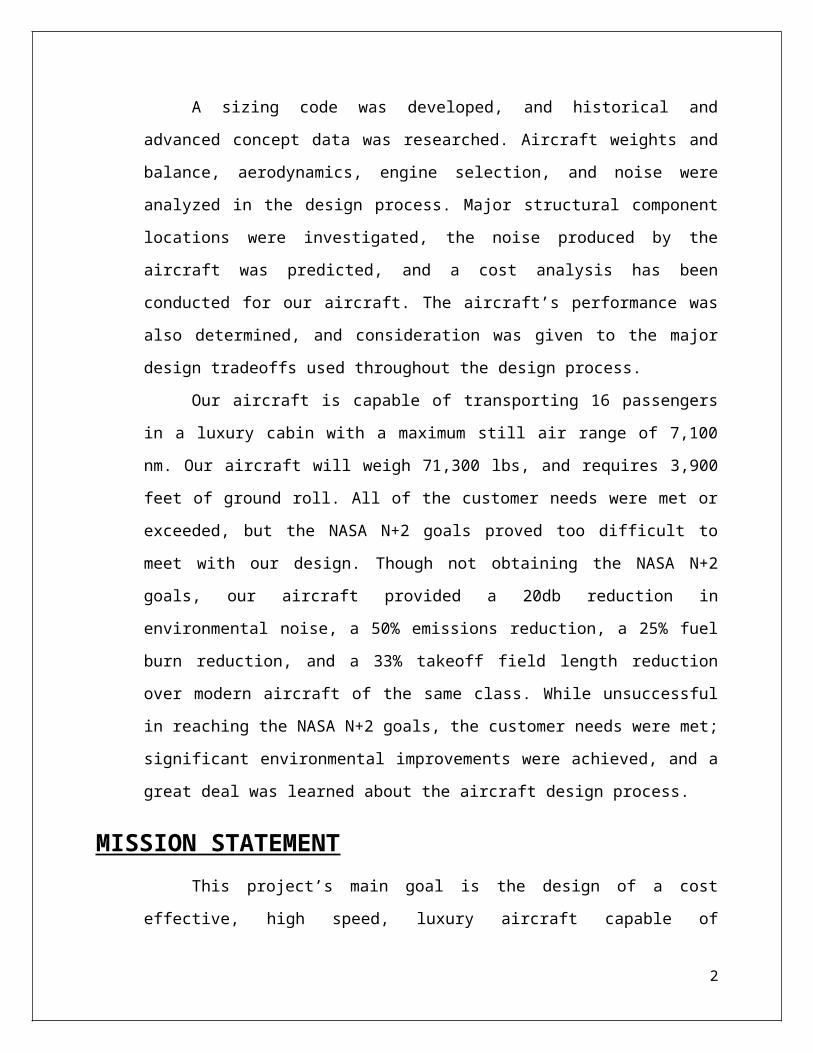
goals, the customer needs were met; significant environmental improvements were
achieved, and a great deal was learned about the aircraft design process.
MISSION STATEMENTThis project’s main goal is the design of a cost effective, high speed, luxury
aircraft capable of transporting customers to any destination as quickly as possible. The
project’s secondary goal is to meet NASA’s N+2 criteria, reducing the environmental
impact of the aircraft. Our proposed aircraft will be able to compete with other aircraft of
the ultra long range category.
AIRCRAFT DESIGN MISSION The design mission was developed and optimized with the city pair of Los
Angeles and Hong Kong in mind, accounting for a 60 knot head wind. Eight mission legs
between nine points constitute the developed design mission as illustrated in Figure 1
below.
Figure 1: Design Mission Flight Plan.
The first leg of the mission, from points 0 to 1, is taxi and takeoff to an altitude of
50 feet. Points 1 to 2 represent the climb portion of the mission where the aircraft climbs
at best rate of climb to an altitude of 41,000 feet. From there the aircraft enters the cruise
leg of the mission, between points 2 and 3, and begins cruising at a Mach number of 0.85
2
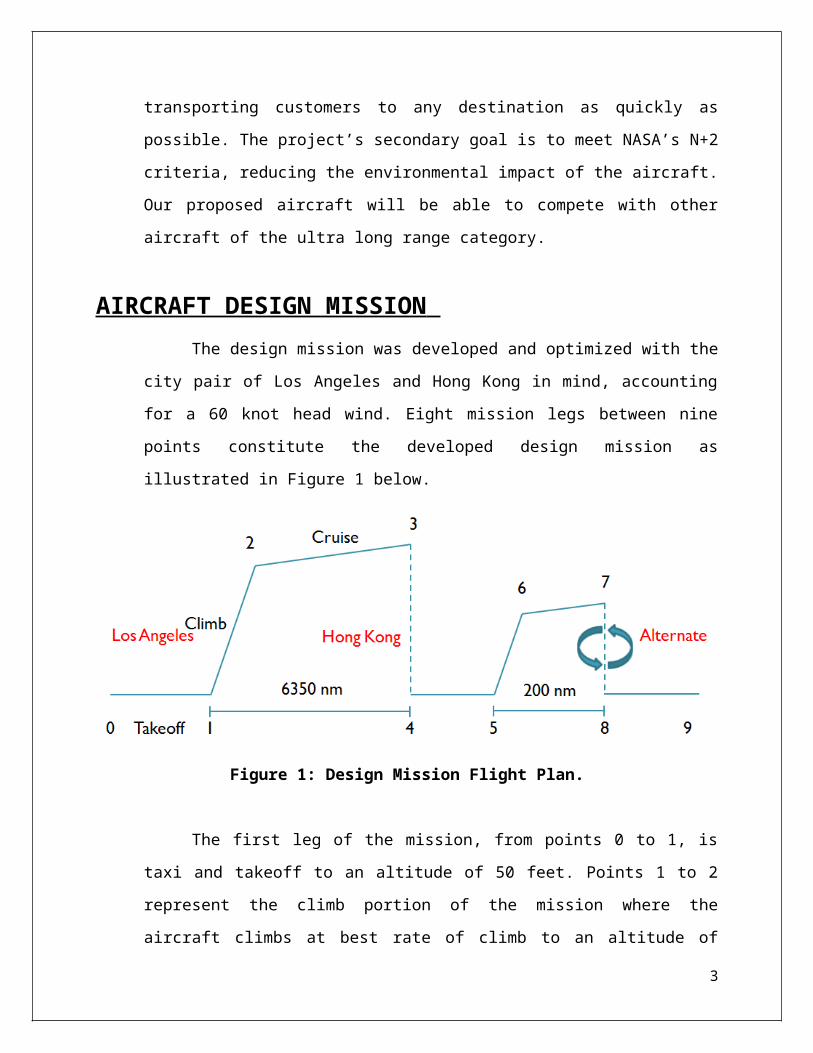
for 6350 nautical miles. Cruise is then followed directly by a no-range credit descent to
land where the aircraft will attempt a landing from points 4 to 5. In the absence of a
landing, the aircraft will then climb to an altitude of 5,000 feet at best rate climb, depicted
between points 5 and 6, and cruise at an altitude of 5,000 feet to an alternate airport 200
nautical miles away. Upon arrival at the alternate airport, the aircraft will enter a holding
pattern for 45 minutes, from points 7 to 8, and then begin a no-range credit descent to
land. Finally, the aircraft lands at the alternate airport and completes the last mission leg
at point 9.
While the design mission is the intended use of this aircraft, several other
operating missions can be made by this aircraft as well. One additional operating mission
example would be flying from New York to Van Nuys. The distance between the two
cities, which is 2,146 nautical miles, falls well within the design mission range of 6,350
miles. To compensate for the largely unused range, the aircraft can then be flown at its
maximum Mach number of 0.9 with a maximum capacity of 16 passengers. This range
tradeoff allows for tremendous flexibility in speed and capacity for shorter ranged flights.
SELECTED BEST AIRCRAFT CONCEPTMotivated by our mission statement, the system requirements design stage produced a set
of criteria by which individual concepts could be evaluated based upon the customer needs.
Following the initial system requirements design stage, eight concepts were generated for further
consideration. Pugh’s method was implemented as an objective procedure for selecting the best
aircraft to narrow the eight concepts down to two. Early conceptual sketches of the aircraft are
shown in Figure 2, concept one on the left, and concept two on the right. Some of the design
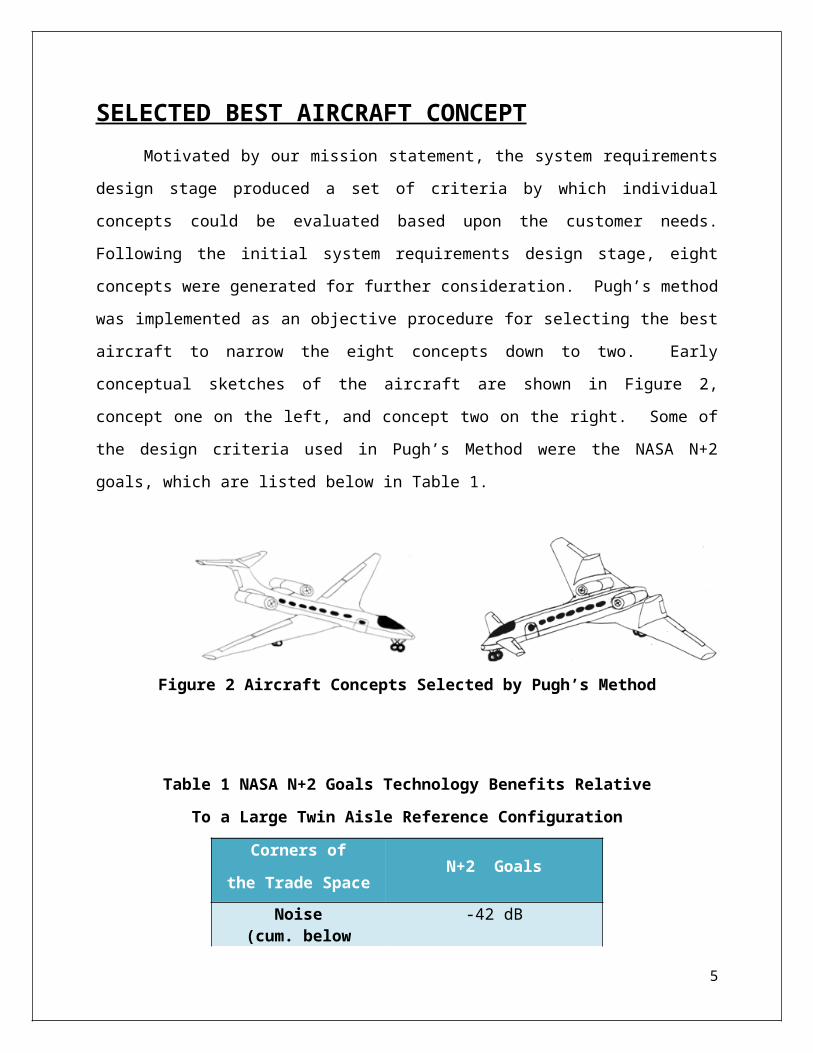
criteria used in Pugh’s Method were the NASA N+2 goals, which are listed below in Table 1.
Figure 2 Aircraft Concepts Selected by Pugh’s Method
3
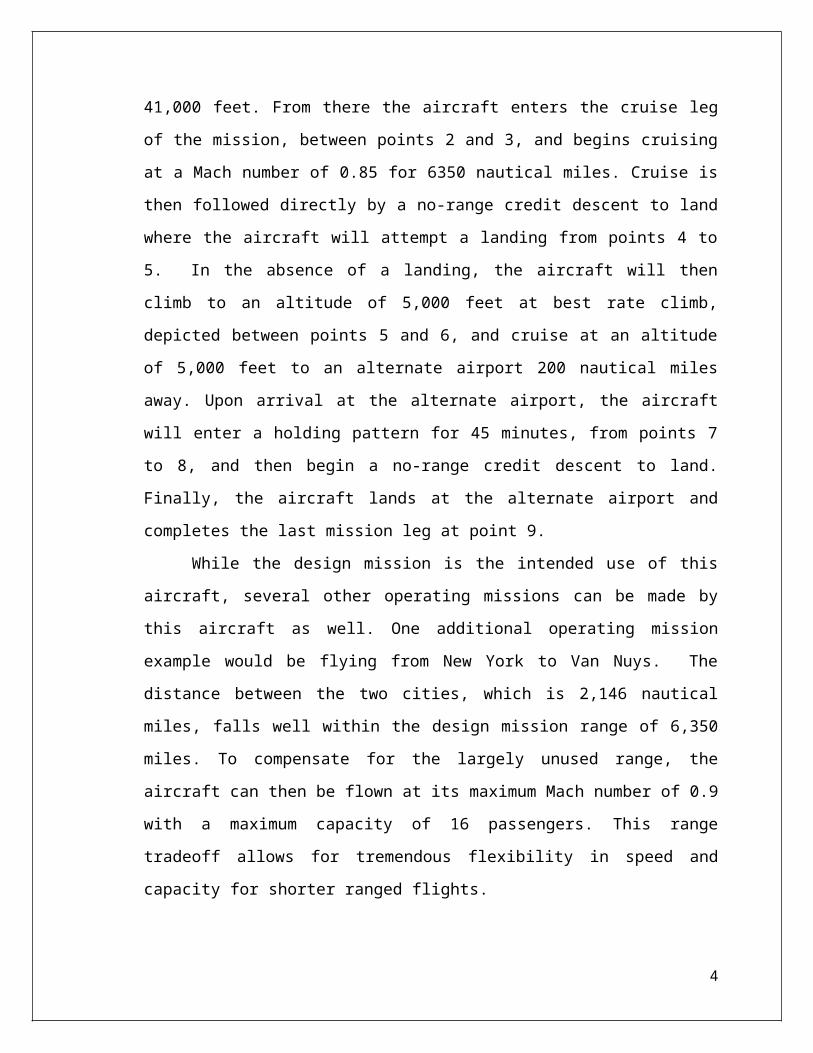
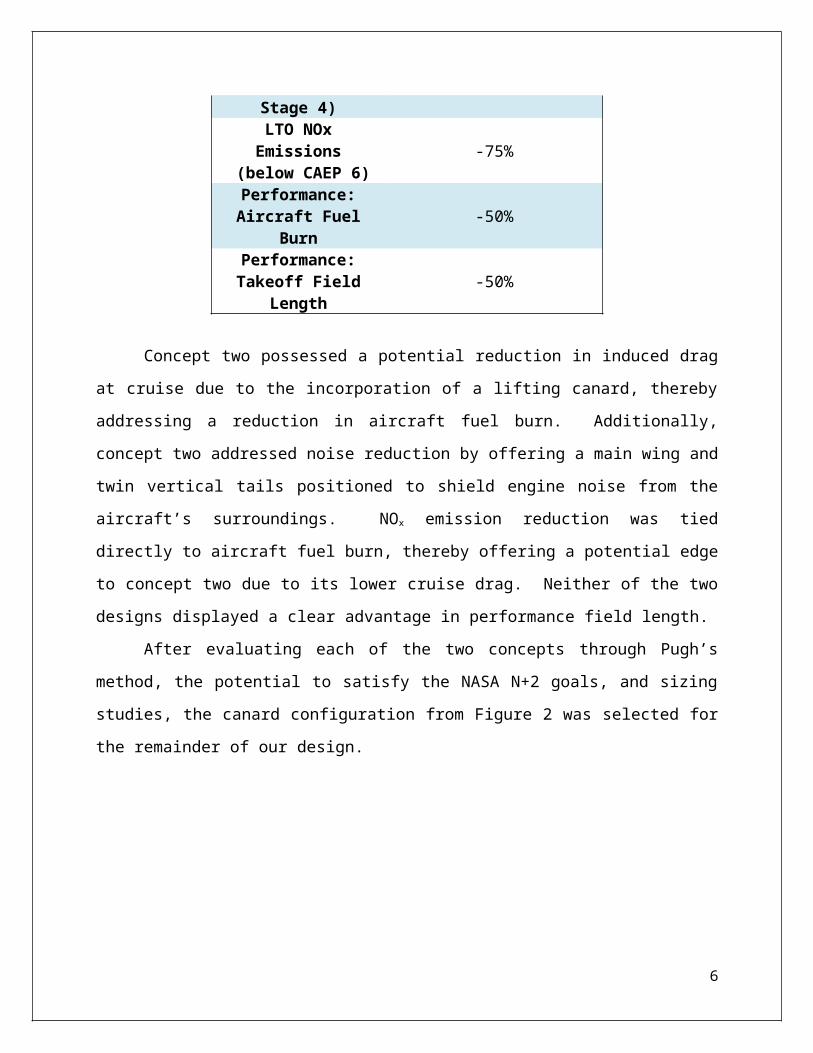
Table 1 NASA N+2 Goals Technology Benefits Relative
To a Large Twin Aisle Reference Configuration
Corners of
the Trade SpaceN+2 Goals
Noise(cum. below Stage 4)
-42 dB
LTO NOx Emissions (below CAEP 6)
-75%
Performance:Aircraft Fuel Burn
-50%
Performance:Takeoff Field Length
-50%
Concept two possessed a potential reduction in induced drag at cruise due to the
incorporation of a lifting canard, thereby addressing a reduction in aircraft fuel burn.
Additionally, concept two addressed noise reduction by offering a main wing and twin vertical
tails positioned to shield engine noise from the aircraft’s surroundings. NOx emission reduction
was tied directly to aircraft fuel burn, thereby offering a potential edge to concept two due to its
lower cruise drag. Neither of the two designs displayed a clear advantage in performance field
length.
After evaluating each of the two concepts through Pugh’s method, the potential to satisfy
the NASA N+2 goals, and sizing studies, the canard configuration from Figure 2 was selected for
the remainder of our design.
4
Aircraft Walk-around
Several important features provided the canard design with advantages over the other
aircraft configurations evaluated in the concept selection process. Particular aspects from all or
many of the concepts were also shared with the canard configuration’s final design in order to
meet the specified criteria. A number of the unique and shared external characteristics present
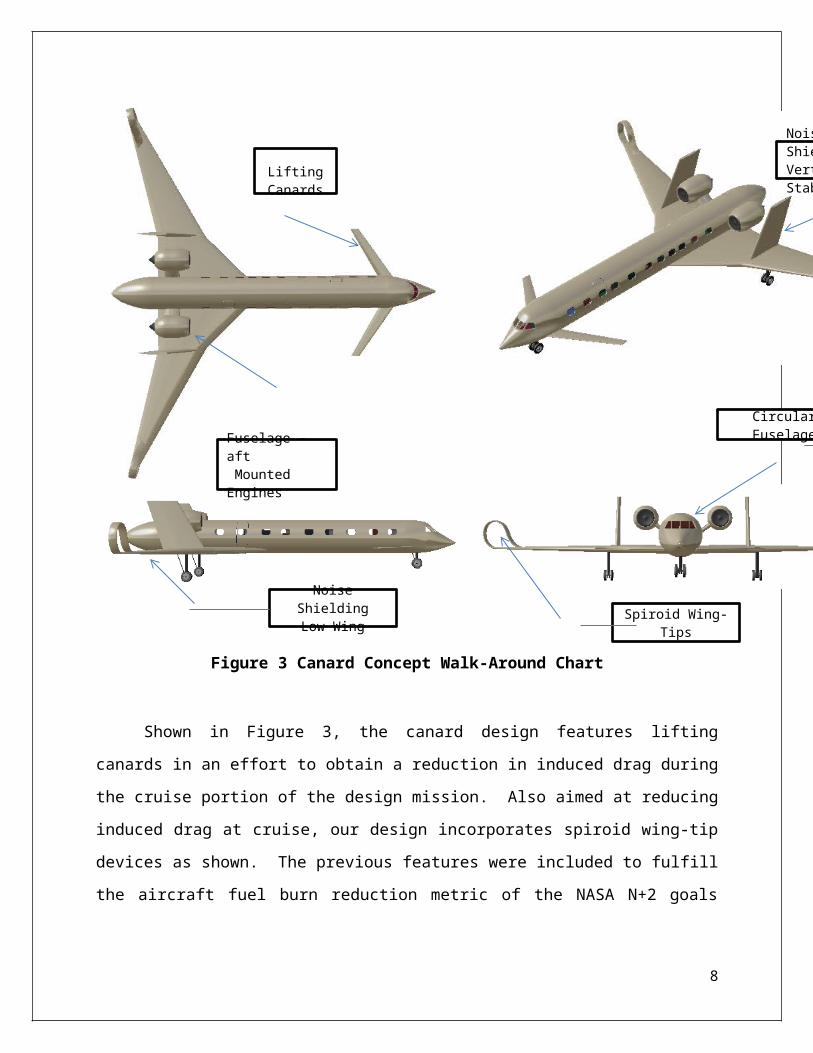
on the canard configuration aircraft are depicted in Figure 3 below.
Figure 3 Canard Concept Walk-Around Chart
Shown in Figure 3, the canard design features lifting canards in an effort to obtain a
reduction in induced drag during the cruise portion of the design mission. Also aimed at
reducing induced drag at cruise, our design incorporates spiroid wing-tip devices as shown. The
previous features were included to fulfill the aircraft fuel burn reduction metric of the NASA
N+2 goals listed in Table 1. These features also act to reduce NOx emissions since a lower fuel
burn will produce fewer emissions.
5
Lifting Canard
s
Fuselage – aft Mounted Engines
Noise ShieldingVertical Stabilizers
Noise ShieldingLow Wing
Circular Fuselage
Spiroid Wing-Tips
Also present on the canard configuration are several noise reducing design features,
which are shown in Figure 3. Engine noise was determined to be the primary contributor to
environmental noise, and the canard configuration made several efforts to shield the environment
from noise generated by the engine. The wing was placed low and aft on the aircraft, beneath
both of the engines to shield the engine noise from the ground during the takeoff, climb, descent,
and landing mission segments. As lateral noise propagation is also a significant concern for
airports in populated areas, twin vertical stabilizers were incorporated on top of the main wings
outboard of the engines, and in line with the engine exhaust.
From the walk-around chart depicted in Figure 3, it is clear that several of the external
design features directly impact the internal cabin of the aircraft. Both engines are mounted aft of
the main cabin and on pylons connected to the fuselage. The aft mounting of the engines affords
a quieter cabin interior, while the fuselage mounted pylons facilitate a reduction in cabin
vibration and provides a minimum structural weight for engine mounting.
The design of a circular fuselage cross section provides a relatively easy method of cabin
pressurization, and allows a relatively large internal cabin volume for passenger comfort. A
circular fuselage can be constructed from current industry practices, thereby lowering
manufacturing developmental costs.
The low, aft mounted main wing also allows for minimal main spar and cabin interaction.
The lack of structural requirements inside of the main cabin helps maximize internal cabin
volume, yielding additional passenger comfort. Furthermore, the aft mounted main wing
facilitates a clear view of the ground from nearly every seat in the cabin, which provides each
passenger with a visually pleasing exterior view.
The benefits of the aircraft’s design features from Figure 3 provide insight to the reasons
for the choice of concept. A more thorough investigation of the important design features and
advanced technologies incorporated on the design follows in the next section of the report.
6
ADVANCED TECHNOLOGIESOf all the advanced technologies that could be included, engines are perhaps the most important
since the engines will have a significant impact on all four of the NASA N+2 goals. Our group
considered two engines, an unducted turbofan and a geared turbofan. For reasons discussed later in the
report, a geared turbofan was chosen over the unducted fan. A geared turbofan engine utilizes a
gearbox between the fan and main power shaft to decouple the fan from the engine’s compressor.
The technology allows for a very large fan to rotate at slower speeds while moving large
amounts of air with little noise. The gearbox also allows for the compressor and turbine to spin at
faster speeds to further increase efficiency. Pratt and Whitney claims that the PurePower 1000
series offers proven efficiency with no life limited parts, a 20 dB reduction in noise over current
engines, a reduction in NOx emissions by 50% over the CAEP/6 margins, and a 15% reduction
in fuel burn over current engines.3 The PurePower 1000 series offer a thrust range between
13,000 lbf and 24,000 lbf depending on engine selection. This thrust range is ideal for our
aircraft and allows the team to continue using the rubber engine assumption in sizing.
Another advanced technology included was the use of composite materials.
Aircraft such as the Boeing 787 have achieved a significant empty weight reduction by
utilizing composite materials in the majority of the airframe. A reduction in aircraft
weight will allow for reduced fuel consumption and a reduction in take off length. Up to
50% of the structure of some aircraft has been constructed out of composite materials.
There has been a lot of research on the use of composite materials within the past few
decades. The technology has been proven to be reliable and beneficial in the aerospace
industry and is currently being fielded in many production designs. This technology is
likely to keep improving and delivering even more advantages in aircraft design by the
2020 production date. Research and past applications suggest a reduction of
approximately 20% in structural weight. This value is used directly as a technology
factor in the sizing process and is applied to the structural weight components of the
fuselage, wings, horizontal and vertical tails, canards, pylons, and nacelles.
7
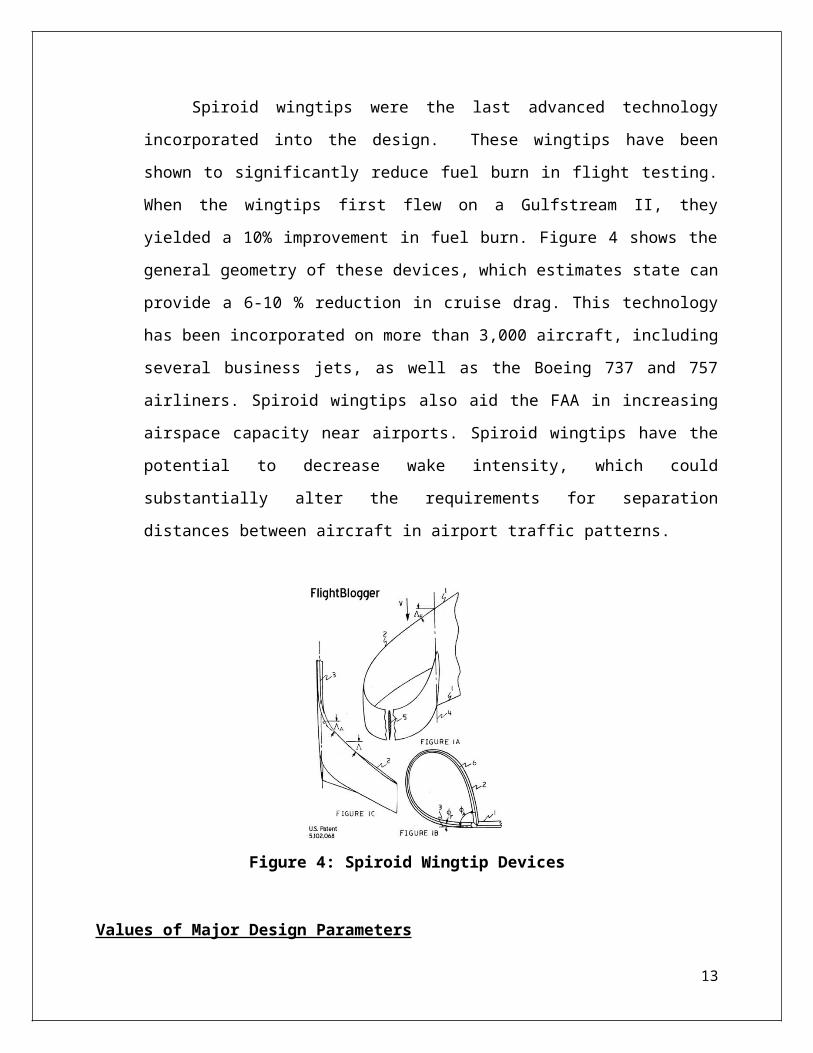
Spiroid wingtips were the last advanced technology incorporated into the design.
These wingtips have been shown to significantly reduce fuel burn in flight testing. When
the wingtips first flew on a Gulfstream II, they yielded a 10% improvement in fuel burn.
Figure 4 shows the general geometry of these devices, which estimates state can provide
a 6-10 % reduction in cruise drag. This technology has been incorporated on more than
3,000 aircraft, including several business jets, as well as the Boeing 737 and 757 airliners.
Spiroid wingtips also aid the FAA in increasing airspace capacity near airports. Spiroid
wingtips have the potential to decrease wake intensity, which could substantially alter the
requirements for separation distances between aircraft in airport traffic patterns.
Figure 4: Spiroid Wingtip Devices
Values of Major Design Parameters
With the basic aircraft configuration, important design features, and advanced
technologies chosen, the design was iterated through the developed sizing code until the
aircraft’s major design parameters were optimized for the design mission. A number of the
optimized parameters including thrust to weight ratio, aspect ratio, wing loading, and main wing
and canard areas were selected and are shown in Table 2. While each of these parameters can be
further broken down into dimensions more commonly provided for an aircraft, these dimensions
are more easily shown in an aircraft three-view drawing provided in the Aircraft Description
section of this report.
8
Table 2: Major Aircraft Design Parameters
Parameter Value
Thrust / Weight Ratio 0.34
Aspect Ratio 12
Wing Loading 87 (lb/ft2)
Wing Area 796.4(ft2)
Canard Area 147.4 (ft2)
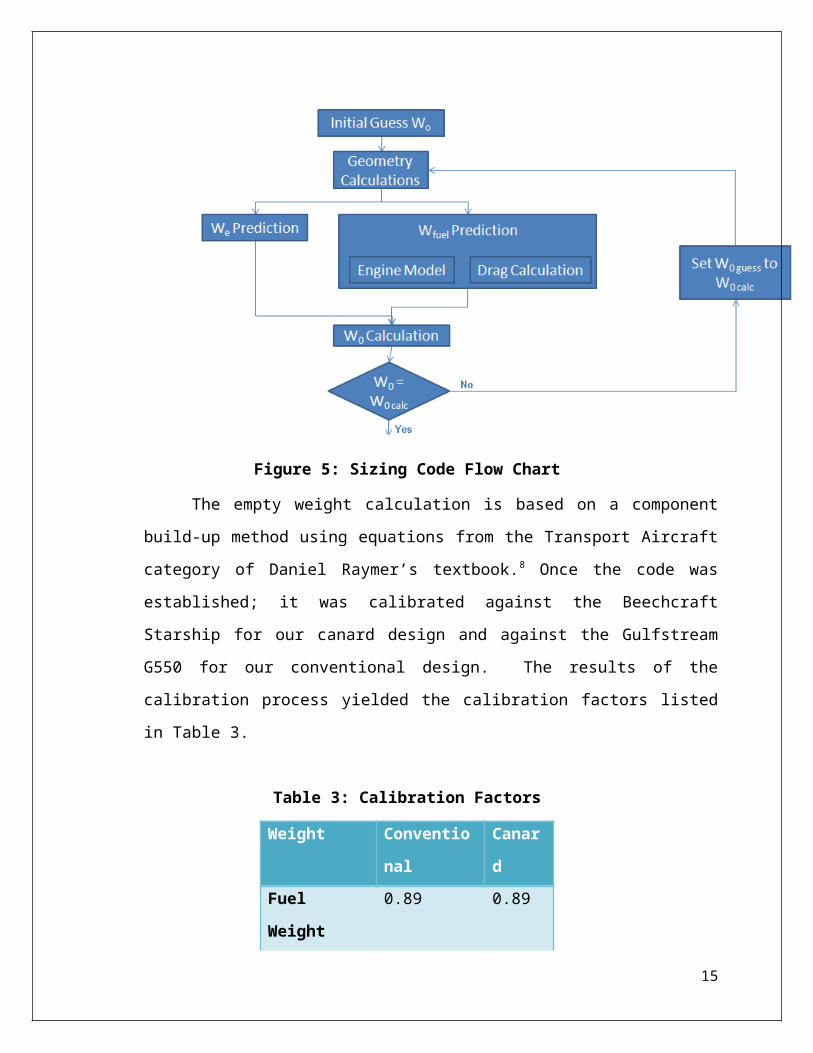
RESULTS OF AIRCRAFT SIZING AND CARPET PLOTSIn order to numerically evaluate and size our designs, a sizing code was
developed in MATLAB. The code follows the general procedures outlined in the flow
chart shown in Figure 5.
Figure 5: Sizing Code Flow Chart
The empty weight calculation is based on a component build-up method using
equations from the Transport Aircraft category of Daniel Raymer’s textbook.8 Once the
code was established; it was calibrated against the Beechcraft Starship for our canard
9
design and against the Gulfstream G550 for our conventional design. The results of the
calibration process yielded the calibration factors listed in Table 3.
Table 3: Calibration Factors
Weight Conventional Canard
Fuel Weight 0.89 0.89
Empty Weight 1.16 0.96
Gross Weight 1.03 0.98
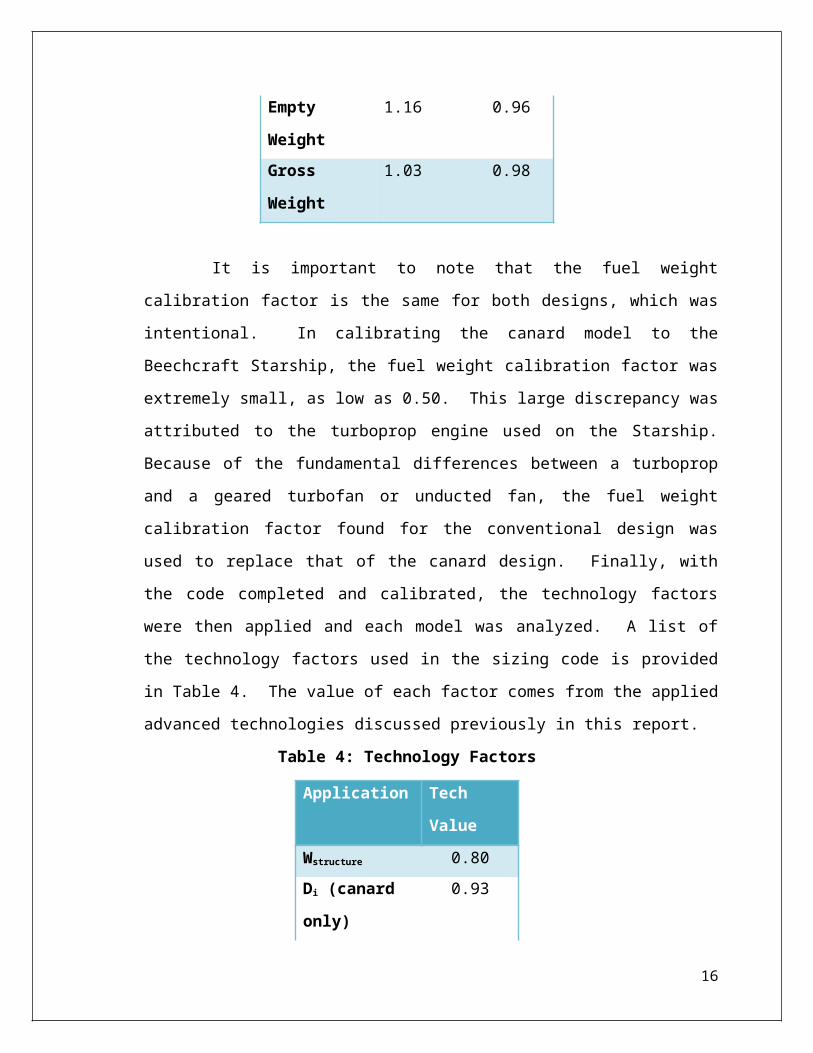
It is important to note that the fuel weight calibration factor is the same for both
designs, which was intentional. In calibrating the canard model to the Beechcraft
Starship, the fuel weight calibration factor was extremely small, as low as 0.50. This
large discrepancy was attributed to the turboprop engine used on the Starship. Because
of the fundamental differences between a turboprop and a geared turbofan or unducted
fan, the fuel weight calibration factor found for the conventional design was used to
replace that of the canard design. Finally, with the code completed and calibrated, the
technology factors were then applied and each model was analyzed. A list of the
technology factors used in the sizing code is provided in Table 4. The value of each
factor comes from the applied advanced technologies discussed previously in this report.
Table 4: Technology Factors
Application Tech Value
Wstructure 0.80
Di (canard only) 0.93
SFC 0.75
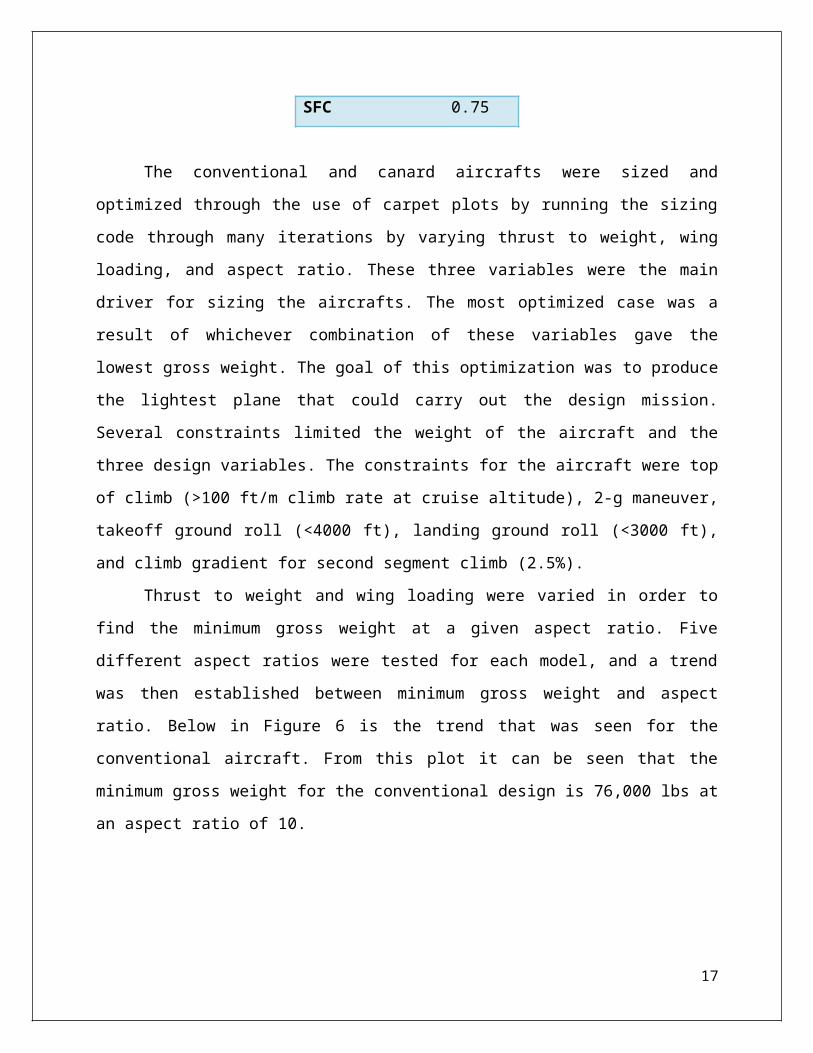
The conventional and canard aircrafts were sized and optimized through the use of carpet
plots by running the sizing code through many iterations by varying thrust to weight, wing
loading, and aspect ratio. These three variables were the main driver for sizing the aircrafts. The
most optimized case was a result of whichever combination of these variables gave the lowest
gross weight. The goal of this optimization was to produce the lightest plane that could carry out
the design mission. Several constraints limited the weight of the aircraft and the three design
10
variables. The constraints for the aircraft were top of climb (>100 ft/m climb rate at cruise
altitude), 2-g maneuver, takeoff ground roll (<4000 ft), landing ground roll (<3000 ft), and climb
gradient for second segment climb (2.5%).
Thrust to weight and wing loading were varied in order to find the minimum gross weight
at a given aspect ratio. Five different aspect ratios were tested for each model, and a trend was
then established between minimum gross weight and aspect ratio. Below in Figure 6 is the trend
that was seen for the conventional aircraft. From this plot it can be seen that the minimum gross
weight for the conventional design is 76,000 lbs at an aspect ratio of 10.
8 8.5 9 9.5 10 10.5 11 11.5 127
7.2
7.4
7.6
7.8
8
8.2
8.4
8.6
8.8
9x 10
4
W0
AR
Aspect Ratio vs W0 for Conventional a/c
Figure 6: Gross Weight vs. Aspect Ratio of Conventional Aircraft
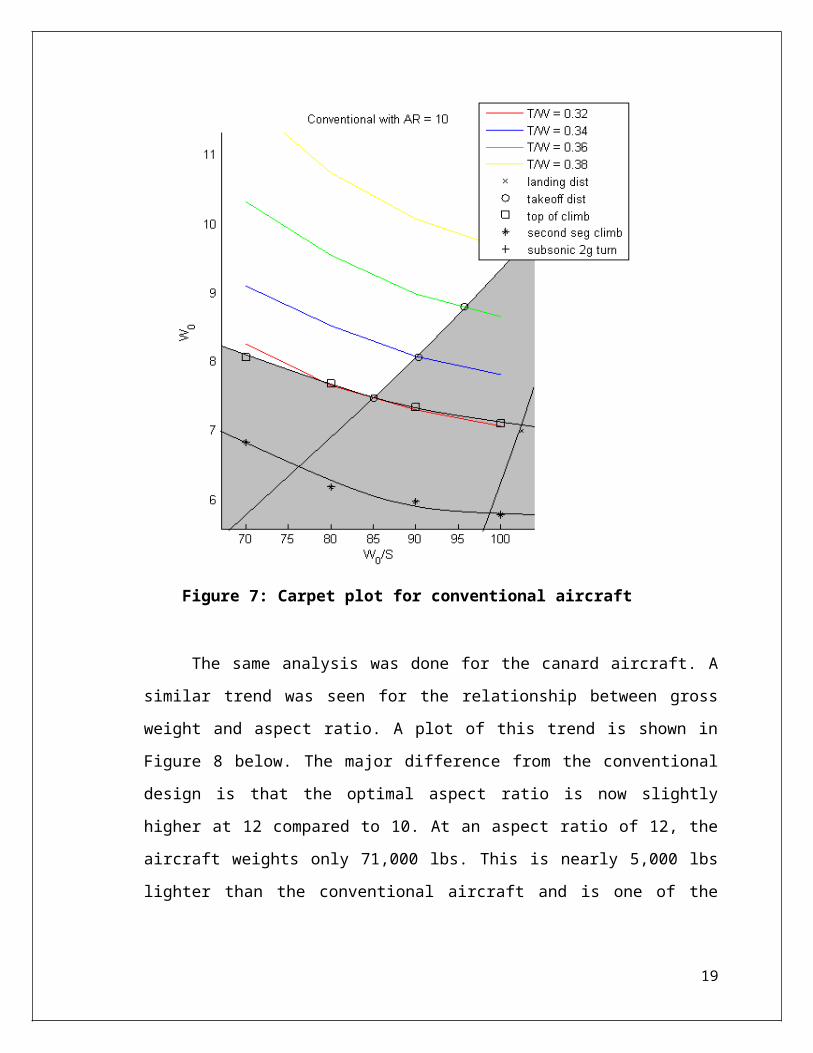
Further analysis on this design point can be seen by examining the carpet plot for
an aspect ratio of 10, shown in Figure 7 below. If a point lies within an area shaded in
grey, it means that it cannot meet one or more of the constraints. Thus the minimum gross
weight is at a wing loading of 85 and a thrust to weight of .32 which yields a gross weight
of 76,000 lbs. This point is limited by both top of climb and takeoff ground roll. Landing
distance, second segment climb, and subsonic 2-g turn are not limiting constraints.
11
Figure 7: Carpet plot for conventional aircraft
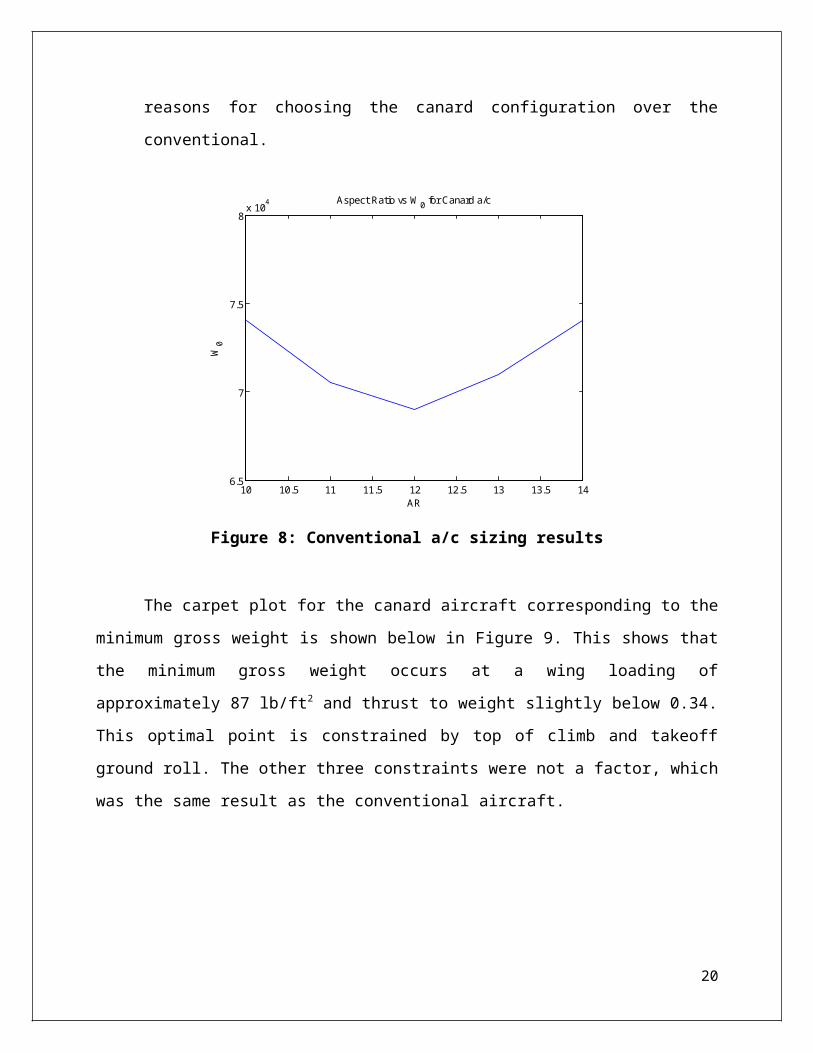
The same analysis was done for the canard aircraft. A similar trend was seen for
the relationship between gross weight and aspect ratio. A plot of this trend is shown in
Figure 8 below. The major difference from the conventional design is that the optimal
aspect ratio is now slightly higher at 12 compared to 10. At an aspect ratio of 12, the
aircraft weights only 71,000 lbs. This is nearly 5,000 lbs lighter than the conventional
aircraft and is one of the reasons for choosing the canard configuration over the
conventional.
12
10 10.5 11 11.5 12 12.5 13 13.5 146.5
7
7.5
8x 10
4
AR
W0
Aspect Ratio vs W0 for Canard a/c
Figure 8: Conventional a/c sizing results
The carpet plot for the canard aircraft corresponding to the minimum gross weight is
shown below in Figure 9. This shows that the minimum gross weight occurs at a wing loading of
approximately 87 lb/ft2 and thrust to weight slightly below 0.34. This optimal point is
constrained by top of climb and takeoff ground roll. The other three constraints were not a factor,
which was the same result as the conventional aircraft.
13
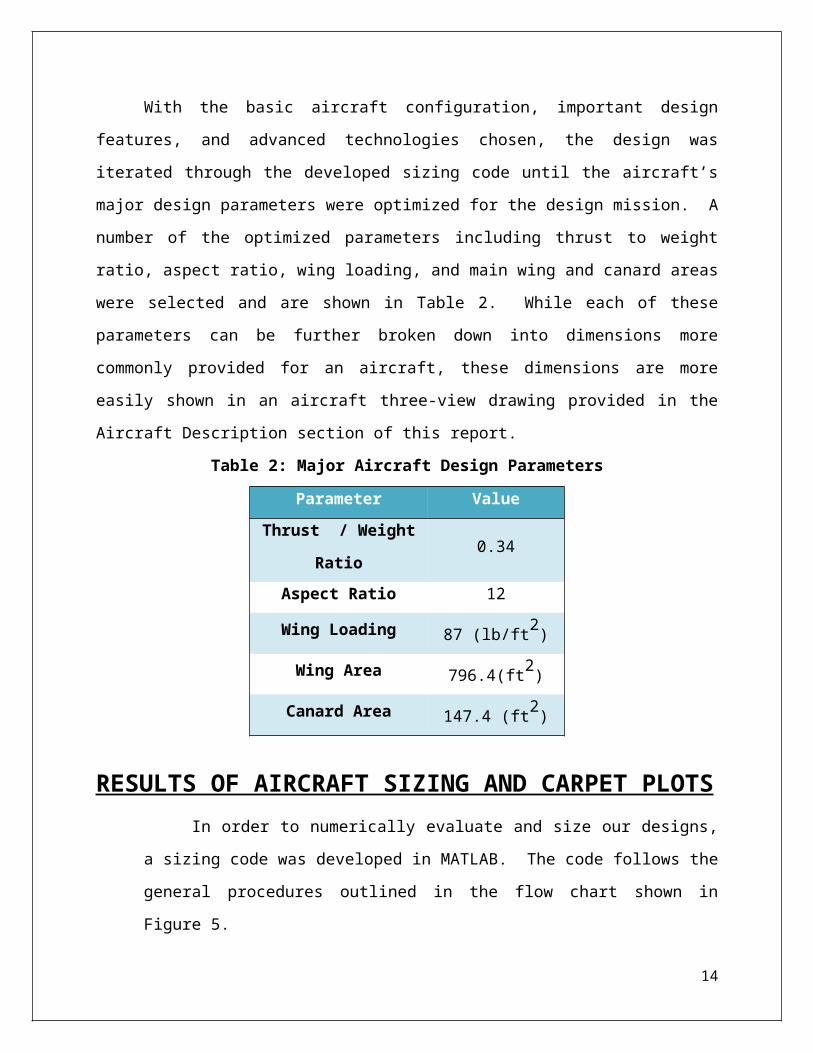
Figure 9 Carpet plot for conventional aircraft
From this sizing optimization, the results show the canard aircraft is approximately 5,000
lbs lighter than the conventional design. The canard aircraft weights 71,300 lbs, of which 38,000
lbs is empty weight and 31,500 lbs is fuel. The takeoff ground roll is just below 4,000 ft and the
landing ground roll is 2,200 ft.
14
MAJOR DESIGN TRADEOFFSOne of the concepts selected proposed the use of a lifting canard as opposed to a
conventional tail configuration. The lifting canard can theoretically provide the design
with better cruise performance by reducing induced drag at cruise conditions. In a
conventional tail configuration the horizontal stabilizer provides a down force in flight
for aircraft stability, therefore the wings have to create additional lift to counter act the
down force from the tail which in turn means the wings create additional induced drag.
The lifting canard balances the pitch stability of the aircraft along with providing lift,
therefore the main wings do not have to produce as much lift as a conventional design
would require. The cons for a canard can outweigh the benefits. Specifically, the
downwash from the canards could actually produce enough interference on the main
wings to actually create more drag. In fact, the interference between the canard and main
wing occurs in almost all flight conditions except for the specific design point at cruise
where the canard configuration will benefit induced drag. Additionally, the FAA
mandates that the canard must stall before the main wing to prevent loss of aircraft
stability. Should the main wings stall before the canards, the lifting force provided by the
canards will cause a violent pitch up causing the main wings to go into a deeper stall and
possibly prevent the aircraft from recovering. The pros of having the canards stall before
the main wing actually prevents the main wings from stalling unintentionally by
preventing the aircraft from flying at high angles of attack. The cons of having the canard
stall first means that main wings cannot ever reach maximum lift which requires the
addition of high lift devices for slow flight and landing. The position of the main wings at
the very rear of the aircraft actually provides a difficult design problem for installing high
lift devices due to the large pitching moment created by high lift devices so far aft of the
center of gravity and careful attention must be paid when designing the aircraft for
landing configurations.
The canard design was calculated to have a smaller empty weight than the conventional
design, but also had a slightly larger fuel burn during the design mission. Therefore the canard
design actually had a worse drag profile than the conventional aircraft which would suggest that
the canard did not perform well in reducing the aircraft’s drag during cruise. The team decided to
use the canard configuration despite this fact to try and meet the N+2 noise reduction goals. The
15
canard position allows the engines to be placed in the rear of the aircraft above the main wings
which provide a significant amount of noise shielding to the ground. Two vertical stabilizers are
also mounted on the main wings of the aircraft to reduce engine noise. The two engines are
essentially blocked by the main wings and vertical stabilizers which significantly reduced the
noise signature of the aircraft.
Additional tradeoffs were considered pertaining to the aircraft’s cabin. Space
versus performance considerations for the cabin involved installing two lavatories, a
galley, and larger sleeping quarters for a reserve pilot. The addition of such amenities
forced the cabin size to be rather large, but a large selling point in business aircraft is
comfort. The two lavatories were necessary for a full passenger load, especially for long
distance flights. The galley was added for long distance flights including trans-pacific
flights where meals would have to be served due to the long duration. The pilot resting
quarters were added for a reserve pilot, which in the case of the trans-pacific flights a
reserve pilot is mandated by FAA law due to limits on pilot-in-command time. The cabin
also was designed to have a stand up center aisle to push the design into the “plush”
category of aircraft comfort.
AIRCRAFT DESCRIPTIONOnce the external design features of the aircraft were determined, the aircraft
configuration was iterated through the sizing code, the major design parameters were optimized,
and the aircraft’s outer mold line was set and modeled in CATIA V5, R19. The model
incorporated the design features as previously mentioned, a low rear wing design with a lifting
canard, circular fuselage, twin vertical outboard mounted tails, and aft-fuselage mounted engines
on pylons. The fuselage seats sixteen passengers, two crew, two pilots, and an additional pilot in
the pilot rest area for trans-oceanic missions at maximum capacity. The following three
subsections offer a more detailed investigation of the aircraft’s outer mold line, the aircraft’s
interior layout, and the included cabin amenities and features respectively.
Dimensioned Three – View To Scale
From the aircraft sizing code and the major design parameters listed in Table 2, a
thorough set of dimensions were calculated for the aircraft concept, which are shown in the scale
16
three-view drawing of the aircraft presented in Figure 10, generated from the CATIA model.
The three-view drawing was constructed at a scale of 1:300 with reference to the actual aircraft’s
completed size when plotted on standard 8-1/2” x 11” paper.
17
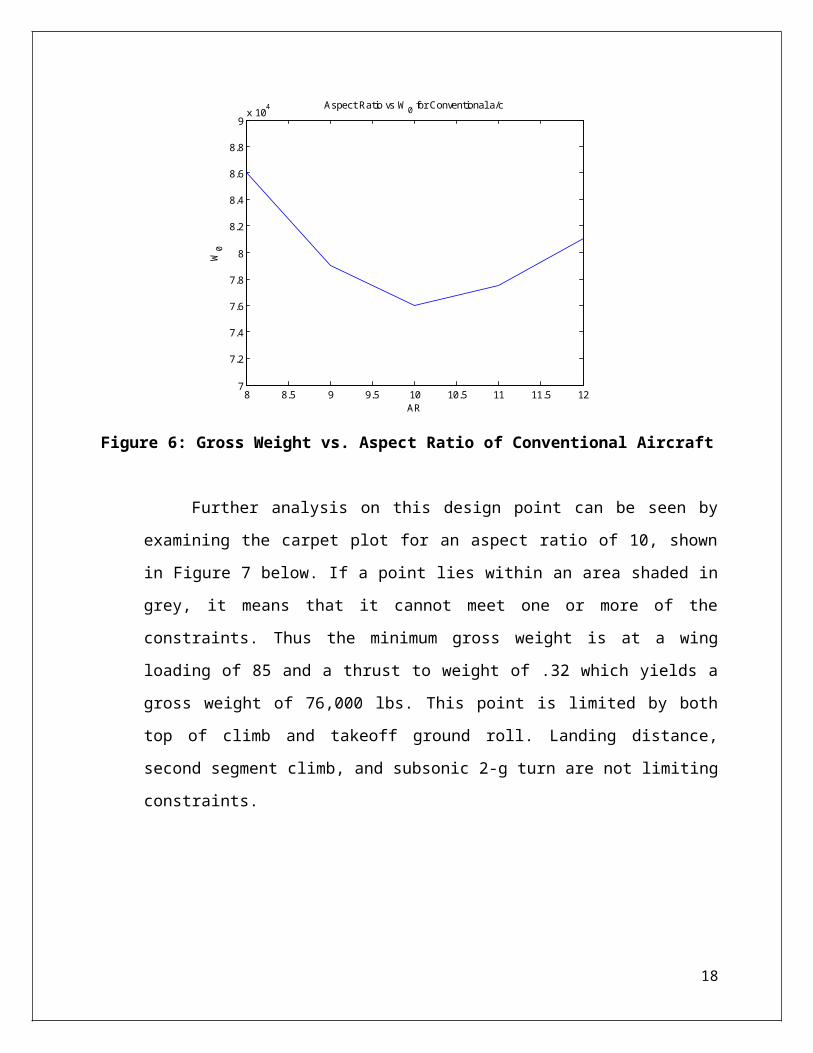
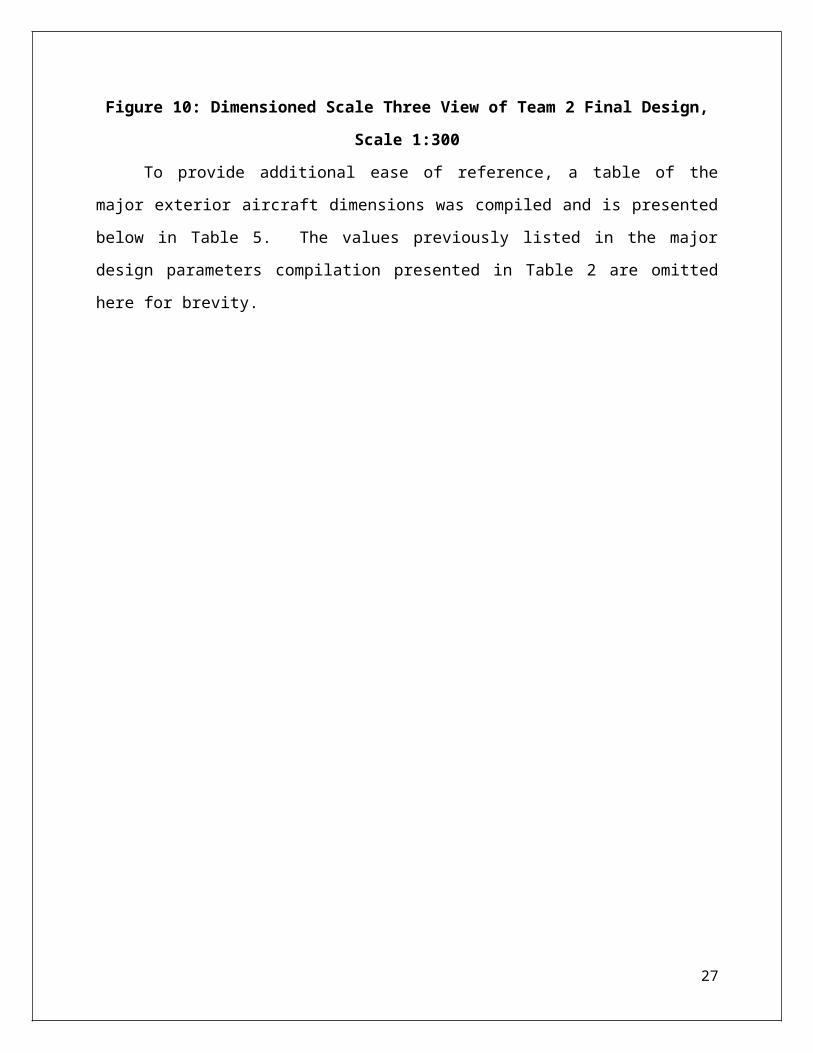
Figure 10: Dimensioned Scale Three View of Team 2 Final Design, Scale 1:300
18
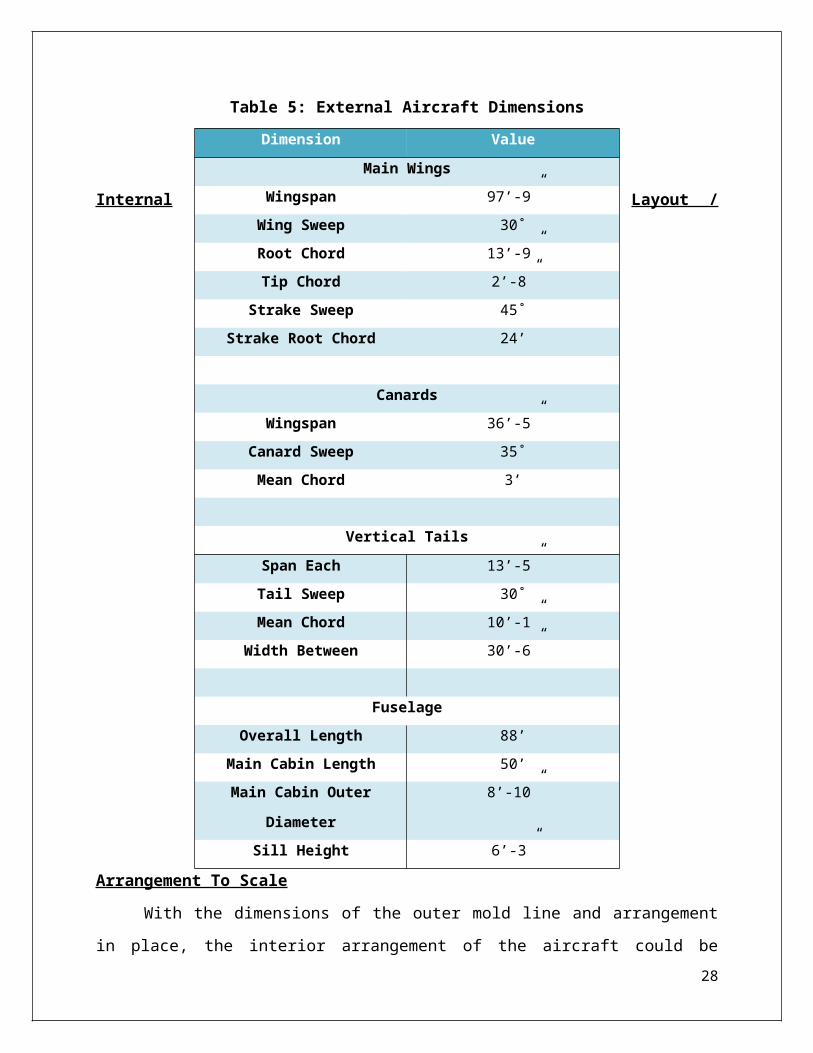
To provide additional ease of reference, a table of the major exterior aircraft dimensions
was compiled and is presented below in Table 5. The values previously listed in the major
design parameters compilation presented in Table 2 are omitted here for brevity.
Table 5: External Aircraft Dimensions
Internal Layout / Arrangement To Scale
19
Dimension Value
Main Wings
Wingspan 97’-9”
Wing Sweep 30˚
Root Chord 13’-9”
Tip Chord 2’-8”
Strake Sweep 45˚
Strake Root Chord 24’
Canards
Wingspan 36’-5”
Canard Sweep 35˚
Mean Chord 3’
Vertical Tails
Span Each 13’-5”
Tail Sweep 30˚
Mean Chord 10’-1”
Width Between 30’-6”
Fuselage
Overall Length 88’
Main Cabin Length 50’
Main Cabin Outer Diameter 8’-10”
Sill Height 6’-3”
With the dimensions of the outer mold line and arrangement in place, the interior
arrangement of the aircraft could be finalized. The crew area of the aircraft including the flight
attendants reclining seats, as well as the pilot berthing area were located at the foremost part of
the main cabin, forward of the main entrance door. Seating for sixteen passengers at maximum
capacity was distributed about the main cabin, with a conference area, lavatory, and small
cocktail galley present in the main cabin area. An emergency exit was also placed across from
the conference area and over the leading edge of the main wing on the opposite side of the
aircraft from the main entrance. At the rear end of the main cabin area, a divider wall separates
the rear lavatory, preparation galley, and in cabin storage from the main seating area. As with
the external mold line of the aircraft, the cabin interior was completely modeled in CATIA V5
R19, and a 1:150 scale three view drawing was generated and is depicted in Figure 11.
Figure 11: Overall Interior Cabin Three-view Drawing
In order to provide more insight to the interior cabin dimensions, a detail drawing
of the conference and small galley area was generated from the above plan, and more
dimensions were added, as shown in Figure 12. Additionally, a cross sectional view of
the interior and exterior cabin dimensions was constructed to provide a clearer view of
the relevant seating dimensions and aisle height, and is depicted in Figure 13.
20
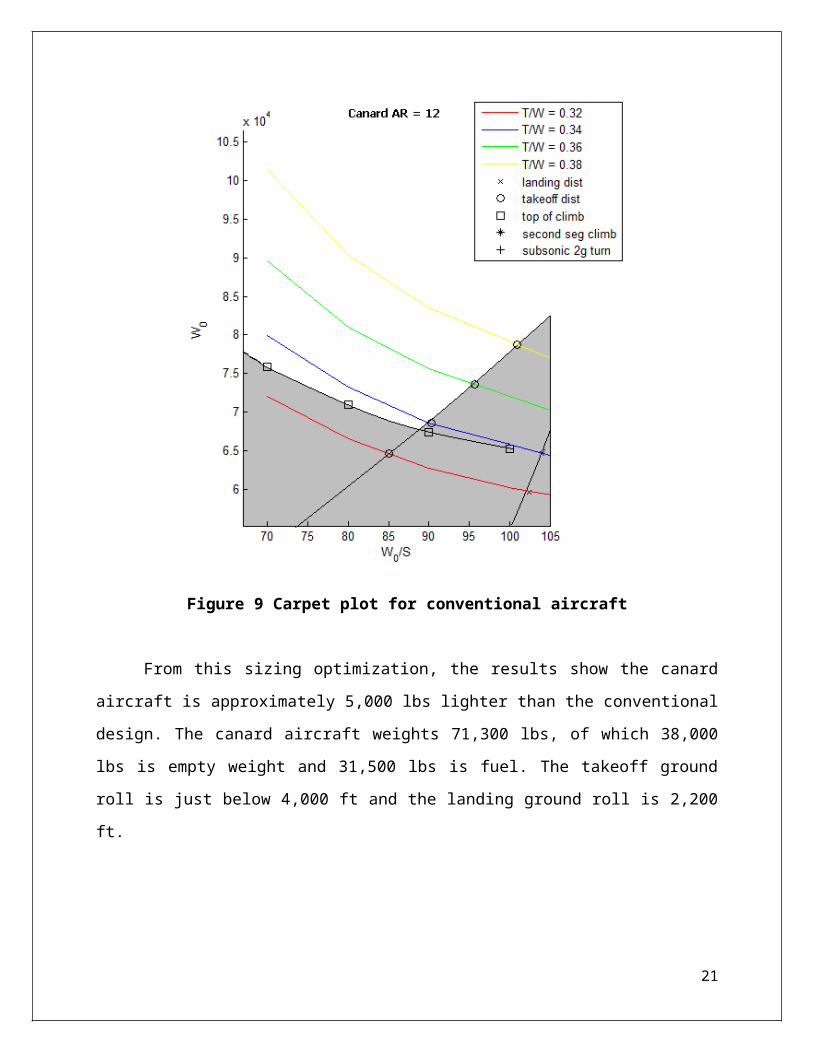
Figure 12: Detail Drawing of Conference Area and Cocktail Galley
Figure 13: Fuselage Cross Section and Seating Dimensions
Similar to the table constructed for the exterior aircraft dimensions, a table of interior
layout and seating dimensions was constructed for the main cabin, shown in Table 6.
21
Table 6: Interior Cabin and Seating Dimensions
Dimension Value
Major Cabin Dimensions
Outer Cabin Diameter 106”
Inner Cabin Diameter 100˚
Aisle Height 6’-3”
Minimum Aisle Width 27”
Main Cabin Length 50’
Additional Cabin Length 10’
Seating Dimensions
Standard Recliner Width 27”
Standard Recliner Depth 33”
Square Table Length / Width 26”
Flight Attendant Recliner Width 20”
Flight Attendant Recliner Depth 33”
Sofa Dimensions
Sofa Length 7’-6”
Sofa Depth 35”
Conference Area Dimensions
Conference Seat Width 4’-4”
Conference Seat Length 8’-4”
Conference Table Width 2’-6”
Conference Table Length 4’-4”
22
Cabin Layout / Amenities
The aircraft’s cabin was designed with the intent of providing a plush experience for each
and every passenger on board. A number of amenities and features were incorporated to
heighten the travel experience. The main cabin features a modern technology conference area,
complete with four passenger conference seating around a common table, a conference computer
desk and chair, and a retractable projector screen. More typical aircraft seating can be found in
the six large fully reclining chairs, two pairs of which are arranged in a face to face seating and
share common fold down tables. For more casual seating, two sofas are included in the main
cabin area, capable of seating three passengers each with a maximum capacity, or one passenger
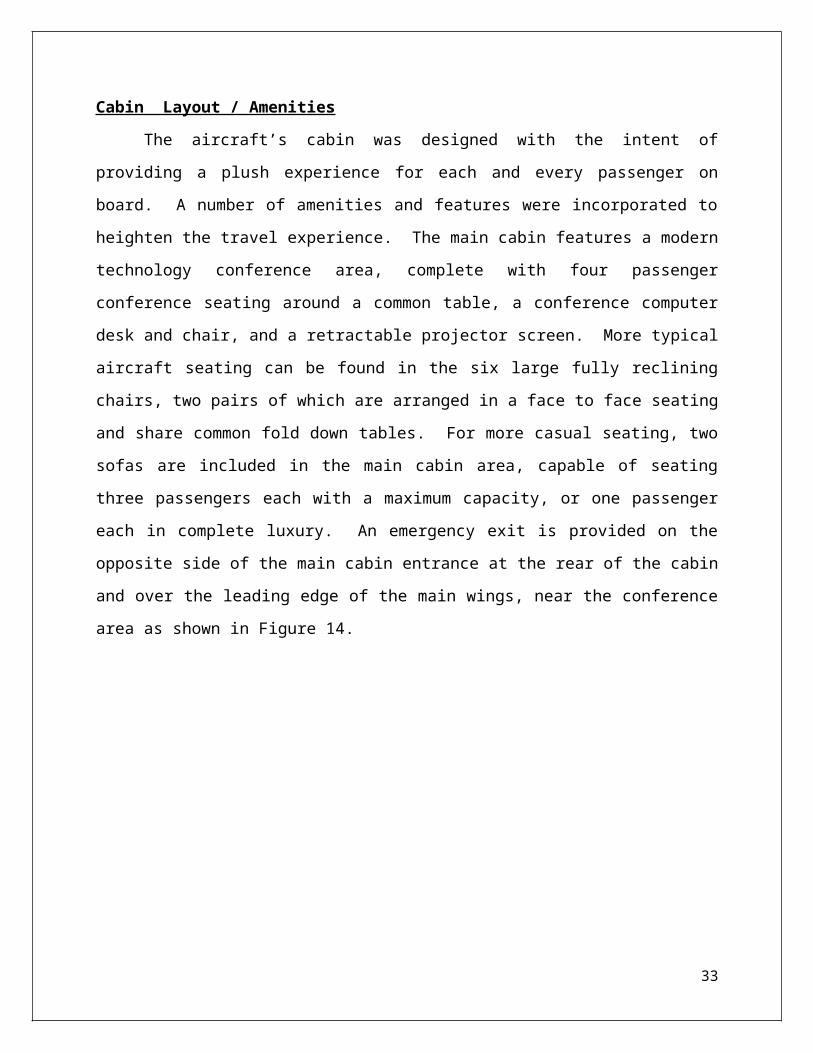
each in complete luxury. An emergency exit is provided on the opposite side of the main cabin
entrance at the rear of the cabin and over the leading edge of the main wings, near the conference
area as shown in Figure 14.
Figure 14: Emergency Exit Located at Rear of Main Cabin
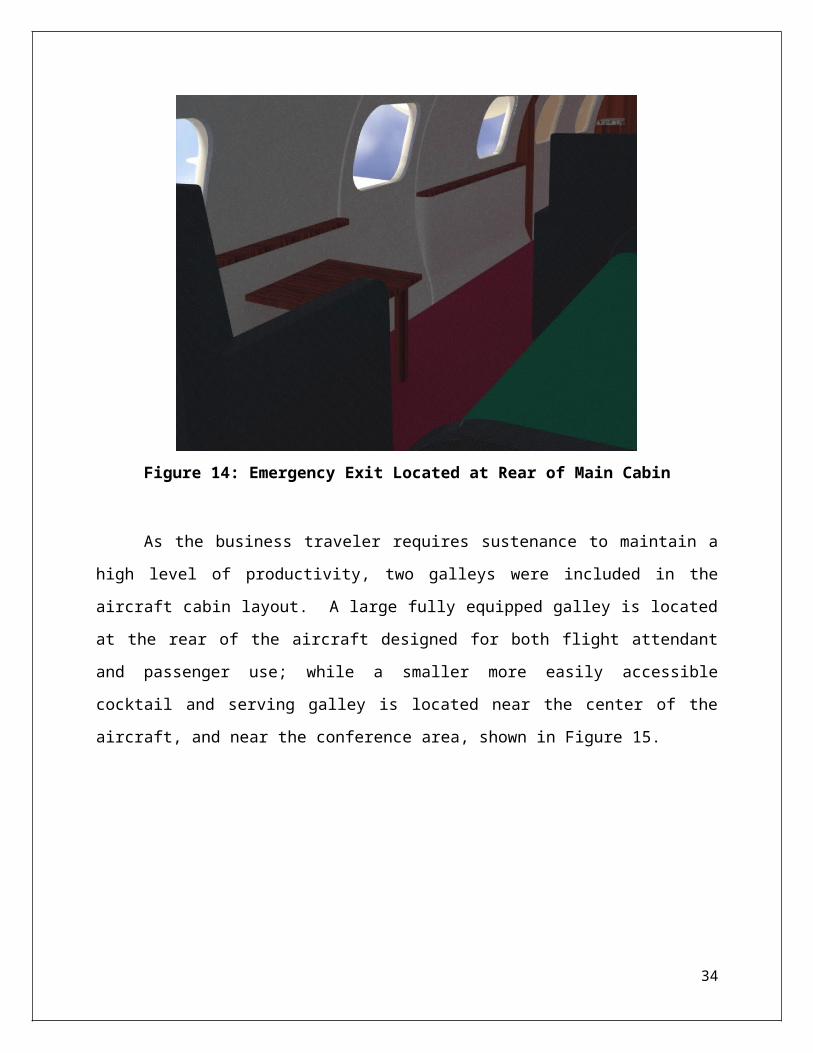
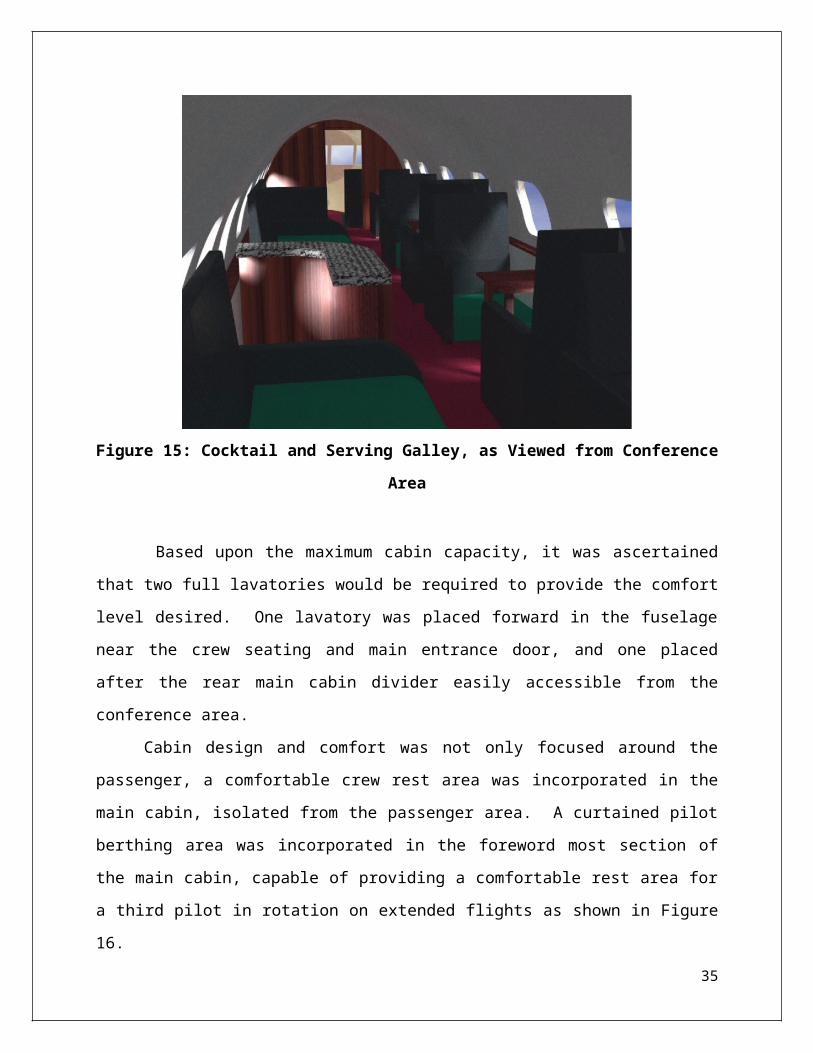
As the business traveler requires sustenance to maintain a high level of productivity, two
galleys were included in the aircraft cabin layout. A large fully equipped galley is located at the
rear of the aircraft designed for both flight attendant and passenger use; while a smaller more
23
easily accessible cocktail and serving galley is located near the center of the aircraft, and near the
conference area, shown in Figure 15.
Figure 15: Cocktail and Serving Galley, as Viewed from Conference Area
Based upon the maximum cabin capacity, it was ascertained that two full lavatories
would be required to provide the comfort level desired. One lavatory was placed forward in the
fuselage near the crew seating and main entrance door, and one placed after the rear main cabin
divider easily accessible from the conference area.
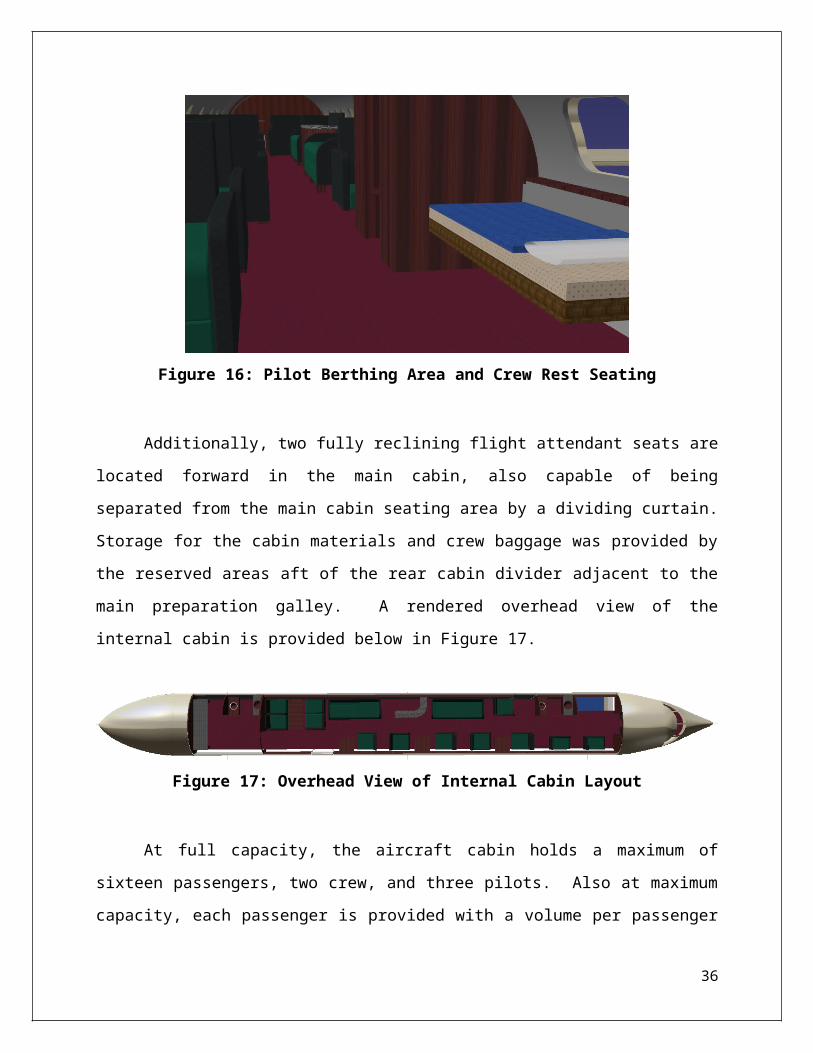
Cabin design and comfort was not only focused around the passenger, a comfortable crew
rest area was incorporated in the main cabin, isolated from the passenger area. A curtained pilot
berthing area was incorporated in the foreword most section of the main cabin, capable of
providing a comfortable rest area for a third pilot in rotation on extended flights as shown in
Figure 16.
24
Figure 16: Pilot Berthing Area and Crew Rest Seating
Additionally, two fully reclining flight attendant seats are located forward in the main
cabin, also capable of being separated from the main cabin seating area by a dividing curtain.
Storage for the cabin materials and crew baggage was provided by the reserved areas aft of the
rear cabin divider adjacent to the main preparation galley. A rendered overhead view of the
internal cabin is provided below in Figure 17.
Figure 17: Overhead View of Internal Cabin Layout
At full capacity, the aircraft cabin holds a maximum of sixteen passengers, two crew, and
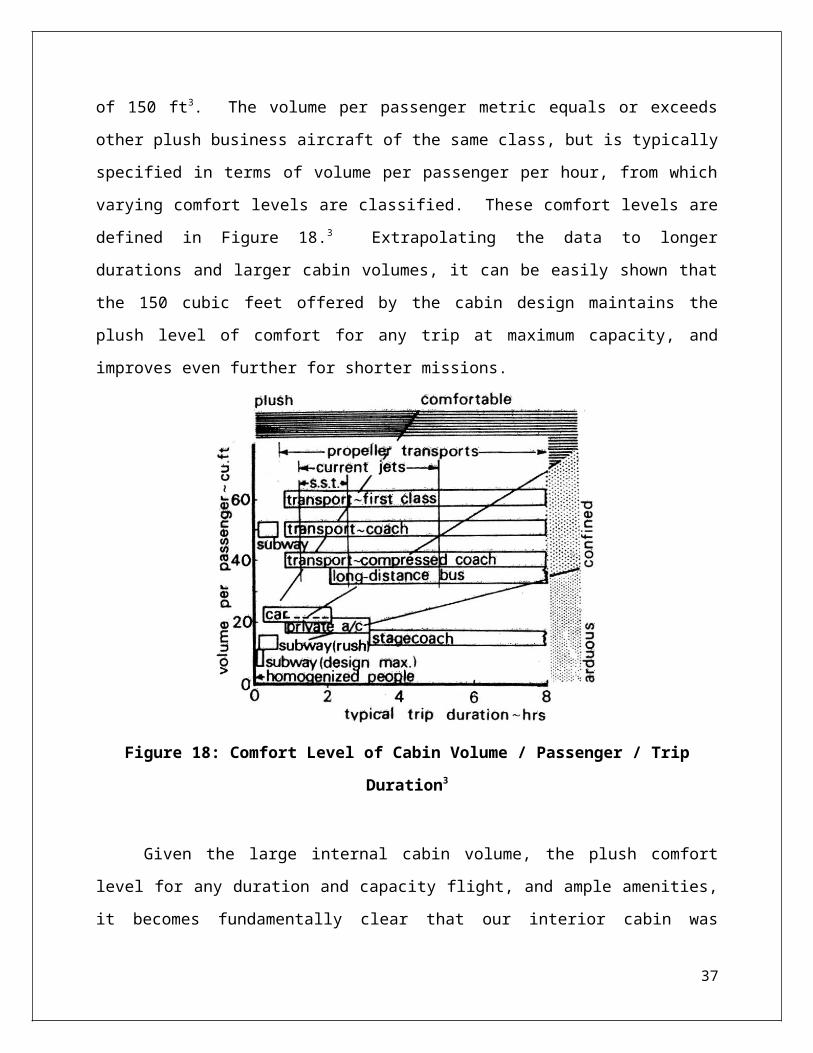
three pilots. Also at maximum capacity, each passenger is provided with a volume per passenger
of 150 ft3. The volume per passenger metric equals or exceeds other plush business aircraft of
the same class, but is typically specified in terms of volume per passenger per hour, from which
varying comfort levels are classified. These comfort levels are defined in Figure 18.3
Extrapolating the data to longer durations and larger cabin volumes, it can be easily shown that
the 150 cubic feet offered by the cabin design maintains the plush level of comfort for any trip at
maximum capacity, and improves even further for shorter missions.
25
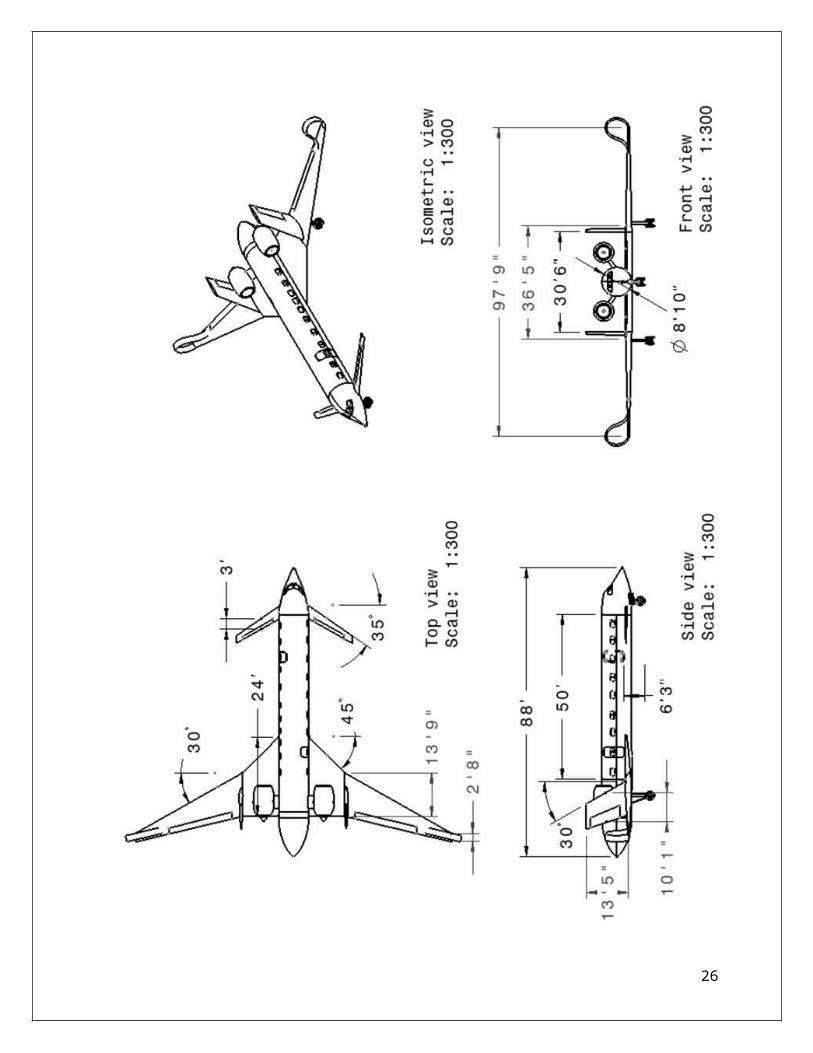
Figure 18: Comfort Level of Cabin Volume / Passenger / Trip Duration3
Given the large internal cabin volume, the plush comfort level for any duration and
capacity flight, and ample amenities, it becomes fundamentally clear that our interior cabin was
designed with every level of passenger and crew comfort and productivity in mind.
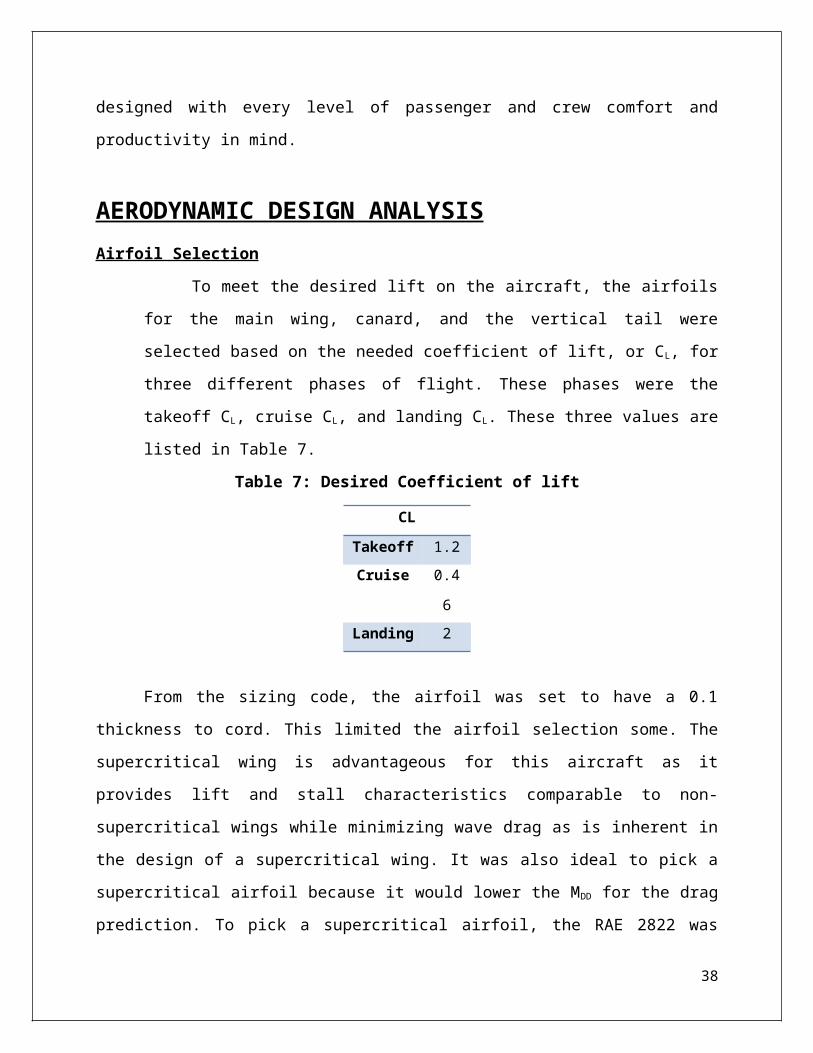
AERODYNAMIC DESIGN ANALYSISAirfoil Selection
To meet the desired lift on the aircraft, the airfoils for the main wing, canard, and
the vertical tail were selected based on the needed coefficient of lift, or CL, for three
different phases of flight. These phases were the takeoff CL, cruise CL, and landing CL.
These three values are listed in Table 7.
Table 7: Desired Coefficient of lift
CL
Takeoff 1.2
Cruise 0.46
Landing 2
26
From the sizing code, the airfoil was set to have a 0.1 thickness to cord. This limited the
airfoil selection some. The supercritical wing is advantageous for this aircraft as it provides lift
and stall characteristics comparable to non-supercritical wings while minimizing wave drag as is
inherent in the design of a supercritical wing. It was also ideal to pick a supercritical airfoil
because it would lower the MDD for the drag prediction. To pick a supercritical airfoil, the RAE
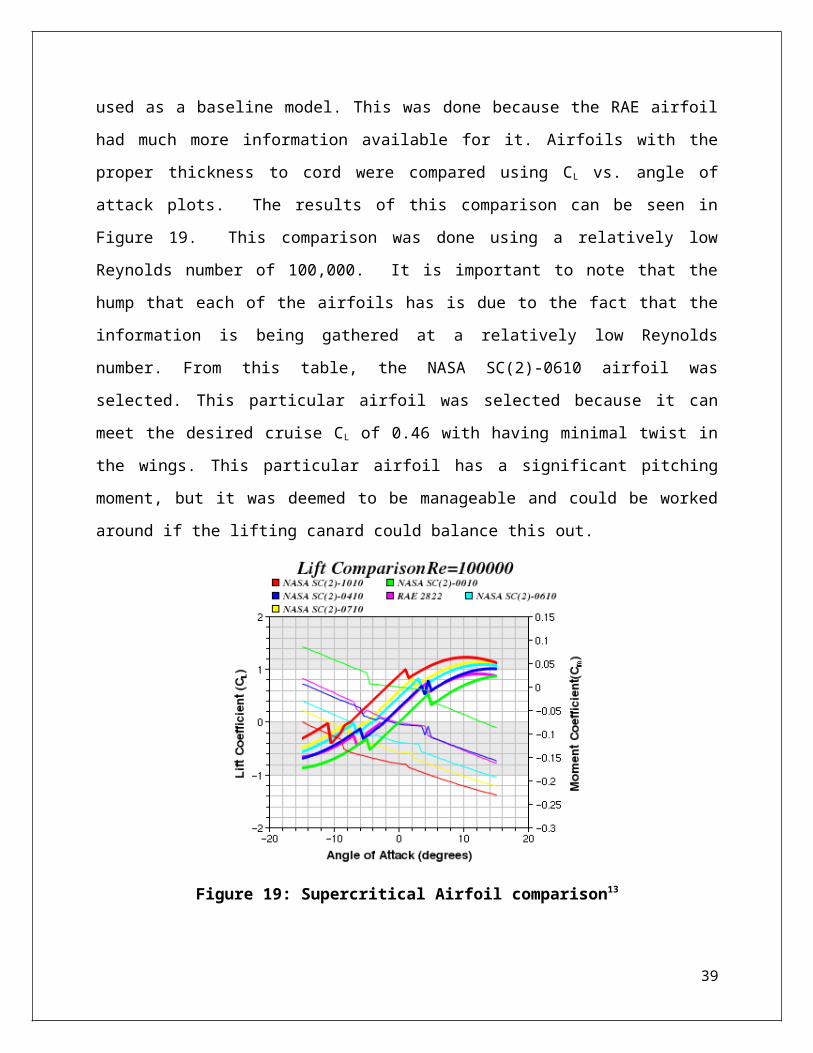
2822 was used as a baseline model. This was done because the RAE airfoil had much more
information available for it. Airfoils with the proper thickness to cord were compared using CL
vs. angle of attack plots. The results of this comparison can be seen in Figure 19. This
comparison was done using a relatively low Reynolds number of 100,000. It is important to note
that the hump that each of the airfoils has is due to the fact that the information is being gathered
at a relatively low Reynolds number. From this table, the NASA SC(2)-0610 airfoil was selected.
This particular airfoil was selected because it can meet the desired cruise CL of 0.46 with having
minimal twist in the wings. This particular airfoil has a significant pitching moment, but it was
deemed to be manageable and could be worked around if the lifting canard could balance this
out.
Figure 19: Supercritical Airfoil comparison13
27
With the airfoil selected, it can be analyzed at different Reynolds numbers. The
geometry information for the NASA SC(2)-0610 is given in Figure 20. A visual of the
airfoil can also be seen in Figure 20, and more information about the geometry can be
seen in Table 8. Using this geometry, the airfoil had been further evaluated at different
low Reynolds numbers. This comparison can be graphically seen in Figure 21. It is
important to note that as the Reynolds number increases, the stall angle transitions higher
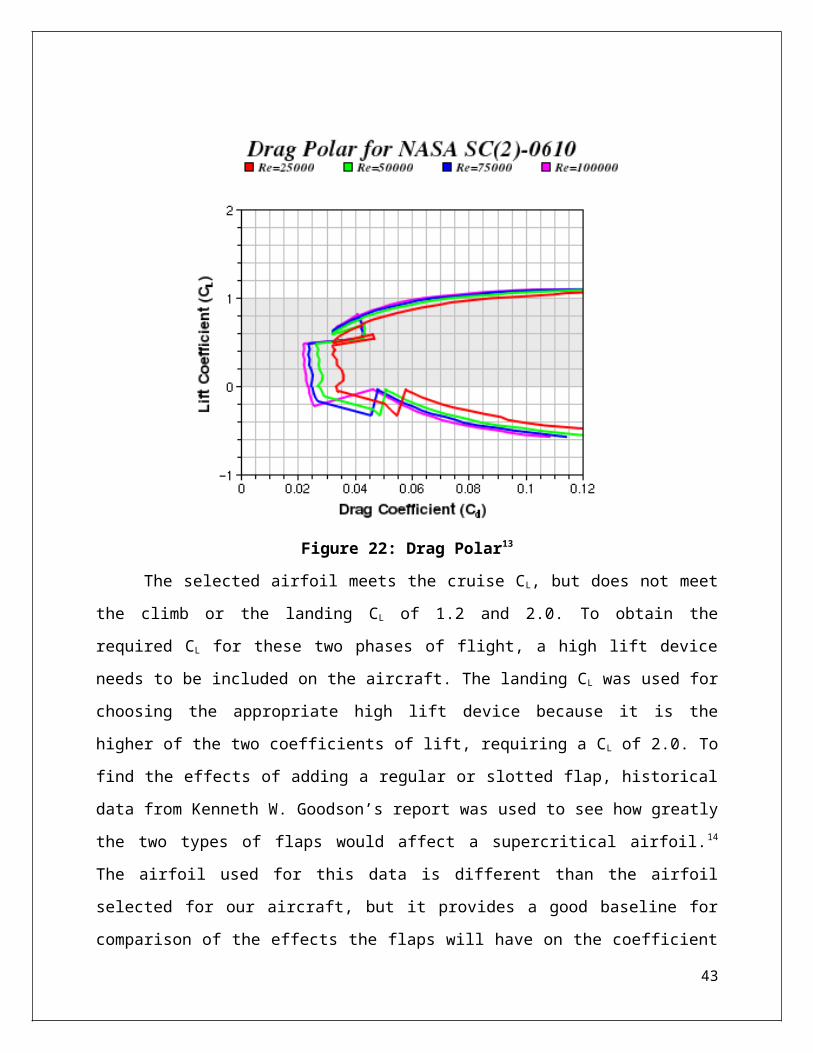
along the curve. The drag polar for this airfoil can also be seen in Figure 22, where the
trend is that as the Reynolds number increases, the coefficient of drag decreases. The
canard used a slightly thinner supercritical airfoil, with a thickness to cord of 0.08. This
thinner airfoil, NASA SC(2)-0608, does not provide as much lift or as great of a moment,
but is more than sufficient to meet the requirements of the canard. This airfoil will also
stall earlier depending on the angle that it is set at, which will help to keep the aircraft
stable.
Table 8: NASA SC(2)-0610 geometry
Geometry
Thickness: 10.00
%
Camber: 1.00
%
Trailing edge
angle:
2.9
deg
Lower Flatness: 12.50
%
Leading edge
radius:
1.70
%
28
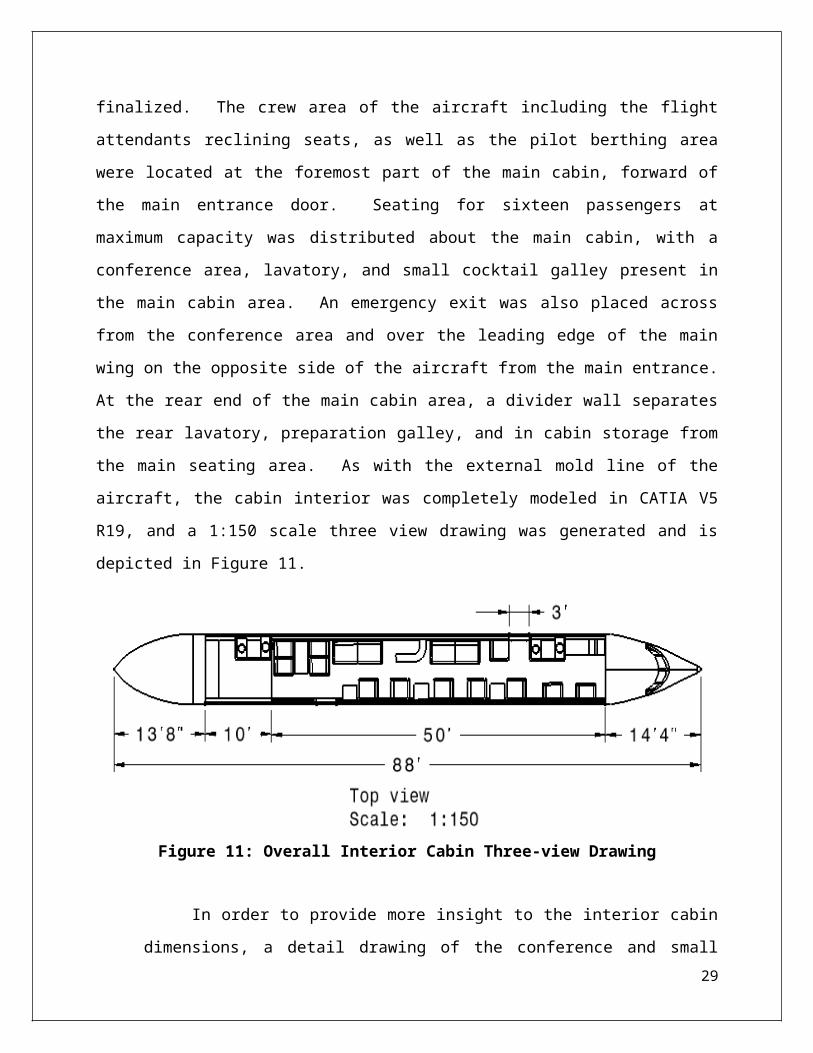
Figure 20: NASA SC(2)-0610 airfoil.
Figure 21: CL and Cm vs. Angle of Attack13
29
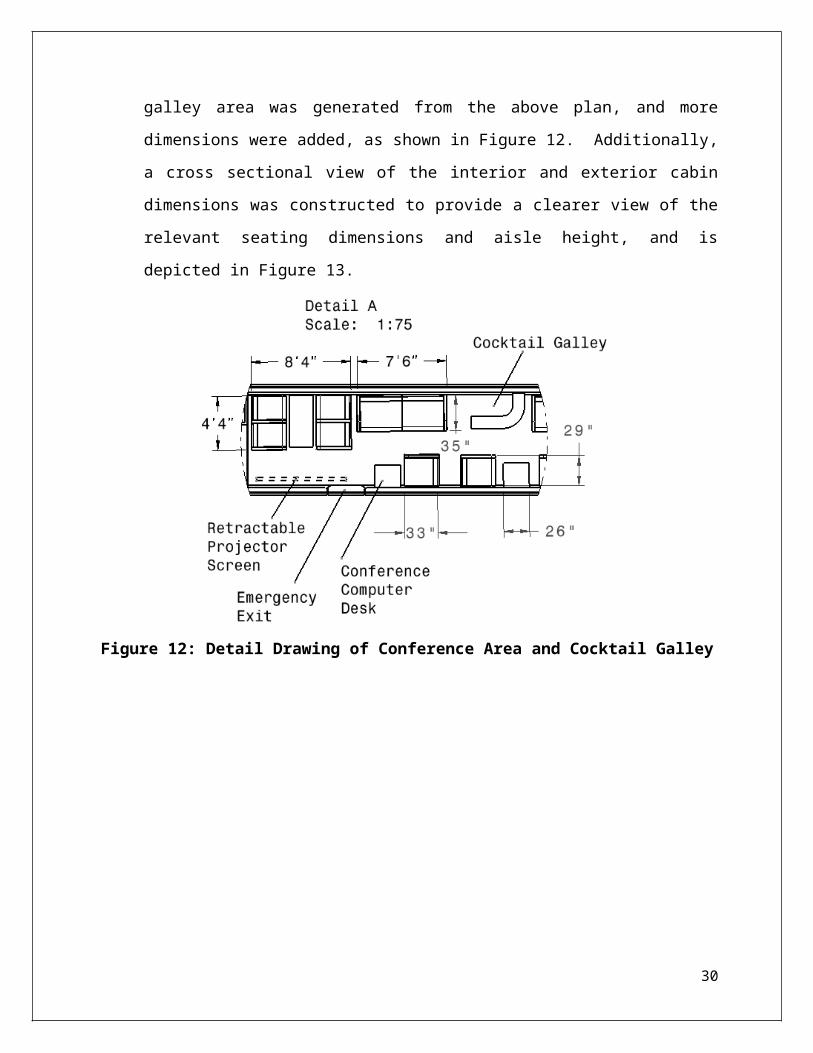
Figure 22: Drag Polar13
The selected airfoil meets the cruise CL, but does not meet the climb or the landing CL of
1.2 and 2.0. To obtain the required CL for these two phases of flight, a high lift device needs to
be included on the aircraft. The landing CL was used for choosing the appropriate high lift device
because it is the higher of the two coefficients of lift, requiring a CL of 2.0. To find the effects of
adding a regular or slotted flap, historical data from Kenneth W. Goodson’s report was used to
see how greatly the two types of flaps would affect a supercritical airfoil.14 The airfoil used for
this data is different than the airfoil selected for our aircraft, but it provides a good baseline for
comparison of the effects the flaps will have on the coefficient of lift. The results from this data
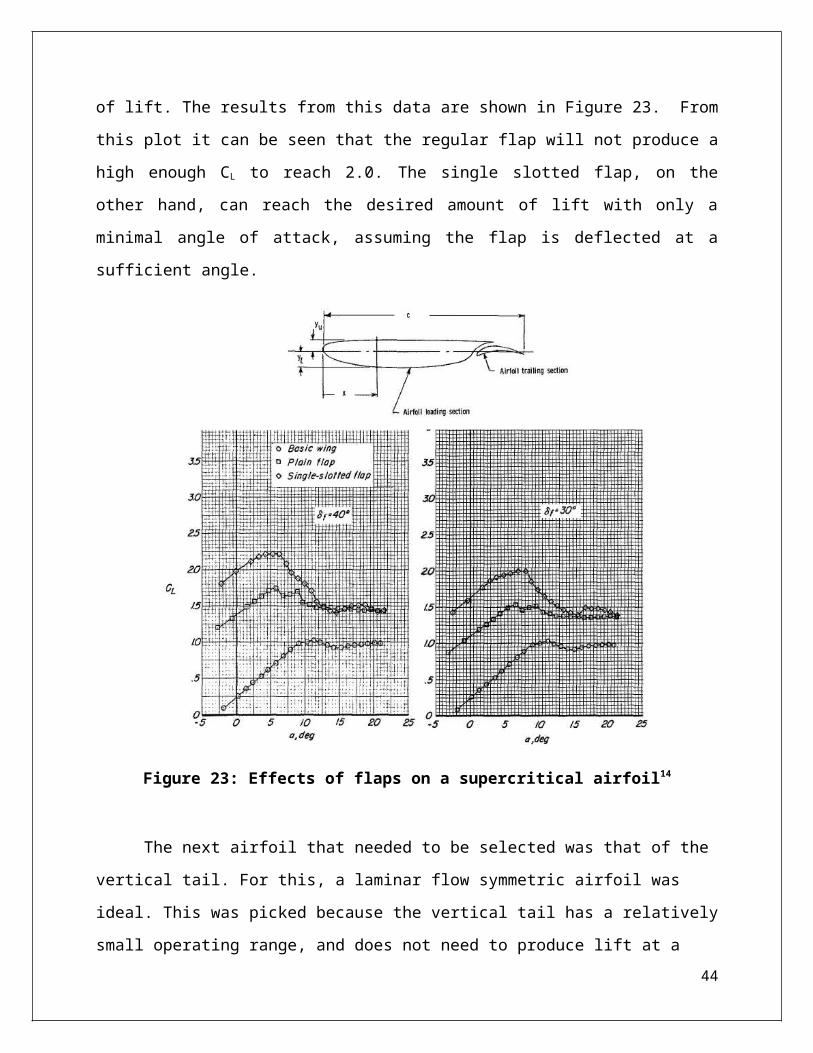
are shown in Figure 23. From this plot it can be seen that the regular flap will not produce a high
enough CL to reach 2.0. The single slotted flap, on the other hand, can reach the desired amount
of lift with only a minimal angle of attack, assuming the flap is deflected at a sufficient angle.
30
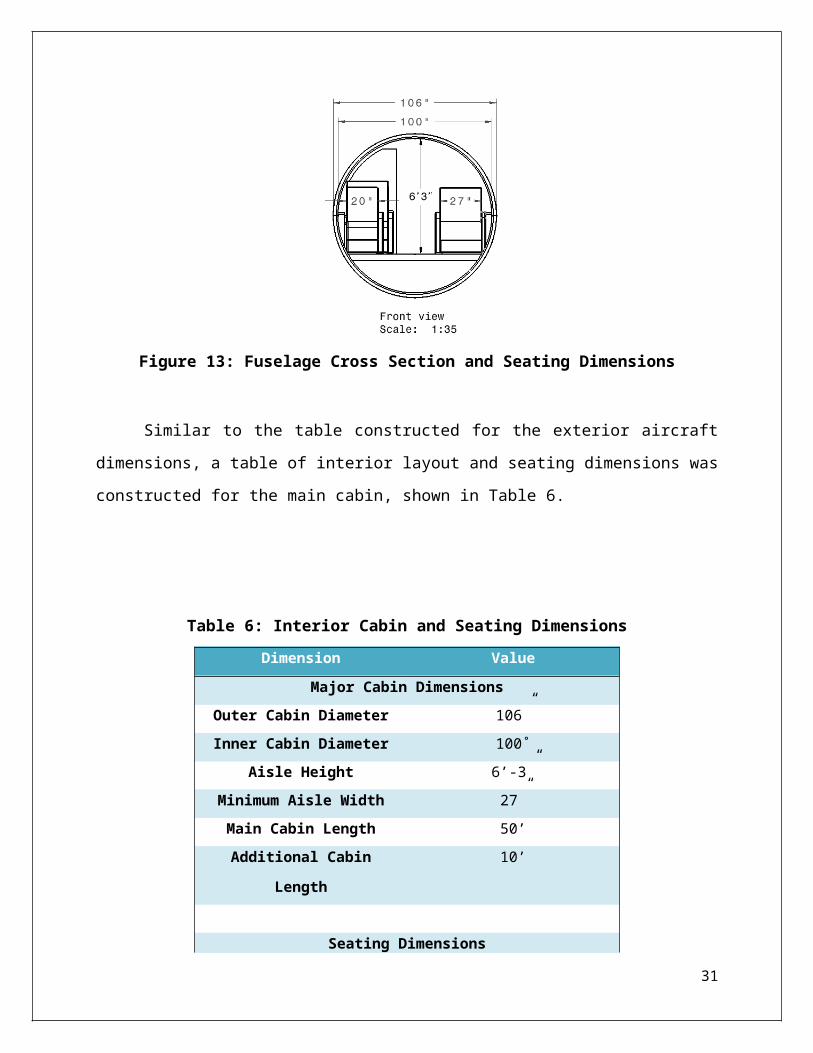
Figure 23: Effects of flaps on a supercritical airfoil14
The next airfoil that needed to be selected was that of the vertical tail. For this, a laminar
flow symmetric airfoil was ideal. This was picked because the vertical tail has a relatively small
operating range, and does not need to produce lift at a zero-degree angle of attack. Laminar flow
airfoils extend the transition point from laminar to turbulent flow on the airfoil. This can help to
reduce drag. The desired thickness to chord was obtained from the sizing code and found to be
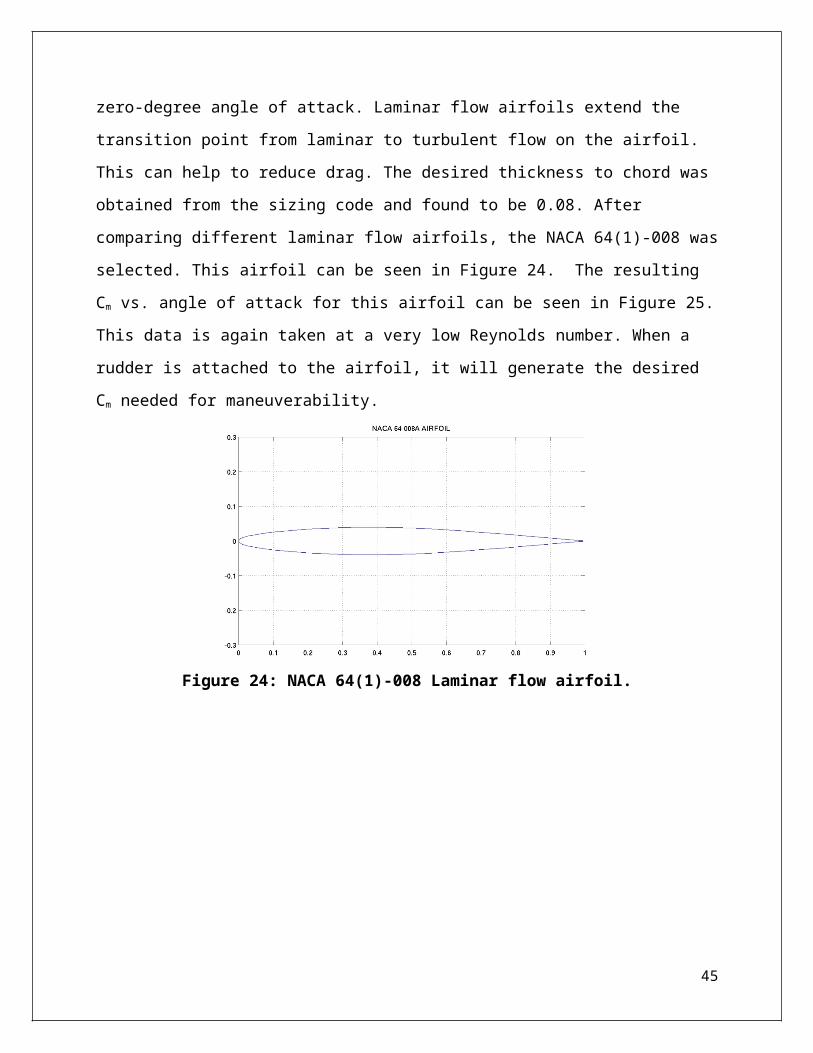
0.08. After comparing different laminar flow airfoils, the NACA 64(1)-008 was selected. This
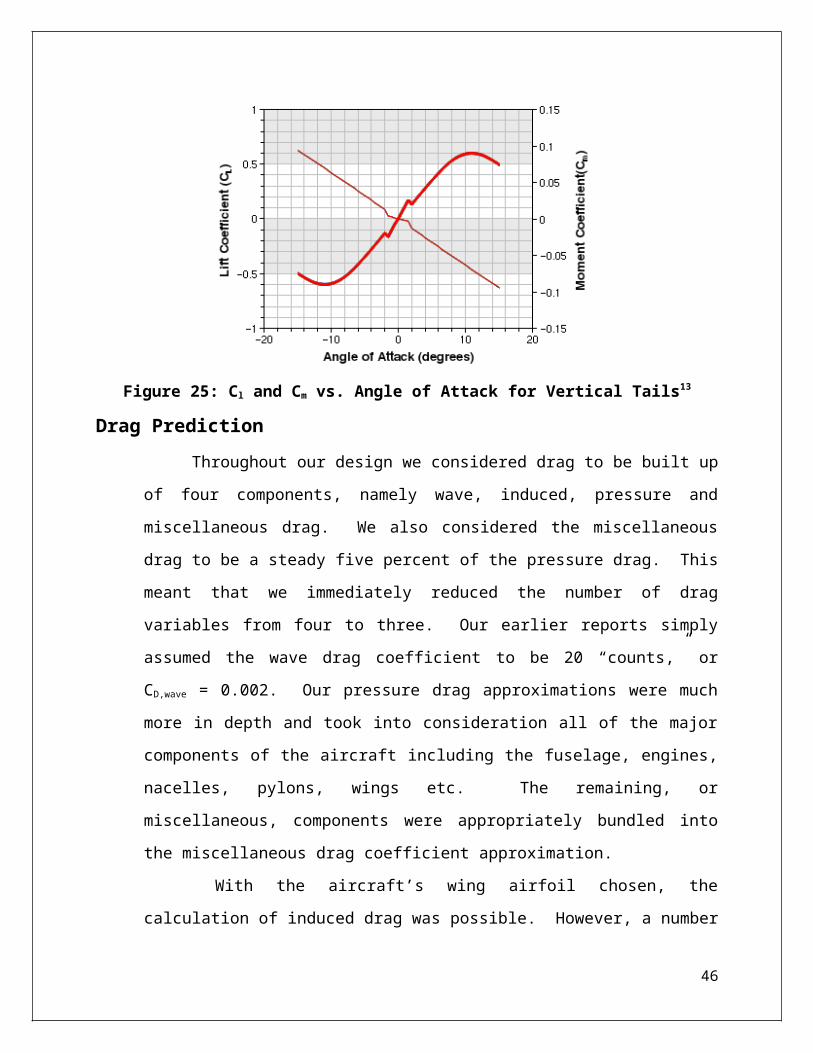
airfoil can be seen in Figure 24. The resulting Cm vs. angle of attack for this airfoil can be seen
in Figure 25. This data is again taken at a very low Reynolds number. When a rudder is attached
to the airfoil, it will generate the desired Cm needed for maneuverability.
31
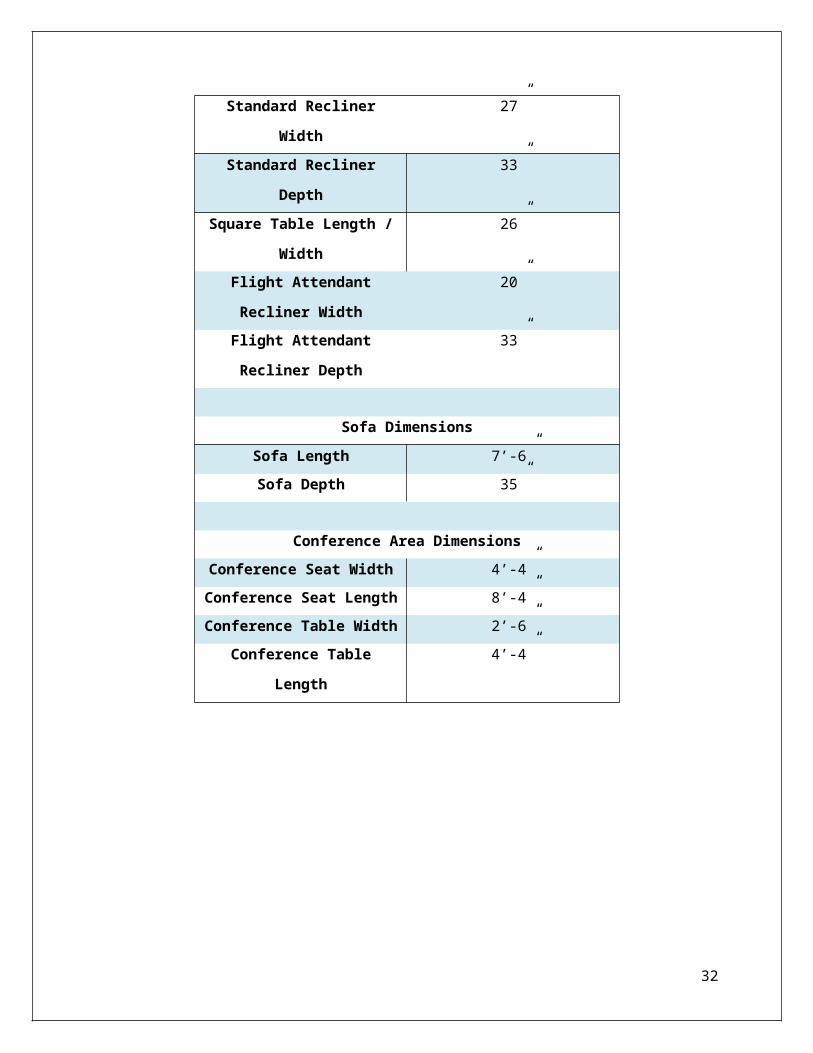
Figure 24: NACA 64(1)-008 Laminar flow airfoil.
Figure 25: Cl and Cm vs. Angle of Attack for Vertical Tails13
Drag Prediction
Throughout our design we considered drag to be built up of four components,
namely wave, induced, pressure and miscellaneous drag. We also considered the
miscellaneous drag to be a steady five percent of the pressure drag. This meant that we
immediately reduced the number of drag variables from four to three. Our earlier reports
simply assumed the wave drag coefficient to be 20 “counts,” or CD,wave = 0.002. Our
pressure drag approximations were much more in depth and took into consideration all of
the major components of the aircraft including the fuselage, engines, nacelles, pylons,
32
wings etc. The remaining, or miscellaneous, components were appropriately bundled
into the miscellaneous drag coefficient approximation.
With the aircraft’s wing airfoil chosen, the calculation of induced drag was
possible. However, a number of assumptions needed to be made. It was assumed that at
cruise, the combination of the air’s viscosity and the local length scales were not enough
to damp out the downwash produced by the canard prior to its interaction with the main
wing. With this assumption made, induced drag of the canard was calculated with an
induced drag prediction code developed in AAE 334, while the main wing’s induced drag
was found assuming the linear summation of the downwash angle of attack produced by
both the canard and main wing. The induced drag prediction found an overall induced
drag coefficient of approximately 0.0175. A technology factor was then applied of 0.93,
which is a result of the advanced technologies included in the design, to yield a final
induced drag coefficient of 0.01002.
The last part of the drag component buildup to be completed was a better
calculation of wave drag. The wave drag coefficient is approximated according to the
following equation.
CD,wave = 20*(M – Mcr)4
Here, Mcr is the critical Mach number, the Mach number at which wave drag first occurs. M cr is
usually considered to occur at a Mach number 0.07 less than the drag divergence Mach number,
MDD. However, the use of a supercritical airfoil pushes MDD forward such that Mcr occurs at a
Mach number only 0.01 less than the MDD calculated for a non-supercritical wing. MDD was
found to be approximately 0.83, yielding a Mcr of 0.82. All of the information needed to
calculate the wave drag coefficient at cruise is now known. Overall, the aircraft was found to
generate a drag coefficient of 0.02665 at cruise. This drag coefficient is less than that created by
the smaller Cessna 172 Skyhawk, but slightly higher than Boeing’s newest premier airliner, the
787.
PERFORMANCEV-n Diagram
33
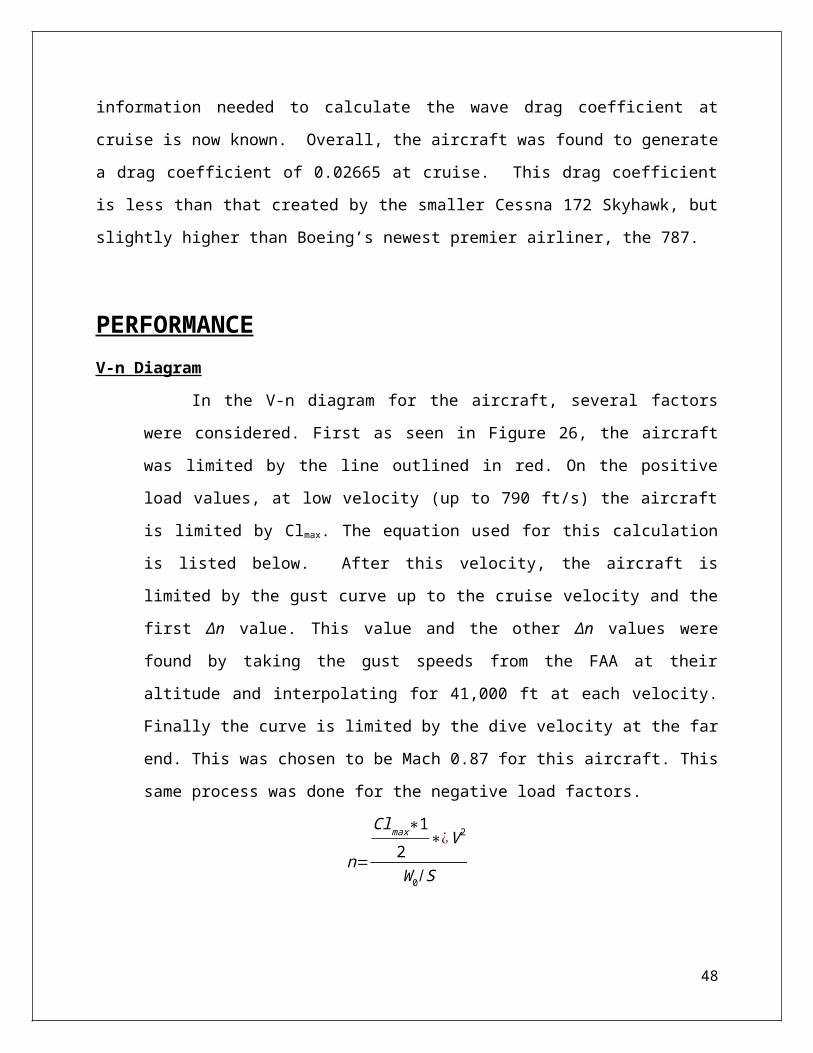
In the V-n diagram for the aircraft, several factors were considered. First as seen
in Figure 26, the aircraft was limited by the line outlined in red. On the positive load
values, at low velocity (up to 790 ft/s) the aircraft is limited by Clmax. The equation used
for this calculation is listed below. After this velocity, the aircraft is limited by the gust
curve up to the cruise velocity and the first Δn value. This value and the other Δn values
were found by taking the gust speeds from the FAA at their altitude and interpolating for
41,000 ft at each velocity. Finally the curve is limited by the dive velocity at the far end.
This was chosen to be Mach 0.87 for this aircraft. This same process was done for the
negative load factors.
n=
Clmax∗12
∗¿V 2
W 0/S
Figure 26 Aircraft V-n Diagram
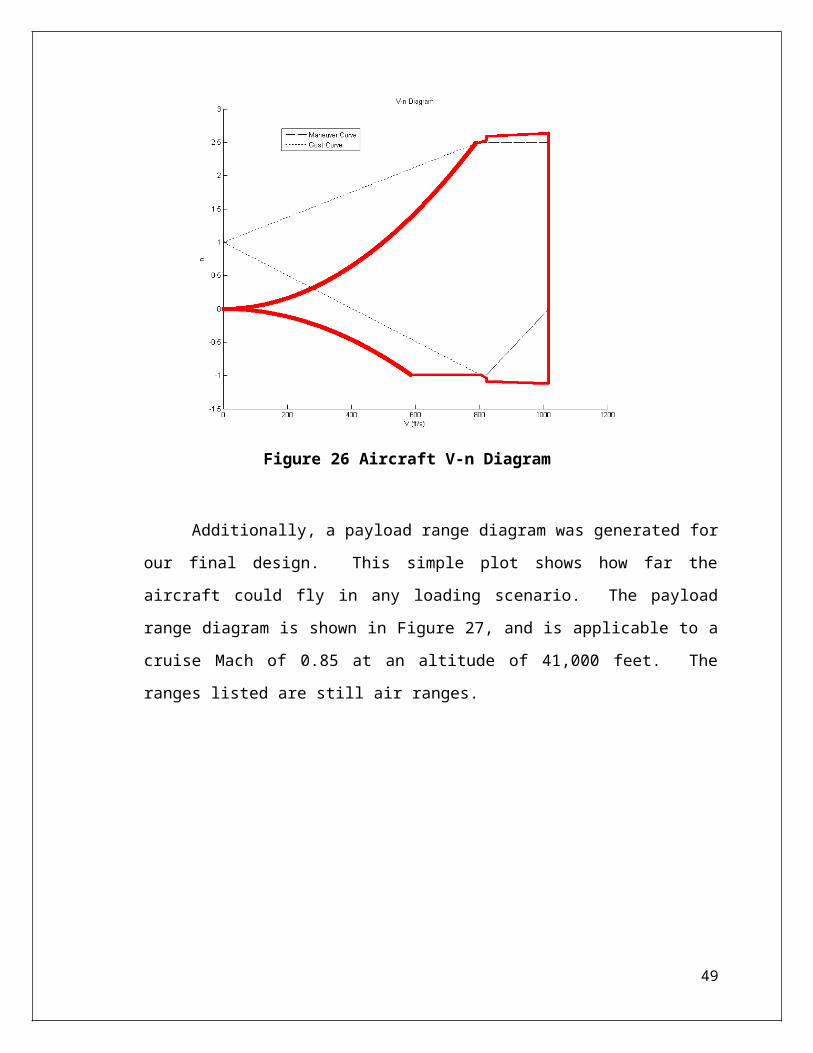
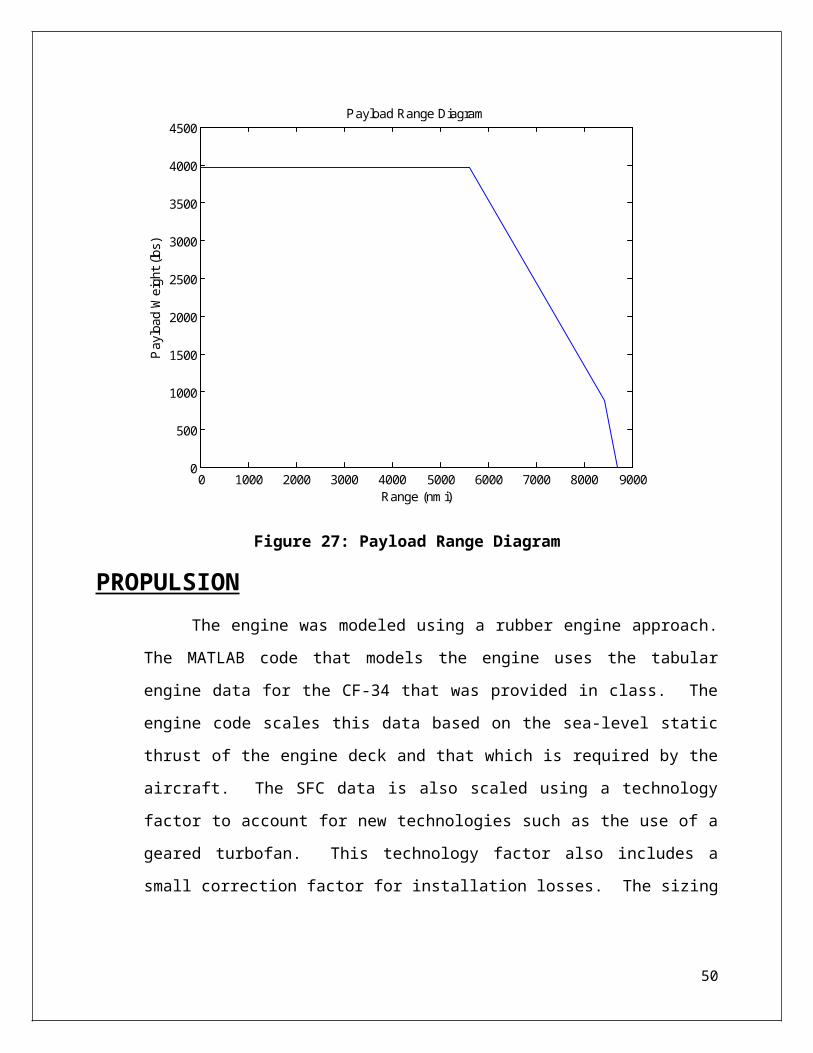
Additionally, a payload range diagram was generated for our final design. This
simple plot shows how far the aircraft could fly in any loading scenario. The payload
34
range diagram is shown in Figure 27, and is applicable to a cruise Mach of 0.85 at an
altitude of 41,000 feet. The ranges listed are still air ranges.
0 1000 2000 3000 4000 5000 6000 7000 8000 90000
500
1000
1500
2000
2500
3000
3500
4000
4500Payload Range Diagram
Range (nmi)
Pay
load
Wei
ght (
lbs)
Figure 27: Payload Range Diagram
PROPULSIONThe engine was modeled using a rubber engine approach. The MATLAB code
that models the engine uses the tabular engine data for the CF-34 that was provided in
class. The engine code scales this data based on the sea-level static thrust of the engine
deck and that which is required by the aircraft. The SFC data is also scaled using a
technology factor to account for new technologies such as the use of a geared turbofan.
This technology factor also includes a small correction factor for installation losses. The
sizing code uses the developed engine model to calculate the weight of the fuel required
in each segment of the design mission.
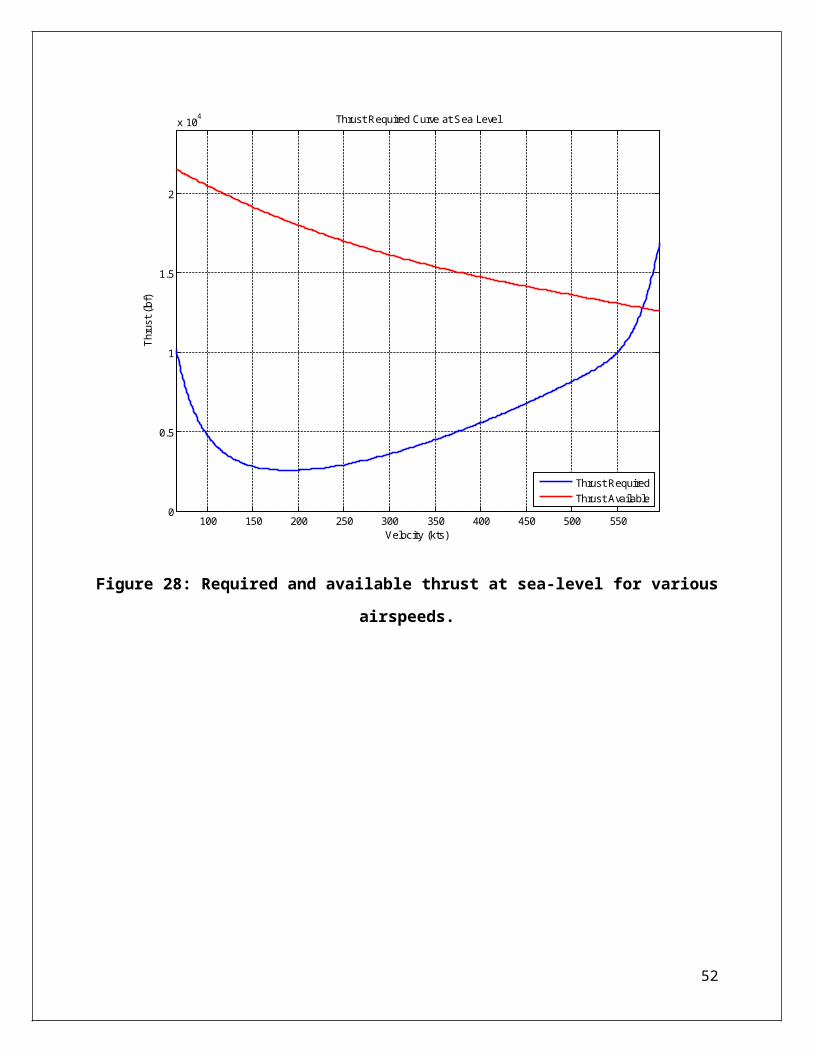
Once the aircraft is sized, the engine and drag models were used to generate thrust
required and thrust available curves for a range of speeds at sea-level and cruise altitude.
35
The thrust available curves are generated by simulating the engine model at full throttle at
a given altitude and a range of velocities and multiplying the resulting thrust by the
number of engines, Figure 28. The thrust required is determined by the drag on the
aircraft. Figure 29 shows that there is a maximum operating airspeed, which corresponds
to a maximum operating Mach number of about 0.89.
100 150 200 250 300 350 400 450 500 5500
0.5
1
1.5
2
x 104
Velocity (kts)
Thru
st (l
bf)
Thrust Required Curve at Sea Level
Thrust RequiredThrust Available
Figure 28: Required and available thrust at sea-level for various airspeeds.
36
250 300 350 400 450 500
2000
2500
3000
3500
4000
4500
Velocity (kts)
Thru
st (l
bf)
Thrust Required Curve at 41000 feet MSL
Thrust RequiredThrust Available
Figure 29: Required and available thrust at cruise altitude for various airspeeds.
STRUCTURESThe placement of major structural components during the preliminary design process was
investigated in order to provide a starting point for future detailed design. Depicted in Figure 30
is a diagram of the major structural components that compose the outer mold line of the aircraft.
Examining historical cutaways from similarly sized and loaded aircraft, two spars were deemed
necessary for the preliminary design process. The upper and lower spars are connected by shear
webbing as indicated on the diagram in green, and the wing and fuselage intersection is filleted
to provide lower aerodynamic interference as shown in blue. Ribs are modeled with equal
spacing to maintain the airfoil’s shape and transfer the distributed skin loads from to the spars.
The vertical tails and canards share a similar construction to the main wings, though with one
main spar in each to account for the lower force distribution and span on each component.
37
Also shown in Figure 30 is a rough sketch of the major components of the fuselage
structure. The fuselage is constructed from structural frames to maintain its cross-sectional
shape, connected with longerons to resist bending and to support the aircraft’s skin. Reinforced
bulkheads are integrated into the main frame at the fore and aft most portion of the cabin to
provide a barrier for the pressurized ends of the main cabin. Sills were modeled above and
below the fuselage cutouts for the doors and windows, and beams with several webbing cross
members were placed on the sides of each door and window to tie the sills together and to
connect them to their respective fuselage frames. The sills and beams are indicated in red and
blue around each door and window in Figure 30.
Figure 30 Overview of Major Structural Members
Load Paths
After modeling a sampling of the major structural components on the aircraft frame, the
major aircraft loads were applied to the structural model in low fidelity to provide evidence of
the structural members needed to carry the specified loads. Distributed lift and weight loads were
applied to the airframe through the skin, and ribs, which was transferred from the ribs to the
wing’s spars, and passed to the fuselage. The drag force on the wings and fuselage are carried by
the aircrafts skin, passed to the ribs, spars, frames, and longerons, and is distributed throughout
the entire aircraft framework along with the fuselage weight. Point loads from the thrust of both
engines are carried through the pylon supports into the beams between the large fuselage frames
38
surrounding the pylons, and is likewise distributed through the fuselage assembly through the
frames and longerons. The major loads applied to the aircraft and a low fidelity model of the
structural members that carry them are shown in Figure 31.
Figure 31 Structural Highlights: Major Loads and Load Paths
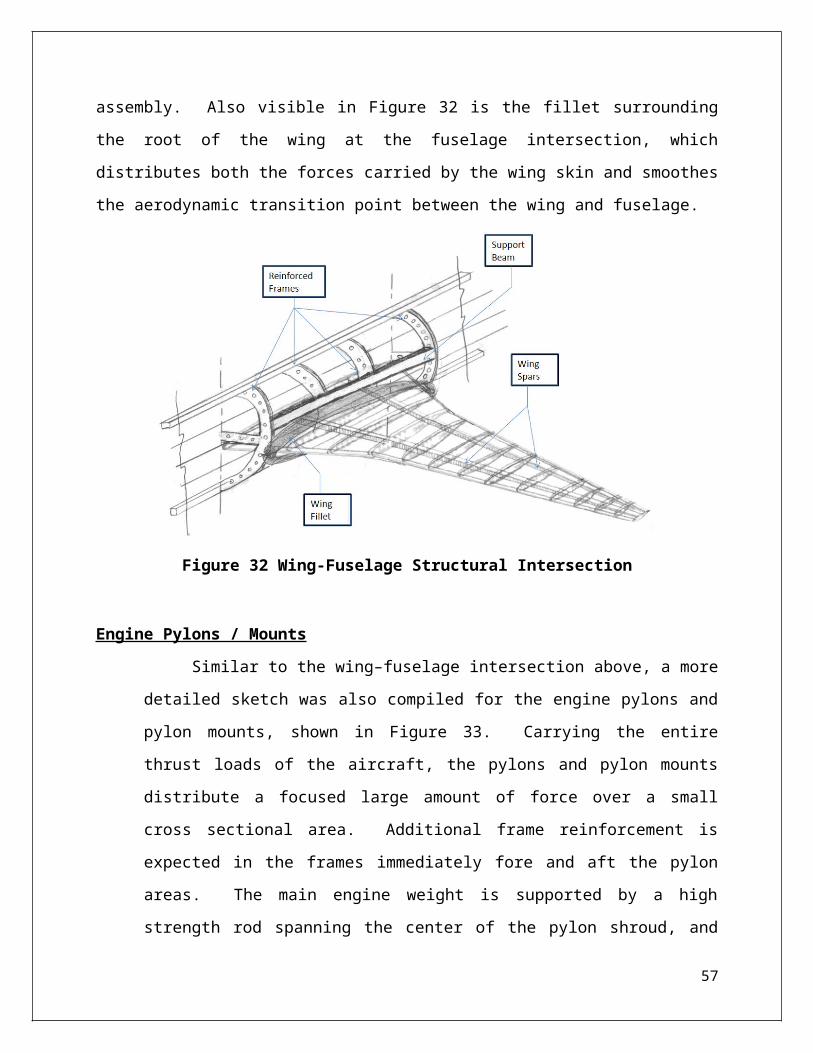
Wing-Fuselage Intersection
A more detailed sketch was drawn for the wing-fuselage intersection, and is presented in
Figure 32. The distributed weight, lift, and drag loads carried by the wings are transferred from
the wing’s skin to the ribs, then distributed across the wings spars, and are carried from the spars
to the fuselage. Surrounding the wings and the wing spars at the fuselage are reinforced frames
that are connected with beams above and below the wing intersection, to form a wing box that
accepts the wing cradle formed by the strake assembly. The wing box distributes the loads
imparted by the wing cradle to the longerons, thereby distributing the wing forces across the
entire fuselage frame assembly. Also visible in Figure 32 is the fillet surrounding the root of the
wing at the fuselage intersection, which distributes both the forces carried by the wing skin and
smoothes the aerodynamic transition point between the wing and fuselage.
39

Figure 32 Wing-Fuselage Structural Intersection
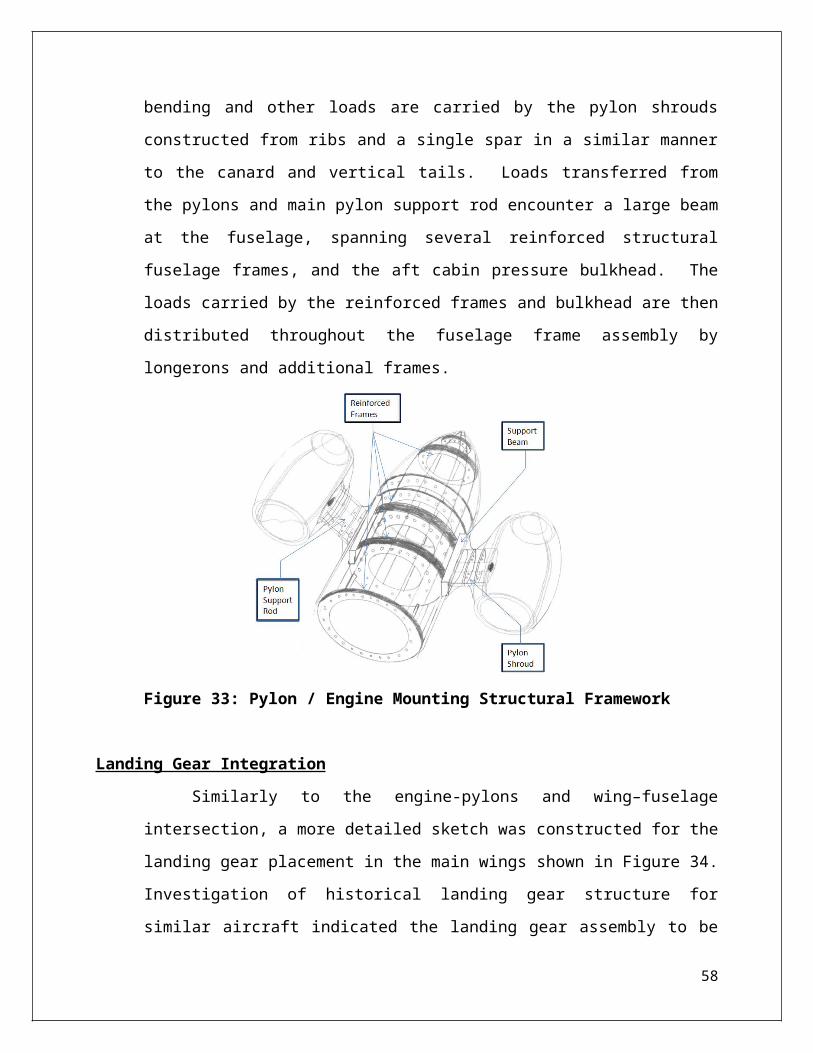
Engine Pylons / Mounts
Similar to the wing–fuselage intersection above, a more detailed sketch was also
compiled for the engine pylons and pylon mounts, shown in Figure 33. Carrying the
entire thrust loads of the aircraft, the pylons and pylon mounts distribute a focused large
amount of force over a small cross sectional area. Additional frame reinforcement is
expected in the frames immediately fore and aft the pylon areas. The main engine weight
is supported by a high strength rod spanning the center of the pylon shroud, and bending
and other loads are carried by the pylon shrouds constructed from ribs and a single spar in
a similar manner to the canard and vertical tails. Loads transferred from the pylons and
main pylon support rod encounter a large beam at the fuselage, spanning several
reinforced structural fuselage frames, and the aft cabin pressure bulkhead. The loads
carried by the reinforced frames and bulkhead are then distributed throughout the
fuselage frame assembly by longerons and additional frames.
40
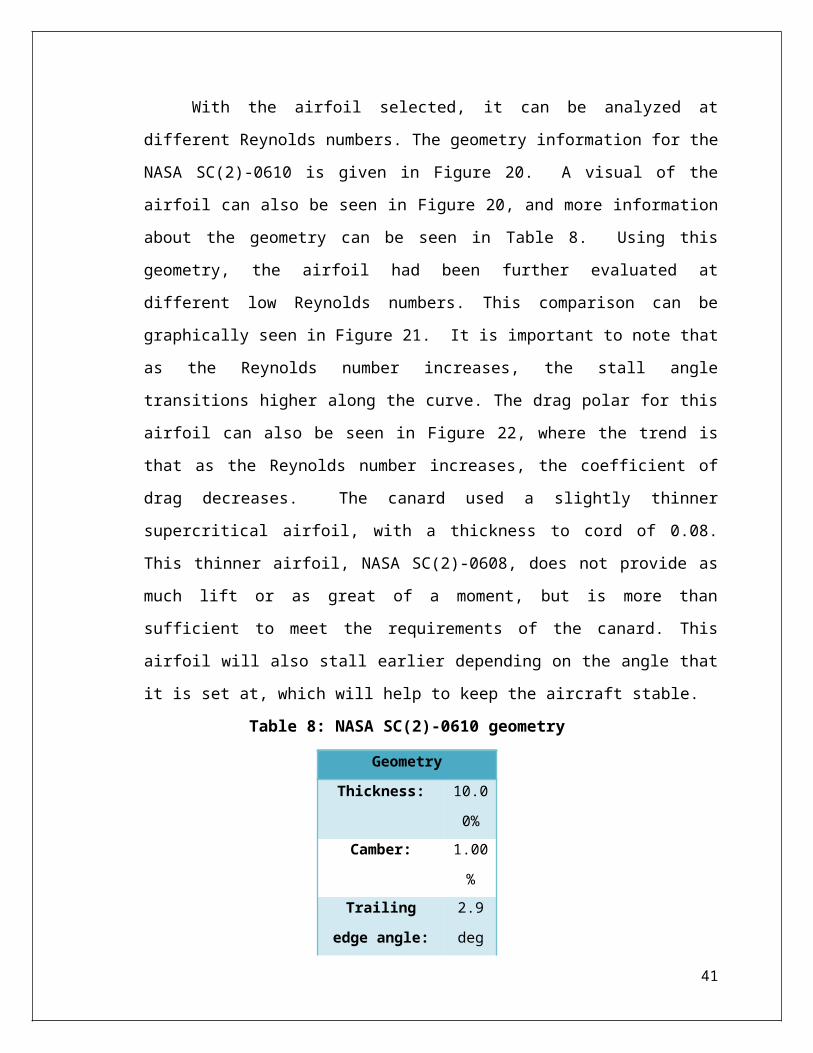
Figure 33: Pylon / Engine Mounting Structural Framework
Landing Gear Integration
Similarly to the engine-pylons and wing–fuselage intersection, a more detailed
sketch was constructed for the landing gear placement in the main wings shown in Figure
34. Investigation of historical landing gear structure for similar aircraft indicated the
landing gear assembly to be supported by beams attached to reinforced ribs outboard on
the main wings. In order to provide adequate wing thickness to accommodate retractable
landing gear, the landing gear must be placed near the twin vertical tails, to allow a large
enough bay into which the landing gear could retract. The loads from the main gear on
landing are transferred through the landing gear assembly, the reinforced ribs, and into
the wing spars to be passed to the fuselage in the same manner as the lift, weight, and
drag forces on the wing.
41
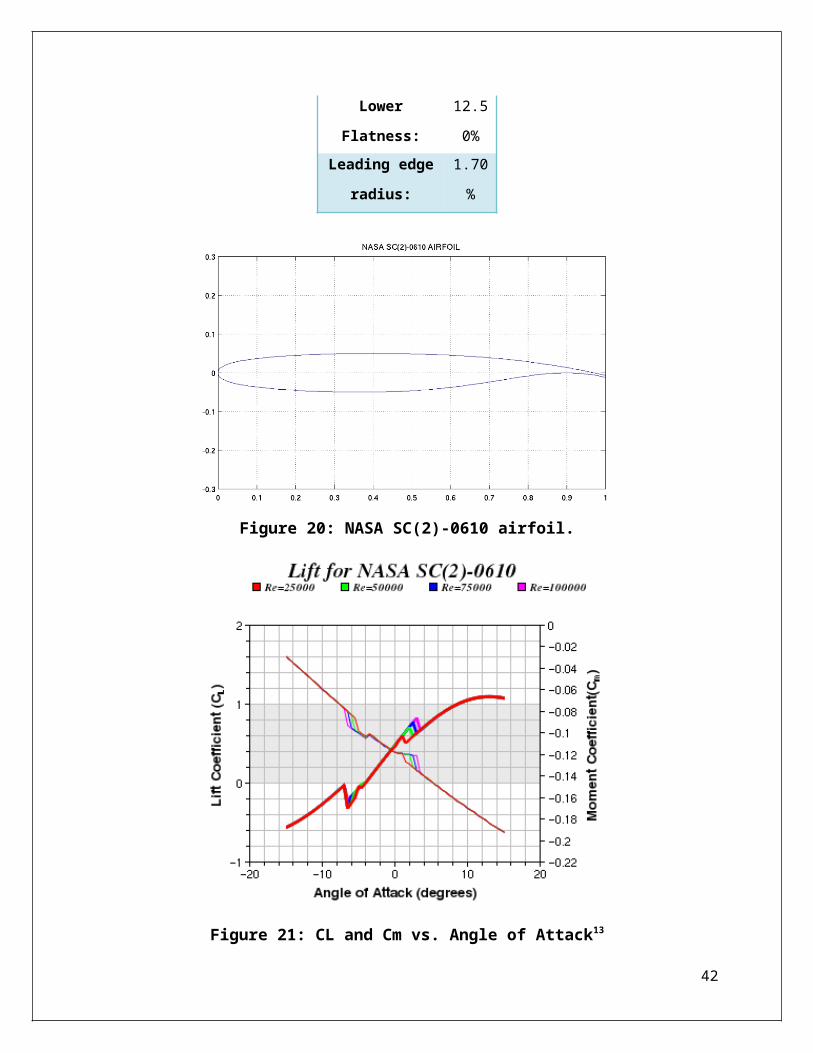
Figure 34: Landing Gear Structural Framework Detail
Material Selection
In order to provide a reduction in empty weight fraction, research was conducted on the
incorporation of a combination of both advanced and traditional materials on the airframe. The
materials selected to be used on the aircraft were chosen based on five main factors.
Strength to Weight Ratio
Fatigue Resistance
Maintenance
Cost
Ice-phobic Characteristics
In order to meet the chosen requirements, the following materials were considered.
Advanced Composites
Advanced composite materials were taken into consideration because of their high
strength to weight ratio and tailoring capabilities. Use of advanced composites on
commercial aircraft has been limited due to material and manufacturing costs, as well as
poorly developed inspection and repair practices. With few exceptions, commercial
airliners have incorporated a maximum structural weight of 15% composites until the last
decade. More recent undertakings such as the Boeing 787 have achieved a composite
42
makeup of up to 50% structural weight, and will help promote the development of more
established inspection and maintenance practices, resulting in potentially easier aircraft
certification.
Our design will incorporate a quasi-isotropic [45°/0°/-45°/90°]s symmetric layup
of AS4-3501-6 carbon-epoxy unidirectional pre-preg on the wing skin and control
surface panels.15 Quasi-isotropic carbon-epoxy layups possess a specific strength of three
times to five times that of the aluminum alloys typically used in wing skins panels.15 Due
to the addition of cooling, ice-phobic coatings, and electrical grounding systems required
in higher composite fraction aircraft based upon historical research, a more modest 50%
reduction in empty weight fraction for the relevant components is expected.
While there are significant potential benefits from the use of advanced composite
materials, a number of difficulties have historically limited their use on aircraft. Current
theoretical failure prediction incorporates a variety of inaccurate assumptions, but this
adversity is becoming largely offset by the growing historical database of composite
aircraft. Additionally, fatigue and fracture detection on composite materials lacks a wide
array of non-destructive techniques, leading to historically difficult certification of
primarily composite aircraft. Recent improvements in ultrasonic scanning, x-ray, and
acoustic emission techniques are projected to increase with the advent of the Boeing 787,
and it is expected that the newly developed field will become sufficient to ease the
certification of primarily composite airframes by the 2020 manufacturing date.
The development of new open-and-closed molding techniques, as well as
injection molded resin transfer methods for cylindrical fuselage sections, have reduced
manufacturing costs for composite aircraft construction. Despite the manufacturing cost
reduction, composite manufacturing costs are still higher than more conventional
manufactured aluminum aircraft. A reduction in the manufacturing cost of composite
materials on aircraft is expected resulting from the combination of a lower parts count
afforded by composite panel layup, as well as mass production advances developed
through the increased use of composites on the Boeing 787.
43
Advanced Aluminum Alloys
While a great deal of research and discussion has been conducted to the use of
composites in the aerospace industry, aluminum alloys have continued to advance as
well. Recent developments in Aluminum-Lithium alloys have been targeted directly at
the aerospace industry due to the high strength to weight ratio, exceptional fatigue
performance, and cryogenic toughness properties. Aluminum-lithium alloys have existed
since the 1950’s, and were developed by adding lithium to aluminum-copper, aluminum-
magnesium, and aluminum-copper-magnesium alloys. Aluminum-lithium alloys promise
superior crack propagation resistance when compared to the more traditionally used 2000
and 7000 aluminum alloys used in airframe construction.
Alcoa’s 2090 series of aluminum-lithium alloys have been used on military
aircraft and the NASA space shuttle to provide significant weight reductions, thereby
allowing heavier payload capacities.16 The increased strength of aluminum-lithium alloys
has promoted the use of less material for the same strength and safety margin compared
even to advanced composites, and are employed up to 20% by structural weight on
commercial aircraft such as the Airbus A350.
Though more fatigue and crack resistant than traditional aluminum alloys, a
number of disadvantages exist for aluminum-lithium alloys in aerospace applications.
Due to the increased strength and crack resistance properties, aluminum-lithium alloys
contain a reduction in ductility and retain a degree of anisotropic properties. Specifically,
some lithium-aluminum alloys exhibit reduced fracture toughness in the transverse
direction from rolling, and promote accelerated fatigue crack extension for structurally
small micro-cracks.16 Despite the listed negative aspects of aluminum-lithium alloys,
their use on aircraft promotes a 1.5 to 3 times increase in expected life, and can be
manufactured, inspected, and repaired using conventional aircraft metal techniques. Due
to their superior strength to weight ratio, aluminum-lithium alloys were afforded the same
technology factor as advanced composite materials for the relative components.
44
Aluminum
Aluminum has been traditionally used in the aviation industry for up to 80% by
weight of typical modern aircraft. Forged and machined aluminum components are
relatively easier and cheaper to manufacture than their more modern material alternatives,
and have decades of reliable data regarding their strength, fatigue, and fracture properties.
Alloys typically used in commercial aircraft include 7075 for high stress applications due
to its high ultimate strength, relatively low weight, ease of machining, anodization
properties, and smooth finish.
Traditional uses of aluminum plate, coils, and sheets will be employed on our
aircraft in the absence of more technologically advanced materials due to their
historically proven performance in harsh environments, reduced manufacturing and
developmental costs, and established testing and repair techniques. It is also expected
that the incorporation of a large percentage of traditional aluminum alloys will provide
easier aircraft certification, and more reliable performance and airframe life data. As
aluminum is the most traditionally used material on modern aircraft, no technology factor
is incorporated for the aluminum aircraft components.
Steel Alloys
Heat-treated steel alloys were chosen for highly loaded components such as the
aircraft’s landing gear. Containing the most stringent performance requirements, the
landing gear is subject to severe loading conditions in a variety of environments.
Today’s commercial and military aircraft use 300M, HP9-4-30, and newer AF-140 or
AerMet 100 steel alloys. Additionally, the use of Ferrium S53 high strength stainless
steel alloys have been proposed due to strength to weight ratio improvements and
corrosion resistance over more traditional steel alloys.
Latrobe Specialty Steel has recently licensed the production of Ferrium S53 as a
high strength, high toughness, and corrosion resistant alloy suitable for aircraft landing
gear. Ferrium S53 has also been labeled an environmentally friendly landing gear by the
U.S. Air Force, having met the U.S. Air Forces requirement of a landing gear material not
requiring a toxic cadmium coating.17 Latrobe’s S53 steel is expected to expand into the
45
commercial aviation market in the foreseeable future, with other non-landing gear
aerospace applications such as jet engine bearings on the near horizon.17
While a significant empty weight fraction reduction from the use of Ferrium S53
is not expected on our aircraft application, it is an attractive material for the landing gear
components due to its superior toughness, corrosion resistance, and environmental
friendly manufacturing techniques through the lack of toxic coatings. Additionally,
currently manufactured Ferrium S53 landing gear provides a manufacturing cost
reduction to titanium alloys, and is expected to decrease further in price as their use
becomes more widespread.
Material Choice Benefits
The use of exotic materials on aircraft promises a significant reduction in empty
weight fraction, however one must take into account the costs associated with each
material, including developmental, manufacturing, and maintenance costs, ease of
certification, and additional system weight requirements. We expect a more conservative
structural weight reduction applied as a technology factor of 20% from the use of
advanced composite materials and Lithium Aluminum alloys on the aircraft’s skin panels,
nose, and leading and trailing edge surfaces. The material choices for major aircraft
components are listed below in Table 9.
Table 9: Aircraft Component Material Choices
Component Material Advantages
Fuselage skins and wing stringers Aluminum Alloys (Al-Li)
Better Fatigue Crack Growth (FCG) performance reduces
structural weightCanard, Control surfaces
and wing skin panelsCarbon-Epoxy Composite
LaminatesResistant to damage at high
temperaturesNose, Leading and Trailing
edgesCarbon-Epoxy Composite
LaminatesHigh fracture toughness and
yield strength
Landing Gear Steel Alloy (Ferrium S-53) High strength, corrosion resistant
46
47
WEIGHTS AND BALANCEAs discussed in past reports, the empty weight for the aircraft was calculated on a component
weight buildup method using equations from the Transport Aircraft category of Daniel Raymer’s
design textbook.8 For our final and best configuration; this led to the weights table listed below
as Table 10.
Table 10: Component Weight Table
Component Weight (lbs) Component Weight (lbs)
Gross Weight 71,331 Fuel System 308
Empty Weight 38,079 Flight Controls 683
Fuel Weight 31,481 Installed APU 440
Wing 6,913 Instruments 262
Canard 598 Hydraulics 180
Vertical Tail 1,085 Electrical 943
Fuselage 7,224 Avionics 471
Main Landing Gear 873 Furnishings 3,054
Nose Landing Gear 103 Air-conditioning 199
Nacelle 1,628 Anti-ice 139
Engine Controls 90 Crew 800
Engine Starter 130 Payload 3,960
CG Travel Diagram
Figure 35 below shows the location of the aircraft’s center of gravity for various
loading conditions. Four points in particular are listed in Table 11 and their
corresponding locations are shown on the plot. Point A represents the maximum takeoff
weight. Flying the design mission corresponds to a movement from point A to B, and the
various points between A and B on the plot correspond to the endpoints of each mission
leg. Moving from points B to C corresponds to the unloading of all passengers and crew.
Moving from points C to D corresponds to the refueling of the aircraft, and moving from
points D to A corresponds to the loading of all passengers and crew to full capacity.
Over the course of aircraft operation, the center gravity travels in approximately an eight
percent range of the total fuselage length.
48
62 63 64 65 66 67 68 69 70 71 7230,00035,00040,00045,00050,00055,00060,00065,00070,00075,000
CG Travel Diagram
CG (% Fuselage Length)
Tota
l Wei
ght (
lbs)
Figure 35: Aircraft Center of Gravity For Varied Loading Conditions
Table 11: Four Loading Conditions and Center of Gravity Points
Point Number of Passenger
s
Number of
Crew
Fuel (lbs)
A 16 4 37,750
B 16 4 0
C 0 0 0
D 0 0 37,750
STABILITY AND WEIGHTSControl Sizing
Crosswinds
Quite often a runway is oriented in such a way that landings must be made while the
wind is blowing across the runway rather than parallel to it. When this is the case, additional
complexities are introduced into the approach and landing process. If left uncorrected, the
crosswind acting upon the aircraft will continually cause the plane to drift in the direction of the
wind, making a conventional landing impossible. One method for counteracting the effects of the
49
D
CB
A
crosswind is the crab method. In this method, the pilot is required to yaw the aircraft into the
wind at such an angle that the flight path remains aligned with the centerline of the runway, as
seen in Figure 36. However, to ensure the pilot will have adequate control to prevent the continual
drifting and handle crosswind landings, special considerations must be taken with regards to the
vertical tail size.
Figure 36: Crosswind Landing
In order to maintain a steady heading into the wind, the moment generated by the
crosswinds must be opposed by a moment of equal magnitude generated by the deflection of the
rudders on the vertical tail. The force each vertical tail can generate is a function of its coefficient
of lift, its distance from the center of gravity, and its planform area. If everything other than the
planform area is considered fixed, the resulting vertical tail area is the minimum size the vertical
tail must be to adequately perform under crosswind conditions.
One Engine Inoperative
In addition to crosswinds, the one engine inoperative case can potentially place large
constraints on an aircraft’s minimum vertical tail size. The one engine inoperative case is
characterized by the loss of one engine during flight which results in asymmetrical thrust. This
asymmetrical thrust generates a yawing moment that must be balanced by an opposing force
created by deflecting the rudders on the vertical tail, as seen in Figure 37.
50
Figure 37: One Engine Inoperable
Much like the calculations for crosswinds, the necessary force each vertical tail needs to
generate an equal opposing moment will determine the minimum area needed for the vertical
tails. Having sufficient vertical tail area will allow the aircraft to maintain a constant heading
angle with only one engine operable.
For this aircraft specifically, the one engine inoperable condition is less constraining than
the crosswinds condition with respect to vertical tail sizing. The primary reason that the one
engine out condition is less constraining is because the engines are mounted directly onto the
fuselage near the centerline of the aircraft. Therefore, when one of the engine stops generating
thrust, the resulting moment from the operable engine is still relatively small due to its small
moment arm. With a smaller moment, a smaller amount of force from each vertical tail is
required, and ultimately smaller vertical tails are needed. By using the vertical tail size as
determined by the crosswind condition, the airplane will be designed to withstand both adverse
flight conditions.
Horizontal Stabilizer Sizing
In the specific case of the canard design, the canard is the horizontal stabilizing
surface. An equation from Raymer, shown below, was used as a preliminary sizing
condition since the horizontal stabilizer was also a lifting canard and thus required a
larger surface to provide lift.8 The final size was calculated by multiple iterations through
the sizing code to find an ideal surface area.
51
• CHT-Tail Volume Coefficient (1.00 for Jet Transport)
• LHT-moment arm (quarter chord of wing to quarter chord of tail)
• SHT-surface area of horizontal tail
• C-main wing chord
• Sw-surface area of the main wing
Control Surface Sizing
The aileron, rudder and elevator control surfaces were sized based on historical
data provided in Raymer. This data is presented in Figure 38, and Table 12, shown
below.8 By initially calculating the surface size of the wing, horizontal stabilizer, and
vertical stabilizers, the ailerons, elevators, and rudders could be sized respectively.
Figure 38: Raymer Figure Number 6.3
52
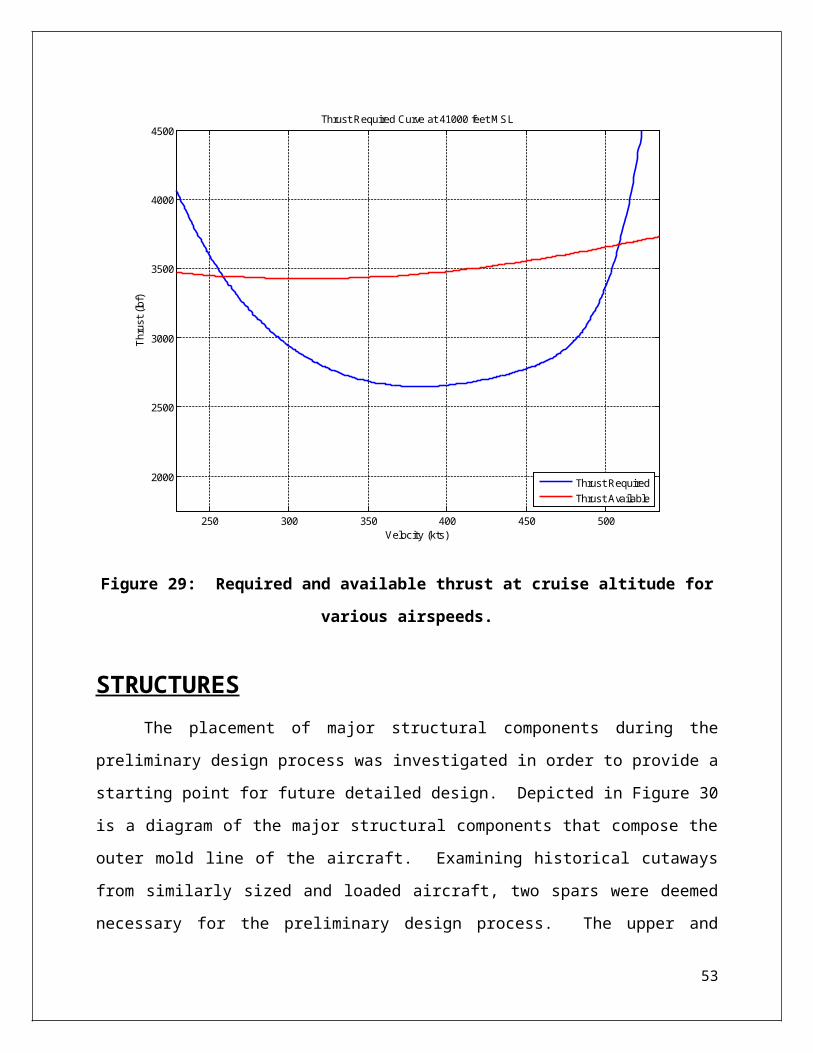
Table 12: Raymer Table Number 6.5
Static Margin
Finally, it was important to predict the stability of the aircraft by determining its
static margin. This calculation required two values, the location of the center of gravity
and the location of the aerodynamic center. The center of gravity was calculated using
the weights and locations of each major piece of the aircraft. The aerodynamic center
was less straightforward. For conventional configurations, the aerodynamic center can
usually be approximated at the quarter chord with acceptable accuracy. For an aircraft
with a lifting canard, the aerodynamic center will undoubtedly shift forward. Since no in-
depth aerodynamic evaluation could be performed, it was assumed that the aerodynamic
center of the canard configuration moved from the quarter chord of the main wing to the
leading edge of the main wing. With this assumption, the center of gravity was
calculated and the static margin was found to be 9.54% of the main wing chord.
Research shows that many transport aircraft have a static margin of 5-10%. Therefore
our predicted static margin value of 9.54% was within the normal range. It was also
noticed that the center of gravity and static margin varied widely with small changes in
the location of the engines. This indicates that a more thorough analysis of engine
placement would be required during the preliminary design phase, in order to ensure
acceptable stability characteristics.
53
NOISE 1 One of the main N+2 goals is to significantly reduce noise. Because of that,
Team 2 predicted the noise of our aircraft using methods and equations commonly used
in acoustic engineering. In order to carry out simple noise estimation, a few assumptions
were necessary. First, it was assumed that the primary noise source for the aircraft was
the engine, and that the engine noise came from the fan and the jet exhaust. Additional
information about the engine needed to be approximated, such as the volumetric flow rate
through the core, the exhaust temperature, and the exhaust velocity. All necessary
quantities were approximated based on research of similar engines and on simple cycle
analysis results. After establishing these assumptions and approximations, the following
procedure was used to predict the noise of the aircraft.
Step 1 – Establish the power of each noise source
In this step, the power of both the engine fan and exhaust jet were calculated. The
jet sound power can be calculated using the equation listed below.
P jet=ε M 5 ρoV 3 A
2[Watts ]
In the above equation, ε is radiation efficiency, A is nozzle area, ρo is density of
ambient air, M is Mach number, and V is flow velocity. Since the radiation efficiency is
difficult to predict or approximate, an approximation for the entire term εM5 can be found
from Figure 39 below.
1 Unless explicitly stated otherwise with an exponent reference number, every equation, chart, graph, and table listed in the Noise section comes from reference number 10.
54
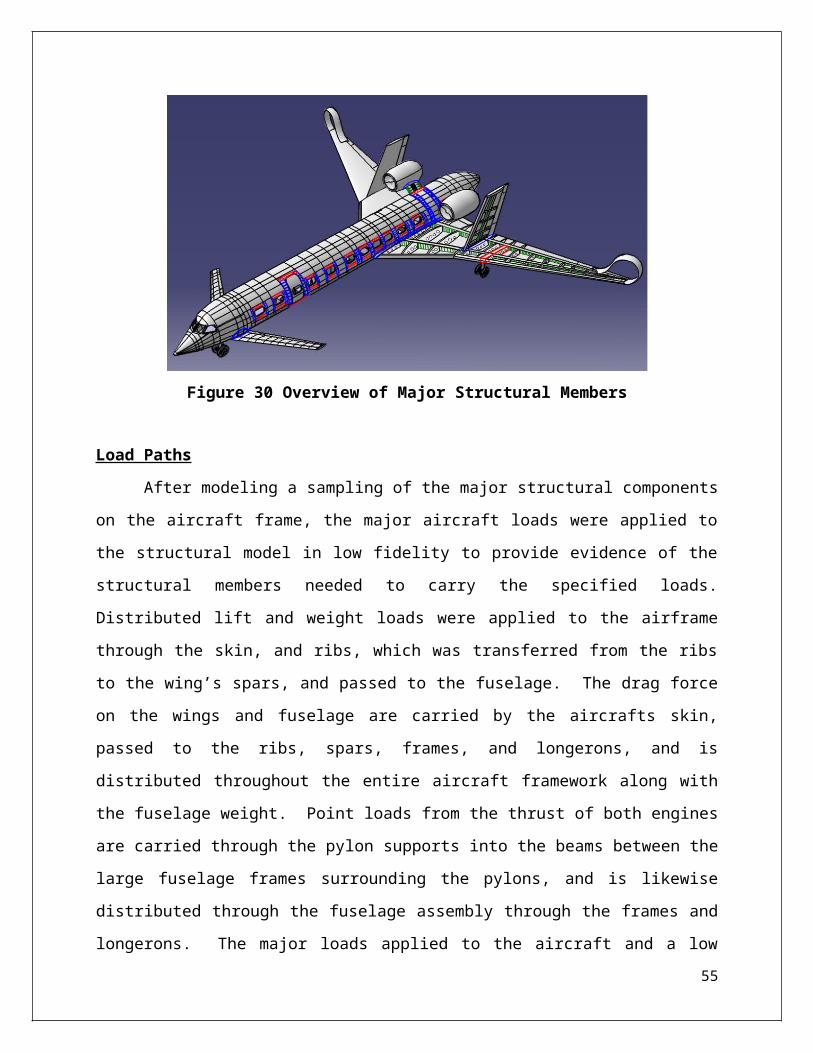
Figure 39: Radiation Efficiency Factor vs. Mach Number
Obtaining the sound power of the fan is not necessary, as the noise estimation
process for fans starts with the sound power level rather than just the sound power.
Step 2 – Obtain the sound power level of each source
For the jet, the power value calculated in step one can be converted to a sound
power level with the following equation. This equation uses the standard acoustic
reference power level of 1x10-12 watts and accounts for the difference in temperature
between the ambient air, Ta, and the exhaust temperature, T.
Lw=SPL=10 log(P jet
10−12 )+20 log( TT a
)[dB]
The sound power level of the fan can be predicted with a slightly more
complicated scheme. First, the type of fan must be selected and the corresponding octave
band sound power levels must be selected from Table 13 listed below.
55
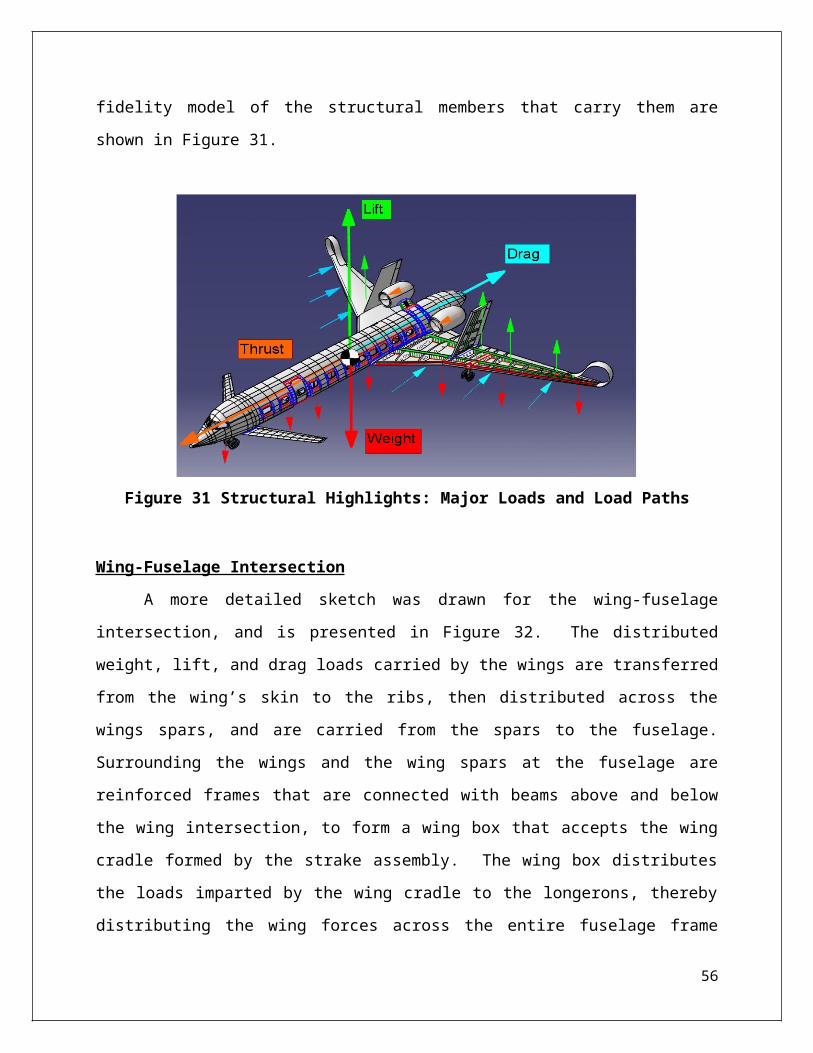
Table 13: Band Sound Power for Varied Fan Types
A correction factor must then be calculated and added to all values taken from the
above table. The correction factor, Δ, can be calculated according to the equation below,
where Q is volumetric flow rate in cubic meters per second and p is the total pressure in
kPa.
∆=10 log Q+20 log p [dB]
Notice that the last column of Table 13 is titled “BFI,” which stands for Blade
Frequency Increment. This value is measured in decibels and must be added to the
octave band level in which the frequency of the rotating blades lies. So after pulling the
appropriate data from the table, then adding the correction factor to all octave bands
based on volumetric flow rate and pressure, step three in this process is to add the BFI
56
value to the single octave band that contains the rotating blade frequency. This frequency
can be calculated according to the following equation, where n is fan speed in revolutions
per minute and N is the number of blades.
f =nN60
[Hz ]
The values obtained by summing steps one to three are the total sound power of
the fan. In order to obtain the sound power level radiated from the inlet or outlet, the
final step in the process is to subtract 3 dB. After completing all four steps, the radiated
sound power level of the fan is found for each octave band. The individual octave bands
can be summed into a single sound power level according to the following equation.
LW , fan=SWL fan=10 log(Σ10Loctave /10)
Step 3 – Calculate the sound pressure level from the sound power level and distance from source
With the sound power levels of the fan and the jet known, the sound pressure
level can be calculated based on the distance from the source. This calculation also
assumed spherical wave propagation and includes the reflected wave from the ground
since the noise sensors would likely be placed near the ground. The step also includes an
estimation of the aircraft’s altitude 6000m after takeoff and 2000m prior to landing.
These values were estimated using the sizing code and standard approach requirements.
With all of the necessary information acquired, the sound pressure level for the fan was
calculated with the following equation where r is the distance from the source, and will
vary depending on the three standard measurement locations.
Lp , fan=SPLfan=Lw ,fan−20 logr−10 log 4 π+3[dB ]
Additionally, the factor of 4π is a result of the spherical wave propagation assumption, and the
+3 dB correction accounts for the reflected wave.
The equation for the exhaust jet is similar but includes another factor called the
directivity index, which predicts a difference in sound pressure level based on the sensor’s
57
angular position to the exhaust jet. The sound pressure level of the jet can be calculated from the
equation below, and the directivity index, DI, can be found from Figure 40.
Lp , jet=SPL jet=Lw , jet+DI−20 log r−10 log 4 π+3 [dB]
Figure 40: Sound Directivity Index vs. Angle from Jet Axis
Step 4 – Apply A-weighted noise correction
With the sound pressure level of each source known, the decibel values must be
adjusted to better represent the response of the human ear. A-weighted adjustments were
used, which require that the dominant frequency be known. The fan frequency has
already been calculated, and the jet frequency can found according to the following
equation where α is the Strouhal number and assumed to be 0.15, V is the velocity, and D
is the jet diameter.
f =αVD
[ Hz]
58
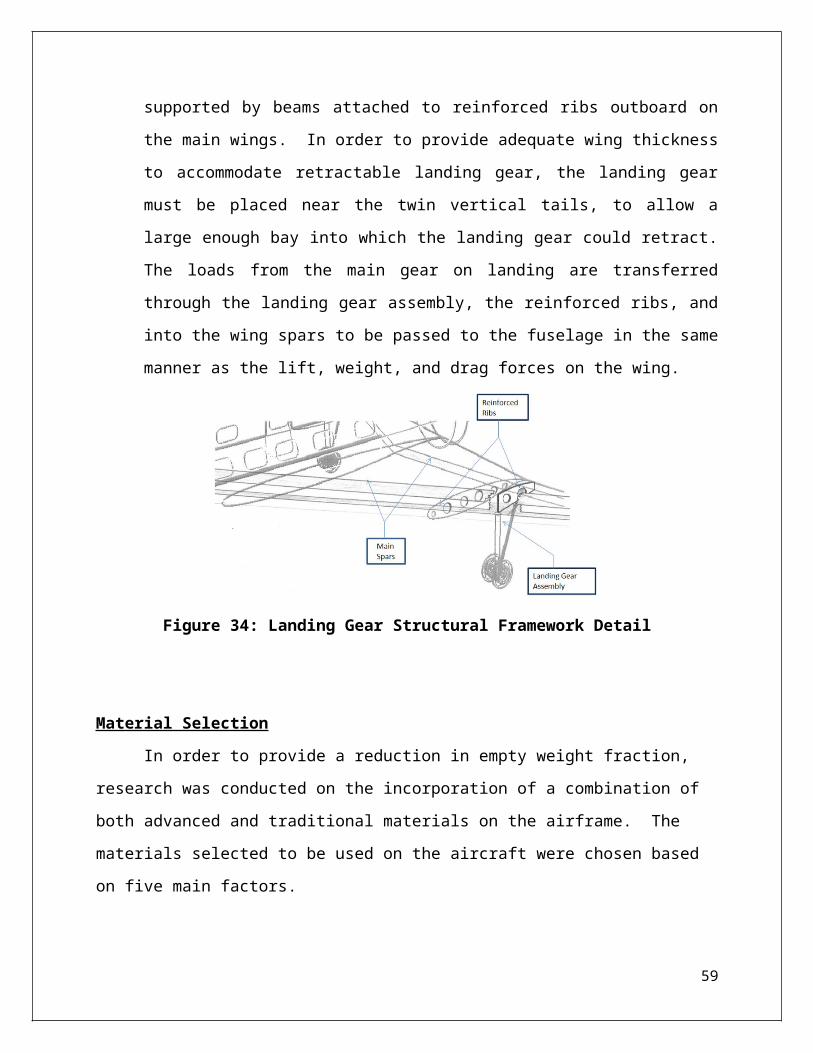
A-weighted adjustments can be made with the standard acoustic engineering
adjustments provided in Table 14.
Table 14: Standard Acoustic Engineering Adjustments
Step 5 – Calculate loudness measurement
Using a plot of equal loudness contours, the loudness of each source can be found
based on its sound pressure level in decibels and dominant frequency in hertz.11 This is
done quite simply by using the plot shown in Figure 41, with the decibel level along the
Y-axis and the frequency along the X-axis, to find the loudness in Noy of each source
from the approximate location between loudness curves.
59
Figure 41: Band Sound Pressure vs. Frequency
It is at this step in the process that the two sources, fan and jet, can be
arithmetically summed to obtain a single numerical value representing the engine as a
whole. Loudness values in Noy can be accurately summed to combine sources.
Step 6 – Convert loudness values to Effective Perceived Noise Level
Finally, with the engine noise represented as a single loudness value measured in
Noy, the Effective Perceived Noise Level (EPNL) can be found according to the
following equation.12
EPNL=33.3 log(Noy)+40+10 log( t20 )+F
60
Here, Noy is simply the loudness value found in the previous step, t is the time in seconds at
which the sensor is exposed to the noise source within 10 dB of its maximum sound pressure
level, and F is a correction factor for pure tones, which is typically found to be +3 dB. The peak
noise level of an aircraft flyby usually occurs over a very small time interval, so t used in
calculation can be approximated by any value between 1 and 20 seconds. In this specific case,
20 seconds was used in order to maximize the predicted sound level and obtain a conservative
estimate.
Following the process outlined above, the noise of each engine considered was
found. The results of this analysis are provided in Table 15, which shows the EPNL
noise estimation of the geared turbofan and unducted fan. From this comparison, it is
clear that the geared turbofan is considerably quieter than the unducted fan. This was one
of the primary reasons why the geared turbofan was selected over the unducted fan.
Table 15: Engine Noise for Various Measurement Locations
Geared
Turbofan
(EPNL dB)
Unducted
Fan
(EPNL
dB)
Sideline 97 102
Takeoff 90 95
Approac
h
97 100
It is important to note that the above table lists the EPNL decibel levels for the
uninstalled engine. This does not include the sound shielding devices used on our aircraft
of the outboard vertical tails and low wing. Because of this, it was important to predict
the noise of the installed engines. This was done by following the procedure outlined
above, but subtracting 15 dB from the sound pressure levels calculated in step three. The
subtraction of 15 dB was chosen because in acoustic engineering, the noise control
61
method of placing a barrier between the source and the sensor can be approximated by a
drop in the sound pressure level of 10 to 20 dB. The exact value would depend on the
material of the barrier, the size of the barrier, and the distance from the source. The
median value of 15 dB was chosen, and applying this correction yielded the installed
noise estimation of the aircraft presented in
below.
Table 16: Corrected Airplane Noise Estimate
Airplane
Noise (EPNL
dB)
Sideline 87
Takeoff 80
Approac
h87
Total 254
COST PREDICTIONAcquisition Cost
The cost estimating relationships that were employed to predict the development,
manufacturing, and certification costs of this system were part of the Development and
Procurement Costs of Aircraft model (DAPCA IV). This model was developed by the RAND
Corporation for a variety of aircraft types, and is discussed in Daniel Raymer’s Aircraft Design:
A Conceptual Approach.8 The model consists of a series of relationships that were determined
from a statistical analysis of previous program costs. The DAPCA IV model predicts the
aircraft’s research, development, testing, and evaluation costs (RDT&E); as well as the
“flyaway” cost, which includes airframe production, and the integration of engines and avionics.
The costs output by the model were in constant 1999 dollars, and were converted to 2009 dollars
using the U.S. consumer price index. To apply the relationships in the DAPCA IV model, seven
62
aircraft specification inputs were required: empty weight, maximum velocity, production
quantity, number of flight test aircraft, total number of engines needed for fleet, the cost of each
engine, and the cost of avionics. The model uses these inputs to predict the number of labor
hours required for engineering, tooling, manufacturing, and quality control; and the direct costs
associated with development support, flight test, and manufacturing materials. From these
predicted values, the total cost of developing and producing the aircraft was estimated by taking
into account the costs of labor.
The values used as the inputs for the cost model were determined using the team’s design
specifications, data from previous development programs, and market forecasts. The aircraft’s
empty weight (38,100 lbs.) and required number of engines (2) were readily available details of
the team’s concept. The maximum velocity was approximated as 527 knots based on values from
similar aircraft. In addition, since the number of flight test aircraft typically used in past
programs ranged from two to six, three was chosen as a conservative number for a small volume
production run.8 The cost of avionics was estimated by assuming a price of approximately
$3,000/lb and using the estimated weight of the avionics on board (471 lbs); the cost per pound
was based on typical values supplied in Raymer.8 The number of aircraft to be produced was
estimated using the business aircraft market forecast supplied by Honeywell.2 This forecast
predicted a relatively stable demand for ultra-long range (ULR) business jets with moderate
growth in the high-speed ULR segment. With these market conditions in mind, the production
runs of the Gulfstream G550 and Bombardier Global Express family were studied since these
aircraft were within the same category and had been in production for more than 5 years. These
production runs were in the neighborhood of 180 to 250 airframes. Therefore, it was decided to
use 150 airframes as a conservative value for cost estimation. This value accounted for the
projected stability of the market, as well as the impact of being a new entrant.
The cost of each engine was approximated using a separate cost estimating
relationship (CER) originally developed for turbojet engines.8 This CER approximated
the production cost of an engine from its maximum thrust, maximum operating Mach,
and turbine inlet temperature. The maximum thrust used was the value that had been
determined by the team’s design (11,900 lbs). The maximum operating Mach for the
engine was approximated as Mach 0.95, and the turbine inlet temperature was
approximated as 2600⁰ Rankine; which was based on typical values for modern
63
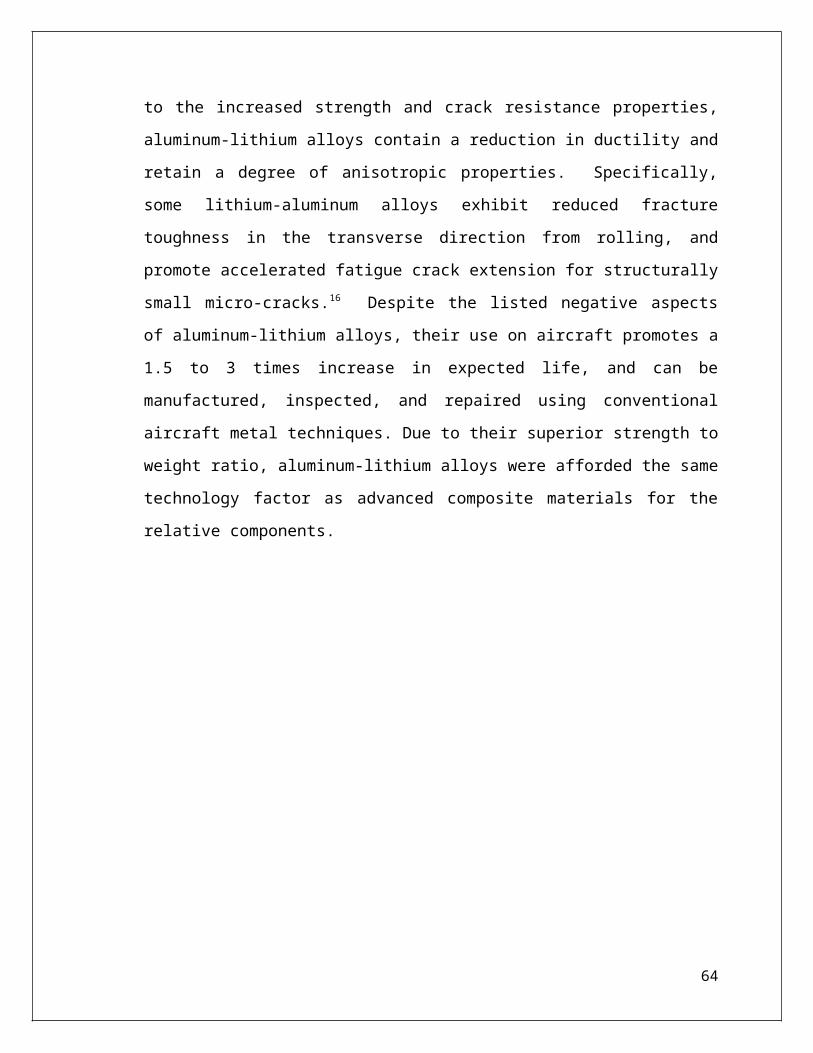
turbofans. In addition, a correction factor of 1.2 was used to compensate for the increased
cost of production of a Geared Turbofan (GTF) relative to a turbojet. This resulted in an
estimated engine production cost of $3.6 million per engine (2009 dollars).
Using all of these specifications, numbers, and costs as inputs for the model, the
result was an estimated purchase price of $49.7 million per aircraft with a total program
cost of $6.71 billion (2009 dollars). Aside from summing all of the costs included in the
model, an investment cost factor of 1.1 was also used to account for the cost of money
and the team’s profit.8 The projected price of the design was compared with comparable
aircraft currently on the market, and appeared to be a reasonable estimate. The
Gulfstream G550 and Bombardier Global Express XRS had new list of prices of $49
million and $48 million, respectively.6
Operating Costs
After an approximate purchase price had been determined, the operating cost of
the aircraft was estimated. The cost of operating the aircraft was broken down into fuel
costs, crew salaries, maintenance labor, maintenance materials, insurance, and
depreciation. Each of these costs were estimated separately and then used to determine an
overall cost per flight hour.
Fuel costs were estimated from the aircraft’s expected fuel flow and utilization.
An approximate fuel flow of 2,300 pounds per hour was determined using the aircraft’s
design mission, predicted fuel weight, and a correction factor for off-design performance.
The utilization of the aircraft was then approximated as being 500 flight hours per year
with 200 cycles. This was the lower bound of the range of flight hours provided in
Raymer, and was thus expected to yield conservative hourly cost figures.8 In addition, the
number of cycles used implied an average flight duration of 2.5 hours, since the typical
operating mission of the aircraft was expected to be domestic. Next, the price of jet fuel
was considered. After reviewing the current price of Jet A at numerous airports, a price of
$4.50 per gallon was chosen for the purposes of cost estimation. The resulting yearly fuel
cost was $755,000, assuming 500 flight hours per year, or $1,510 hourly.
Crew salaries were approximated from a cost estimating relationship developed
using data from Boeing.1 This relationship estimated crew cost per block hour for a three
64
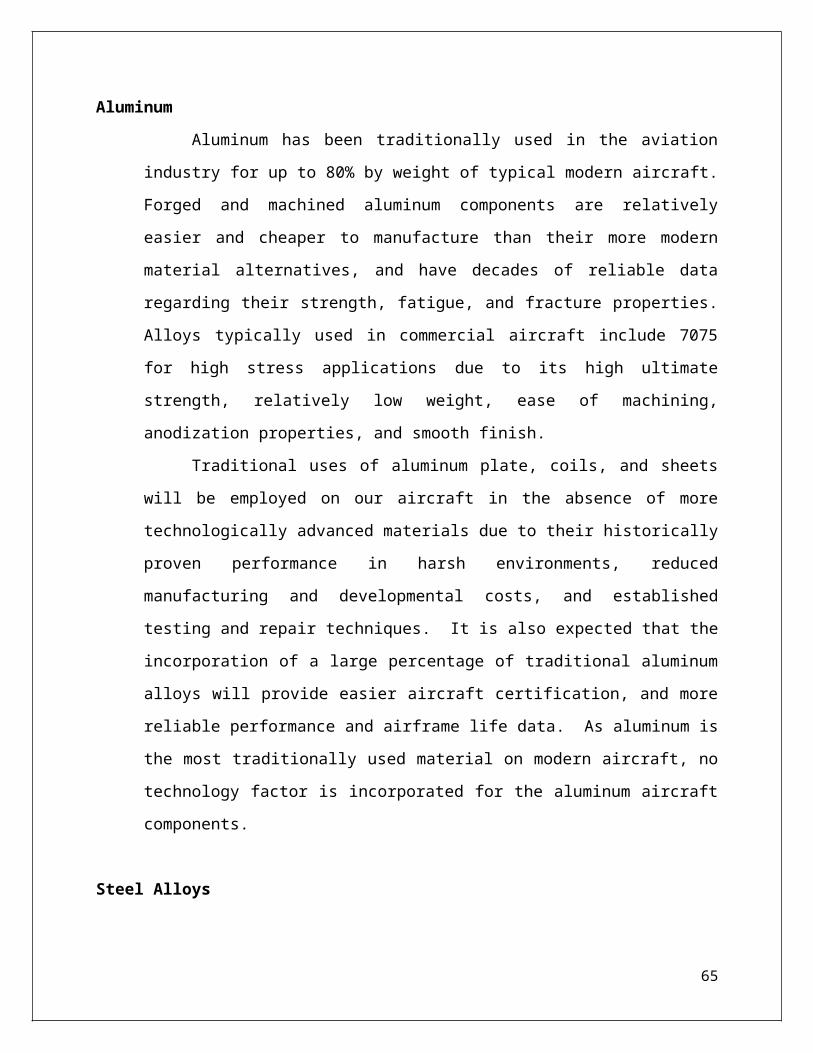
person crew in 1999 dollars. The annual number of block hours for the aircraft was
determined by assuming that an additional 20 minutes would be spent on each flight
taxiing and complying with air traffic control procedures. The crew cost per block hour
was then estimated from the appropriate CER, which took into account the aircraft’s
cruise velocity (487 knots at altitude) and gross takeoff weight (71,300 lbs). The resulting
crew cost was $537 per block hour, or $268,000 a year (2009 dollars).
Maintenance expenses were estimated using the expected maintenance
requirements of the aircraft, the cost of labor, and CERs. All maintenance to be
performed on the aircraft was included in an average figure of Maintenance Man hours
per Flight Hour (MMH/FH). An MMH/FH of 3 was assumed for this design, which was
in the range considered typical for a business jet.8 The number of maintenance man hours
per year was then estimated from the MMH/FH and the expected number of flight hours
(500). The cost of a maintenance man hour was then assumed to be approximately equal
to the hourly manufacturing wrap rate. This resulted in an estimated maintenance labor
cost of $282 per flight hour. The cost of maintenance materials was then estimated using
CERs for civilian aircraft provided in Raymer from RAND.8 These CERs predicted the
material cost per flight hour and per cycle using the estimated cost of the airframe, the
cost of the engines, and the number of engines on each aircraft. The result was an
estimated maintenance materials cost of $619 per flight hour.
Depreciation and insurance costs for the design were estimated from data
gathered on similar aircraft models. Depreciation was approximated as a linear schedule.
After reviewing the asking prices of numerous ULR business jets on the used market, a
depreciation rate of 10% per year was selected. This rate would be close to the amount
expected within the first 5 years of ownership, but would be considered a fairly
aggressive estimate after that. Insurance was estimated assuming that the aircraft would
be insured for its full hull value, at a rate of 0.32 percent. This rate was taken from a cost
evaluation of the Gulfstream G550 performed by Conklin & de Decker.9
Adding together the estimated costs of fuel, crew, maintenance, insurance, and
depreciation, an operating cost of $8,500 per flight hour was calculated (2009 dollars).
Without depreciation, the predicted cost was $3,400 per flight hour. For comparison, a
detailed cost analysis of a Gulfstream G550 performed by Conklin & de Decker predicted
65
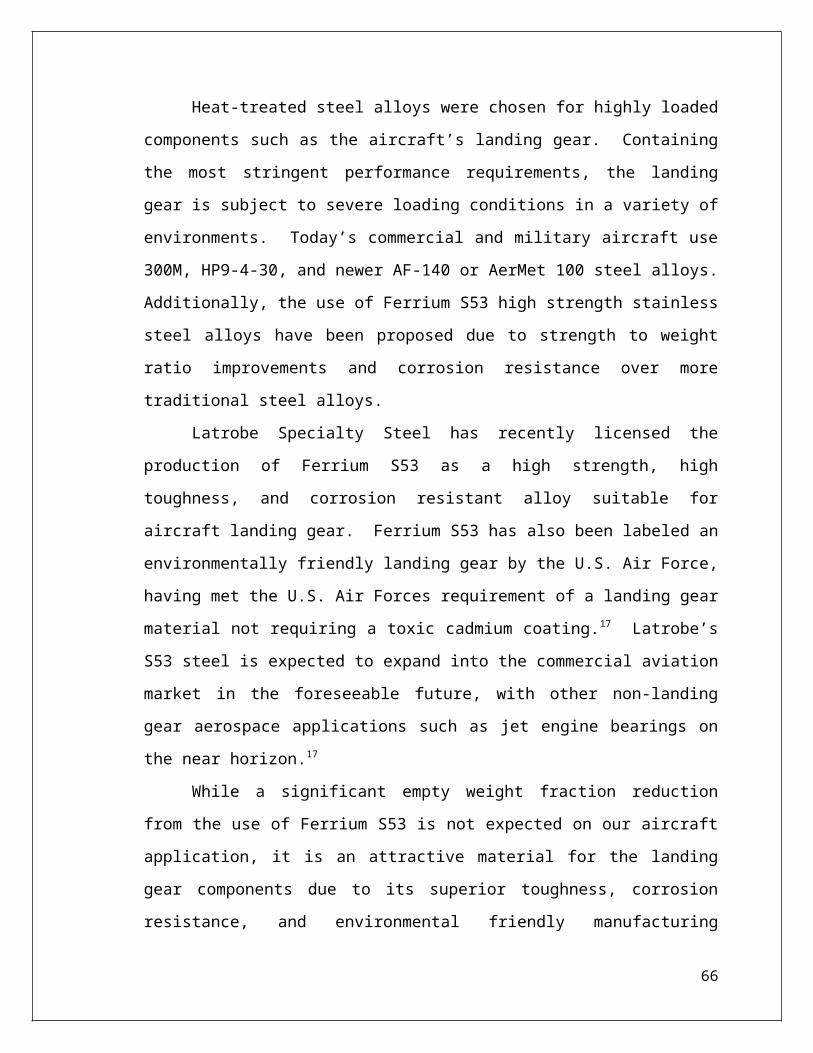
a total cost of $5,500 per flight hour excluding depreciation, with an assumed utilization
of 400 hours per year.9 Although this is significantly more expensive, the estimates for
the G550 used an average fuel burn of 3,300 pounds per hour; which is significantly
higher than the fuel burn projected for this team’s concept. In addition, the cost analysis
completed here ignored the impact of hangar rent, landing fees, catering, and crew
training on operating costs.
66
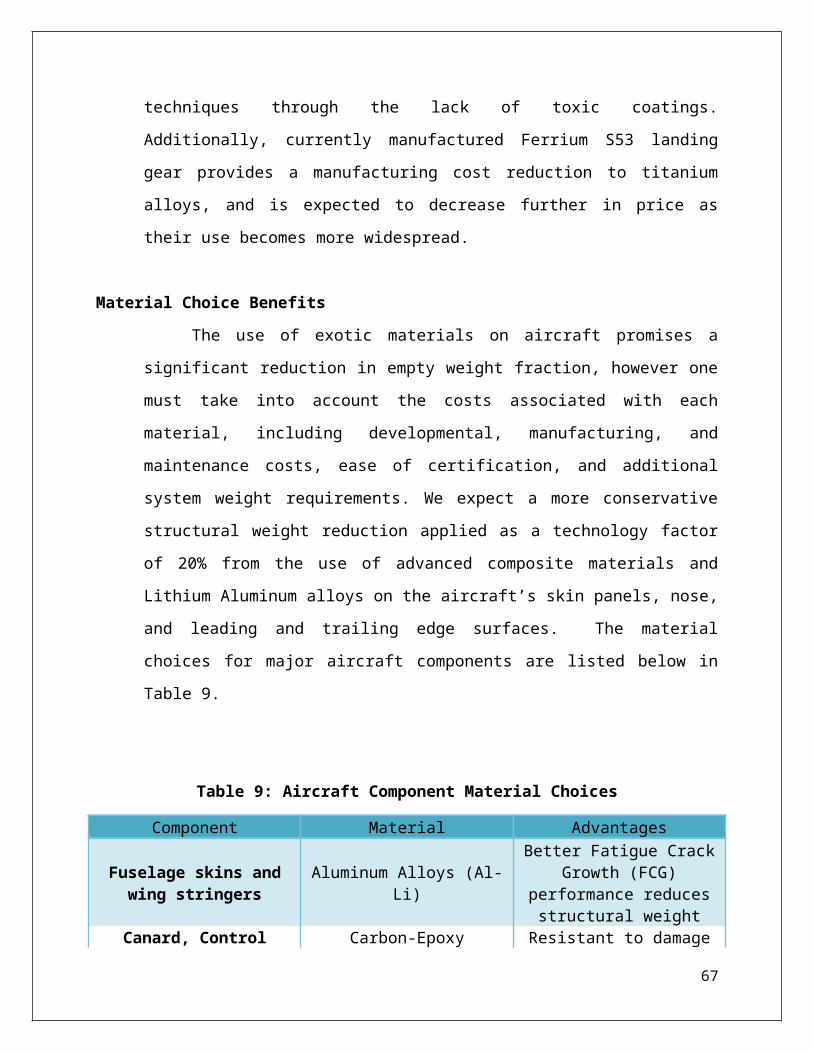
SUMMARYThe final concept of our designed aircraft can be seen in Figure 42. The concept is
a high speed, long range aircraft which is also environmentally friendly. The aircraft has
lifting canards, two vertical tails, geared turbo fan engines and spiroid wingtips.
Figure 42: Final Concept Design
The requirement compliance matrix associated with the aircraft is shown in Table
17, and was used to verify that all the requirements of our customers were met.
Table 17: Requirements Compliance Matrix
Performance Characteristics Target Threshold Current
67
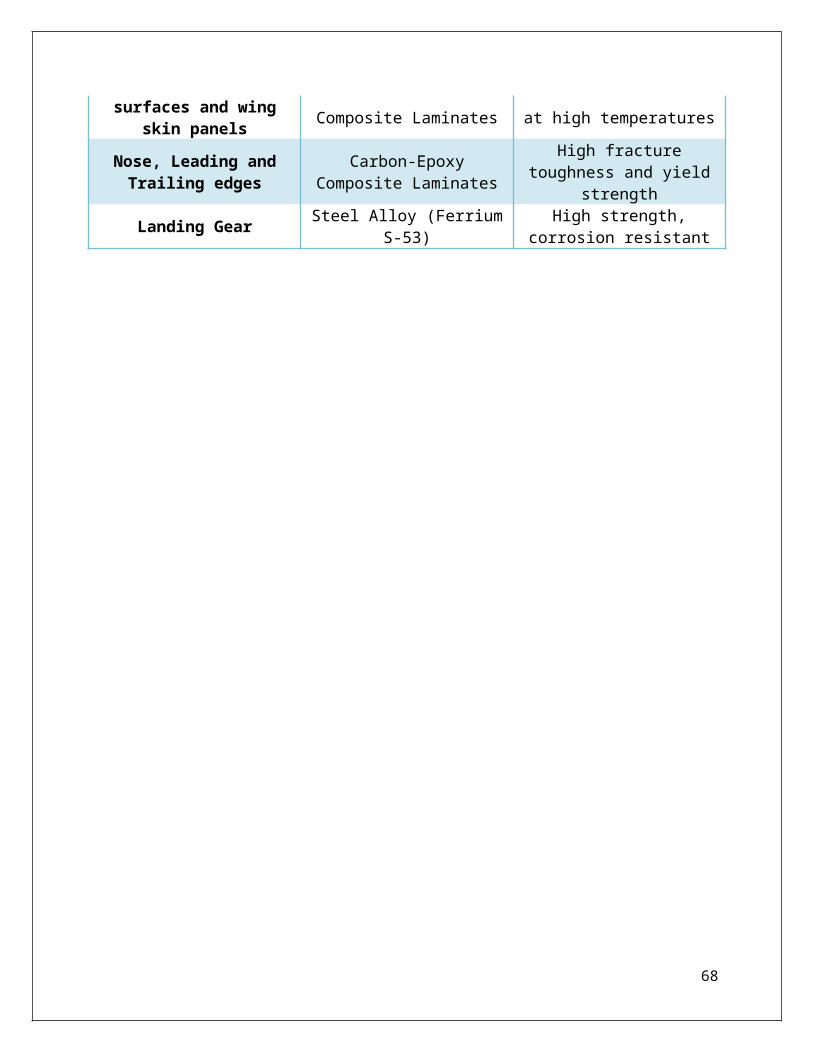
Still Air Range 7100 nm 6960 nm 7100 nm
MTOW Takeoff Ground Roll 4000 ft 5000 ft 3900 ft
Max. Passengers 16 8 16
Volume per Passenger per Hour (Design)
13.3 ft3/(pax⋅hr)
2.28 ft3/(pax⋅hr) 20.7 ft3/(pax⋅hr)
Cruise Mach 0.85 0.8 0.85
Initial Cruise Altitude 41000 ft 40000 ft 41000 ft
Cumulative Certification Noise Limits
274 dB 274 dB 254 dB
Cruise Specific Range 0.3 nm/lb 0.26 nm/lb 0.31 nm/lb
Loading Door Sill Height 4 ft 5 ft 5 ft
Operating Cost $4100/hr $4300/hr $3400/hr
Based on Table 17, the majority of the requirements in the requirement compliance
matrix were met with the only one requirement not meeting the target value, which was the
loading door sill height. However, for this height, the target value of 5 feet was met.
In addition to the above requirements, it was also important to our team to meet
the NASA N+2 goals if possible. As seen in the table below, none of the NASA N+2
goals were completely met. The NASA N+2 goals were difficult to meet due to their
overly ambitious targets. In order to meet these goals, more development would be
needed for engine performance, aerodynamic design, and materials used.
Table 18: Compliance with NASA N+2 Goals
Criteria Goal Our Aircraft Achieved
68
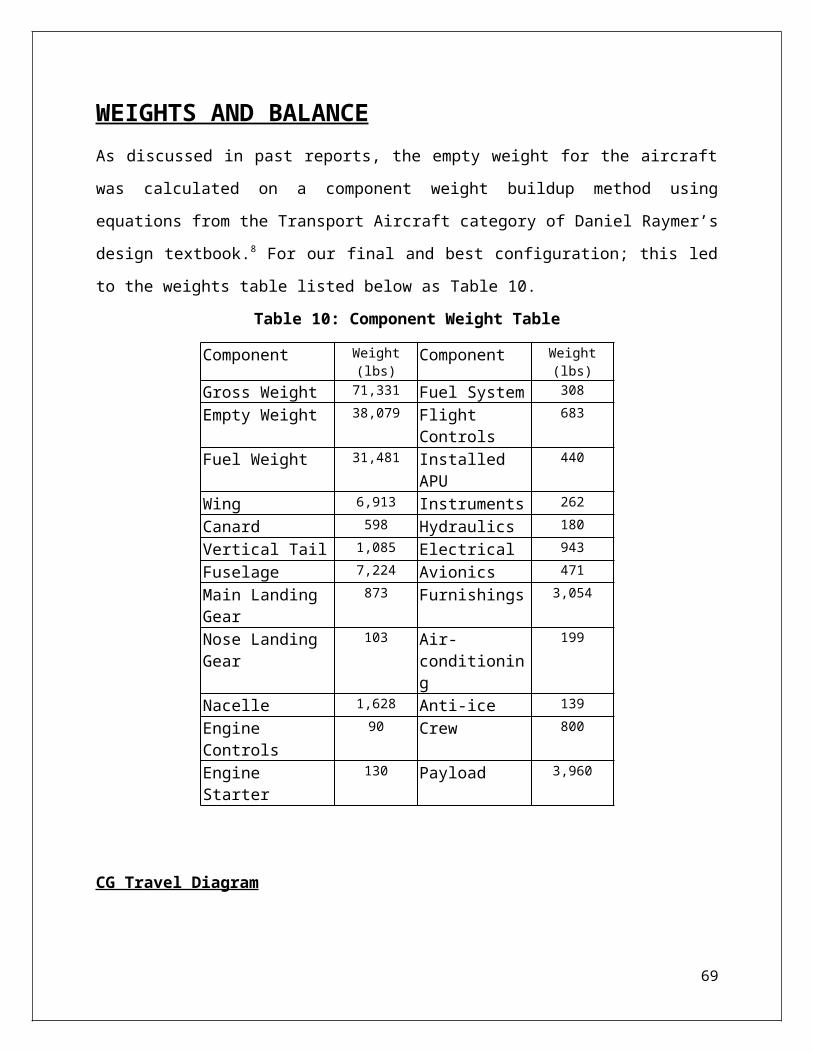
Noise -42 dB below Stage 4 -20 dB No
Emissions -75% -50% No
Fuel Burn -40% -25% No
Takeoff Field Length -50% -33% No
Further work would be required to develop the maturity of this concept to a level that is
acceptable for the preliminary design phase. This work would include more detailed
aerodynamic and structural analyses, and a more thorough approach to predicting engine
performance. The aerodynamic analysis that was performed for our aircraft was predominantly
conceptual and theoretical, and more experimental data would be helpful. More in depth detail
for a final design would be needed, using tools such as computational fluid dynamics tools, and
wind tunnel testing. The engine performance could also be more detailed through further analysis
and a more accurate engine deck could be built. Further analysis on the structural design, its
load paths, and the materials used needs to be incorporated. Sizing of the spars and ribs along
with fatigue and temperature analyses would need to be done using finite element modeling to
evaluate the stresses and strain present in the aircraft. With this additional work, the initial
design phase could be completed.
69
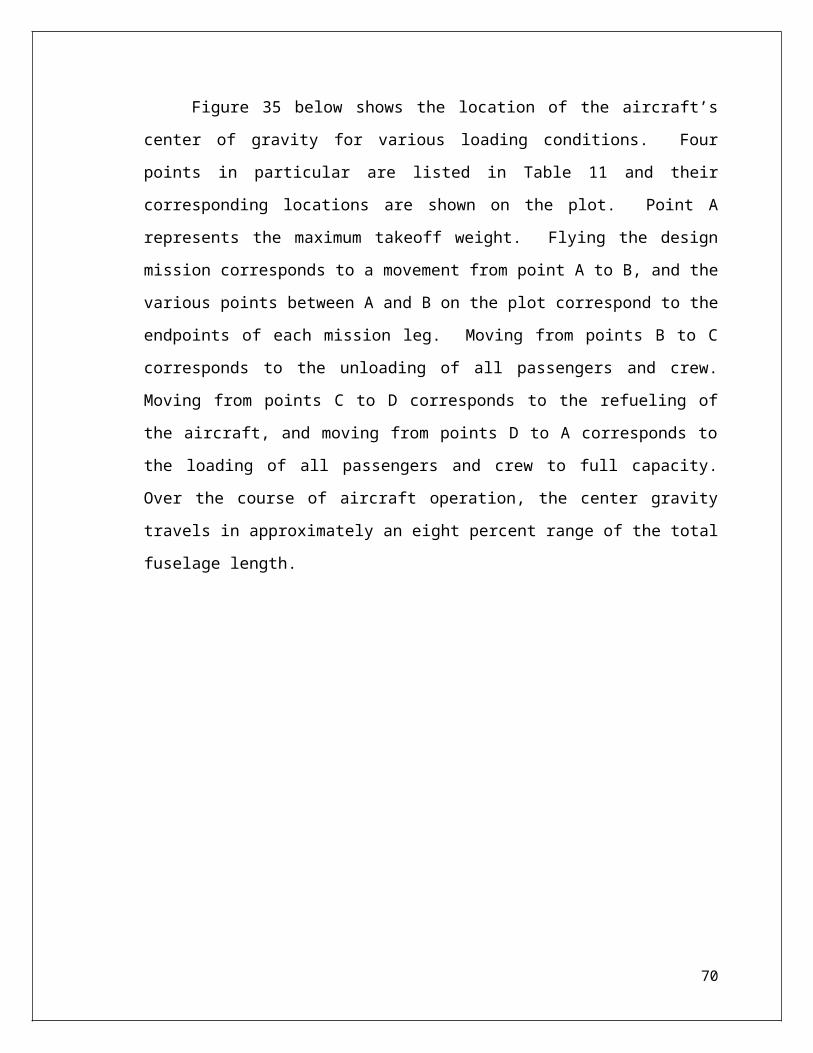
REFERENCES1 "Avionics Magazine :: Outlook: High Hopes for General Aviation." Breaking News and Analysis on
Aviation Today. Web. 11 Feb. 2010. <http://www.avtoday.com/av/categories/bga/Outlook-High-
Hopes-for-General-Aviation_12515.html>.
2 "Honeywell Aerospace Business Aviation Outlook Forecasts $200 Billion inGlobal Business Jet Sales
Through 2019." Web. 11 Feb. 2010. <http://www51.honeywell.com/honeywell/news-events/press-
releases-details/10.18.09NBAAForecast.html>.
3Torenbeek, Egbert. Synthesis of subsonic airplane design an introduction to the preliminary design, of
subsonic general aviation and transport aircraft, with emphasis on layout, aerodynamic design,
propulsion, and performance. Delft: Delft UP, Nijhoff, Sold and distributed in the U.S. and Canada
by Kluwer Boston, 1982. Print.
4Great Circle Mapper. Web. 11 Feb. 2010. <http://www.gcmap.com>.
5“Subsonic Fixed Wing Project”. NASA. 08 February 2010.
http://www.aeronautics.nasa.gov/fap/sfw_project.html
6Jane's All The World's Aircraft. Web. 11 Feb. 2010. <http://jawa.janes.com/public/jawa/index.shtml>.
7 Norris, Guy. “Rotor Revival”. Aviation Week & Space Technology. 14 December 2009. pages 54-57.
8 Raymer, Daniel P. Aircraft Design A Conceptual Approach (Aiaa Education Series). New York: AIAA
American Institute of Aeronautics & Ast, 2006. Print.
9 Conklin & de Decker, “The Aircraft Cost Evaluator: Gulfstream G550.” Conklin & de Decker Aviation
Information, Fall 2005.
10 Raichel, Daniel R. The Science and Applications of Acoustics. New York: Springer, 2000.
Print.
11 "Effective_Perceived_Noise_Level." SFU.ca. Web. 15 Apr. 2010. <http://www.sfu.ca/sonic-
studio/handbook/Effective_Perceived_Noise_.html>.
70
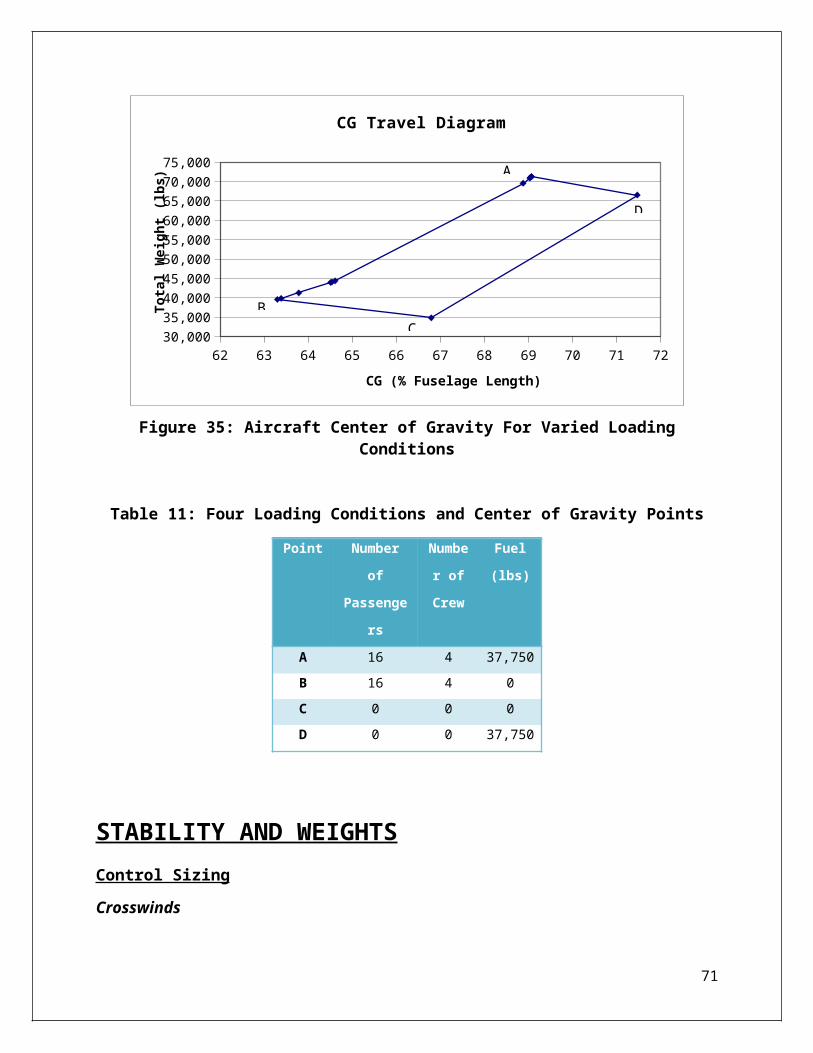
12 "Perceived_Noise_Level." SFU.ca. Web. 15 Apr. 2010.
<http://www.sfu.ca/sonic-studio/handbook/Perceived_Noise_Level.html>.
13“Airfoil Investigation Database” Airfoils. 30 Jan 2010. <http://www.worldofkrauss.com/about>
14Goodson, Kenneth W., “Low Speed Aerodynamic Characteristics of Rectangular Slotted
Supercritical Airfoil Having Several High Lift Flap Systems” NASA Technical Memorandum,
Langley Research Center, August 1971
15Sun, C.T., Mechanics of Composite Materials and Laminates, School of Aeronautics and
Astronautics, Purdue University, West Lafayette, Indiana, 2001
16 “Cast Nonferrous: Aluminum-Lithium Alloys” – Key to Metals
<www.keytometls.com/Article58.htm>
17 “Latrobe Specialty Steel Licenses Corrosion-Resistant Landing Gear Alloy”-Red Orbit
<http://www.redorbit.com/news/business/1170562/
latrobe_specialty_steel_licenses_corrosionresistant_landing_gear_alloy/index.html>
71


![MONTGOMERY COUNTY CEMETERY INVENTORY REVISITED · Name: Carmack Family Cemetery [POSSIBLY FOUND ] Inventory ID: 258 Alternate name: Address: 2115 University Boulevard West , Silver](https://img.pdfslide.net/doc/110x75/5f62d459dd733f3309026c1d/montgomery-county-cemetery-inventory-revisited-name-carmack-family-cemetery-possibly.jpg)