Embed Size (px)
Citation preview

i
“A CRITICAL STUDY OF STUDENTS’ FINANCIAL ISSUES IN
HIGHER EDUCATION IN INDIA”
Thesis Submitted to the D. Y. Patil University,
School of Management
in partial fulfillment of the
requirements for the award of the Degree of
DOCTOR OF PHILOSOPHY
In
BUSINESS MANAGEMENT
Submitted by
Sanjivani Sonavane-Shelke
(Enrollment No. DYP-PHD-126100005)
Research Guide
Dr. R. GOPAL
DIRECTOR
D.Y. PATIL UNIVERSITY,
School of Management,
Sector 4, Plot No. 10,
CBD Belapur, Navi Mumbai – 400 614
June 2015
ii
“CRITICAL STUDY OF STUDENTS’ FINANCIAL ISSUES IN
HIGHER EDUCATION IN INDIA”

iii
DECLARATION
I hereby declare that the thesis titled “Critical study of students financial issues in Higher
education in India” submitted for the Award of Doctor of Philosophy (Ph.D) in Business
Management at D.Y. Patil University, School of Management is my original work and
the thesis has not formed the basis for the award of any degree, associate ship, fellowship
or any other similar titles.
The material borrowed from other sources are incorporated in the thesis has been duly
acknowledged.
I understand that I myself could be held responsible for plagiarism, if any declared later
on.
The research papers published based on the research conducted out of and in the course of
study are also based on the study and not borrowed from other sources.
Place: Navi Mumbai. Sanjivani Sonavane-Shelke
Date: Enrollment no: DYP-PHD-126100005

iv
CERTIFICATE
This is to certify that the thesis entitled “Critical study of students financial issues in
Higher education in India” and submitted by Sanjivani Sonavane - Shelke is a Bonafide
research work for the award of the Doctor of Philosophy in Business Management at the
D. Y. Patil University Department of Business Management in partial fulfillment of the
requirements for the award of the Degree of Doctor of Philosophy in Business
Management and that the thesis has not formed the basis for the award previously of any
degree, diploma, associate ship, fellowship or any other similar title of any University or
Institution.
Also it is certified that the thesis represents an independent work on the part of the
candidate.
Place: Navi Mumbai
Date:
Guide Head of the Department

v
ACKNOWLEDGEMENT
I raise my heart with gratefulness towards the Good Lord for the providential succour
provided towards me all through my life, especially during the three years of my
association with D.Y. Patil University for my Doctoral studies.
I am indebted to D.Y. Patil University and the School of Management for giving me this
great opportunity to have my doctoral studies under its protective wings.
I thank Dr R. Gopal; my Guide & mentor, who inspired and encouraged me to complete
my work. My heartfelt gratitude is due for his scholarly guidance, constant availability,
his unmatched human concern and wholehearted support.
I am highly indebted to him for this work of mine and the personal growth in me.
I express my thanks to my family members especially my Late Mother for source of
inspiration and continuous support in my success.
Place: Navi Mumbai Sanjivani Sonavane-Shelke
Date:

vi
Table of Contents
Chapter
No
Title Page Number
Preliminary Cover Page i
Declaration ii
Certificate iv
Acknowledgement v
Table of Contents vi
List of Figures ix
List of Tables x
List of Abbreviations xii
Executive Summary xv
1. Introduction
1
1.1. Meaning of the term Education 1
1.2 Definations 3
1.3 Nature of Education 4
1.4 Higher Education: In other words Education 8
1.5 Growth of Higher Education 12
1.6 Current Developments In Education With Particular
Reference To India 22
1.7 In Past Higher Education In India 25
1.8 Brief History of Education in India 30
1.9 Higher Education System in India 39
vii
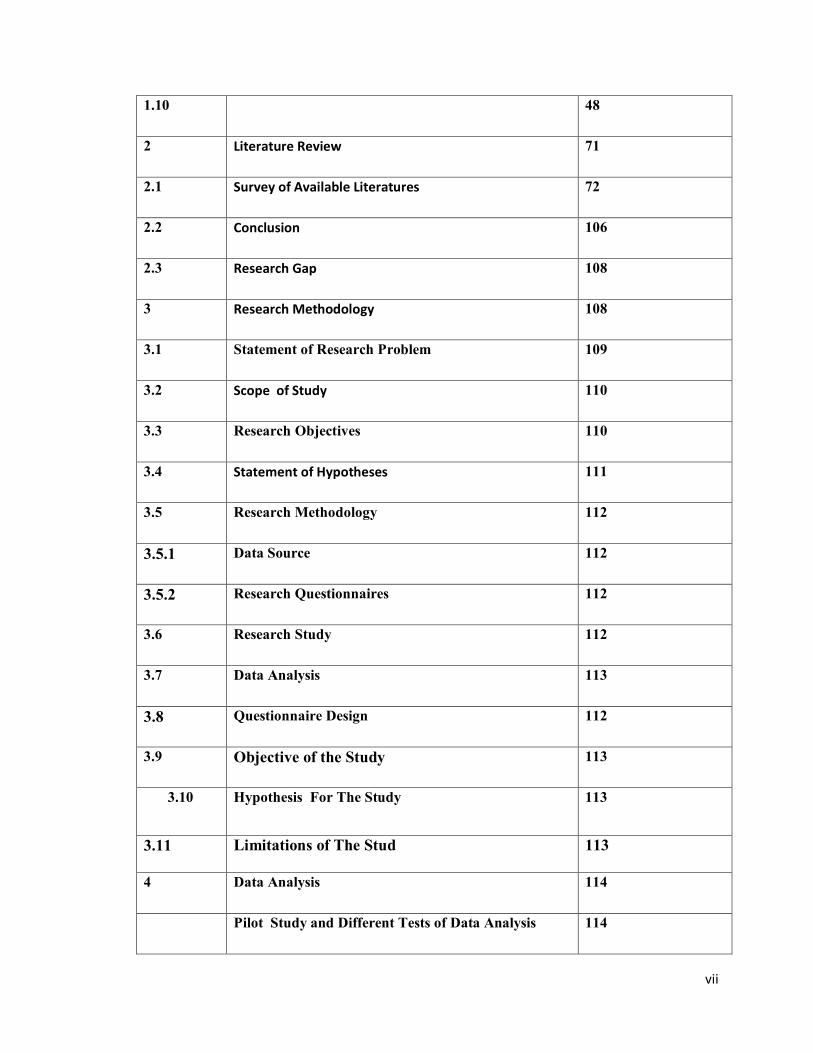
1.10 48
2 Literature Review 71
2.1 Survey of Available Literatures 72
2.2 Conclusion 106
2.3 Research Gap 108
3 Research Methodology 108
3.1 Statement of Research Problem 109
3.2 Scope of Study 110
3.3 Research Objectives 110
3.4 Statement of Hypotheses 111
3.5 Research Methodology 112
3.5.1 Data Source 112
3.5.2 Research Questionnaires 112
3.6 Research Study 112
3.7 Data Analysis 113
3.8 Questionnaire Design 112
3.9 Objective of the Study 113
3.10 Hypothesis For The Study 113
3.11 Limitations of The Stud 113
4 Data Analysis 114
Pilot Study and Different Tests of Data Analysis 114

viii
4.1 Focus 146
4.2 Demographic Details 150
4.3 Hypotheses Specific Analysis 152
4.4 Frequency Data Analysis 164
5 Conclusion 174
5.1 Specific Conclusion 175
5.2 General Conclusion 178
6 Future Scope for Further Research 180
6.1 Recommendation 181
7 Bibliography 184
8 Questionnaire 190

ix
List of Figures
Fig No Description Page No
Fig. 1. Technical Educational Systems in India xvii
Fig. 2. Higher Education Institutions and Enrolment 10
Fig.3. Sector-wise Expenditure (in Crore Rs.) on Education
2013 -14
11
Fig.4. Quantitative growth of Engineering programs under
DTE-Decade-wise-2015
29

x
LIST OF TABLES
Sr. No. Title Page
No.
1 Descriptive Statistics For College Performance Indicators 117
2 Demographic - Course- Auto. Engineering 121
3 Demographic - Course - Civil Eng 122
4 Demographic - Course - Commu. Eng. 123
5 Demographic - Course - Comp. Eng. 124
6 Demographic -Course - E & Tc 125
7 Demographic - Course - It Eng. 126
8 Demographic - Course - Mech. Eng. 127
9 Demographic - Course - Design Engg. Pg 128
10 Demographic - Course - Constr. Pg 129
11 Demographic - Course - Comp. Sc. Pg 130
12 Demographic - Course - Network Pg 131
13 Demographic - Course - Structure Pg 132
14 Demographic-Course-B.Pharma 133
15 Demographic - Course - Pharma Pg 134
16 Demographic - Course - Cad Cam 135
17 Demographic - Course - Mba 136
18 Demographic - Course - Mca 137
19 Demographic - Accomo - Home 138
20 Demographic - Accomo – College Hostel 139
21 Demographic - Accomo - Private Hostel 140
22 Overall Score Demographic Details 143
23 Demographic - Course- Auto. Engineering 144
24 Demographic - Course - Civil Eng 145
25 Demographic - Course –Communication Engg. 146
26 Demographic - Course - Comp. Engg. 147
27 Demographic -Course - E & Tc 148
28 Demographic - Course - It Eng. 149
29 Demographic - Course - Mech. Engg. 150
30 Demographic - Course - Design Engg. Pg 151
31 Demographic - Course - Constr. Pg 152

xi
Sr. No. Title Page No.
32 Demographic - Course - Comp. Sc. Pg 153
33 Demographic - Course - Network Pg 154
34 Demographic - Course - Structure Pg 155
35 Demographic-Course-B. Pharmacy 156
36 Demographic - Course - . Pharmacy Pg 157
37 Demographic - Course - Cad Cam 158
38 Demographic - Course - MBA 159
39 Demographic - Course - MCA 160
40 Demographic – Accommodation - Home 161
41 Demographic - Accommodation – College Hostel 162
42 Demographic - Accommodation - Private Hostel 163
43 Frequency Data Tables For Hypothesis 164

xii
List of Abbreviations
AICTE All India Council for Technical Education
AIIMS All India Institute of Medical Sciences
ANSI American National Standard Institute
API Annual Performance Indicators
ASC Adacdemic Staff College
ASER Annual Status of Education Report
BCI Bar Council of India
CEO Chief Executive Officer
COA Council of Architecture
DCI Dental Council of India
DEC Distance Education Council
ESD Education for Sustainable Development
GER Gross Enrolment Ratio
GOI Government of India
ICAR Indian Council of Agriculture Research
IIM Indian Institute of Management
IIT Indian Institute of Technology
ILO International Labour Organization
INC Indian Nursing Council
INQAAHE International Network for Quality Assurance Agencies in Higher
Education
IQAC Internal Quality Assurance Cell
IRAHE Independent Regulatory Authority for Higher Education
xiii
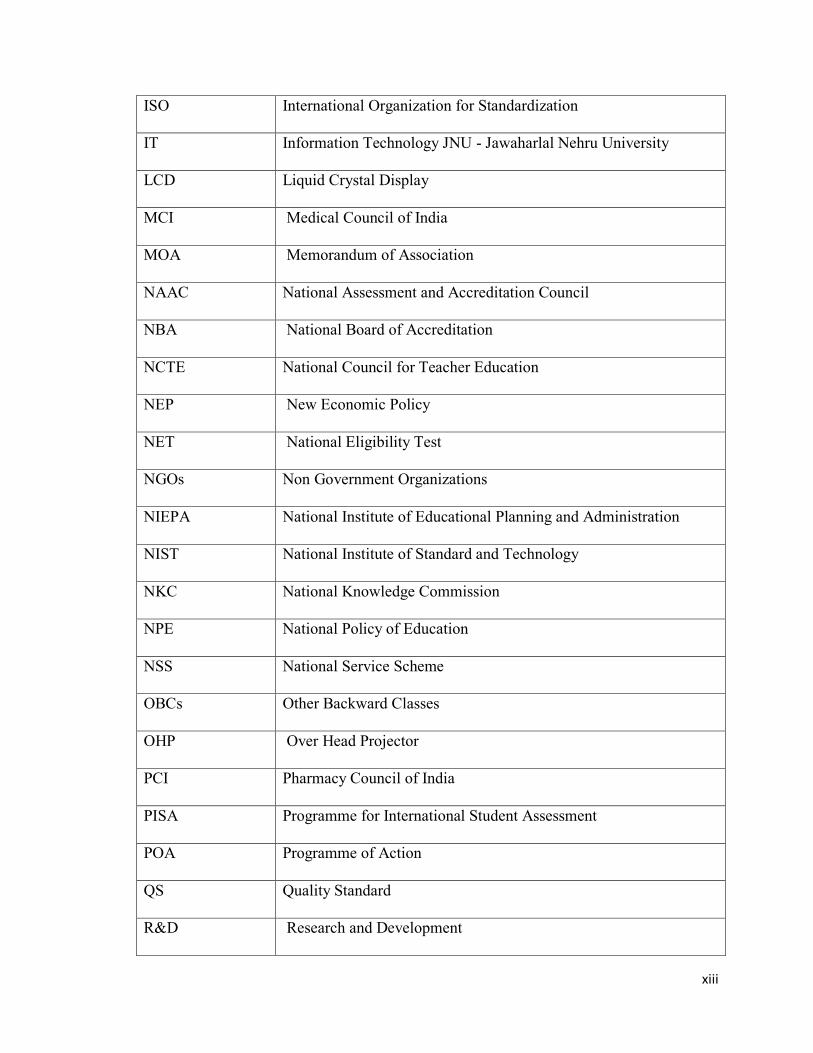
ISO International Organization for Standardization
IT Information Technology JNU - Jawaharlal Nehru University
LCD Liquid Crystal Display
MCI Medical Council of India
MOA Memorandum of Association
NAAC National Assessment and Accreditation Council
NBA National Board of Accreditation
NCTE National Council for Teacher Education
NEP New Economic Policy
NET National Eligibility Test
NGOs Non Government Organizations
NIEPA National Institute of Educational Planning and Administration
NIST National Institute of Standard and Technology
NKC National Knowledge Commission
NPE National Policy of Education
NSS National Service Scheme
OBCs Other Backward Classes
OHP Over Head Projector
PCI Pharmacy Council of India
PISA Programme for International Student Assessment
POA Programme of Action
QS Quality Standard
R&D Research and Development

xiv
RUSA Rashtriya Uchchatar Shiksha Abhiyaan
SCs Scheduled Castes
SEZ Special Education Zone
SQL Students' Quality Literacy
SSA Sarva Shiksha Abhiyaan
MBA Master of Business Studies
TES Trade in Education Services
TRIPS Trade Related Aspects of Intellectual Property Rights
TOFEL Test of Fluency in English Language
TFHES Task Force on Higher Education and Society
UGC University Grants Commission UK United Kingdom
UNESCO United Nations Educational, Scientific and Cultural Organization
VIIT Vishwakarma Institute of Information Technology
PG Post graduate
UG Under graduate
PEO Programme Educational Objectives
NCERT National Council of Educational Research and Training
NCHER National Commission of Higher Education and Research

xv
Executive Summary
Education has always been considered as the only key component of human development
and greatest liberating force.. A large numbers of additional students are knocking at the
doors of higher education institutions in the country. With the public funding being no
more in a position to take-up the challenging task of expansion and diversification of the
higher education system. The role of higher education in the emerging scenario of
knowledge economy is very crucial and multifaceted for any country in general and India
in particular. To keep the higher education within the reach of poor aspir-ants, there is a
strong case for effective monitoring and regulation of the private sector. Hence, it is high
time for planners, policy makers and practitioners of higher education to ponder over it
and make necessary reforms in the course and strategies so that employability skills can
be developed among the students.
The Indian system of higher education is both enormous and complex. India
also has around 250 specialist teaching and research institutions, established to provide
training in such areas as medicine, engineering, agriculture, and computer science, and to
conduct high-level research The University Grants Commission (UGC) of India is a
statutory organization set up by the Union government in 1956, charged with
coordination, determination and maintenance of standards of university education. It
provides recognition to universities in India, and disburses funds to such recognized
universities and colleges. UGC was recommended in 1945 and formed in 1946 to oversee
the work of the three Central Universities of Aligarh, Banaras and, Delhi. In 1947, the
Committee was entrusted with the responsibility of dealing with all the then existing
Universities. The Planning Commission of India sets the broad parameters for the
funding of Indian higher education, while the University Grants Commission (UGC) is
responsible for distributing resources and promoting reforms. The UGC also has a role in

xvi
the processes of coordination, accreditation and quality control. The All India Council for
Technical Education (AICTE) is the statutory body and a national-level council for
technical education, under Department of Higher Education, Ministry of Human
Resource Development. Established in November 1945 first as an advisory body and
later on in 1987 given statutory status by an Act of Parliament, AICTE is responsible for
proper planning and coordinated development of the technical education and
management education system in India. The AICTE accredits postgraduate and graduate
programs under specific categories at Indian institutions as per its charter. The
complexity of Indian higher education has made it difficult for both central and state
governments to implement programs of reform in any systematic and coordinated
manner. and Tech., Management Studies, Vocational Education, Technical Education,
Pharmaceutical Education, Architecture, Hotel Management and Catering Technology,
Information Technology, Town and Country Planning. The AICTE has its headquarters
in 7th Floor, Chanderlok Building, Janpath, New Delhi, which has the offices of the
chairman, vice-chairman and the member secretary, plus it has regional offices at
Kolkata, Chennai, Kanpur, Mumbai, Chandigarh, Guwahati, Bhopal, Bangalore,
Hyderabad and Gurgaon. The environment of higher education has evolved considerably.
Rising costs, shrinking budgets, and an increasing need for distance education (New
Media Consortium, 2007) is causing educational institutions to reexamine the way that
education is delivered. In response to this changing environment, e-learning is being
implemented more and more frequently in higher education, creating new and exciting
opportunities for both educational institutions and students. E-learning, or electronic
learning, has been defined a number of different ways in the literature. In general, e-
learning is the expression broadly used to describe “instructional content or learning
experience delivered or enabled by electronic technologies”. Indian universities face a
number of other difficult issues as well. While many more Indian students now have
access to higher education, the system as a whole is characterized by gross inequalities.

xvii
This section reviews the trend in the engineering education of India, employability of
engineering graduates, how the industries look upon the outgoing engineering graduates
and the problems associated with them.
In general, all the technical institutions in India can be categorized into four types (Figure
2.1). They are
1. Central Government Technical Institutions
2. State Government Engineering Colleges
3. Government Aided Private Engineering Colleges
4. Self-Financed Private Engineering Colleges.
Technical education
System In India
Central Government State Government Government Aided Self-financed
Funded Institutions Funded Institutions Private Engineering Institutions
Deemed Private Non-
autonomous
Private Autonomous
Universities Engg Colleges
Figure 2.1 Technical Educational Systems in India
Source : DTE MHRD Survey2013-14
In the field of professional training in particular, the size of the private sector is
formidable: According to 2003 figures for 19 major Indian states from the Medical

xviii
Council of India (MCI) and the All India Council for Technical Education (AICTE),
of 198 Medical Colleges, 44 percent were private, and of 1102 Engineering Colleges, as
many as 92 percent were private24; similar conditions prevail inbusiness management. In
some instances, competition between public and private institutions has begun to produce
improvements on both sides. In response, the Indian system of higher education has
unleashed a major program of reforms. Many of these reforms can be traced back to a policy
template provided by the National Knowledge Commission (NKC) set up by the Prime Minister in
2011, and chaired by a diasporic Indian entrepreneur, Sam Pitroda. Many of the dilemmas of
reform in Indian higher education are centered on issues of governance. As noted already,
the Indian system of higher education has experienced a massive expansion over the past
two decades, but this has happened in a rather chaotic and unplanned manner. The system
of affiliated colleges, around which the Indian system of higher education is built, has
often been described as a curse. The distinguished scholar and educational leader,
Professor .Kulandai Swami (2006), argues, for example, that the affiliating system is
‘outmoded, anachronistic, and acts as a real curse on the Indian higher education system’.
It holds back any genuine attempt at reform and renewal. Additionally, in
most students, especially those enrolled in tiny affiliated colleges, do not have access to
adequate library and other educational facilities. Their teachers are often poorly trained
and unmotivated, with little enthusiasm either for their disciplines or for teaching.. More
recently however, identifying lucrative opportunities, various entrepreneurs, businessmen
and politicians have established institutions through family trusts, or by taking advantage
of other favorable taxation conditions. The state authorities have encouraged this growth
not only to meet the growing demand but also to introduce what is assumed to be a
greater degree of institutional diversity in the system.

xix
In India, the push towards privatization, as expressed in the Indian government’s support
for the development of private institutions, both for-profit and non-profit, and for the
entry of foreign players into the market, appears to have two main motivations: to
diversify the system and to provide greater access to higher education.
H01 - Full fees must be charged to cover full cost of education.
H11 - Higher education should be free for everyone.
H02 - The role of private players should be restricted and regulated.
H12 - We need greater private participation in higher education.
H03 - A national education regulatory authority should be established to monitor.
H13 There is no need to replace the Existing regulatory authorities Such as
UGC, AICTE etc.
H04 - higher education Fees should reflect cost of providing education.
H14 - Student fees must be kept low by public funding.
H05 - Fees should remain constant even when salaries rise.
H15 - Student fees should be linked to faculty salaries.
H06 - Fees in self financed course is not very high.
H16 - Fees in self-financed courses are generally very high.
H07 - There is no need to increase tuition fees in funded aided courses.
H17 - There is a need to hike the fees in State/Government aided courses.
H08 - Loans are not substitute for state funding education.
H18 - Student loans can take care of needs of poor students.
H09 - Institutions should largely depend on student fees or government funding.

xx
H19 - Higher educational institutions should augment resources by research,
consultancy etc.
H10 - Government lacks the will to spend more on higher education.
H110 - Government lacks the resources to enhance spending on higher
Education.
“Banks and educational institutions need to work together to streamline the loan
application process and align it with the school application process. A two-way channel
of communication needs to be set up between the bank and educational institution. This
will enable accurate and enhanced flow of student information to the bank and at the
same time, institutions will be able to inform students about the benefits and drawbacks
of loans.” says Karan Khemka.(2010) There are significant issues with the current student
financing system in the country. 93% of Indian students do not take educational loans.
Some of the reasons cited in the report are lack of awareness, complexity of application
process and unfavorable loan terms. “The lack of standardization norms makes the loan
application process complex, long and difficult.”This is so because the problems of the
Indian system of higher education are deep, and relate to a range of dilemmas arising out
of the historical constitution of Indian higher education, and to the organizational
traditions and cultural attitudes about its nature and functions in society. We have
suggested that unless these dilemmas are squarely addressed, the Indian system of higher
education will continue to struggle, producing isolated pockets of academic excellence
but leaving the nation as a whole poorly served .
xxi
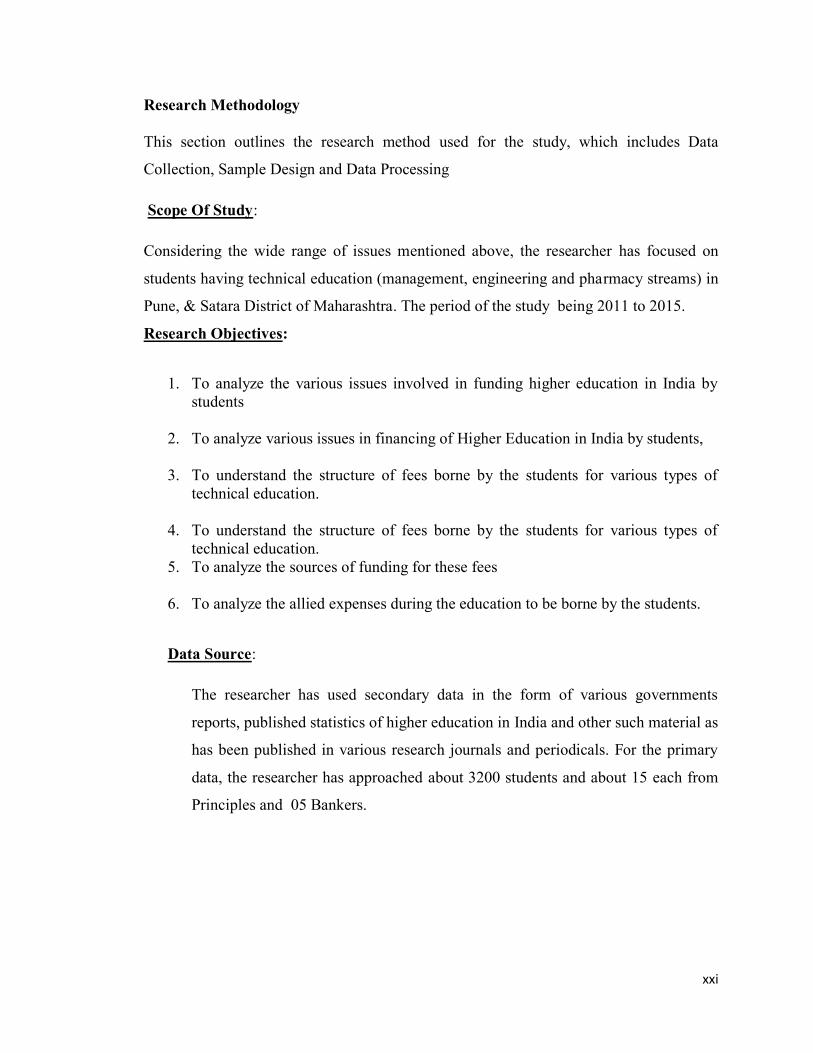
Research Methodology
This section outlines the research method used for the study, which includes Data
Collection, Sample Design and Data Processing
Scope Of Study:
Considering the wide range of issues mentioned above, the researcher has focused on
students having technical education (management, engineering and pharmacy streams) in
Pune, & Satara District of Maharashtra. The period of the study being 2011 to 2015.
Research Objectives:
1. To analyze the various issues involved in funding higher education in India by
students
2. To analyze various issues in financing of Higher Education in India by students,
3. To understand the structure of fees borne by the students for various types of
technical education.
4. To understand the structure of fees borne by the students for various types of
technical education.
5. To analyze the sources of funding for these fees
6. To analyze the allied expenses during the education to be borne by the students.
Data Source:
The researcher has used secondary data in the form of various governments
reports, published statistics of higher education in India and other such material as
has been published in various research journals and periodicals. For the primary
data, the researcher has approached about 3200 students and about 15 each from
Principles and 05 Bankers.

xxii
Field Study:
A total of 3200 students was targeted and data collected from them, the spatial
distribution of theses 3200 students is as follows:-
Area of Study Pharmacy Engineering Management Total
Pune 160 2210 275 2645
Satara 65 425 65 555
Total 225 2635 340 3200
of these 2442 students data was considered to be valid as relevant.
3Data Analysis:
Data analysis was done using SPSS16 and chi-squared was primarily used as the
tool for analysis
Data Presentation & Analysis:
In this chapter, all the collected data will be presented along with its analysis
Findings & Conclusions:
The concluding chapter will narrate about the findings of the research and how the
hypothesis is proven to be true or false. The interpretation of the data is also analyzed in
this chapter and suggestions and recommendations are given
xxiii

1
CHAPTER 1
INTRODUCTION
Meaning of the term Education :-
Higher education is of vital importance for the country, as it is a powerful tool to build
knowledge-based society of the 21st Century. With the growing size and diversity of
the higher education sector particularly in terms of courses, management and
geographical coverage, it has become necessary to develop a sound database on higher
education. Existing data base on higher education is inadequate and out-of-date.
Collection and dissemination of data on higher education suffers from incomplete
coverage, inordinate time lag etc. Due to this, Gross Enrolment Ratio (GER), which is
being calculated on the basis of available data, does not reflect the correct picture of
the country’s development in respect of Higher Education sector. Government has set
a target of increasing the GER from the present level of about 12% to 15% by the end
of XI Five Year Plan and to 30% by the year 2020. Various new initiatives have been
taken during XI Five Year Plan to increase the GER. Reliable and comprehensive
data-base is an immediate requirement to measure the actual GER and efforts taken to
improve the GER. A sound database on higher education is also required for planning,
policy formulation, fulfilling International Commitments, Research etc.
To address this issue, Department of Higher Education (DHE), Ministry of Human
Resource Development (MHRD) decided to conduct an All IndiaSurvey on Higher
Education for the first time, with the following objectives to identify & capture all the
institutions of higher learning in the country. For the purpose of this Survey, Higher
Education is defined as the education, which is obtained after completing 12 years of
schooling or equivalent and is of the duration of at least nine months (full time) or
after completing 10 years of schooling & and is of the duration of at least 3

2
years.Collect the data from all the higher education institutions on various aspects of
higher education.A Task Force was constituted under the Chairmanship of Sri Sunil
Kumar, Additional Secretary, DHE with members from diversified fields and Dr.
Vijay P.Goel, Deputy Director General, DHE as the Member Secretary.
Prior to the launching of the full-fledged survey, a pilot survey was conducted in some
of the selected Institutions of higher learning of different type. The present report deals
with conduct of pilot survey and its findings.
Education is a systematic process through which a child or an adult acquires
knowledge, experience, skill and sound attitude. It makes an individual civilized,
refined, cultured and educated. For a civilized and socialized society, education is the
only means. Its goal is to make an individual perfect. Every society gives importance
to education because it is a panacea for all evils. It is the key to solve the various
problems of life.Education has been described as a process of waking up to life
Waking up to life and its mysteries, its solvable problems and the ways to solve the
problems and celebrate the mysteries of life. Waking up to the inter-dependencies of
all things, to the threat to our global village, to the power within the human race to
create alternatives, to the obstacles entrenched in economical, social and political
structures.
Education in the broadest sense of the term is meant to aid the human being in his/her
pursuit of wholeness. Wholeness implies the harmonious development of all the
potentialities God has given to a human person.
True education is the harmonious development of the physical, mental, moral
(spiritual), and social faculties, the four dimensions of life, for a life of dedicated
service.

3
a) ‘educare’ which means ‘to bring out’ or ‘to nourish’.
b) ‘educere’ which means ‘to lead out’ or ‘to draw out’.
c) ‘educatum’ which means ‘act of teaching’ or ‘training’.
d) ‘educatus’ which means ‘to bring up, rear, educate’.
e) ‘ēducātiō’ which means “a breeding, a bringing up, a rearing.”
1.2DEFINITIONS:
Since time immemorial, education is estimated as the right road to progress and
prosperity. Different educationists’ thoughts from both Eastern and Western side have
explained the term ‘education’ according to the need of the hour. Various
educationists have given their views on education. Some important definitions are
mentioned in the All India Survey on Higher Education-2010
1. Mahatma Gandhi – “By education I mean an all-round drawing out of the best in
man – body, mind and spirit.”
2. Rabindranath Tagore – “Education enables the mind to find out the ultimate truth,
which gives us the wealth of inner light and love and gives significance to life.”
3. Dr. Zakir Husain – “Education is the process of the individual mind, getting to its
full possible development.”
4. Swami Vivekananda – “Education is the manifestation of divine perfection already
existing in man.”
5. Aristotle – “Education is the creation of sound mind in a sound body.”
6. Rousseau – “Education is the child’s development from within.”
7. Herbert Spencer– “Education is complete living.”
8. Plato – “Education is the capacity to feel pleasure and pain at the right moment.”
9. Aristotle – “Education is the creation of a sound mind in a sound body.”

4
10. Pestalozzi – “Education is natural, harmonious and progressive development
ofman’s innate powers.”
11. Froebel -“Education is enfoldment of what is already enfolded in the germ.”
12. T.P. Nunn – “Education is the complete development of the individuality of the
child.”
13. John Dewey – “Education is the process of living through a continuous
reconstruction of experiences.”
14. Indira Gandhi – “Education is a liberating force and in our age it is also a
democratizing force, cutting across the barriers of caste and class, smoothing out
inequalities imposed by birth and other circumstances.”
“All who have meditated on the art of governing mankind have been convinced that
the fate of empires depends on the education of youth”- Aristotle
1.3 NATURE OF EDUCATION:
As is the meaning of education, so is its nature. It is very complex & the nature of
education can be explained:
1. Education is a life-long process- Education is a continuous and lifelong process. It
starts from the womb of the mother and continues till the death. It is the process of
development from infancy to maturity. It includes the effect of everything which
influences human personality.
2. Education is a systematic process- It refers to transact its activities through a
systematic institution and regulation.
3. Education is development of individual and the society- It is called a force for social
development, which brings improvement in every aspect of the society.
4. Education is modification of behavior- Human behavior is modified and improved
through educational process.

5
5. Education is purposive: Every individual has some goal in his life. Education
contributes in attainment of that goal. There is a definite purpose underlined all
educational activities.
6. Education is a training- Human senses, mind, behavior, activities, skills are trained
in a constructive and socially desirable way.
7. Education is instruction and direction- It directs and instructs an individual to fulfill
his desires and needs for exaltation of his whole personality.
8. Education is life- Life without education is meaningless and like the life of a beast.
Every aspect and incident needs education for its sound development.
9. Education is continuous reconstruction of our experiences- As per the definition of
John Dewey education reconstructs and remodels our experiences towards socially
desirable way.
10. Education helps in individual adjustment: A man is a social being. If he is not able
to adjust himself in different aspects of life his personality can’t remain balanced.
Through the medium of education he learns to adjust himself with the friends, class
fellows, parents, relations, neighbors and teachers etc.
11. Education is balanced development: Education is concerned with the development
of all faculties of the child. It performs the functions of the physical, mental, aesthetic,
moral, economic, spiritual development of the individual so that the individual may
get rid of his animal instincts by sublimating the same so that he becomes a civilized
person.
12. Education is a dynamic process: Education is not a static but a dynamic process
which develops the child according to changing situations and times. It always induces
the individual towards progress. It reconstructs the society according to the changing
needs of the time and place of the society.

6
13. Education is a bipolar process: According to Adams, education is a bipolar process
in which one personality acts on another to modify the development of other person.
The process is not only conscious but deliberate.
14. Education is a three dimensional process: John Dewey has rightly remarked, “All
educations proceeds by participation of the individual in the social consciousness of
the race.” Thus it is the society which will determine the aims, contents and methods
of teachings. In this way the process of education consists of 3 poles – the teacher, the
child and the society.
15. Education as growth: The end of growth is more growth and the end of education
is more education. According to John Dewey, “an individual is a changing and
growing personality.” The purpose of education is to facilitate the process of his/her
growth.
Therefore, the role of education is countless for a perfect society and man. It is
necessary for every society and nation to bring holistic happiness and prosperity to its
individuals.
“Education is what remains in you after you’ve forgotten everything that you’ve
studied”, This famous quote stresses on the values that proper education would
inculcate in humans. But this ideological perception of education has become obsolete
in the 21st century. Value based education is like a foster child after education has
become a commodity. The perception and purpose of education, in the modern world,
has shrunk into viable means of accumulation of information and knowledge which
ultimately leads to a better job. Education as investment is completely perceived in the
materialistic point of view at present.
Among the class sectarianism based on economy, the middle class is the most
obsessed lot with education. Education in the current trend has become the most
7
lucrative business than any other. The fee quoted for the quality education has made
good education a rare privilege only for those who are capacious to afford toEducation
became more accessible to commoners in India during the 70s. Since then literacy rate
of independent India is only ascending. Many of whom who were by then lower class
and also were first generation learners, found education as the sole mean of their
family well being. Through the ladder of education they were able to claim from their
strata to the next level in the societal pyramid. Hence the middle class has developed a
firm and unflinching belief that the prosperity of their generation could only be
realized through education. This is in fact one of the most important mindsets of the
middle class.
The obsession of the parents is only imposed upon their children, and recent years the
academic pressure over students has risen at an alarming level. Without understanding
the individual differences of the kids or their talents and skill sets invariably every
child is expected to excel in academics. This parental and societal expectation has put
an enormous pressure on kids.Studies show this educational pressure is not alike
across the globe. Instead this is more prevalent in countries, especially the developing
nations, with more middle class demographic. In Asian region this academic pressure
is experienced at an unprecedented level among students in India, China and South
Korea. The striking commonality among these nations is that they are all rapidly
growing nations and are becoming the world economic hubs. This results in more job
opportunities for the efficient candidates. Thus every middle class parent is desperate
to get the best available education in the reputed institutions, where a mere entry
assures a job to pupil on completion of the course. Education is the biggest wealth that
every middle class parent is able to afford to his son or daughter for their financially
secured and prosperous future.

8
Education is now just seen as the gateway to grab a dream job offering a salary in five
digits. This is an important outcome of the changing human perception on life post
globalization. To majority of youth who were brought up in this era, values mean….
bull shit! They dream about joining an educational institution that promises them of a
fantastic job opportunity. Sadly the parents also care just about this and are least
bothered about the values that the institution imbibes in their kids.
1.4 1.is the process of facilitating learning, or the acquisition
of knowledge, skills, values, beliefs, and habits. Educational methods
include storytelling, discussion, teaching, training, and directed research. Education
frequently takes place under the guidance of educators, but learners may also educate
themselves.[1] Education can take place in formal or informal settings and
any experience that has a formative effect on the way one thinks, feels, or acts may be
considered educational. The methodology of teaching is called pedagogy.
1.4.1: Current Status
India possesses a highly developed higher education system which offers facility of
education and training in almost all aspects of human creative and intellectual
endeavors: arts and humanities; natural, mathematical and social sciences,
engineering; medicine; dentistry; agriculture; education; law; commerce and
management; music and performing arts; national and foreign languages; culture;
communications etc. The institutional framework consists of Universities established
by an Act of Parliament (Central Universities) or of a State Legislature (State
Universities), Deemed Universities (institutions which have been accorded the status
of a university with authority to award their own degrees through central government
notification), Institutes of National Importance (prestigious institutions awarded the
said status by Parliament), Institutions established State Legislative Act and colleges
9
affiliated to the University (both government-aided and –unaided) As on 31.3.2006,
the re were 367 University level institutions including 20 Central Universities, 217
State Universities, 104 Deemed Universities and 5 institutions established under State
Legislation, 13 Institutes of National Importance established under Central legislation
and 6 Private Universities.. There were 18,064 degree and post-graduate colleges
(including around 1902 women’s colleges), of which 14,400 came under the purview
of the University Grant Commission, the rest were professional colleges under the
purview of the Central Government or other statutory bodies like the AICTE, ICAR,
MCI etc. Of the Colleges under UGC purview 6109 have been recognized by the
University Grants Commission (UGC) under Section 2(f) and 5525 under Section
12(B) of the UGC Act, which recognition permits them to receive grants from the
UGC. In 2011-12, an estimated 14.93 million students were enrolled in the institutions
of Higher Education as against 11.48 million in the previous year and the faculty
strength was 1.488 million as compared to 1.472 m in the previous year. The
enrolment of women students at the beginning of the academic year 2012-13 was
4.466 million, constituting 40.40 per cent of the total enrolment. Of the total women
enrolment, only 12.35 per cent women have been enrolled in professional courses and
the rest in non-professional courses. The women enrolment is the highest in Kerala
(66.00 per cent) and lowest in Bihar (24.52 per cent) in terms of percentage enrolment
to total enrolment. (Annual Report, Ministry of Human Resource Development, 2012-
2013).
10
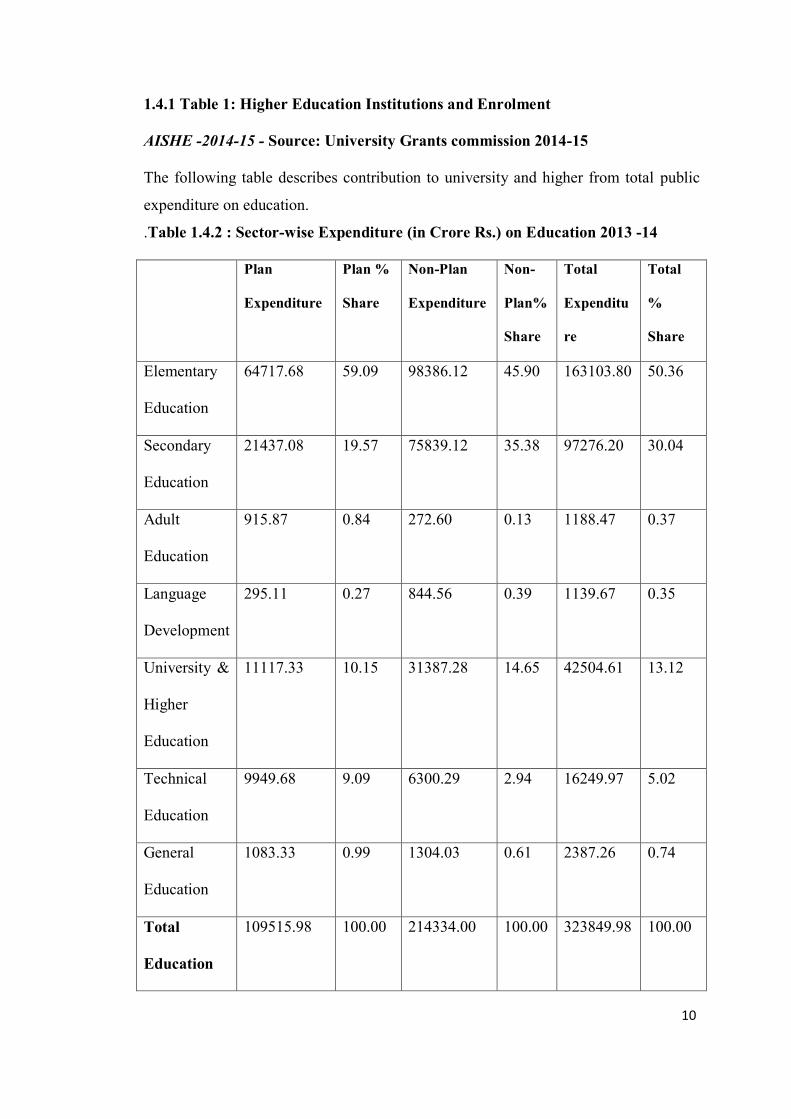
1.4.1 Table 1: Higher Education Institutions and Enrolment
AISHE -2014-15 - Source: University Grants commission 2014-15
The following table describes contribution to university and higher from total public
expenditure on education.
.Table 1.4.2 : Sector-wise Expenditure (in Crore Rs.) on Education 2013 -14
Plan
Expenditure
Plan %
Share
Non-Plan
Expenditure
Non-
Plan%
Share
Total
Expenditu
re
Total
%
Share
Elementary
Education
64717.68 59.09 98386.12 45.90 163103.80 50.36
Secondary
Education
21437.08 19.57 75839.12 35.38 97276.20 30.04
Adult
Education
915.87 0.84 272.60 0.13 1188.47 0.37
Language
Development
295.11 0.27 844.56 0.39 1139.67 0.35
University &
Higher
Education
11117.33 10.15 31387.28 14.65 42504.61 13.12
Technical
Education
9949.68 9.09 6300.29 2.94 16249.97 5.02
General
Education
1083.33 0.99 1304.03 0.61 2387.26 0.74
Total
Education
109515.98 100.00 214334.00 100.00 323849.98 100.00

11
As shown in the table and figure, university and Higher Education secures about 13%
of the total expenditure on education by education department, as against almost 50%
of investment on elementary education and 30% on secondary education.
1.5 Growth of Higher Education
In its size and diversity, India has the third largest higher education system in the
world, next only to China and the United States. Before Independence, access to
higher education was very limited and elitist, with enrolment of less than a million
students in 500 colleges and 20 universities. Since independence, the growth has been
very impressive; the number of universities (as on31st March 2006) has increased by
18-times, the number of colleges by 35 times and enrolment more than 10 times
(Annual Report, MHRD 2006-07). The system is now more mass-based and
democratized with one third to 40% of enrolments coming from lower socio-economic
strata, and women comprising of some 35%of the total enrolments (Tilak 2004). It is
little more than half a century ever since the government initiated a planned
development of higher education in the country particularly with the establishment of
University Grants Commission in 1953. Thus early 1950’s is an important reference
points from which we could look back at our progress of higher education. Table 1
depicts the growth of institutions from 1950-51 to 2004-05 while Table 2 classifies the
Central and State Universities in the type of disciplines offered by them.
Education system that morphed into an industry during the same time has managed to
equip itself to offer only what is sort after by the public. Value based education system
is now a history. What we have right now is an education system that values, marks
over character formation and credits and academic achievements over values.
Education stream is almost completely industrialized, where the target is to
12
manufacture a pupil with top scores and place him in a lucrative job. Parent’s attitude
has too changed by and large. They want their children to score more and their
character formation is not much cared about.
In the recent decades the Indian educational system which had a great legacy for its
value based and life oriented education has lost it giving away to job market pressure.
Instead of educating the pupils and shaping their character, lately they have reduced to
industries manufacturing bright minds in ways that the industry exactly wants. Now
school, colleges and universities have reduced to mere suppliers of human resource
who have more productivity but are less humane.
Autonomy of Higher Education Institutions is a pre-requisite for enabling them to
achieve their goals and objectives. An honest exercise of autonomy - academic,
administrative and financial – will lead to making these Institutions as centers of
innovation, excellence and development. With this in view the Universities need to be
insulated from internal and external pressures of all kinds, may be bureaucratic,
political and other groups. Towards this end, University Grants Commission,
Government of India and State Governments will have to evolve strategies to realize
the intended objective. Since, autonomy of higher education institution goes hand-in-
hand with its accountability, the delegation and devolution of power and authority
concomitant with responsibility should flow not only from the external environment to
the higher education institution but should be given at different levels within the
higher education institution itself. There should be a charter of responsibility and
devolution and delegation of authority defined for different levels within the university
system and both should be monitored together.
This mechanical system of education grooms an entire generation that is less
emotional, more calculative even with kith and kin, and their survival slogan is

13
much like this – ‘Attaining personal goals are more important than the ways of
attaining it’.
Education is important for every individual in a nation. It plays a vital role to change
the stare of a country. No country could bring a revolution in it unless its people are
educated enough to meet the challenges. Education makes a man realize about himself
and his goals and how to achieve that goals.
Basically, Education is divided into three groups, The Education which teaches the
concerns of a society is called Social Education, The Education which develops a
personality inside a man himself is called Spiritual Education, the Education that
concerns with the professionalism is called Vocational Education. The Technical
Education comes under the branch of Vocational Education which deals practically in
the field of trade, commerce, agriculture, medicine & Engineering.
We are living in the modern age of science where we find Technologies in every
aspect of life. What makes life so easy for us… simply; these are the Technologies
which we use for our ease and comforts. Not only in our daily life but also in the
research centre, in defensive measured of a country, biological aspects etc. No nation
could make the progress unless it promotes technical aspects in its fields. The
technical education produces technicians for all type of industries and it is true that the
progress of a country much depend upon its Industrialization without which a
handsome economy would not be possible Using a technology is far easier than to
develop it. For developing a technology, it needed high skill teams which have a high
knowledge for the theme. It also needed a high amount of time and money. To fulfill
all these, there must be technical institutes which must cover all the faculties of
technological studies and also the support of government to support financially & to
make it at international level. If it would be at an International level then it would be
14
easier to students to acquire knowledge in their own state so that they could do
something for their own country. Pakistan leads in the technological era. The
exhibition canters in Pakistan plays a vital role in backing up the technicians to come
up with more and more new technologies because it gives reflection of our
technologies to the foreigners which are representing their country, which means we
are reflecting our image to that world. By this we have a sense of development and
prosperity that we also produce creative mind in the technological aspect
As far as Pakistan’s implementation in techno field is concern, we can look around
and observe that in every field of life we are using high class technologies whether it is
in the Industrial purpose, business purpose, agriculture purpose or defensive purpose.
There has been a lot of emergence of on-line trading, which deals with high
technological concerns in term of machinery and software. Pakistan
Telecommunication field also deal with high-class technology.
Pakistan also promises to produce best technicians of its own through their technical
education centers which allow approximately all the faculties for technical
development. These institutes also support the new courses of technology which are
introduced at a time so that there would be no line at which we lay behind. The most
important institutes in Pakistan which support the technical courses include, NED
University, GIK University, Karachi University, Mehran University and there are also
some other private Universities which deal in technological subjects. These institutes
promise to produce technicians who could meet the challenges of the technological
era. I feel proud when I watch the students rushing towards these technical institutes to
become a prosperous technician who have a sense of responsibility for the progress of
their national Technical education promotes the material prosperity and economic
advancement. It produces the sense of self-respect and dignity. If a country has her

15
own technical experts, she can save a lot of foreign exchange i.e. Technical Education
makes a country rich, prosperous and resourceful. Our country is rich in raw material
resources but the thing is, we must have enough technical knowledge to benefit from
them. There is a famous saying “Engineers drive the world”. Engineering education is
the backbone of any society. It is the quality of engineering education that decides the
quality of human resources in a country. As stated by Bordia (2001) for the general
public in the developing country like India, any engineering degree is a passport to
lifelong well being of an individual and his family members. Hence, there is fierce
competition among engineering institutions, students and parents of students to get
quality students and quality institution respectively.
1.5.1 AIMS OF EDUCATION
Towards progress : 2016 to 2030
To achieve the envisioned state in 2030, transformational and innovative interventions
would be required across all levers of the higher education system
In recent years, India has undertaken massive structural and systemic changes that
have started to yield encouraging results. The country has been touted to have the best-
in-class post-secondary education system at present. Some of the significant factors
that have contributed to this growth and can help envision the 2030 dream includes:
Expansion of a differentiated university system with a three-tiered formalized structure
Transition to a learner-centered paradigm of education
Intensive use of technology
Reforms in governance
India is among top 5 countries globally in cited research output, with 23 universities in
global top 200.

16
Aims give direction to activities. Aims of education are formulated keeping in view
the needs of situation. Human nature is multisided with multiple needs, which are
related to life. Educational aims are correlated to ideals of life.
The goal of education should be the full flowering of the human on this earth.
According to a UNESCO study, “the physical, intellectual, emotional and ethical
integration of the individual into a complete man/woman is the fundamental aim of
education.”The goal of education is also to form children into human persons
committed to work for the creation of human communities of love, fellowship,
freedom, justice and harmony. Students are to be moulded only by making them
experience the significance of these values in the school itself. Teachers could achieve
this only by the live example of their lives manifested in hundreds of small and big
transactions with students in word and deed.
1.5.1.1 Individual and Social Aims:
Individual aims and social aims are the most important aims of education. They are
opposed to each other individual aims gives importance for the development of the
individuality. Social aim gives importance to the development of society through
individual not fulfilling his desire. But it will be seen that development of individuality
assumes meaning only in a social environment.
1.5.1.2 Individual Aims
Sir Percy Nunn observes, “Nothing goods enters into the human world except in and
through the free activities of individual men and women and that educational practice
must be shaped the individual. Education should give scope to develop the inborn
potentialities through maximum freedom.”

17
1.5.1.3 Social Aim
s Whenever I try to imagine an engineering student in India, the mental imagery that
flashes in my mind at once is that of Hercules shouldering the earth. Oscillating
between the dreams of parents and the societal pressure, every engineering student
confronts a Herculean task both academically and psychologically. What does their
toil for four years fetch them at the end? It is obvious that the mind sets of parents and
students coincide in the idea of getting a job that offers a five digit salary, no matter
how remote is the job offer from their core field. Irrespective of the many branches of
the engineering stream, except a few none bother to switch streams to grab a job offer
with tempting salary package.
High school pupils in his/her pursuit of landing in their dream job have to pass two
stages. First, their four years to be spent in one of the umpteen engineering colleges to
walk out with a degree and next the interview panel of any company to walk out with
an offer letter. Education is one of the best businesses in the current Indian scenario.
The immense interest in engineering courses among Indian parents was aptly followed
by the mushrooming engineering colleges in the past decade. Except a handful, the
histories of majority of engineering colleges in India span not more than 15 years.
Now that the school final results are published, the newspapers and magazines would
in the coming days be filled with advertisements of various colleges. Invariant of all
these ads we could see two things highlighted. They are the pass percentage of their
current year students and the placement details of the final year students who batched
out that year. Both these talk about the credentials and academic excellence of the
institution which the parents are keen to know.
Indian education system is swarmed with a wide variety of curricula most of which are
designed to excel with rote learning. The pupils trained in an education system like
18
this are capable of memorizing chunks of information but only a creamy layer of them
have applicative skills, which is the prime requisite of the recruiting companies.
Anyone with a gifted memory and ability to rote learn any amount of data can pass out
an engineering degree with distinction. The scored marks or percentages can never be
considered as a true measure of intelligence. In India we don’t really face
unemployment but what we actually face is the ‘unemployable’ problem. Current
studies reveal that only about 15-25 % of the Indian engineering grads are employable,
having the skill sets that employers look for. It might level the argument quoting ,the
placement percentages that every collage proudly boasts each year. Almost three
quarters of the placements of very institution are from the IT companies. Everyone get
to know about the placements of freshers in these companies. But how many of them
sustain in these companies? That is something we never get to know. In various
companies many of these fresh recruits struggle to survive. Companies who initially
recruit in bulk have their own strategies of selecting the best among the lot. Among the
rest the mediocre are bench listed and the inefficient are terminated. The terminated
folks settle in smaller companies, with lesser salary packages, for their profile now has
a few months of work experience on a top company as credit.
Irrespective of the core fields grads of every engineering field end up as IT
professional giving way to the high salary bait it throws. After working for a year or
so, the skill sets one groomed as a student for his/her core field get totally replaced by
the skill sets imbibed for IT profession, probably acquired during the training period of
about 2-6 months. So even if one wishes to switch back to their core field it becomes
impossible over years.
Even the top companies are willing to recruit fresh graduates. There are two prominent
reasons behind this. Psychologically a youngster’s loyalty for his company will be at
19
its peak during the initial years. The company’s welfare will take the front seat no
matter if it demands compromising the personal welfare. This attitude is the fresher
special. Besides, the commitment to this degree comes at a lower payment- compared
to their senior counterparts. After extracting the work from the human resource, at a
stage the companies think they are done with them, the treatment one could expect is
nothing less that what we do with juiced out molasses.
In any field the success trumpet is blown at full volume while the melancholies go
unheard. All the dreaming parents and their folks hear are the loud trumpets. The core
intention of this two part article is to show an engineering aspirant about the realities
— plain and frank — so that they might design their years in colleges to hone the
skills that will fetch them a guaranteed future rather than giving way to attractive ads
of the institutions, which might only fetch them just a degree worth for nothing. Be
wise and choose wise.
1.5.2 Theeducation is the process of facilitating learning, or the acquisition
of knowledge, skills, values, beliefs, and habits. Educational methods
include storytelling, discussion, teaching, training, and directed research. Education
frequently takes place under the guidance of educators, but learners may also educate
themselves.[1] Education can take place in formal or informal settings and
any experience that has a formative effect on the way one thinks, feels, or acts may be
considered educational. The methodology of teaching is called pedagogy.
Education commonly is divided formally into such stages
as preschool or kindergarten, primary school, secondary school and then
college, university, or apprenticeship.A right to education has been recognized by
some governments, including at the global level: Article 13 of the United Nations'
1966 International Covenant on Economic, Social and Cultural Rights recognizes a
20
universal right to education In most regions education is compulsory up to a certain
age.In most countries today, full-time education, whether at school or otherwise, is
compulsory for all children up to a certain age. Due to this the proliferation of
compulsory education, combined with population growth, UNESCO has calculated
that in the next 30 years more people will receive formal education than in all of
human history thus far.
Formal education occurs in a structured environment whose explicit purpose is
teaching students. Usually, formal education takes place in a school environment with
classrooms of multiple students learning together with a trained, certified teacher of
the subject. Most school systems are designed around a set of values or ideals that
govern all educational choices in that system. Such choices include curriculum,
physical classroom design, student-teacher interactions, methods of assessment, class
size, educational activities, and more.
Education: derived from educatum or educare means to train, to mould, to bring up, to
lead out, to draw out or propulsion from inward to outward. Narrower meaning: A
process for certain periods from schooling to colleges through fixed time, fixed
curriculum, fixed classes, fixed subjects for degree or certificate. Wider meaning: it
goes on throughout the life from birth till death. Need of aims: To bring certain
desirable change, gives direction to activity. Different aims: The Vocational Aim, The
Knowledge or Information Aim, The Culture Aim, The Character Formation Aim or
the Moral Aim, The Spiritual Aim The Adjustment Aim, The Leisure Aim, The
Citizenship Training Aim, The Harmonious Development Aim, The Complete Living
Aim, The Social Aim. Aims in India: Developing Democratic Citizenship Vocational
Efficiency, Development Personality or Character, Education for leadership,
Increasing national productivity; Achieving social and national integration;

21
Accelerating the process of modernization; Cultivating social, moral and spiritual
values. Process: Education by Accretion or Storage Education as formation of mind,
Education as preparation. Education as mental discipline, Education as growth and
development, Education as direction, Education as adjustment and self-activity,
Education as social change and progress, Education as Process Socialization.
1.6 Current Developments In Education With Particular Reference To India
Providing education to a large population has been a challenging task after
independence. The illiteracy has been widespread throughout the country. Government
was totally committed to avail the infrastructure and other facilities to its people. In
order to achieve these tasks, it has constituted various committees and commissions
from time to time. The first ever commission namely University Education
Commission towards this effort was appointed in 1948. Later, in 1952, the secondary
Education Commission was constituted. The development of Education in India
particularly after independence has been guided by national aspirations as embodied in
Indian Constitution. Education has been regarded in the constitution of India as the
fundamental right of each and every citizen. Since the adoption of the constitution, the
government has been making tremendous efforts to avail education to all sections of
the society. The literacy rate in India has risen to 65.38 percent. A significant
proportion of this growth is attributed to the promotion of non-formal system of
education through non formal centers, community involvement and decentralized
system for management of elementary education. Kerala has always been at the top in
terms of the literacy rate among the states. The states, which fall below national
average, are mostly the BIMARU (Bihar, Madhya Pradesh, Rajasthan and Uttar
Pradesh) states. It may be noted that the elementary education has been given the top
priority during recent years. After the elementary education it is the higher education

22
which has been given due importance. Apart from the elementary and higher
education, the technical education stood at number three up to fourth five plans. Then
it was the secondary education, which has been given more importance. Before 1976,
education was the exclusive responsibility of the States. The Constitutional
Amendment of 1976, which included education in the administrative implication
required a new sharing of responsibility between the Union Government and the
States. The Central Government continues to play a leading role in the evolution and
monitoring of educational policies and programs, the most notable of which are the
National Policies on (NPE), 1986 and the Programme of Action (POA), 1986 as
updated in 1992. The modified policy envisages a national System of Education to
bring about uniformity in education, making adult education programmes a mass
movement, providing universal access, retention and quality in elementary education,
special emphasis on education of girls, establishment of pace-setting schools like
Navodaya Vidyalayas in each district, vocationalization of secondary education
syntheses of knowledge and inter-disciplinary research in higher education, starting
more Open Universities in the States, strengthening of the All India Council of
Technical Education, 30 encouraging sports, physical education, Yoga and adoption of
an effective evaluation method, etc. The POA lays down a detailed strategy for the
implementation of the various policy parameters by the implementing agencies. The
National System of Education as envisaged in the NPE is based on a national
curricular framework, which envisages a common core along with other flexible and
region-specific components. Development in Expenditure In line with the commitment
of augmenting resources for education, the allocation for education has, over the years,
increased significantly. The Plan outlay on education has increased from Rs 151,20
crore in the First Five Year Plan to Rs 43,825 crore in the Tenth Five Year Plan (2002-

23
2007). The expenditure on Education as a percentage of GDP also rose from 0.64 per
cent in 1951-52 to 3.74 per cent in 2013-2014 (BE).The outlay for Education in the
Tenth Five Years Plan of Rs 43,825 crore, is higher than the Ninth Plan outlay of Rs
24,908 crore by 1.76 times.
The Technical Education System in the country covers courses in engineering,
Technology, management, architecture, pharmacy, etc. The Ministry of Human
Resource Development caters to programmes at undergraduate, postgraduate and
research levels. The technical educational system at the central level comprises,
among others, the following: a) The All India Council for Technical Education
(AICTE), which is the statutory body for proper planning and coordinated
development of the technical education system; b) Seven Indian Institutes of
Technology (IITs); Six Indian Institutes of Management (IIMs); d) Indian Institute of
Science (IISc),Bangolore; e) Indian Institute of Information Technology and
Management (IITM), Gwalior; Indian Institute of Information Technology (IIIT),
Allahabad; and its Extension Campus at Amethi; and Pt. Dwarka Prasad Mishra
Institute of Information Technology Design and Manufacturing Jabalpur; and f)
Eighteen National Institutes of Technology (NITs) (converted from RECs with 100
per cent central funding.
1.6.1 The Educator’s Role
The teacher himself should be a properly integrated human being. The teacher has to
be careful, thoughtful and affectionate in the creation of the right environment for the
development of understanding to enable the child to deal intelligently with human
problem. In order to achieve all this, the educator needs to understand himself. In
order to deal with children, great deal of patience and understanding are needed. For a
true teacher, teaching was not a technique but a way of life.
24
1.7 Higher Education In India :
India's education has a long history dating back to institutions such as Nalanda.India,
being a developing nation, struggles with challenges in its primary education. Literacy
rate has increased from around 3% in 1880 to around 65% in 2001. Net enrolment of
6-10 years old Indians increased from 68 percent to 82 percent between 1992/93 and
1998/99. Yet great challenges remain as The Economist reports that half of 10-year-
old rural children can't read at the basic level, over 60% is unable to do simple
division, and half drop out by the age 14. Fewer than 40 percent of adolescents in
India attend secondary schools. Around 1 in 10 young person has access to tertiary
education. Mercer consulting estimates that only a quarter of graduates are
"employable". All levels of education in India, from primary to higher education, are
overseen by the Ministry of Human Resource Development, Department of Higher
Education, India and Department of School Education and Literacy, and heavily
subsidized by the Indian government, though there is a move to make higher education
partially self-financing. The Indian Government is considering allowing 100% foreign
direct investment in Higher Education. (UNKNOWN, 2009) Higher Education in
India has evolved in distinct and divergent streams with each stream monitored by an
apex body, indirectly controlled by the Ministry of Human Resource Development.
The 415 universities/ institutions are mostly funded by the state governments.
However, there are 24 important universities called Central universities, which are
maintained by the Union Government and because of relatively large funding, they
have an edge over the others. The engineering education and business schools are
monitored and accredited by the All India Council for Technical Education (AICTE)
while medical education is monitored and accredited by the Medical Council of India
(MCI). Like-wise, agriculture education and research is monitored by the Indian

25
Council for Agriculture Research. Apart from these, National Council for Teacher
Education (NCTE) controls all the teacher training institutions in the country.
(UNKNOWN, 2008)
It is widely recognized that higher education promotes social and economic
development by enhancing human and technical capabilities of society. Technical
change and institutional change are key components of development. Higher education
plays an important role in facilitating these changes by incorporating all of the various
demographics of the population.
Higher education has been found to be significantly related to the human development
index and greater for the disadvantaged groups (Joshi, K. M. , 2006). Similarly, the
lack of such education causes the inverse to occur; i.e. the greater the level of higher
education in a society, whether in stock or flow forms, the greater the level of human
development can be, through its influence on two main components of human
development index: life expectancy, and GDP per capita (Tilak, J. B. G., 1994). In its
size and diversity, India has the third largest higher education system in the world,
next only to China and the United States. The higher education system in India grew
rapidly after independence (Agarwal, Pawan, 2006). Today, Indian higher education is
comprised of 33,657 institutions, made up of 634 universities and 33,023 colleges; it is
the largest higher education system in the world in terms of the number of institutions.
With the changing demographics, political, philanthropic and economic environment,
the objective of higher education has now a more focused attention on access and
equity. The Indian higher education has seen three phases of funding, philanthropic to
public, and then to private financing. The changing financing patterns have altered
regulations, equity, efficiency and quality aspects of higher education. (Joshi, Dr. K.
M. & Ahir, Dr. Kinjal Vijay, 2013)

26
Between 1948 and 1960, the states of Maharashtra and Gujarat were together. An
engineering college at Ahmedabad, a separate polytechnic at Pune and two model
polytechnics, one at Bombay and another at Ahmedabad were started. Along-with this,
technical high schools and high school centers were started to orient the students
towards the engineering profession. The concept of technical high school centre was a
novel concept, in that; it could cater to the need of purely academic schools in the
locality of very low cost in terms of infrastructure and running expenditure.
The formation of the State of Maharashtra in 1960 opened a new chapter
in technical education and the activities of the Directorate increased manifold.
By 1978 the number of degree level institutes rose to 16, the diploma level institutes to
50. Also, post-graduate facilities were developed in nine institutions. Similarly, the
ITIs and technical high schools also increased in large numbers. By 1987, almost
every district, excepting the four districts of Ahmednagar, Wardha, Gadchiroli and
Raigad had a government polytechnic.
However, the demand for degree and diploma courses was on the rise. Many deserving
students were unable to get admission to these courses due to the limited seats
available in government and government-aided institutes. Therefore, by a pragmatic
view to give opportunities to the aspiring students, the government decided to grant
permission to private, social and educational managements to startup unaided
engineering colleges and polytechnics. Due to the very large growth, and in order to
facilitate monitoring and development of technical institutes and courses, the
Directorate of Technical Education was bifurcated in 1984 and the Directorate of
Vocational Education and Training was formed. This new Directorate was given the
charge of industrial training institutes, technical high schools and certificate course
institutes in the state. The Directorate of Technical Education was given the

27
responsibility of degree and diploma level institutions in Engineering and Technology,
Architecture, Pharmacy, Hotel Management and Catering Technology etc. The
Directorate was also entrusted with the monitoring and control of management
institutions imparting degree and diploma level training in various branches
ofEngineering and Technical education.
Table 2 : Quantitative growth of Engineering programs under
Sr.No. Type of Course Details of growth
1 PG degree courses
in Engineering
and Technology
Year ofRef. No. of
Institutes
SanctionedIntake
1980 10 1701
1990 31 2883
2000 34 2469
2015 176 6050
2 Degree in Engineering
and Technology
1980 9 2934
1990 66 25964
2000 125 43901
2015 336 155691
3 Diploma in Engineering
and Technology
1980 39 9690
1990 117 32590
2000 144 40220
2015 225 45630
Source : DTE-Decade-wise-2015 as per AISHE 2014-15

28
1.8 Brief History of Education in India
The education in India has a rich and interesting history. It is believed that in the
ancient days, the education was imparted orally by the sages and the scholars and the
information was passed on from one generation to the other. AICTE -Technical
Education plays a vital role in human resource development of the country by creating
skilled manpower, enhancing industrial productivity and improving the quality of life
of its people. Technical Education covers programmes in engineering, technology,
management, architecture, town planning, pharmacy, applied arts & crafts, hotel
management and catering technology. The impulse for creation of centers of technical
training came from the British rulers of India and it arose out of the necessity for the
training of overseers for construction and maintenance of public buildings, roads,
canals and ports and for the training of artisans and craftsmen for the use of
instruments and apparatus needed for the army, the navy and the survey department.
The superintending engineers were mostly recruited from Britain from the Cooper's
Hill College and this applied as well to foremen and artificers; but this could not be
done in the case of lower grades- craftsmen, artisans and sub-overseers who were
recruited locally. As they were mostly illiterate, efficiency was low. The necessity to
make them more efficient by giving them 65 elementary lessons in reading, writing,
arithmetic, geometry and mechanics, led to the establishment of industrial schools
attached to ordnance factories and other engineering Engineering. In 1865 it was
amalgamated with the Presidency College. Later, in 1880, it was detached from the
Presidency College and shifted to its present quarters at Sibpur, occupying the
premises and buildings belonging to the Bishop's College.
Proposals for having an Engineering College at Bombay city having failed for some
reasons, the overseer‘s school at Poona eventually became the Poona College of

29
Engineering and affiliated to the Bombay University in 1858. For a long time, this was
the only College of Engineering in the Western Presidency.
In the Madras Presidency, the industrial school attached to the Gun Carriage Factory
became ultimately the Guindy College of Engineering and affiliated to the Madras
University (1858). The educational work in the three Colleges of Sibpur, Poona and
Guindy has been more or less similar. They all had licentiate courses in civil
engineering up to 1880, when they organized degree classes in this branch alone. After
1880, the demand for mechanical and electrical engineering was felt, but the three
Engineering Colleges started only apprenticeship classes in these subjects. The
Victoria Jubilee Technical Institute, which was started at Bombay in 1887, had as its
objective the training of licentiates in Electrical, Mechanical and Textile Engineering.
In 1915, the Indian Institute of Science, Bangalore, opened Electrical Engineering
classes under Dr. Alfred Hay and began to give certificates and associate ships, the
latter being regarded equivalent to a degree. 67 In Bengal, the leaders of the Swadeshi
Movement organized in 1907 a National Council of Education which tried to organize
a truly National University. Out of the many institutions it started, only the College of
Engineering and Technology at Jadhavpur had survived. It started granting diplomas
in mechanical and engineering course in 1908 and in chemical engineering in 1921.
The Calcutta University Commission debated the pros and cons of the introduction of
degree courses in mechanical and electrical engineering. One of the reasons cited from
the recommendations of the Indian Industrial Commission (1915), under the
Chairmanship of Sir Thomas (Holland) against the introduction of electrical
engineering courses, is given in the following quotation from their report: "We have
not specifically referred to the training of electrical engineers, because electrical
manufactures have not yet been started in India, and there is only scope for the

30
employment of men to do simple repair work, to take charge of the running of
electrical machinery, and to manage and control hydroelectric and steam-operated
stations. The men required for these three classes of work will be provided by the
foregoing proposals for the training of the various grades required in mechanical
engineering. They will have to acquire in addition, special experience in electrical
matters, but, till this branch of engineering is developed on the constructional site, and
the manufacture of electrical machinery taken in hand, the managers of electrical
undertakings must train their own men, making such use as they can of the special
facilities offered for instruction at the engineering colleges and the Indian Institute of
Science.‖ 68 The credit of first starting degree classes in mechanical engineering,
electrical engineering and metallurgy goes to the University of Banaras, thanks to the
foresight of its great founder, Pt. Madan Mohan Malaviya (1917).
About fifteen years later, in 1931-32, the Bengal Engineering College at Sibpur started
mechanical and electrical engineering courses in 1935-36 and courses in metallurgy in
1939-40. Courses in these subjects were also introduced at Guindy and Poona about
the same time. Quite a number of engineering colleges have been started since August
15, 1947. It is due to the realization that India has to become a great industrial country
and would require a far larger number of engineers than could be supplied by the older
institutions.
The All India Council for Technical Education (AICTE) is the statutory body and a
national-level council for technical education, under Department of Higher Education
Ministry. Established in November 1945 first as an advisory body and later on in 1987
given statutory status by an Act of Parliament, AICTE is responsible for proper
planning and coordinated development of the technical education and management
education system in India. The AICTE accredits postgraduate and graduate programs

31
under specific categories at Indian institutions as per its charter. It is assisted by 10
Statutory Boards of Studies, namely, UG Studies in Eng. & Tech., PG and Research in
Eng. and Tech., Management Studies, Vocational Education, Technical Education,
Pharmaceutical Education, Architecture, Hotel Management and Catering Technology,
Information Technology, Town 69 and Country Planning. The AICTE has its
headquarters in Indira Gandhi Sports Complex, Indraprastha Estate, New Delhi, which
has the offices of the chairman, vice-chairman and the member secretary, plus it has
regional offices at Kolkata, Chennai, Kanpur, Mumbai, Chandigarh, Guwahati,
Bhopal, Bengaluru, Hyderabad and Gurgaon
AICTE is vested with statutory authority for planning, formulation and maintenance of
norms and standards, quality assurance through school accreditation, funding in
priority areas, monitoring and evaluation, maintaining parity of certification and
awards and ensuring coordinated and integrated development and management of
technical education in the country as part of the AICTE Act No. 52 of 1987.
The AICTE Act, stated verbatim reads: ―To provide for establishment of an All India
council for Technical Education with a view to the proper planning and co-ordinate
development of the technical education system throughout the country, the promotion
of qualitative improvement of such education in relation to planned quantitative
growth and the regulation and proper maintenance of norms and standards in the
technical education system and for matters connected therewith.
The AICTE comprises nine bureaus, namely:
Faculty Development (FD) Bureau
Undergraduate Education (UG) Bureau
Postgraduate Education and Research (PGER) Bureau
Quality Assurance (QA) Bureau

32
Planning and Co-ordination (PC) Bureau
Research and Institutional Development (RID) Bureau
Administration (Admin) Bureau
Finance (Fin) Bureau
Academic (Acad) Bureau
For each bureau, adviser is the bureau head who is assisted by technical officers and
other supporting staff. The multidiscipline technical officer and staff of the council are
on deputation or on contract from government departments, University Grant
Commission, academic institutions, etc.
The national statutory body called All India Council for Technical Education, is the
only with their approval that a B-School can be started. AICTE advises all B-Schools
of 3 years standing to go in for accreditation. For that purpose, AICTE has created a
special agency called the National Board of Accreditation (NBA).
The accreditation categories are i) Of five years, ii) Three years, iii) Conditional three
years, iv) accreditation refused. The accreditation is a tough process. That could be the
reason why only about 10 percent of the Indian B- Schools have gone in for
accreditation. AICTE does not compel the accreditation to the management institutes,
Which was founded in November 1945, is a not-for-profit organization that brings
together nearly more than 1,00,000 academic institutions, and other organization
interested, in the promotion and improvement of higher education in the areas of
business administration and management. The AICTE plays a prominent thought
leadership in the field of management education. For example organization and
institution commissioned the 71 landmark study as an outcome of several AICTE
sponsored program and conferences. These events bought together business school,
organization and other stakeholders to explore the issues facing industry and society
33
and their impact on management education. The findings from forums identified
various issues: the transition to a service and information economy, the impact of
technology, international issues, entrepreneurial issues, diversity, societal values, and
the accelerating pace of world changes. The AICTE also led sessions on the needs of
future managers meeting to assess what changes had been implemented based on
earlier recommendations.
In addition, AICTE is the oldest accrediting agency of degree programs. The
accrediting process is a voluntary review of educational institutions and their
programs, in 1994, the AICTE established minimum accreditations standards for
graduate‘s business school to dispel the perception by industry of weak professional
standards in business programs. The standards were strengthened further to address
admission standards and faculty improvement issues.
The accreditations standards are dynamics for example the revision encompassed
standards that better reflected the NAAC growing membership and focused on
improving professional business education‘s relevance through a greater balance
between strong scholarship and a deeper connection to current business issues.
Moreover, the standard shifted the focus of the business school curriculum assessment
from a quantitative –based input/ output orientation that asked AICTE members
school. - What are you doing? To a qualitative based 72outcomes assessment, which
asked member school to articulate,-What has been accomplished?‘‘.
However, the AICTE also revised its standards in response to external criticism and
competition in which AICTE introduced peer review process and standards that were
linked to institutional members, were made to keep abreast of initiatives introduced by
the first competing accrediting agency.

34
In addition, the AICTE faced resistance on the implementation of some standards by
higher education institution, owing in part to a general resistance to change in higher
education, and the constraints on public institutions in meeting accreditation standards
in the face of decreased government funding.
However, AICTE plays a critical role in the strategic planning in business schools, as
the institution must consider the issues of curriculum content and business school
alliances within the context of accreditations.
Accordingly, the AICTE recently increased the emphasis on the skills development in
its accreditations standards as a complement to its traditional focus on knowledge, this
change in focus reflected the growing importance to employers and employees ability
to measure skills capability for career success. In addition, the AICTE strengthened its
standards with regards to teaching diversity, awareness of ethical and global issues,
and team development.
After the development of letters, it took the form of writing using the palm leaves and
the barks of trees. This also helped in spreading the written literature. The temples and
the community centers formed the role of schools. Later, the Gurukul system of
education came into existence.
The Gurukuls were the traditional Hindu residential schools of learning which were
typically in the teacher's house or a monastery. Even though the education was free,
the students from well-to-do families paid the Gurudakshina which was a voluntary
contribution after the completion of their studies. At the Gurukuls, the teacher
imparted knowledge on various aspects of the religion, the scriptures, the philosophy,
the literature, the warfare, the statecraft, the medicine astrology and the history. This
system is referred as the oldest and the most effective system of education.

35
In the first millennium and the few centuries preceding, there was a flourishing of
higher education at Nalanda, Takshashila University, Ujjain, and Vikramshila
Universities. The important subjects were mainly the art, the architecture, the painting,
the logic, the grammar, the philosophy, the astronomy, the literature, the Buddhism,
the Hinduism, the arthashastra, the law, and the medicine. Each university specialized
in a particular field of study. For instance, the Takshila specialized in the study of
medicine, while the Ujjain laid emphasis on astronomy.
The Nalanda, being the biggest centre, had all the branches of knowledge, and housed
up to 10,000 students at its peak. The British records reveal that the education was
widespread in the 18th century, with a school for every temple, mosque or village in
most regions of the country. The main subjects were the arithmetic, the theology, the
law, the astronomy, the metaphysics, the ethics, the medical science and the religion.
The school had the student representatives from all classes of the society.
The present system of education was introduced and founded by the British in the
20th century, by the recommendations of Macaulay. It has western style and content.
The British government did not recognize the traditional structures and so they have
declined. It is said that even Gandhi described the traditional educational system as a
beautiful tree which was destroyed during the British rule.
The first medical college of Kerala was started at Calicut, in 1942-43, during World
War II. As there was a shortage of doctors to serve the military, the British
Government opened a branch of Madras Medical College in Malabar, which was
under Madras Presidency then. After independence, the education became the
responsibility of the states and the Central Government coordinated the technical and
higher education by specifying the standards.

36
In 1964, the Education Commission started functioning with 16 members of which 11
were Indian experts and 5 were foreign experts. The Commission also discussed with
many international agencies, experts and consultants in the educational as well as
scientific field. Later in 1976, the education became a joint responsibility of both the
state and the Centre through a constitutional amendment.
The central government through the Ministry of Human Resource Development's
Department of Education and the governments at the states formulated the education
policy and planning. NPE 1986 and revised PoA 1992 envisioned that free and
compulsory education should be provided for all children up to 14 years of age before
the commencement of 21st century. Also, the Government of India made a
commitment that by 2000, 6% of the Gross Domestic Product (GDP) will be spent on
education, out of which half would be spent on the Primary education.
In November 1998, Prime Minister AtalBehari Vajpayee announced setting up of
VidyaVahini Network to link up universities, UGC and CSIR. The general marks-
based education system is now being replaced by the grades-based system.
1.9 Higher Education System in India:
Higher Education in India is one of the most developed in the entire world. There has
in fact been considerable improvement in the higher education scenario of India in
both quantitative and qualitative terms. In technical education, the IITs, and in
management, the IIMs have already marked their names among the top higher
educational institutes of the world. Moreover the Jawaharlal University and Delhi
University are also regarded as good higher educational institutes for doing
postgraduates courses and research in science, humanities and social sciences. As a
result, students from various parts of the world are coming today for higher education
in India. India currently produces a solid core of knowledge workers in tertiary and

37
scientific and technical education, although the country needs to do more to create a
larger cadre of educated and agile workers who can adapt and use knowledge …
Measures are also needed to enhance the quality and relevance of higher education so
that the education system is more demand driven quality conscious, and forward
looking, especially to retain In technical education, the IITs, and in management, the
IIMs have already marked their names among the top higher educational institutes of
the world. Moreover the Jawaharlal University and Delhi University are also regarded
as good higher educational institutes for doing postgraduates courses and research in
science, humanities and social sciences. As a result, students from various parts of the
world are coming today for higher education in India. Most of these universities in
India have affiliating colleges where undergraduate courses are being taught.
According to the Department of higher Education, government of India, there are
16,885 colleges, 99.54 lakh students and 4.57 lakh teachers in various higher
education institutes in India.
CONTEMPORARY EDUCATION ISSUES:
Modern education in India is often criticized for being based on rote learning.
Emphasis is laid on passing examinations with high percentage. Very few institutes
give importance to developing personality and creativity among students. Recently,
the country has seen a rise in instances of student suicides due to low marks and
failures, especially in metropolitan cities, even though such cases are very rare. The
boards are recently trying to improve quality of education by increasing percentage of
practical and project marks.
Many people also criticize the caste, language and religion-based reservations in
education system. Many allege that very few of the weaker castes get the benefit of
reservations and that forged caste certificates abound. Educational institutions also can

38
seek religious minority (non-Hindu) or linguistic minority status. In such institutions,
50% of the seats are reserved for students belonging to a particular religion or having
particular mother-tongue(s). For example, many colleges run by the Jesuits and
Salesians have 50% seats reserved for Roman Catholics. In case of languages, an
institution can declare itself linguistic minority only in states in which the language is
not official language. For example, an engineering college can declare itself as
linguistic-minority (Hindi) institution in the state of Maharashtra (where official state
language is Marathi), but not in Madhya Pradesh or Uttar Pradesh (where the official
state language is Hindi). These reservations are said to be a cause of heartbreak among
many. Many students with poor marks manage to get admissions, while meritorious
students are left out. Critics say that such reservations may eventually create rifts in
the society.
Ragging has been a major problem in colleges and students have died due to ragging.
However, ragging is now a criminal offense, and all universities and colleges are
obliged to publicize the penalties for ragging and monitor hostels to prevent ragging.
Expenditure on education is also an issue which comes under the scanner. According
to the Kothari commission led by Dr Vijay Kothari in 1966, expenditure on education
has to be minimum 6% of the GDP. Whereas in 2004 expenditure on education stood
at 3.52% of the GDP and in the eleventh plan it is estimated to be around 4%. The
"sarva shikshan abhyan" has to receive sufficient funds from the central government to
impart quality education.
1.9.2 Technical Education Courses in India:
The courses, which are known as 'technical' in India and therefore come under the
purview of All India Council of Technical Education are - degree and diploma courses
in Engineering, Master degree Courses in Engineering, Master of Computer

39
Application (MCA), Master of Business Administration (MBA), Pharmacy Courses,
Courses in Architecture and Applied Arts and Hotel Management and Catering
Technology Courses.
1.9.3 EDUCATION FOR SPECIAL SECTIONS OF SOCIETY:
Women:
Under Non-Formal Education programme, about 40% of the centers in states and 10%
of the centers in UTs are exclusively for girls. As of 2000, about 0.3 million NFE
centers were catering to about 7.42 million children, out of which about 0.12 million
were exclusively for girls. In engineering, medical and other colleges, 30% of the seats
have been reserved for women.
SC/STs/SBCs and OBCs:
The Government has reserved seats for SC/STs/SBCs in all areas of education.
Special scholarships and other incentives are provided for SC/STs/SBCs candidates.
Many State Governments have completely waived fees for SC/ST students. The IITs
have a special coaching program for the SC/STs/SBCs candidates who fail in the
entrance exams marginally. Seats have been reserved for candidates belonging to
Other Backward Classes as well in some states like Tamil Nadu, Karnataka and
Andhra Pradesh. The struggle for reserving seats for students from OBC categories in
elite institutions like IITs, IIMs and AIIMS and Central Universities is still going on.
The Supreme Court of India is obstructing this reservation for the reason that there has
been no caste-wise census since 1931 and the population share of OBCs cannot be
based on 1931 census. The Department for the Welfare of SC/ST/OBC/Minorities
introduced the SC/STs/SBCs tuition-fee reimbursement scheme in 2003-2004. The
scheme applies to SC and ST students of states and central who are enrolled in
recognized unaided private schools and who have an annual family income of less

40
than Rs. 1 lakh. It provides a 100% reimbursement of the tuition fees, sports fee,
science fee, lab fee, admission fee and the co-curricular fee if the student's family
income falls below Rs. 48, 000 per annum and a reimbursement of 7% if the family
income is greater than Rs. 48, 000 per annum but less than Rs. 1 lakh. The subsidy
provided by the scheme covers between 85% and 90% of the beneficiary's total
running expenses in studying in a private school.
In Maharashtra from 2005-06 to till 2015-16 The Department for the Social Welfare
of SC/ST/OBC/Minorities introduced the SC/STs/SBCs tuition-fee reimbursement
scheme. SC/STs full tution plus Development fee reimbursement if he came from
CAP Round Admission. OBCs will reimbursed 50% of Tution fees only No
Development fee will reimbursed. TFWS was introduced by AICTE which means
Tution fees Waiver scheme. They have to pay only Development fees as they have
came from special and over and above seats to the Institute.
1.9.4 Institutes offering Technical Education in India:
As the technical education courses in India are quite diverse, the number of institutes
providing technical courses in India is also huge. The number of AICTE approved
institutes that offer engineering degree courses in India is - 4,39,689. There are around
1244 institutes in India that offer diploma courses in engineering, 415 institutes offer
diploma courses in Pharmacy, 63 institutes offer diploma courses in Hotel
Management and Catering Technology Courses and 25 AICTE approved institutes that
offer diploma courses in Architecture. The number of AICTE approved institutes that
offer master of Computer Application courses in India is 1012. Likewise the AICTE
also approves institutes from time to time institutes that offer MBA courses,
M.E./M.Tech, Architecture and Applied Arts Courses, Hotel Management and
Catering Technology Courses.

41
Given the importance of technical education in the further development of the nation,
the Government of India is keen on developing some more institutes in the line of
IITs, IIMs and IISCs. The Prime Minister of India has unleashed a plan to establish 8
IITs, 7 IIMs and 5 IISCs to improve the spread and quality of technical education in
the country. These institutes along with various private institutes and foreign technical
colleges have the potential of making technical education accessible to all sections of
society in India without compromising on the quality of education.
1.9.5 Key players in the Higher Education System in India:
The University Grants Commission of India is not only the lone grant giving agency in
the country, but also responsible for coordinating, determining and maintaining the
standards in institutions of higher education. Apart from the UGC here are various
professional councils that are responsible for recognizing courses, promoting
professional institutes and providing grants to undergraduate programmes. They are
All India Council for Technical Education (AICTE), Distance Education Council
(DEC), Indian Council for Agriculture Research (ICAR), Bar Council of India (BCI),
National Council for Teacher Education (NCTE) Rehabilitation Council of India
(RCI), Medical Council of India (MCI), Pharmacy Council of India (PCI), Indian
Nursing Council (INC), Dentist Council of India (DCI), Central Council of
Homeopathy (CCH) and the Central Council of Indian Medicine (CCIM) are the
statutory professional councils of India. India has one of the largest 'Higher Education
System in the world. Main players in the higher education system in the country are:
University is responsible for coordination, determination and maintenance of
standards, release of grants. Professional Councils are responsible for recognition of
courses, promotion of professional institutions and providing grants to undergraduate
programmes and various awards. Central Government is responsible for major policy
42
relating to higher education in the country. It provides grants to the UGC and
establishes central universities in the country. The Central Government is also
responsible for declaration of Educational Institutions as 'Deemed to be University' on
the recommendation of the UGC. Presently there are sixteen (18) Central Universities
in the country. In pursuance of the Mizoram Accord, another Central University in the
State of Mizoram is planned. There are 99 Institutions which have been declared as
Deemed to be Universities by the Govt. of India as per Section of the UGC Act, 1956.
State. The Industry-Oriented Engineering EducationEngineering has no doubt,
progressed in the last 150 years. The commercial airplane, personal automobile, and
the computer are some of the marvels that engineers have produced. Engineering
pedagogy and curriculum have unquestionably changed as well. I recently skimmed
through a book written in 1918 by Charles Riborg Mann on the subject of engineering
education, highlighting the present conditions, current problems, and suggested
solutions for engineering education. Among the problems, Mann lists admission, time
constraints, course content, testing and grading, and shop work as main sections for
discussion. As we enter 2015, we continue to see the same repeated discussions as 100
years prior. [1]In the compilation, Educating the Engineer of 2020: Adapting
Engineering Education to the New Century published by the National Academy of
Engineering, a discussion ensues about the outlook of engineering education. In a
section entitled, “Pursue Student-Centered Education,” it is stated that “one should
address how students learn as well as what they learn in order to ensure that student
learning outcomes focus on the performance characteristics needed in future
engineers. Two major tasks define this focus: (1) better alignment of engineering
curricula and the nature of academic experiences with the challenges and opportunities
graduates will face in the workplace and (2) better alignment of faculty skill sets with

43
those needed to deliver the desired curriculum in light of the different learning styles
of students.” It is a continual struggle to define what the “best” approach to educating
engineers is. Will that come with improved curriculum? Better grading? Or does the
key lie in how we assist students in drawing meaning and significance from their work
thus motivating them to continue to pursue engineering with excellence? We believe
that reflection plays a vital role in helping students to draw significance and
understanding from their rigorous studies.
Even as we continually make strides towards improving engineering education, we
will still ask similar questions as Professor Mann in 1919, “Do we need fewer or more
schools? Is the curriculum too long or too short? Should the engineering school be
made a graduate professional school? What are the present demands of science, of
industry, and of education? How well are the schools meeting these demands? What
changes, if any, seem desirable?”
Governments are responsible for establishment of State Universities and colleges, and
provide plan grants for their development and non-plan grants for their maintenance.
India is today one of the fastest developing countries of the world with the annual
growth rate going above 9%. In order to sustain that rate of growth, there is need to
increase the number of institutes and also the quality of higher education in India.
Therefore the Prime Minister of India has announced the establishment of 8 IITs,
seven Indian Institutes of Management (IIMs) and five Indian Institutes of Science,
Education and Research (IISERs) and 30 Central Universities in his speech to the
nation on the 60th Independence Day. The outlay for education during the 11th Five
Year Plan, which runs from the current fiscal to 2012-13, represents a four-fold
increase over the previous plan and stands at Rs 2500 billion. The thrust of the policy
underlying the Eleventh Five Year Plan for Higher Education is on increasing access
44
to quality higher education while ensuring equity. A new Scheme for Reduction in
Regional Imbalances, Social Gaps and Promotion of Inclusiveness in Higher
Education has been introduced by the University Grants Commission (UGC) in the XI
Plan, which will serve the rural and tribal areas as well. Central Universities have been
established in all the states in the North-Eastern Region including in states with
predominately tribal population. In addition, during the XI Plan a Central University
will be established in each of those states where there is no Central University. 374
new colleges are proposed to be established one in each district where the Gross
Enrolment Ratio (GER) is lower than the national average. In the XI Plan, a target has
been set to increase the GER of students in the eligible age group of 18-24 years in
higher education by 5 percentage points by the end of the Plan. Provision for
infrastructural and other requirements for this purpose is required to be made by
Central and State Governments. (Arunachalam, P., 2010
1.10 Financing higher education in India:
Higher education in India is primarily funded by the government – central or state
governments and the households. An optimal level of funding is required for
maintenance of reasonable standards of higher education. This may vary across subject
areas and across the country. However, with a view to estimate the overall requirement
of funds for higher education, an average unit cost of Rs.60000 per annum per student
is taken. Based on this norm, for an enrolment of 10.48 million, an annual expenditure
of Rs.628.8 billion is desired on higher education in India. Additional funds are
required for new infrastructure and facilities for expansion of enrolment. Further,
living and transport expenses are borne by the students and parents directly.
Access and Equity:The Central Government is conscious of the need to raise both the
enrolment rate and access to higher education to all who deserve irrespective of class,
45
caste, religion, gender or economic status. In the last plan period enrolment rate has
gone up form some 6% to 10%and the 11th Plan it is proposed to raise it 15 percent. 30
new Central Universities, 8 new IITs, 20 new IIITs and 7new IIMs, and several high
grade Medical Institutes are proposed to be established during the next plan period,
and one degree college would be established in each district of the country. The Prime
Minister has invited private sector participation in this venture. Knowledge
Commission, which was established at the suggestion of the present Government, has
submitted its first report on Higher Education and is under scrutiny for implementation
by the Government. There are proposals for improving access to quality higher
education to disadvantaged groups in the population (Moily Committee and Sachar
Committee reports). The Indian Prime Minister in his Independence Day speech on
15th August 2007 said, “We will also ensure that adequa te numbers of colleges are set
up across the country, especially in districts where enrolment levels are low. We will
help States set up colleges in 370 such districts. The University system, which has
been relatively neglected in recent years, is now the focus of our reform and
development agenda. We will set up thirty new Central Universities. Every state that
does not have a central university will now have one. In order to promote science and
professional education, we are setting up five new Indian Institutes of Science
Education and Research, eight new Indian Institutes of Technology, seven new Indian
Institutes of Management and twenty new Indian Institutes of Information
Technology. These will generate new educational opportunities for our youth.
Against the desired expenses of Rs.628.8 billion on higher education, the government
spends around Rs.290 billion per year. This figure has been arrived at on analysis of
the budgeted expenditure on education by the government for the year 2014/15. The
budget estimate – 2014/15 for higher education (including technical education) for the

46
central government and the state governments taken together was Rs.231.4 billion.
Taking into account an increase of five per cent per year as per historical rate of
increase, this is estimated at Rs.245 billion during the current year. It is estimated that
the government spends another Rs.65 billion every year on post-secondary education
in the agriculture and the health sectors. Altogether, the central and the state
governments spend Rs.290 billion per year on higher education in India.
With the landscape for higher education changing rapidly, one cannot think of a stable
funding structure for higher education. The future of financing higher education
cannot be merely an extension of the present but shaped by new realties, such as
massive growth in enrolment, new mechanism of cost sharing, the appearance of new
cross-border suppliers, the emergence and growth of different types of public and
private higher education providers, distance education and many other innovations.
Consistent with these realties, new and flexible ways of tackling financing issues in
higher education have to be found. This would require alternative policies and
mechanisms to provide answers to these challenges. (Sanyal, C. B. & Martin, M.,
2006) have identified the following seven key factors that would affect the new
funding trends for higher education:
a. The massive expansion of enrolment;
b. The incapacity of the state to fund such an expansion;
c. The vigorous emergence of the private higher education;
d. The tendency to cost sharing by students and their parents;
e. The importance of accountability;
f. The emergence of new providers; and
g. The need for funding by the states to reduce growing inequalities in access.

47
CHAPTER TWO
LITERATURE REVIEW
Financing of education has been a matter of great concern and major policychallenge
across all the countries. A country’s education sector competes for public resources with
all other sectors and has been a competition for resources with in various sub-sectors of
education. There was a time when the educational development of a nation occurred
exclusively with the availability of public resources and the private participation was not
considered that much necessary and a good practice. The governments were having
sound budgets and providing sufficient resources to the education sector, at least, up to
the elementary and secondary levels. The present day advanced economies and even the
newly industrialized countries of East Asia have developed their human resources with
the strong backing of the public funds. However, the situation changed considerably with
the advent of economic reforms under the so-called neo-liberal policies. As a
consequence, the education sectors of many counties were opened up for the private
sector on the massive scale. It has brought up the issues of rising costs, cost recovery and
financing of education on the forefront of any discussion related to the education sector.
For the past many years, not only in India, but also across the world, public expenditure
on higher education has been declining at least in real prices as in relation to state
incomes and budgets. The decline in public expenditure on higher education has emerged
as a global crisis of higher education sectors and is the most noticeable trend. Compelled
by economic reform policies or conceived of the rationale for reduced role of the state in
funding higher education, most countries have inflicted serious cuts in public budgets for
higher education. This trend exist in many countries, in some or all of the areas related to
education: total public expenditure on higher education, per student public expenditure,
public higher education expenditure’s hares in relation to a particular country’s national

48
income or total government expenditure, and allocation in absolute and relative terms to
the important programmes that include research, scholarships and so on. Recognizing the
importance of education in national development, high priority will continue to be
accorded to expansion of education, significantly improving the quality of education
imparted, and ensuring that educational opportunities are available to all segments of the
society. Key education development priorities Owlia and Aspinwall (1998a) have
suggested a revised framework for service quality dimensions which consists of 19
quality characteristics grouped into four attributes namely academic resources,
competence, attitude and content. This frame work could be used for measuring and
improving educational service quality. (St. John Edward P., 1994) College costs are
extremely controversial. St. John explains why and assesses differing financial strategy
contributions and deterrents to the major issues in higher education finance, one of the
most important being how to mediate the negative effects of increased
privatization.Awareness for higher education among society: Towards the end of 19th
century, many visionaries and educational leaders contributed for the “Education
revolution” in the State. This helped to spread the awareness of 93 importance of
education across the entire social fabric of the state. These visionaries promoted Institutes
of high learning in Mumbai and Pune. The subsequent growth of education in these
regions, helped to boost more awareness among the people.
It is generally argued that the fees of various courses in Technical courses are exuberantly
high. Earlier dual fee structure under ‘the Free and Payment seats’ was well accepted by
the society and remained in existence for a long period. This scheme however created a
partition of meritorious students and rich students in the society. After the judgment in
the case of T.M.A. Pai, the principle of ‘cost-based-education’ is now gaining the
acceptance by the society. The sample of institutes charging higher range of fees. It is

49
evident from the table, which shows that candidates as well as parents are opting for the
Quality Education and in spite of higher level of fees in these institutes as the figures
under the column count indicates no. of options opted by the students for that Institute. It
may be also noted that majority of these institutes have been accredited by the National
Board of Accreditation. This shows that the students and parents, both the stakeholders,
are aware of the accreditation and hence quality of education. Most of these institutes are
having standing of almost more than 20 years. Majority of these institutes are located in
Mumbai and Pune region. This adds to our belief that the geographical location definitely
matters to the choice of institute. Those who do not have the accreditation as well as long
standing have earned the reputation through quality consciousness, excellence of
infrastructure and faculty which reflects in the inclusion of these institutes in
sample of institutes charging higher range of fees. These institutes have either NBA
accredited or having long standing in the society and all these institutes are located in
Mumbai and Pune. In addition to this, these institutes recruit faculty from corporate field
which enables students to explore to the practical world. This fact again endorses that
quality education is available in this region. It also shows the sample of institutes
charging lower fees. Like Engineering, due to the fact that these institutes are not
accredited and having reasonable standing, they are not able to attract students by virtue
of their lower fees. Further this may also be due to non attractive pay packages in the
placement of these institutes. Since T.M.A. Pai Judgement, Institutes are permitted to
decide their fees based on the cost of the education. Therefore, every Institute is having a
different fee structure. Course wise minimum and maximum fees range of fees for every
course is also shown. One of the parameters for deciding fee is the actual number of
students on role. Therefore, trusts /societies should come forward to increase their
sanctioned intake so as to reduce the cost of education per student. According to him,

50
attempts can be made to mobilize non-governmental resources from students in the form
of marginal increase in fees, student loan programs can be revitalized to generate some
resources, and attempts may be made to augment resources from the private corporate
sector by forging effect university- industry relations. Tilak cautions that these measures
can be successful only if the government does not reduce its role in funding higher
education significantly and if none of the measures aim to reduce the demand for higher
education. (Patrinos, Harry Anthony & David Lakshmanan Ariasingam, 1997) defines
demand-side financing in public education as the mechanisms through which public
funds are channeled directly to the individual or institutions based on some expression of
demand. Examples of such mechanisms include vouchers, public assistance to private
schools, targeted bursaries etc. The authors review World Bank projects in the mid-1990s
that included demand-side financing components. (Altbach, Philip G. (Ed.), 1999)
examine the parameters of private higher education worldwide. Altbach outlines the
perspectives on private higher education: themes and variations, issues and trends. Levy
explores the diversity of private higher education by analyzing the formulation of
isomorphism. Although the book is mainly about private higher education in Latin
America, the private sectors in other countries including India, the Philippines, Malaysia
and Hungary are also discussed. (Tilak, Jandhyala B. G. & Geetha Rani (Eds.), 2000)
consists of a selection of papers presented at a National Seminar on Education Finance,
organized by the National Institute of Education Planning and Administration (NIEPA).
In the first chapter “Pattern of Financing Education”, Jandhyala Tilak provides a detailed
statistical and analytical profile of various public education expenditure trends in India
.The report of (Independent Committee of Inquiry into Student Finance, 2000) known as
the Cubie Report, discusses the findings of a study that reviewed tuition fees and
financial support for students normally residents of Scotland, who were participating
51
either part- or full-time in further and higher education courses elsewhere in the UK. The
purpose of the report is to make recommendations for changes to the current system that
would promote access to higher education, particularly for those groups currently
underrepresented. The impact of the crisis on higher education is analyzed at the
household, institutional and macro levels. (Varghese, N. V. , 2001) is based on an
International Institute for Educational Planning Policy Forum in 2001. The first paper by
Varghese provides an overview of the major changes in the higher education sector in
selected countries stemming from the economic crisis in East Asia. The other two papers
analyze the crisis and its impact on higher education in Indonesia and Korea. In general,
these changes include: 1) increases in student drop-out rates, 2) shrinking of private
universities, 3) decreases in study-abroad fellowships, 4) regulation changes, 5) inflows
of study-abroad students, and 6) budget cuts in many universities.
The higher education institutions, rather than the federal government, should provide
student loan guarantees. (Archibald, Robert B., 2002) given detailed Such a switch would
provide institutions with more incentive to provide a good education, and would cause a
saving in federal aid spending that could be applied to increasing Pell Grants for students
from lower income families.The colleges and universities are diversifying their revenue
streams, examines how they are doing so, and synthesizes the research on decision-
making processes regarding new revenues. (Hearn, James C., 2003) is explained the
revenue-seeking efforts are investigated in eight domains: 1) instruction, 2) research and
analysis, 3) pricing, 4) financial decision making and management, 5) human resources,
6) franchising, licensing, sponsorship, and partnering arrangements with third parties, 7)
auxiliary enterprises, facilities and real estate, and 8) development. The author asserts
that revenue diversification efforts should not only generate new revenues, but also
generate new net returns. When pursuing new revenues one must deal with the question

52
of why new revenues are being sought. This report is a good reference for leaders of
higher education institutions. Tan and Kek (2004) have provided SERVQUAL model and
Satisfaction Grid analysis to find an immediate action requirement for improvement.
The twenty-year evolution of the United Kingdom’s higher education finance system
from one financed almost exclusively by the government and taxpayers to one with
significant Student/ family financial contributions. (Barr, Nicholas, 2005) He examine the
changes leading up to the highly-contested 2004 legislation that abolished up-front tuition
fees and introduced a scheme that allows students to defer their contribution to the cost of
their courses until after they have graduated in terms of two key elements – the proper
design of student loans and the role of regulated market forces.
To find plausible answers to the ongoing policy debate about financing higher education
through public subsidies versus student loans. It focuses specifically on the financing of
collegiate education, which is part of general higher education. (Narayana, M. R. , 2005)
This study provides interesting data about the development of student lending in India, as
well as the structure of higher education finance. The results of this study imply that the
student loan may not be a perfect substitute for budgetary subsidies to the poor but
deserving student in collegiate education. Thus, the paper recommends a mix of
governmental and private funds in supporting students through collegiate education.
A comprehensive paper on higher education in India that provides an overview of its
structure, the regulatory environment in which it works, its financing and other important
issues including governance, academics and technology. (Agarwal, Pawan, 2006) It
argues that while the higher education system (particularly the private sector) in India has
expanded rapidly over the last 20 years, it has done so with little regulation and
decreasing standards in all but a few quality institutions. Moreover the expansion in
enrolments has taken place at a time when public funding has declined (in real terms) and

53
public universities have started to charge higher tuition fees. These changes have had a
negative impact on access for the poor given the absence of substantial student financial
aid programs. The paper consolidates a number of recommendations into a broad
framework for action. Within this framework it identifies several strategies for making
higher education affordable and accessible to everyone including the introduction of an
income contingent loan program and the establishment of a Social Equity Fund that
would administer financial aid programs for poor students.
Two interrelated facets of Higher Education policy in India: the key distortions in higher
education policies and what explains them. It first sets the stage by laying out the
principal conceptual issues that need to be considered when thinking about an appropriate
policy framework for higher education in India. (Kapur, Devesh & Pratap Bhanu Mehta,
2007) It then examines three key distortions in Indian higher education with regards to
markets, the state and civil society (philanthropy). The next part of the paper examines
the political economy of Indian higher (tertiary) education and seeks to explain the
ideological and political underpinnings of these distortions and how they work in
practice. The authors conclude with some indicative some policy directions for Indian
higher education. The purpose of this exercise is not to make detailed policy
recommendations, but rather to flag the kinds of issues that ought to be addressed.
Mahapatra and Khan (2007) have demonstrated an Educational model for the
measurement of the quality of education in engineering institutions. The Indian higher
education system is presently facing several challenges. The challenge of global
competitiveness has been added to other demanding tasks such as access, equity,
relevance, quality, privatization and internationalization in the face of a resource crunch.
(Ved Prakash, 2007) This article gives an overview of trends in the expansion of higher
education and examines variations in participation across states, gender and social

54
groups. An attempt has also been made to discuss the trends in the financing of higher
education and the required resources to meet the target of allocating 6 per cent of the
GDP to education. It argues that without appropriate policy interventions in school
education, it would be of little use to have interventions at the higher educational level,
which discriminate in favour of girls, SCs and STs. Quality is very much essential today
for the institutions, programmes and teaching for the reasons as mentioned by Mishra
(2007). The advancements in technology necessitated starting new courses in the new and
emerging areas to cater to the needs of industry and society. Therefore, the permission to
the non-aided institutes was granted for the courses in new and emerging technologies.
Thus, non-conventional degree and diploma courses titled Industrial Electronics,
Computer and Information Technology, Petroleum and Polymer, Biomedical
Engineering, Construction Technology, etc. were granted permission. Similarly, diploma
courses such as Leather Technology, Packaging Technology, Foundry Technology, Tool
Design, Plastics and Polymer Engineering, etc. are also started through Government
institutions under the World Bank assisted project.
The nature of the shift from viewing higher education as a public good to a private,
tradable commodity and its dangerous implications. Basically higher education is a public
good; it is also recognized as a merit good. Besides being a public good in itself, it
produces several public goods. The public goods that higher education produces, shapes
and nurtures are also diverse. (Tilak, Jandhyala B. G., 2008) had explained the social
purpose it serves, the nation-building role it performs, the public good nature and the
human right nature of higher education—all these dimensions are very closely related,
and they need to be considered as fundamental and non-compromizable principles in the
formulation of public policies relating to higher education.Globalization has redefined the
constituents and drivers of economic progress over last two decades. The traditional

55
contributors of economic development and economic power such as material resources
and production capabilities have been replaced by knowledge and information.
Globalization has resulted in significant changes in the knowledge economy and ushered
new conditions for the provision of higher education to cater the skill requirement all
across the globe. (Mishra, Jitendra Kumar et al., 2008) is mentioned Higher educational
services have emerged over the last few years as a major economic sector for trade worth
several billion dollars. The key elements of globalization include the knowledge society,
information and communication technologies, the market economy, trade liberalization
and changes in governance structures. The bias against reform means that real reform will
not come from within higher education. Reform will have to come from the outside. As
in a nuclear arms race, actors—in this case, individual colleges and universities—cannot
reform unilaterally. Serious cost control efforts will damage reputations in the short run
and make it more difficult to recruit both gifted students and gifted faculty. (Martin,
Robert E., 2009) had reform effort will have to be industry-wide, and that can only come
from the outside.Finally, the revenue-to-cost spiral suggests that cost control reform must
be a prior condition for any increase in higher education funding. If it is not, the increased
funding will simply drive costs higher, returning little social benefit. But cost-control
reform should not be all stick and no carrot—pay for performance should be a part of
cost-control reform, and an institution’s reward for successful cost-control reform should
be increased funding.It is unambiguous that Policy of the Government of India now
encourages augmentation of resources for covering a larger portion of cost of higher
education. Recent policy changes in India often favour to divert resources from higher to
primary level of education and favours for full cost recovery from students even in public
higher education institutions. Cost recovery measures comprising of increase in fees,
student loans currently operated by commercial banks and privatization will exacerbate

56
inequality in the society. (P. Geetha Rani, 2010) Indeed, there seems to be a nexus
between the present student loan scheme and full cost recovery. Increasing reliance on
student fees, student loans and privatization without considering the low-income groups
may produce regressive effects in the society. Under the deep waves of globalization and
competition, important economic rationale for government funding especially for higher
education is neglected. Education assumes significance as a provider of input for
economic, political and social development, besides as a source of knowledge. (Dr. S.
Puttaswamaiah, 2010) given views regarding Economic growth in recent years has been
based on availability and quality of knowledge in any country, which in turn depends on
access and affordability to education. Hence, importance of education has increased to
supply adequate and qualitative human capital. Functioning of education sector depends
on availability of various resources, of which to a large extent on financial resources.
Finances for education are mobilized from different sources like government spending,
fees, educational loans, and others. The growth of management institutions in India in last
15 years has been rapid. (Havaldar, Krishna K., 2011) has been explained that India has
2000 B-Schools, awarding MBA degrees, or an equivalent and often, more valuable post-
graduate diplomas (like those given by IIMs). It is heartening to find two management
institutes from India, the Indian Institute of Management, Ahmedabad (IIMA) and the
Indian School of Business, Hyderabad, are placed 11th and 13th in the global ranking of
2011 by Financial Times. This study addresses various issues associated with different
categories of management institutions operating in India. Some of the major issues are:
the quality of the faculty, students and facilities; pedagogy and recognition; research
outputs, executive training, and placement and brand equity. These issues are then
analysed with respect to different categories of business schools in India : (1) top 30
government and private B-Schools, including (IIMs), (2) university departments of

57
management studies, (3) private autonomous B-Schools approved by All India Council of
Technical Education (AICTE),(4) university affiliated private colleges, (5) private
institutions not affiliated to any universities nor approved by THE AICTE, (6) private
institutes in collaboration with foreign universities. There is a need to contemplate what
India will need in 2025. Management education in India in 2011 is not what it was in
1950s. Top management institutes’ future should not be what we can learn from Harvard
Business School. It should be what they can learn from us. (Anjum, Dr. Bimal & Rajesh
Tiwari, 2012)explained the data is analyzed to investigate the reasons for large number of
vacant seats in professional colleges. The last two decades had witnessed unprecedented
growth in institutes of higher education primarily due to private sector participation. The
private sector is expected to provide useful contribution in achieving the target of 30%
GER by 2020 set by government of India. Though the private institutes have grown in
number they are not able to attract the high ranking students. The issues of quality,
access, equity, inclusiveness require urgent attention of the stakeholders. Un-
employability of graduates is a cause of concern. Large number of vacant seats in self
financing colleges is threatening the financial viability of these institutions. Proper
regulatory framework supported by mutual trust and accountability is important for the
establishment of vibrant global private higher education institutions which can ensure
quality, access, and inclusiveness.India’s education system is often cited as one of the
main contributors to the economic rise of India. The size of India’s higher education
market is about $40 billion per year. Presently about 12.4 percent of students go for
higher education from the country. If India were to increase that figure of 12.4% to 30%,
then it would need another 800 to one thousand universities and over 40,000 colleges in
the next 10 years. (Gupta, Deepti & Navneet Gupta, 2012) also presents the key
initiatives by the government and recommendations to meet these challenges. In this
58
paper authors have presented the development and present scenario of higher education in
India by analyzing the various data and also identify the key challenges like demand-
supply gap, quality education, research and development and faculty shortage in India’s
higher education sector. In this paper also identified the key initiatives from the
government side which include the establishment of NCHER, independent regulatory
authority for accreditation and national database of academic qualification, increase in
number of universities including IITs, IIMs, NITs and SPAs during 11th five year plan
and increase in the number of seats in existing institutions, and passing of the Right of
Children to Free and Compulsory Education. Looking to the present scenario of the
higher education in India we recommended some points in order to further meet the
challenges.The several basic characteristic features of higher education, such as higher
education as a public good, merit good, social investment, and as a human right are under
attack. Recent evidence shows that many universities are experimenting with cost
recovery measures, generating resources from student fees, and other non-governmental
sources. The effects of these cost recovery measures on the quantity, quality and equity in
higher education need to be examined for sound policy making. (Tilak, Jandhyala B. G. ,
2012) mentioned a quick review of some of these arguments being made in favour of and
against public financing of higher education and restated how important it is for the state
to finance higher education. It is argued that significant reduction in public subsidies to
education is neither feasible, nor desirable, even if feasible. The rising cost of higher
education is a topic of large concern today. As tuition prices continue to grow at a
quicker pace than housing prices, consumer prices and average hourly wages, it is
becoming harder and harder for the average American family to afford going to college.
What factors have been driving this large rise in tuition prices? This thesis aims to set up
a supply and demand framework to analyze the various forces that may be driving the

59
price of higher education to rise above the Consumer Price Index over time. (Li, Helen,
2013) defining long-run supply and demand for the higher education market, this thesis
addresses economy-wide factorsand summarizes the findings of Robert Archibald and
David Feldman in Why Does College Cost So Much?. Next, this thesis examines higher
education-specific factors and specifically tests thehypothesis: The long-run supply curve
for higher education’s is theoretically vertical. Theinability for supply to meet the
increasing demand for higher education results in a supply anddemand imbalance that
drives up the price of higher education. After looking at both economy wideand higher
education-specific factors, it is apparent that slow productivity growth and largewage
increases for professors (cost disease) and an unresponsive total enrolment (supply) in
theface of rising demand are largely driving the increase in the price of higher education.
In order tocurb this rising prices, his thesis will offer a few policy implications and
recommendations.Namely, online education and “blended” courses may offer viable
solutions to increase theproductivity of professors and increase total enrolment at
institutions. The higher education scenario in India and attempts to point out why very
few serious investors invest in higher educational sector. Several factors are responsible
for this. Primary among these are the legal and legislative hurdles in several states.
(Dhanuraj, D. and Kumar, Rahul V., 2015) It is also seen that the bad precedent set by
the existing institutions dissuade serious investments. The education agenda beyond 2015
requires increased and well targeted financing and effective and efficient utilization of
allocated funds. The Central and State governments have been making efforts to provide
adequate and equitable financing to educational priorities. Furthermore, coordination,
monitoring and evaluation will be improved to ensure that the available funds are used
efficiently and effectively, and with measurable outcomes and impacts for children and
youth, in particular, and socio-economic development, in general. These factors have led

60
to specific problems for serious investors in this sector in India. The paper identifies these
problems and suggests that a possible change in perception towards higher education
would be most desired in the current picture. Public funding has its own limitations and
constraints in a diverse and vast nation leading to resources being spread thinly if the
objective of massive expansion in enrolment with equity is to be fulfilled. Public funding
cannot keep pace with rapidly rising costs of higher education. (Themes & Question for
Policy Consultation on Higher Education, 2015) given expansion of student numbers has
presented a major challenge which combined with the goal of inclusivity has aimed to
provide access to all sections and thereby operate a highly subsidized tertiary education.
In financial terms, this has become an unsustainable model. Traditionally, education has
been seen as a public good, contributing to society through educating citizens, improving
human capital, and boosting economic development. Funding shortages due to
“massification” have also meant that higher education system and institutions are
increasingly responsible for generating larger percentages of their own revenue.
It is widely recognized that higher education promotes social and economic development
by enhancing human and technical capabilities of society. Technical change and
institutional change are key components of development. Higher education plays an
important role in facilitating these changes by incorporating all of the various
demographics of the population.
Higher education has been found to be significantly related to the human development
index and greater for the disadvantaged groups (Joshi, K. M. , 2006). Similarly, the lack
of such education causes the inverse to occur, i.e. the greater the level of higher education
in a society, whether in stock or flow forms, the greater the level of human development
can be, through its influence on two main components of human development index: life
expectancy, and GDP per capita (Tilak, J. B. G., 1994). In its size and diversity, India has
61
the third largest higher education system in the world, next only to China and the United
States. The higher education system in India grew rapidly after independence (Agarwal,
Pawan, 2006). Today, Indian higher education is comprised of 33,657 institutions, made
up of 634 universities and 33,023 colleges; it is the largest higher education system in the
world in terms of the number of institutions. With the changing demographics, political,
philanthropic and economic environment, the objective of higher education has now a
more focused attention on access and equity. The Indian higher education has seen three
phases of funding, philanthropic to public, and then to private financing. The changing
financing patterns have altered regulations, equity, efficiency and quality aspects of
higher education. (Joshi, Dr. K. M. & Ahir, Dr. Kinjal Vijay, 2013)Higher education in
India is primarily funded by the government – central or state governments and the
households. An optimal level of funding is required for maintenance of reasonable
standards of higher education. This may vary across subject areas and across the country.
However, with a view to estimate the overall requirement of funds for higher education,
an average unit cost of Rs.60000 per annum per student is taken. Based on this norm, for
an enrolment of 10.48 million, an annual expenditure of Rs.628.8 billion is desired on
higher education in India. Additional funds are required for new infrastructure and
facilities for expansion of enrolment. Further, living and transport expenses are borne by
the students and parents directly.
Against the desired expenses of Rs.628.8 billion on higher education, the government
spends around Rs.190 billion per year. This figure has been arrived at on analysis of the
budgeted expenditure on education by the government for the year 2004/05. The budget
estimate – 2004/05 for higher education (including technical education) for the central
government and the state governments taken together was Rs.131.4 billion. Taking into
account an increase of five per cent per year as per historical rate of increase, this is

62
estimated at Rs.145 billion during the current year. It is estimated that the government
spends another Rs.45 billion every year on post-secondary education in the agriculture
and the health sectors. Altogether, the central and the state governments spend Rs.190
billion per year on higher education in India.It has decided to focus more on the student
related financial aspects in the context of Higher Education (with special reference to
Technical Education Institutes in and around Pune, the major educational hub in
India)The success of any research study depends on the extent to which the advances,
both empirical and the theoretical have been, made by the previous researchers and
authors. Since survey of related literature helps us to show whether evidence already
available solves problems adequately without further investigation and thus may also
suggest the method of research appropriates.
Therefore it has been thought to be appropriate to shift the relevant facts regarding the
present study from the mass of research evidence to this chapter so as to formulate the
proper objectives in order to provide an outline for the successful execution of the
investigation.Research literature related to engineering education, that has been identified
under the present research problem may be classified as per given below:
Issues related to General Growth and Development at the National Level
Issues related to General Growth and Development at the Punjab Level
Issues related to Quality
Issues related to Equity
Issues related to Financing
Issues related to Placement
This framework has been used for classifying the available related literature and the
studies that have been completed over the years in the field of engineering education and
are surveyed in the present review report.

63
According to Government of India Report (1964) the development of human resources in
the form of properly trained scientists and engineers has been the most essential
prerequisite for sustained industrialization. This has led to the massive expansion of
technical/ engineering education in India up to the highest levels. According to Council
of Scientific and Industrial Research’s (CSIR) report (1984-1989) India was exploited by
the Britishers before independence for their own interests. They have not taken any
interest in the establishment of engineering institutions in the country. But after
independence, there has been tremendous growth in engineering institutions. A total of 46
engineering and technology institutions were established by the time India attained
independence in 1947. Most of them were having only bachelor’s degree level
programmes. Four of them had Master’s degree level programmes also. However none
offered the Doctorate degree Programme. Soon after independence India launched a
Programme both for expansion and diversification of engineering and technology.
Education In the 18 years between 1947 and 1965 the number of engineering and
technology institutions increased 3 fold. Between 1950 and 1965 on an average, 6 new
institutions were established each year. Between 1965 and 1983, there occurred a
doubling of engineering institutions. More than 20 engineering institutions were added
each year between 1980 and 1985. In 1989 there were 383 institutions offering various
types of tertiary level courses in engineering. Majority of them (372/383), offered
bachelor level engineering education. A total of 143 institutions including the 11 which
did not offer the bachelor level courses were giving either master’s level degree courses
or post graduate diploma courses in engineering. Seventy four institutions offered
doctorate level courses. According to Chatterjee (1986) only an industrialized economy
can provide sufficient resources for the balanced satisfaction of wants of all sections of
society and engineering education can play a very significant role in this regard. Chugh
64
(1992) and Sonda (1998) prove that with the impact of information technology and
integration among the nations the importance of engineering education has increased
much. Chugh lists three significant opportunities for India in the emerging scenario if it
can produce required number of engineers & technocrats.Financing of education has been
a matter of great concern and major policy challenge across all the countries. A country’s
education sector competes for public resources with all other sectors and has been a
competition for resources within various sub-sectors of education. There was a time when
the educational development of a nation occurred exclusively with the availability of
public resources and the private participation was not considered that much necessary and
a good practice. The governments were having sound budgets and providing sufficient
resources to the education sector, at least, up to the elementary and secondary levels. The
present day advanced economies and even the newly industrialized countries of East Asia
have developed their human resources with the strong backing of the public funds.
However, the situation changed considerably with the advent of economic reforms under
the so-called neo-liberal policies. As a consequence, the education sectors of many
counties were opened up for the private sector on the massive scale. It has brought up the
issues of rising costs, cost recovery and financing of education on the forefront of any
discussion related to the education sector.
For the past many years, not only in India, but also across the world, public expenditure
on higher education has been declining at least in real prices as in relation to state
incomes and budgets. The decline in public expenditure on higher education has emerged
as a global crisis of higher education sectors and is the most noticeable trend. Compelled
by economic reform policies or conceived of the rationale for reduced role of the state in
funding higher education, most countries have inflicted serious cuts in public budgets for
higher education. This trend exist in many countries, in some or all of the areas related to
65
education: total public expenditure on higher education, per student public expenditure,
public higher education expenditure’s shares in relation to a particular country’s national
income or total government expenditure, and allocation in absolute and relative terms to
the important programmes that include research, scholarships and so on. The decline is
not confined
to developing countries, though it is more prevalent in the developing than that in the
developed countries. There has been a significant fall even in the advanced countries such
as the United Kingdom, Australia and New Zealand. But the higher education sector
generally suffered much in the high income countries. However, the decline was steep in
some countries such as Botswana, Jamaica, Hungary and New Zealand (Tilak, 2006).The
financing of higher education is a matter of great theoretical and empirical debate. The
nature, extent and mode of participation of public funds in the education sector involve a
long list of arguments put forward by individual scholars and institutions. As reported
earlier (Chapter 1), these arguments mainly revolve around the ‘public good’ nature of
higher education, dynamic externalities produced by it, its role in achieving equality of
opportunities, and economies of scale (Blaug and Woodhall, 1979; OECD, 1990; Tilak,
1993a; 1997b). However, several arguments have also been cited against the public
subsidization of higher education. These arguments essentially revolve around three
parameters: (a) inefficiency; (b) iniquitous; and (c) pragmatic nature of these
grants/subsidies.
Many research studies show that the benefits of higher education are largely appropriated
by the students belonging to the upper and middle income groups, and those who
belonged to the forward communities. Thus, the benefits of liberal government
grants/subsidies are largely cornered by the already rich sections of society, whereas the
tax receipts, particularly from the indirect taxes - the stable tax resources of state – used

66
to finance higher education expenses mainly fell on the lower income groups. It can be
safely stated that the higher education of privileged sections of society is liberally
financed out of the revenue extracted from the poor and such a policy is bound to be
perpetuating educational and income inequalities in the society (Psacharopoulos, 1994;
World Bank, 1994; Psacharopoulos, 1997; Mingat and Tan, 1986; Jimenez, 1987, 1994;
World Bank, 2000).However, the debate of increasing grants/subsidies on one hand or
right-sizing/no grants/subsidies to higher education on the other hand has been
intensifiedrecently (Hinchiffe, 1993). In the absence of public grants/subsidies, it is
suggested that the cost of higher education should be extracted from the beneficiaries
(students) or financed from the alternate sources like the endowments, industry, charity,
etc. Since the professional education requires huge finances to establish and run the
infrastructural facilities, therefore, costs and financing practices have attained a great deal
of attention of policy makers and academia. Keeping in view the high cost of higher
professional education and financing practices adopted by the students, the present
chapter divides the review of literature into two parts. First, the studies related with the
measurement of cost of higher education both recurring and non-recurring cost; and
second, with the source/s of financing of such education.The cost of delivery of
education determines the resource requirements of an education sector. The cost of higher
education is strongly influenced by the many norms related to the various aspects of the
educational institutions like the level of teachers' salaries, teacher-student ratios,
provisions of physical infrastructure, administrative staff, affiliation norms, etc. The
literature related to the cost of higher education has been examined at two levels: (a) cost
studied related to other countries; and (b) cost studies pertaining to India and its various
states.
67
2.1Survey of Available Literature
Higher education is financed in India largely by the government, and the long term trends
in financing show that higher education is increasingly becoming a state funded activity.
There are no private universities in India, but a large number of private colleges, most of
which are privately managed but publicly funded, to the extent of 80-90 per cent of their
recurrent budgets being provided by the government. From the point of view of finance,
and from the point of view of efficiency and equity, the private sector's contribution to
educational development is almost negligible (see (Tilak, J. B. G., 1992). After
independence, when economic and educational planning were first introduced in India,
around 1950-51, the government (federal, provincial/state and local), met only about 40
per cent of the total expenditure on higher education (excluding spending by students
themselves and their families, on books, uniform etc., and other non-fee expenditure).
The government contribution increased to 73 per cent by 1982-83. Correspondingly, the
share of every other sector declined: the share of student fees, the only contribution from
the students and their parents, declined from 37 per cent to 12 per cent, and the share of
other sources such as endowments, donations, etc., remained more or less stable at about
14 per cent. The 'other' sources are rarely considered as reliable sources of funds for
higher education in India. The pattern of fees appears to be particularly illogical. Fees are
not related in any way to the actual costs of education, nor to the ability of students and
their parents to pay for education. Students in arts and science courses (general
education) on average meet about one-fifth of the cost of their education in the form of
fees (of all kinds), while students in costlier, better-rewarding and more prestigious
professional courses like medicine and business management pay only 5-7 per cent of the
costs of their education. Similarly students in degree-level colleges on average meet 15

68
per cent of the costs of their education, while students in universities meet 13 per cent
and those in research and other higher level institutions pay only 1-4 per cent (see (Tilak,
J.B.G. & Varghese, N.V., 1991), (Tilak, J.B.G., 1990). All these trends are indeed
alarming for educational planners in the country, particularly in the context of
economic.Confronted with declining public budgets for education on the one hand, and
the need for more resources on the other, many developing countries including India,
have been in search of alternative methods of generating additional resources for
education. Prominent among the several alternatives, are revision of fees, graduate tax,
and student loans. This article has described the student loan scheme in India and
considered some of its problems. It does not attempt a detailed comparison between loans
and other alternative methods of funding higher education in India. Nor does it explicitly
subscribe to the view prevalent among some researchers and policy makers that student
loans are necessarily more efficient than other methods of financing higher education.
Indeed, it has earlier been argued that discriminatory pricing would work better than
student loans and graduate taxes in India, both from efficiency and equity points of view
(see ibid Tilak and Varghese 1991). In a recent study on Botswana (Colclough, C., 1990)
argued that payroll taxes would satisfy equity and efficiency criteria more effectively
than student loans. Payroll taxes are not a popular option in India. In the overall context
of growing financial requirements of higher education systems in India, the choice is not
simply between one or the other. In fact, one may have to experiment with a set of
alternatives available, rather than relying on a single method of financing. To summaries,
therefore, student loans are not a new phenomenon in India. The National Loan
Scholarship Scheme has been in existence for the last three decades. The scheme is
envisaged in India as a potential mechanism for financing educational expansion and
improvement of quality in due course, but the relative importance given to the scheme so

69
far seems to be insignificant in terms of the overall education budget. While expenditure
on the National Loan Scholarships Scheme forms the single largest proportion of the
central government's expenditure on scholarships for education as a whole (nearly one-
third in 1990-91), loan scholarships form only seven per cent of the total (central plus
state government) expenditure on student aid.(Leslie, Larry & Paul Brinkman, 1988)This
volume, while dated, is valuable both for its treatment of the history of the literature, and
especially of the empirical research, on the economic value of higher education in the
1960’s, 1970’s, and 1980’s, and also for its “integrative review” or “meta-analysis” of
this research. Meta-analysis is an analysis that puts together empirical research from a
large number of studies with slightly different populations and subjected to slightly
different statistical techniques and attempts to draw a new “overview” conclusion from
the substantially larger database, although not necessarily data that was collected at the
same time in the same way. The meta-analysis is particularly useful when much of the
empirical research was based on small or narrowly drawn samples, and which were often
inconclusive because of these limitations. The Leslie and Brinkman meta-analysis is
useful particularly in its attempt to reach conclusion from the many somewhat flawed and
rather small studies on income elasticity of demand for higher education—that is, studies
that have attempted to show the enrollment impact of tuition increases. There remains
considerable controversy regarding the usefulness or even appropriateness of research
that uses aggregate enrollment changes as the only dependent variable, but Leslie and
Brinkman’s meta-analysis is probably the best summary of this body of research
especially from the 70’s and 80’s.
(Albrecht, Douglas & Adrian, Ziderman, 1991)One of the first comprehensive
descriptions of student loan programs worldwide. The information is now dated, but the
70
comprehensiveness is still a useful indicator of both the scope of student loan programs,
worldwide, and some of their important variations.
(Kaul, Rekha, 1993)This book looks at the growth of “capitation fee colleges” in the
State of Karnataka (and the rest of India). It argues, with data from 19 private engineering
and medical colleges, that the capitation fee phenomenon reflects what it terms persisting
inequalities and the elitist base of the education system, works to maintain the caste-class
and power structures and lowers educational standards. The book concludes by outlining
several corrective measures and interventions that need to be made by the government
and social forces.(St. John Edward P., 1994)College costs are extremely controversial. St.
John explains why and assesses differing financial strategy contributions and deterrents
to the major issues in higher education finance, one of the most important being how to
mediate the negative effects of increased privatization.(Tilak, Jandhyala B. G.,
1997)Higher education in India is at cross roads. It has started experiencing significant
stress with respect to financing, particularly since the introduction of adjustment policies
in India in 1990. Hence the need for mobilization of additional resources for higher
education becomes more urgent. Tilak proposes measures/ solutions that can be
experimented with caution. According to him, attempts can be made to mobilize non-
governmental resources from students in the form of marginal increase in fees, student
loan programs can be revitalized to generate some resources, and attempts may be made
to augment resources from the private corporate sector by forging effect university-
industry relations. Tilak cautions that these measures can be successful only if the
government does not reduce its role in funding higher education significantly and if none
of the measures aim to reduce the demand for higher education.(Patrinos, Harry Anthony
& David Lakshmanan Ariasingam, 1997)The book defines demand-side financing in
public education as the mechanisms through which public funds are channeled directly to

71
the individual or institutions based on some expression of demand. Examples of such
mechanisms include vouchers, public assistance to private schools, targeted bursaries etc.
The authors review World Bank projects in the mid-1990s that included demand-side
financing components.
(Payne, Joan and Claire, Callender, 1997)This book on student borrowing in the UK was
written in the context of changing student aid policy that increased the use of loans. The
publication concentrates on the impact of borrowing on students. Among other findings,
looking at student behaviors related to the take-up of student loans, the study concludes
that women were less likely to take out loan than men. The same was true for Asian
students in comparison to members of other ethnic groups. At the same time having
dependent children may possibly have increased take-up, and students who were single
parents had a high loan take-up rate. The likelihood of taking out a student loan increased
with each subsequent year of study, and the level of loan take-up differed between
different age groups. The authors suggest that decisions about whether to take out a loan
are likely to be influenced by expected future earnings. Analyzing the reasons for
borrowing and not borrowing, the authors refer to different rationales for students from
poorer families and students from more prosperous backgrounds. They conclude that
because students from poorer backgrounds incur bigger debts than students from more
wealthy families, the fear of debt might deter some young people from entering higher
education.
(Eicher, Jean-Claude, 1998)One of the many articles presented in this volume of the
European Journal of Education on innovation and changes in financing highereducation
in Europe, the author discusses the costs and financingof higher education in Europe.
Over the last four decades, highereducation systems in Europe have undergone deep
quantitativetransformations that have been accompanied by very great structuralchanges.

72
Based on recent observations and economic analyses of thefinancing of higher education
in Europe, it can be concluded thatstudents’ participation in the financing of their studies
is still lowerthan the optimum seems to justify in many European countries, thattuition
fees are increasing in different forms and methods, that studentaid systems in most
countries must be rethought and amended in relation to the evolution of fees, that a
harmonization of fees andstudent aid systems is highly desirable if a unified Europe is to
bebuilt, and that many problems are still being debated, particularly the level of tuition
fees and the ways of reimbursing loans.
(Altbach, Philip G. (Ed.), 1999)This book includes 10 papers that examine the parameters
of private higher education worldwide. Altbach outlines the perspectives on private
higher education: themes and variations, issues and trends. Levy explores the diversity of
private higher education by analyzing the formulation of isomorphism. Although the
book is mainly about private higher education in Latin America, the private sectors in
other countries including India, the Philippines, Malaysia and Hungary are also
discussed.(Anthony, Susanne, 1999)This article describes the State Educational Grants
and Loans Scheme, the student financial support program in Denmark, and discusses the
issue of students contributing to the costs of education, particularly living expenditures. It
concludes with a historical review of the Danish support system and the effects of the
current system.(Boezerooy, Petra & Vossensteyn, H., 1999)In many countries, the
transition from “elite” to “mass” higher education has provided a strong stimulus for
putting access high on the political agenda. The article explores the accessibility of nine
western European countries on the basis of the concepts of selectivity and affordability.
The nine countries concerned display a degree of variation in terms of relative selectivity,
ranging from those with strong entrance selection procedures, such as Finland, Sweden,
and the United Kingdom, to countries with an open system, such as Austria, Belgium

73
(Flanders), and The Netherlands. In addition, there is a good deal of variation in the
extent to which students can afford to attend higher education. In countries with grants
and loans, they are in a better position to meet their costs than in countries in which
students are mainly subsidized with public support through their families.(Hauptman,
Arthur M., 1999)Hauptman, a long-time player in the analysis of US financial aid and
loan policies, turned his attention in this short article to the possible role that student
loans and tuitions might play in other countries, particularly developing countries. The
short length of the article (a requirement of articles in the Boston College publication)
allows for very little theory or context, and little analysis, but the proposal for tuition in
developing countries (many of which display a political/ ideological rejection of tuition
and other forms of cost-sharing) – a portion of which new revenues could be used to
support a student loan plan – is reasonable, although lacking in specifics.(Ehrenberg,
Ronald G., 2000)This is one of the best recent books on higher education finance,
particularly in the elite, high cost/high price colleges and universities. Ehrenberg is an
economist and former Cornell administrator, and combines a sophisticated yet readable
book on both the economics of rising costs and prices, and on the practical
administrative, or managerial, side of coping with this trajectory.(Gill, T.K. & S. S. Gill,
2000)This short article reviews the options available to universities in developing
countries (and particularly India) to deal with resource constraints including
implementation of, or increases in, tuition fees, privatization, and implementation of
policies to attract foreign students, policies to encourage investment by businesses, and
policies to encourage entrepreneurial activities.(Tilak, Jandhyala B. G. & Geetha Rani
(Eds.), 2000)This book consists of a selection of papers presented at a National Seminar
on Education Finance, organized by the National Institute of Education Planning and
Administration (NIEPA). In the first chapter “Pattern of Financing Education”,

74
JandhyalaTilak provides a detailed statistical and analytical profile of various public
education expenditure trends in India and Shailbala Debi reviews the trends and problems
of state financing of elementary education in Orissa.The second chapter “State Versus
Markets in Education” discusses the changing roles of the public and private sectors in
education. The third chapter “Financial Reforms in Higher Education” examines better
methods of mobilizing and allocating non-government resources. The fourth chapter
“Grants-in-aid to Education” reviews the pattern of grants-in-aid to education in Uttar
Pradesh, examines the levels of grants-in-aid to local bodies for school education in
several states in India, and reviews the role of the local bodies and the state government
in financing education in Tamilnadu. The final chapter “Household Expenditure on
Education” concentrates on various dimensions of household expenditures on education
based on a national survey conducted by the NCAER.
(Independent Committee of Inquiry into Student Finance, 2000)This report, known as the
Cubie Report, discusses the findings of a study that reviewed tuition fees and financial
support for students normally residents of Scotland, who were participating either part- or
full-time in further and higher education courses elsewhere in the UK. The purpose of the
report is to make recommendations for changes to the current system that would promote
access to higher education, particularly for those groups currently
underrepresented.(Bain, Olga, 2001)Using D. Bruce Johnstone’s theoretical framework
of cost-sharing and empirical data from various sources, the author focuses on tuition
policy issues in Russia. She describes the evolution of tuition policy in Russia, where
until relatively recently higher education was free to all qualified students. Cost sharing
was introduced in Russian higher education in the mid-1980s via the contract-training
model, and later via the policy of split admissions whereby a certain number of students
were state-supported, while others had their costs covered by their employers or other

75
sponsors. The 1992 Law on Education and the 1993 Constitution laid the legal
framework for charging tuition fees to students. The author examines the affordability of
tuition and fees in higher education and then summarizes the patterns of fees for
instruction. Lastly she discusses the policy stumbling blocks as well as the relationship of
markets to higher education.(Ruch, Richard S., 2001)The book examines the rise of the
for-profit higher education sector and specifically those colleges and universities that are
regionally accredited, degree-granting institutions that offer associate, bachelor’s,
master’s and doctorate degrees and are owned and operated by publicly traded for-profit
corporations. The author identifies 10 distinctions between private for-profit and non-
profit higher education institutions including, most importantly, the fact that private
institutions are taxpaying rather than tax exempt, have investors versus donors, and have
private investment capital instead of endowment. He shows that for-profits institutions
have learned much from traditional non-profit institutions and have “taken the traditional
model of higher education… and subjected it to modern principles of operations
management, cost accounting, financial management and marketing.” He theorizes that
non-profit colleges and universities could learn from the for-profit sector in terms
improving their responses to market forces, adapting their organizational structure,
redefining their governance structure, and developing a strong customer orientation.
(Varghese, N. V. , 2001)This volume, including three papers, is based on an International
Institute for Educational Planning Policy Forum in 2001. The first paper by Varghese
provides an overview of the major changes in the higher education sector in selected
countries stemming from the economic crisis in East Asia. The impact of the crisis on
higher education is analyzed at the household, institutional and macro levels. The other
two papers analyze the crisis and its impact on higher education in Indonesia and Korea.
In general, these changes include: 1) increases in student drop-out rates, 2) shrinking of
76
private universities, 3) decreases in study-abroad fellowships, 4) regulation changes, 5)
inflows of study-abroad students, and 6) budget cuts in many universities.(Advisory
Committee on Student Financial Assistance, 2002)Building on the Advisory Committee
on Student Financial Assistance’s previous report Access Denied, Restoring the
Nation’sCommitment to Equal Educational Opportunity, this report argues that financial
barriers (shortages of student aid, especially need-based grant aid and rising college
tuitions) prevent significant numbers of low-income, college-qualified graduates from
attending college within two years of graduation. While not discounting the importance
of ongoing efforts to increase academic preparation and information about college and
financial aid, the report argues that such strategies do not solve the financial problems
facing college-qualified, high school graduates and calls for the development of a federal
strategy that focuses specifically on reducing unmet need through the provision of
additional need-based grant aid.(Archibald, Robert B., 2002)The author argues that
higher education institutions, rather than the federal government, should provide student
loan guarantees. Such a switch would provide institutions with more incentive to provide
a good education, and would cause a saving in federal aid spending that could be applied
to increasing Pell Grants for students from lower income families.(Belfield, Clive &
Henry, M. Levin, 2002)This book provides an overview of the phenomenon of
privatization in higher education. The authors define the three forms of privatization as (i)
private provision, (ii) private funding, and (iii) private regulation, decision making and
accountability and analyze the factors that drive it including excess and differentiated
demand, pressure for higher quality, and general pressure linked to globalization. The
authors then set up a framework for evaluating privatization programs that includes the
criteria of freedom of choice, efficiency, equity and social cohesion and summarize
privatization reforms in Chile, Colombia, the USA, the UK, the Netherlands and the

77
Czech Republic. Finally, the authors outline the implications of privatization reforms for
educational planning in the political, legal and economic domains.(Bray, Mark, 2002)Part
of the Education in Developing Asia series produced jointly by the Asian Development
Bank (ADB) and the Comparative Education Research Centre of the University of Hong
Kong, this book looks at the scale and nature of existing education provision and the
volume of expenditures on education in developing member countries of the ADB. Of
particular interest are the sections on cost sharing in education, cost recovery and student
support in tertiary education, and the privatization of education.(Ishengoma, Johnson,
2002)The article reports on the success of Tanzania’s cost-sharing policies in generating
additional resources for, increasing capacity in and improving access to Tanzania’s major
public university, the University of Dar es Salam. It concludes that low enrollments in the
privately sponsored, tuition-fee paying programs, the failure to charge break-even fees on
the university’s cafeteria and hostel operations, the proposal to give more loans to cover
items that were supposed to have been covered by students and parents in a previous
phase of the cost-sharing program, the apparent inability and/or unwillingness to begin
serious efforts to collect on these loans, and the government’s general reluctance to
introduce the next cost sharing phases are all indications that real cost sharing in higher
education in Tanzania has a long way to go in order to reach its goals.(Lee, W. O.,
2002)Part of the Education in Developing Asia series produced jointly by the Asian
Development Bank (ADB) and the Comparative Education Research Centre of the
University of Hong Kong, this book looks at trends of access and equity in education in
the developing member countries of the ADB and then looks at these trends by country to
study the relationship between the degrees of access and equity and individual
characteristics of economic and human development.(Vossensteyn, Hans, 2002)The
article reviews the growing importance of the “cost sharing” phenomenon in the

78
Netherlands in terms of rising tuition fees, decreased general grants, increased means-
tested supplementary grants, the increased role of loans and the increased emphasis on
parental contributions and students’ own resources and looks at the impact of such cost
sharing policies on student enrolment behavior. Similar to findings in a number of other
countries, the article confirms that Dutch students (including those from lower socio-
economic backgrounds) are not very sensitive to changes in financial arrangements in
relation to their enrolment decisions and that student choice is more affected by level of
parental education, performance in secondary education, and distance between home and
higher education institutions.(Abraham, Katherine G. and Melissa A. Clark, 2003)The
study focuses on the impact of the District of Columbia’s Tuition Assistance Grant
Program (DCTAG) on students’ college choices. The DCTAG program, established in
1999, provides a substantial subsidy for DC residents to attend public colleges and
universities throughout the USA. The study found that the number and share of DC
residents applying to four-year colleges increased substantially under the program, and
students were considerably more likely to apply to colleges that were eligible for the
subsidy. According to the study, freshmen enrolments of DC residents also increased
substantially at eligible institutions, although the effect on overall freshmen enrolments of
DC residents was fairly modest, suggesting that in its first year the subsidy had more of
an impact on where students chose to attend than on whether they chose to attend college
at all.(Bekhradnia, Bahram, 2003)Making a distinction between widening participation (a
sector wide issue) and fair access (an institutional issue), the article asserts that it is well
possible to have one without the other and that misdiagnosis of the problems involved
may lead to ineffective and even harmful policies. Evidence cited in the article suggests
that demand for higher education is relatively insensitive to price and is not much
affected by students’ fear of debt and instead is very much tied to the economic and

79
social value that students put on higher education. Policies, therefore, need to be aimed at
understanding and changing these attitudes. In terms of institutional efforts for fair
access, the article dismisses the use of quotas and argues that institutions need to ensure
that a wide variety of student applies and that their admissions staff has effective means
of identifying student academic potential.
(Callender, Claire, 2003)The study investigates the impact of debt and perceptions of
debt on participation in higher education in the United Kingdom. The author concludes
that prospective students with tolerant attitudes towards debt are more likely to go to
university than those who are debt adverse. According to the study, debt aversion deters
entry into higher education and also is a social class issue. Those most anti-debt are the
focus of widening higher education participation policies in the UK and include people
from the lowest social classes, lone parents, Muslims, especially Pakistanis, and black
and minority ethnic groups. The study provides valuable material to inform analysis of
student aid policies.
(Hearn, James C., 2003)This report considers why colleges and universities are
diversifying their revenue streams, examines how they are doing so, and synthesizes the
research on decision-making processes regarding new revenues. The revenue-seeking
efforts are investigated in eight domains: 1) instruction, 2) research and analysis, 3)
pricing, 4) financial decision making and management, 5) human resources, 6)
franchising, licensing, sponsorship, and partnering arrangements with third parties, 7)
auxiliary enterprises, facilities and real estate, and 8) development. The author asserts
that revenue diversification efforts should not only generate new revenues, but also
generate new net returns. When pursuing new revenues one must deal with the question
of why new revenues are being sought. This report is a good reference for leaders of
higher education institutions.(Chapman, Bruce, 2004)The article analyzes the 2005

80
reforms to the Australian higher education funding system approved by Parliament in late
2003. While it supports the HECS-HELP policy change (whereby universities will be
able to set their own prices for HECS places up to a certain ceiling) as good economic
and social reform, it criticizes the Fee-Help reform as allowing universities too much
discretion in price setting and not enough in deciding the number of places to be offered
on a fee paying basis. The article concludes by offering a preferred model of Australian
higher education financing that would include price capping, reform of vocational
education and training fees, and removal of all up-front costs.(Chudgar, Amita, 2004)The
paper explores the role of various family characteristics (parental education, family’s
economic status, household size, membership in a social group, student’s gender) in
financing higher education in India. The study finds that these characteristics account for
27 percent variation in higher education expenditure and that they are more important in
explaining variation in educational expenditure at lower levels of education. The findings
are important for the government’s higher education finance policymaking
process.(Mayhew, Ken et al., 2004)This paper describes the course and causes of the
expansion of higher education in the UK since the 1960s. While the number of university
students from modest social backgrounds has increased, they comprise much the same
proportion of the university population as they did 40 years ago. Though personal rates of
return from higher education are generally substantial, there is still doubt about the extent
of the returns to society and how productively new graduates will be employed in the
labor market. The paper considers the impact of this expansion with tight public funding
since the early 1980s and of the increase in compliance and audit costs. Finally it
suggests that the incentive structures applied by the government may have made the
different parts of the sector more homogenous than is desirable.(Palacios Lleras, Miguel,
2004)The “capital markets approach” is a recent expression of the policy generally

81
attributed to conservative economist Milton Freedman’s work from the 1950s and 60s
advocating greatly diminished or even the elimination of most public subsidy to higher
education, pricing college and university education on a full or near-full cost
reimbursement basis and financing the expenses—to be borne principally by students—
through income contingent loans. While income contingent loans are the chosen form of
student loans in Australia, New Zealand, UK, South Africa, and elsewhere and exist as an
infrequently selected option in the US, these income contingent loans--featuring a
repayment obligation expressed as some percentage of either earnings or income--are
nevertheless subsidized for all earners, with those high earners repaying at something less
than the borrower’s cost of money, and the low earners repaying ultimately even less, but
with the shortfall covered by government. The Palacios “capital markets approach,”
however, is quite different, and abdicates a total “equity” approach to higher education
financing, where shortfalls from low lifetime earners are made up by profits,or surplus
effective interest, paid by borrowers who turn out to have high lifetime
earnings.(Palfreyman, David, 2004)This is a book length monograph written about the
debates surrounding the UK 2003 White Paper on Education, and preceding the
enactment in the summer of 2004 of UK’s HigherEducation Act. This work discusses the
economics and politics surrounding the issues of cost sharing and “marketization” of
higher education drawing on many European and especially American examples. While
clearly in favor of a more “liberal” approach to higher education, providing some cost
sharing and allowing more market forces to enter, Palfreyman gives a balanced
accounting of some of the objections both in the UK and in the United States to the
increasing cost of higher education and the increasing portions of that increasing cost
being passed on to parents and especially on to students.(Pell Institute for the Study of
Opportunity in Higher Education, 2004)The report seeks to measure the opportunities for
82
low-income students to access and success in higher education, to track progress and
improvement over time and to use the findings to advocate for increased understanding
and support of programs that improve access to higher education. Four key questions are
used as indicators of access: who goes to college, where do they go, what do students pay
for college and who graduates from college. It was found that relative to other groups,
low income students have less opportunity for post-secondary education, have a lower
college participation rate, more frequently attend for-profit institutions and two-year
institutions and take longer to complete their degrees.
(Psacharopoulos, George and Harry Anthony Patrinos, 2004)Psacharopoulos, a Greek
Parliament member in the early 2000s, was also a senior economist in the World Bank.
He is identified with the Bank’s reliance in the 1970s and 80s on rate rate-of-return
analyses to show the relatively low payoff to public investments in higher as opposed to
elementary and secondary education. This article presents the latest estimates and
patterns on social and private returns to investment in education. The paper further argues
that Article 16 of the Greek Constitution, which guarantees free public higher education
and prohibits private universities, has resulted in limited access, declining quality,
unemployment, brain drain, foreign exchange loss, misallocation of resources, reduced
human capital investment and social agony. The paper concludes that article 16 is an
economically inefficient and social inequitable law, but that public opinion continues to
be against private universities.(Usher, Alex, 2004)The report examines the assumption at
the root of Canada’s student financial assistance system that high need students are also
low income students. The author argues that several of the need-based criteria (attending
a more expensive program, living away from home and being “independent” of parents)
actually favor students from upper-income families and funnel aid away from low-
income students. Using national income, loan and grant data, the author shows that while

83
children from poorer families receive more assistance than children from richer families,
students from higher income backgrounds still receive over 40 percent of loan
expenditures and 40 percent of student grants and proposes that to reach more low-
income students a more direct income-targeting methods should be adopted.(Barr,
Nicholas, 2005)
The book traces the twenty-year evolution of the United Kingdom’s higher education
finance system from one financed almost exclusively by the government and taxpayers to
one with significant Student/ family financial contributions. The authors examine the
changes leading up to the highly-contested 2004 legislation that abolished up-front tuition
fees and introduced a scheme that allows students to defer their contribution to the cost of
their courses until after they have graduated in terms of two key elements – the proper
design of student loans and the role of regulated market forces.(Herz, Barbara, 2005)This
paper was commissioned by the Carnegie Corporation of New York to explore the
accessibility, value and cost of higher education for African women and the social,
cultural and financial barriers that they face. The author argues that one of the first steps
for improving women’s participation in higher education is to fill in some of the research
and data gaps on current university enrolment patterns, on the economic and social
returns to university education and on strategies for increasing women’s education at the
university level. After reviewing the data that is available in each of the three areas, she
makes suggestions for future research and data collection.(Huang, Lohing, 2005)
A doctoral dissertation, this study presents empirical patterns of social equity in Chinese
higher education based on a questionnaire survey administered to 1,200 students at six
public universities in Southwest China. The survey findings reveal that a disproportionate
number of students come from high-income families and that students from urban areas
are over-represented while rural girls are severely under-represented. It confirms that the
84
average cost of higher education in China is far above the average annual income of even
urban families and that about one-third of the students took out student loans, borrowed
elsewhere or received some other form of financial system. The author concludes that
given these results, student loans should be made more accessible to a greater proportion
of students and more financial assistance to students from lower socioeconomic strata,
especially rural girls, should be available. She also concludes that private enterprises
should be more involved in financing and otherwise supporting higher education given
that most of the students aspire to take jobs in the private sector. She suggests further
research on the entire education sector in China to compare to similar data on students in
another system or country and on the gender differences in terms of access to higher
education.(Narayana, M. R. , 2005)This study aims to find plausible answers to the
ongoing policy debate about financing higher education through public subsidies versus
student loans. It focuses specifically on the financing of collegiate education, which is
part of general higher education, in Karnataka State in South India. This study provides
interesting data about the development of student lending in India, as well as the structure
of higher education finance. The results of this study imply that the student loan may not
be a perfect substitute for budgetary subsidies to the poor but deserving student in
collegiate education. Thus, the paper recommends a mix of governmental and private
funds in supporting students through collegiate education.
(Tres, Jaoquim and Francesco Lopez Segrera (Eds.), 2005)This book is timely and well-
edited compilation of papers prepared for the World Report on Higher Education: The
Financing of Universities II international Barcelona Conference on Higher Education,
Barcelona, Spain, November 28-December 2, 2005. Chapters include such international
higher education finance experts as: Arthur Hauptman, Bruce Johnstone, Jan Sadlak,
BikasSanyal, JamilSalmi, JandhyalaTilak, Maureen Woodhall and others.(Agarwal,

85
Pawan, 2006)A comprehensive paper on higher education in India that provides an
overview of its structure, the regulatory environment in which it works, its financing and
other important issues including governance, academics and technology. It argues that
while the higher education system (particularly the private sector) in India has expanded
rapidly over the last 20 years, it has done so with little regulation and decreasing
standards in all but a few quality institutions. Moreover the expansion in enrollments has
taken place at a time when public funding has declined (in real terms) and public
universities have started to charge higher tuition fees. These changes have had a negative
impact on access for the poor given the absence of substantial student financial aid
programs. The paper consolidates a number of recommendations into a broad framework
for action. Within this framework it identifies several strategies for making higher
education affordable and accessible to everyone including the introduction of an income
contingent loan program and the establishment of a Social Equity Fund that would
administer financial aid programs for poor students.(Kapur, Devesh & Pratap Bhanu
Mehta, 2007)This paper analyzes two interrelated facets of Higher Education policy in
India: the key distortions in higher education policies and what explains them. It first sets
the stage by laying out the principal conceptual issues that need to be considered when
thinking about an appropriate policy framework for higher education in India. It then
examines three key distortions in Indian higher education with regards to markets, the
state and civil society (philanthropy). The next part of the paper examines the political
economy of Indian higher (tertiary) education and seeks to explain the ideological and
political underpinnings of these distortions and how they work in practice. The authors
conclude with some indicative some policy directions for Indian higher education. The
purpose of this exercise is not to make detailed policy recommendations, but rather to
flag the kinds of issues that ought to be addressed.

86
(Ved Prakash, 2007)The Indian higher education system is presently facing several
challenges. The challenge of global competitiveness has been added to other demanding
tasks such as access, equity, relevance, quality, privatization and internationalisation in
the face of a resource crunch. This article gives an overview of trends in the expansion of
higher education and examines variations in participation across states, gender and social
groups. An attempt has also been made to discuss the trends in the financing of higher
education and the required resources to meet the target of allocating 6 per cent of the
GDP to education. It argues that without appropriate policy interventions in school
education, it would be of little use to have interventions at the higher educational level,
which discriminate in favour of girls, SCs and STs.(Tilak, Jandhyala B. G.,
2008)Conventionally, higher education is regarded as a public good, benefiting not only
the individuals but also the whole society by producing a wide variety of externalities or
social benefits. Of late, however, the chronic shortage of public funds for higher
education, the widespread introduction of neo-liberal economic policies and globalization
in every country and in every sector, and the heralding of the international law on trade in
services by the World Trade Organization and the General Agreement on Trade and
Services—all tend to challenge the long-cherished, well-established view of many that
higher education is a public good, and to propose and legitimize the sale and purchase of
higher education, as if it is a normal commodity meant for trade. The very shift in
perception on the nature of higher education from a public good to a private good—a
commodity that can be traded—will have serious implications. The paper describes the
nature of the shift from viewing higher education as a public good to a private, tradable
commodity and its dangerous implications.
Basically higher education is a public good; it is also recognized as a merit good. Besides
being a public good in itself, it produces several public goods. The public goods that

87
higher education produces, shapes and nurtures are also diverse. The social purpose it
serves, the nation-building role it performs, the public good nature and the human right
nature of higher education—all these dimensions are very closely related, and they need
to be considered as fundamental and non-compromizable principles in the formulation of
public policies relating to higher education.(Mishra, Jitendra Kumar et al.,
2008)Globalization has redefined the constituents and drivers of economic progress over
last two decades. The traditional contributors of economic development and economic
power such as material resources and production capabilities have been replaced by
knowledge and information. Globalization has resulted in significant changes in the
knowledge economy and ushered new conditions for the provision of higher education to
cater the skill requirement all across the globe. Higher educational services have emerged
over the last few years as a major economic sector for trade worth several billion dollars.
The key elements of globalization include the knowledge society, information and
communication technologies, the market economy, trade liberalization and changes in
governance structures. These elements of globalization have impacted significantly the
education sector in general and higher education in particular. The present study critically
analyzes the growth of higher education sector in India and identifies the major concerns.
It also evaluates the preparedness of the country for the opening up its border for foreign
institutions.(Institute For Higher Education Policy, 2009)This paper uses a multi-country
perspective spanning four countries—the United States, Mongolia, South Africa, and
Ukraine—to highlight a number of strategies and challenges related to the creation and
implementation of suitable higher education finance polices. It draws attention to the
financial imperatives that affect higher education in the four countries and provides an
overview of current policies, contextual influences, identified weaknesses, and proposed
recommendations. Despite the fact that each country has a unique postsecondary context,

88
all four countries grapple with strategies to ensure access to higher education for disad-
vantaged students and, more important, to ensure a high-quality education for all
students.
The analysis suggests a number of findings. The first step in policy planning is to conduct
a thorough needs analysis—an understanding of the operational environment and the
social context is important to direct funding to the areas of greatest need. Then, policies
should be created that can be expected to have a significant impact and that will not
exceed the resources available to the government. Policymakers must garner significant
political support from various constituents. A critical dialogue among policymakers, civil
society, and political administrators is essential to create a sustainable framework within
which policy can emerge. Whatever policy is decided upon, the financial and political
resources must be available to ensure effective implementation.(Martin, Robert E.,
2009)The principal/agent problem, the nonprofit status of colleges and universities, and
the emphasis on reputation maximization lead to a bias against reform, a preference
toward increasing revenues, and a revenue-to- cost spiral in higher education. The
evidence—both anecdotal and objective—that cost increases are excessive is compelling.
The cost increases not only create an unnecessary burden on students, their families, and
society as a whole, but they represent a significant wealth transfer from families and the
public to higher education.The bias against reform means that real reform will not come
from within higher education. Reform will have to come from the outside. As in a nuclear
arms race, actors—in this case, individual colleges and universities—cannot reform
unilaterally. Serious cost control efforts will damage reputations in the short run and
make it more difficult to recruit both gifted students and gifted faculty. The reform effort
will have to be industry-wide, and that can only come from the outside.

89
Finally, the revenue-to-cost spiral suggests that cost control reform must be a prior
condition for any increase in higher education funding. If it is not, the increased funding
will simply drive costs higher, returning little social benefit. But cost-control reform
should not be all stick and no carrot—pay for performance should be a part of cost-
control reform, and an institution’s reward for successful cost-control reform should be
increased funding.(P. Geetha Rani, 2010)It is unambiguous that Policy of the
Government of India now encourages augmentation of resources for covering a larger
portion of cost of higher education. Recent policy changes in India often favour to divert
resources from higher to primary level of education and favours for full cost recovery
from students even in public higher education institutions. Cost recovery measures
comprising of increase in fees, student loans currently operated by commercial banks and
privatisation will exacerbate inequality in the society. Indeed, there seems to be a nexus
between the present student loan scheme and full cost recovery. Increasing reliance on
student fees, student loans and privatisation without considering the low-income groups
may produce regressive effects in the society. Under the deep waves of globalization and
competition, important economic rationale for government funding especially for higher
education is neglected. Public support for higher education remains essential to ensure a
balanced achievement of educational and social missions, apart from surviving in the
knowledge-based society. It is essential that funding sources must be diversified but cost-
sharing with students has social and political limits, and excessive commercialization of
higher education should be forbidden.(Dr. S. Puttaswamaiah, 2010)Education assumes
significance as a provider of input for economic, political and social development,
besides as a source of knowledge. Economic growth in recent years has been based on
availability and quality of knowledge in any country, which in turn depends on access
and affordability to education. Hence, importance of education has increased to supply

90
adequate and qualitative human capital. Functioning of education sector depends on
availability of various resources, of which to a large extent on financial resources.
Finances for education are mobilized from different sources like government spending,
fees, educational loans, and others. Among these, educational loan has been seen as an
alternative way of financing for education. In this background the present paper tries to
analyse the trends and patterns of educational loan in India. Further, an attempt has been
made to understand pattern of student loans provided by selected commercial banks. The
study finds that educational loan is increasing over the years.
(Jongbloed, Ben, 2010)The issue of higher education funding has multiple aspects: who
pays for higher education (including the topics of cost-sharing in higher education and
external funding to universities), how public funding is allocated to universities, what
incentives the allocation mechanism creates, and how much autonomy universities have
in decision-making over financial and human resources. Several funding models were
presented in this report. First they were considered abstractly and placed into a general
categorization, stressing the dimensions of performance orientation and individual
(decentralized) decision-making. The higher education funding mechanism is an
important ingredient in the wider spectrum of governance arrangements. Trends and
practices in Europe increasingly point towards more market-based, or performance-
oriented and decentralized types of funding mechanisms. European governments have
shown a tendency to augment the direct funding of higher education institutions with
competitive funding mechanisms and performance-based funding mechanisms such as
contractual performance agreements. Alongside this, they have started to grant more
autonomy to the institutions, allowing them to make their own decisions about the use of
resources and the generation of new – often external – resources. The introduction or the
increase of tuition fees has been one of the most widely debated issues in higher

91
education funding (Teixeira et. al. 2006), but reality shows that, with the exception of
UK, undergraduate fees do not yet cover a substantial share of educational costs in
European countries (Lepori et al. 2007). Surveying the funding mechanisms in place
across European higher education systems, author has shown that in most countries the
allocation of direct appropriations occurs through a formula that uses a mix of input and –
to a lesser extent – output criteria. Often student numbers are the most important criterion
in the funding formula. Overall, author found that institutional budgets depend more on
student choice and increasingly less on central planning, while for research budgets we
observed that competitive funding has become a key allocation mechanism and accounts
already for a substantial share of the universities’ revenues. Some governments have,
next to the above developments, started to work with performance contracts. In
performance contracts, governments enter into regulatory agreements with institutions to
set mutual performance-based objectives.A clear recommendation, also expressed in
other EC communications, is the need for European governments to increase the
autonomy of their national universities and revise their governance structures. However,
this increased autonomy does not rule out a continuing important role for government. As
always, this role lies in providing subsidies, promoting access, organizing student support
and ensuring quality assurance. On top of that, through introducing performance-based
funding mechanisms and more competition the government will set different incentives
that may help to achieve more differentiation in quality, funding and pricing in higher
education. A mass higher education system requires a greater reliance on markets and
their decentralized decision- making by individuals and institutions. Compared to many
other fields in the economy, the sector of higher education and its students and
universities can indeed be trusted to be capable of making good decisions. In the words of
Nicholas Barr: “The days of central planning are gone!” (Barr, 2003).If we believe the

92
European Commission to be right then competition and greater institutional autonomy
will drive higher education institutions to become more sensitive to their varied
consumers’ demands for relevance. It remains to be seen whether more countries in
Europe will indeed take further steps along the mercerization route to modernize their
universities.(Havaldar, Krishna K., 2011)The growth of management institutions in India
in last 15 years has been rapid. Data on number of business schools established in India
from 1995 suggest a ‘mushrooming’ growth in terms of numbers and often at the cost of
quality. India has 2000 B-Schools, awarding MBA degrees, or an equivalent and often,
more valuable post-graduate diplomas (like those given by IIMs). It is heartening to find
two management institutes from India, the Indian Institute of Management, Ahemedabad
(IIMA) and the Indian School of Business, Hyderabad, are placed 11th and 13th in the
global ranking of 2011 by Financial Times. This study addresses various issues
associated with different categories of management institutions operating in India. Some
of the major issues are: the quality of the faculty, students and facilities; pedagogy and
recognition; research outputs, executive training, placement and brand equity. These
issues are then analysed with respect to different categories of business schools in India :
(1) top 30 government and private B-Schools, including (IIMs), (2) university
departments of management studies, (3) private autonomous B-Schools approved by All
India Council of Technical Education (AICTE),(4) university affiliated private colleges,
(5) private institutions not affiliated to any universities nor approved by THE AICTE, (6)
private institutes in collaboration with foreign universities.
There is a need to contemplate what India will need in 2025. Management education in
India in 2011 is not what it was in 1950s. Top management institutes’ future should not
be what we can learn from Harvard Business School. It should be what they can learn
from us.(Rizvi, Fazal & Radhika Gorur, 2011) have argued that, faced with a growing

93
policy anxiety in India about the risks it confronts of losing its advantage in the fiercely
competitive global knowledge economy unless its universities are re-engineered, the
Indian Government has at last unleashed a series of reforms to its system of higher
education. It has begun to view these reforms as inextricably linked to the requirements
of the global economy and the shifting architecture of global higher education. The
Government has therefore greatly increased its level of investment in higher education,
and has also begun to loosen some of the bureaucratic rigidities in the system, giving
universities greater organizational autonomy. As overdue and welcome as these
initiatives are, they have argued that while additional resources are clearly necessary to
reform Indian higher education, they are not sufficient. This is so because the problems of
the Indian system of higher education are deep, and relate to a range of dilemmas arising
out of the historical constitution of Indian higher education, and to the organizational
traditions and cultural attitudes about its nature and functions in society. The authors have
suggested that unless these dilemmas are squarely addressed, the Indian system of higher
education will continue to struggle, producing isolated pockets of academic excellence
but leaving the nation as a whole poorly served.(Anjum, Dr. Bimal & Rajesh Tiwari,
2012)The paper explores the trend of supply of professional education institutions. The
secondary data is analyzed to investigate the reasons for large number of vacant seats in
professional colleges. The last two decades had witnessed unprecedented growth in
institutes of higher education primarily due to private sector participation. The private
sector is expected to provide useful contribution in achieving the target of 30% GER by
2020 set by government of India. Though the private institutes have grown in number
they are not able to attract the high ranking students. The issues of quality, access, equity,
inclusiveness require urgent attention of the stakeholders. Unemployability of graduates
is a cause of concern. Large number of vacant seats in self financing colleges is
94
threatening the financial viability of these institutions. Proper regulatory framework
supported by mutual trust and accountability is important for the establishment of vibrant
global private higher education institutions which can ensure quality, access, and
inclusiveness.(Gupta, Deepti & Navneet Gupta, 2012)India’s education system is often
cited as one of the main contributors to the economic rise of India. The size of India’s
higher education market is about $40 billion per year. Presently about 12.4 percent of
students go for higher education from the country. If India were to increase that figure of
12.4% to 30%, then it would need another 800 to one thousand universities and over
40,000 colleges in the next 10 years. This paper presents the development and present
scenario of higher education in India by analyzing the various data and also identifies the
key challenges that India’s higher education sector is facing. This paper also presents the
key initiatives by the government and recommendations to meet these challenges. In this
paper authors have presented the development and present scenario of higher education in
India by analyzing the various data and also identify the key challenges like demand-
supply gap, quality education, research and development and faculty shortage in India’s
higher education sector. In this paper also identified the key initiatives from the
government side which include the establishment of NCHER, independent regulatory
authority for accreditation and national database of academic qualification, increase in
number of universities including IITs, IIMs, NITs and SPAs during 11th five year plan
and increase in the number of seats in existing institutions, and passing of the Right of
Children to Free and Compulsory Education. Looking to the present scenario of the
higher education in India we recommended some points in order to further meet the
challenges.(Tilak, Jandhyala B. G. , 2012)Conventionally, higher education is heavily
subsidised by the state in almost all countries. This has been justified by the recognition
of education as capable of producing externalities, as a public good (and as a quasi-public
95
good in case of higher education), as a merit good, as a social investment for human
development, and as a major instrument of equity, besides as a measure of quality of life
in itself. The launching of neoliberal economic reforms in most developing and
developed countries of the world has led to shrinking the pubic budgets for higher
education. Recent trends in funding higher education are associated with changing
perceptions on the role of higher education. As a result, business models are adopted in
setting and running universities. Private universities, commercial universities, corporate
universities and entrepreneurial universities are becoming the order of the day. The
several basic characteristic features of higher education, such as higher education as a
public good, merit good, social investment, and as a human right are under attack. Recent
evidence shows that many universities are experimenting with cost recovery measures,
generating resources from student fees, and other non-governmental sources. The effects
of these cost recovery measures on the quantity, quality and equity in higher education
need to be examined for sound policy making. The paper presents a quick review of some
of these arguments being made in favour of and against public financing of higher
education and restated how important it is for the state to finance higher education. It is
argued that significant reduction in public subsidies to education is neither feasible, nor
desirable, even if feasible.(Li, Helen, 2013)The rising cost of higher education is a topic
of large concern today. As tuition prices continue to grow at a quicker pace than housing
prices, consumer prices and average hourly wages, it is becoming harder and harder for
the average American family to afford going to college. What factors have been driving
this large rise in tuition prices? This thesis aims to set up a supply and demand
framework to analyze the various forces that may be driving the price of higher education
to rise above the Consumer Price Index over time. After defining long-run supply and
demand for the higher education market, this thesis addresses economy-wide factorsand
96
summarizes the findings of Robert Archibald and David Feldman in Why Does College
Cost So Much?. Next, this thesis examines higher education-specific factors and
specifically tests thehypothesis: The long-run supply curve for higher education’s is
theoretically vertical. Theinability for supply to meet the increasing demand for higher
education results in a supply anddemand imbalance that drives up the price of higher
education. After looking at both economy wideand higher education-specific factors, it is
apparent that slow productivity growth and largewage increases for professors (cost
disease) and an unresponsive total enrolment (supply) in theface of rising demandare
largely driving the increase in the price of higher education. In order tocurb this rising
prices, his thesis will offer a few policy implications and recommendations. Namely,
online education and “blended” courses may offer viable solutions to increase
theproductivity of professors and increase total enrolment at institutions.(Walia, Nidhi,
2013)stated that it hardly needs any justification that higher education is an engine of
economic growth in any country including India. Higher education has significant role in
supporting knowledge driven economic growth strategies. It provides an opportunity to
critically reflect upon the social, economic, cultural, moral and spiritual issues facing
humanity. It contributes to national development through dissemination of specialized
knowledge and skills. Indian higher education system has undergone massive expansion
since independence. Keeping in above, present paper seeks to examine the emerging
issues and challenges in Indian higher education system in the present era. Issues like
access, equity, inclusion, quality, privatization and financing concerning higher
education, are very complex and interrelated with political, economical geographical and
international dimensions. To develop India as an education hub or to become a
prosperous partner in global economy, India has to qualitatively strengthen education in
general and higher education with research and development in particular.(Singh, Dr. J.

97
D., 2015)stated that although there have been challenges to higher education in the past,
these most recent calls for reform may provoke a fundamental change in higher
education. This change, according to him, may not occur as a direct response to calls for
greater transparency and accountability, but rather because of the opportunity to reflect
on the purpose of higher education, the role of colleges and universities in the new
millennium, and emerging scientific research on how people learn. These disparate
literatures have not been tied together in a way that would examine the impact of
fundamental change from the policy level to the institutional level and to the everyday
lives of college and university administrators, faculty and students. Now the time has
come to create a second wave of institution building and of excellence in the fields of
education, research and capability building. We need higher educated people who are
skilled and who can drive our economy forward. He concludes that when India can
provide skilled people to the outside world then we can transfer our country from a
developing nation to a developed nation very easily and quickly.
2.2Conclusion
We strongly believe that a stratified three tiered structure that enables seamless vertical
and horizontal mobility of students would be able to create the desired intellectual,
economic and social value. The implementation framework suggests the student at the
center stage to foster innovation and choice, that will increase access, equity and quality,
and a transparent governance framework that will enable autonomy and self –regulation.
A framework for governance has been detailed in the addendum document which
proposes a mechanism based on outcomes and strong institutional accountability, clearly
delineating the role and responsibilities of the government as well as public and private
higher education. In this report, we have attempted to provide a brief overview of the
educationalsystem in Pune. The intended audience is Finnish policy makers,

98
universitiesand other agencies. Since Pune and Satara have few historical cities,it would
need some concerted effort by both to develop productiveEducation.
Although the modern education system in India is based on the Anglo-American
tradition, there is a great variety of institutional systems in higher education. Government
plays a dominant role not only in providing funds foreducation but also in the
administration and control of these institutions. It isnot uncommon that institutions may
be facing dictums from various entitiesthat are at times confusing and contradictory. Any
foreign organization tryingto build a relationship with these institutions must not be
daunted by suchambiguities and must work with them patiently.We have attempted to
identify various institutions of repute in Pune that
can be excellent candidates for further consideration by Finnish institutions.
Basically, educational planners in India avoid answering some important questions on the
design of a student loan programme. (Woodhall, M., 1987)lists such questions as: what
are the main objectives of the loan programme? What is the corresponding policy on
student fees and other forms of financial assistance? What proportion of students need to
be given loans? What should be the size of the loan for each student in relation to costs
such as tuition fees, expenditure on hostels, books, stationery, and other living costs? Can
loans be used as an incentive mechanism to reward students or motivate them in their
studies? How best can loan programmes reduce rates of default? Can the scheme be made
flexible to adjust to changing socio-economic conditions? etc. These questions assume
much importance for the success of the programme in India, but have never been
satisfactorily resolved, but simply tackled on an ad hoc basis. Student loans are advocated
on the grounds of (a) resource potential; (b) equity in sharing the costs of higher
education; and (c) efficiency by making students more serious with respect to their
education and careers. On the other hand, critics reject student loans on the grounds of (a)

99
reducing equity by limiting access to higher education; (b) administrative difficulties in
general; and (c) problems of recovery. All these arguments are open to empirical
verification, but detailed data for a critical analysis of these questions are not available in
India. Nevertheless, this article has discussed some evidence on these questions in the
Indian context. There is not much evidence in support of the arguments made in favour of
student loans, while the scanty evidence available suggests that many of the arguments
made against student loans appear to be valid in India. The main conclusion, therefore, is
that unless student loans are accompanied by carefully formulated policies regarding fees,
loans may aggravate rather than reduce inequities, with the rich getting public subsidies
through low levels of fees, and the poor paying back in full for their education through
student loans. All this may lead to inequality of access and declining participation in
higher education by ethnic minorities, as Indian critics of student loans suggest In all,
access to higher education may be seriously reduced by student loan programmes, as
critics maintain. Hence student loans must be judged more in terms of generating
finances for higher education, rather than as a measure to improve access and equity in
higher education, and this article suggests that the existing loan programme in India is
disappointing in this regard
2.3 Research Gap
The study of the Literature indicates that there are no studies available on financial issues
involved from a student’s perspective inIndia.
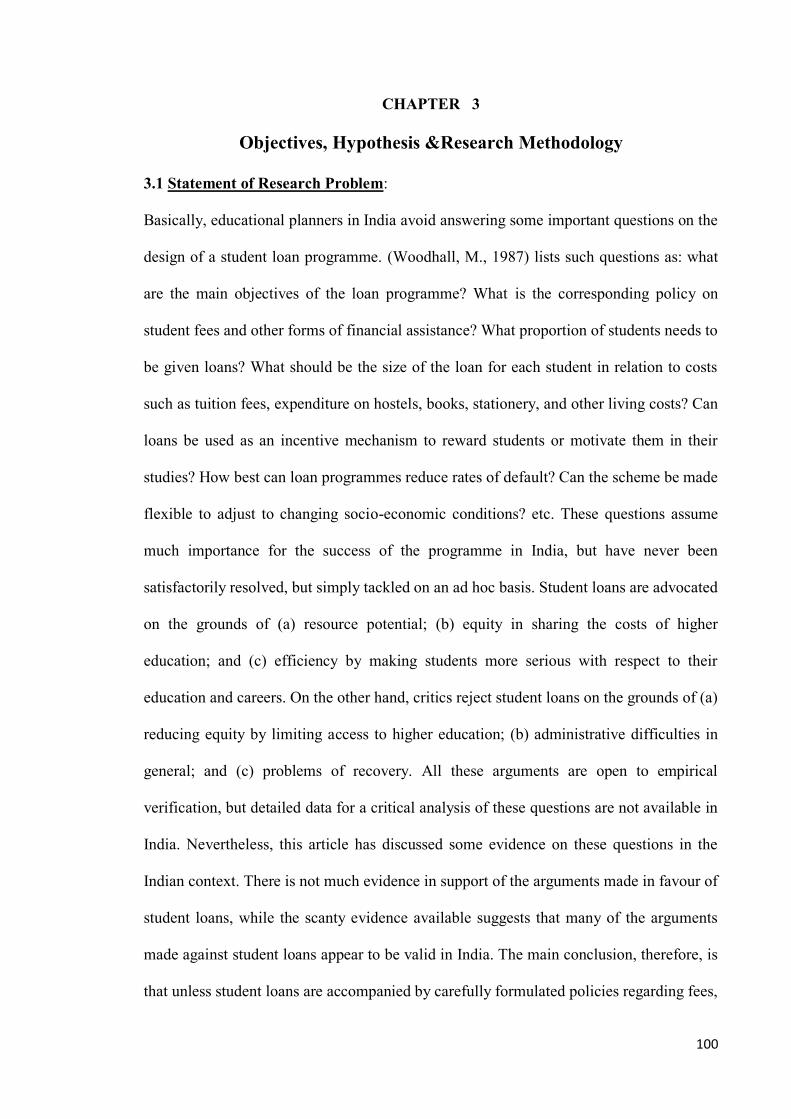
100
CHAPTER 3
Objectives, Hypothesis &Research Methodology
3.1 Statement of Research Problem:
Basically, educational planners in India avoid answering some important questions on the
design of a student loan programme. (Woodhall, M., 1987) lists such questions as: what
are the main objectives of the loan programme? What is the corresponding policy on
student fees and other forms of financial assistance? What proportion of students needs to
be given loans? What should be the size of the loan for each student in relation to costs
such as tuition fees, expenditure on hostels, books, stationery, and other living costs? Can
loans be used as an incentive mechanism to reward students or motivate them in their
studies? How best can loan programmes reduce rates of default? Can the scheme be made
flexible to adjust to changing socio-economic conditions? etc. These questions assume
much importance for the success of the programme in India, but have never been
satisfactorily resolved, but simply tackled on an ad hoc basis. Student loans are advocated
on the grounds of (a) resource potential; (b) equity in sharing the costs of higher
education; and (c) efficiency by making students more serious with respect to their
education and careers. On the other hand, critics reject student loans on the grounds of (a)
reducing equity by limiting access to higher education; (b) administrative difficulties in
general; and (c) problems of recovery. All these arguments are open to empirical
verification, but detailed data for a critical analysis of these questions are not available in
India. Nevertheless, this article has discussed some evidence on these questions in the
Indian context. There is not much evidence in support of the arguments made in favour of
student loans, while the scanty evidence available suggests that many of the arguments
made against student loans appear to be valid in India. The main conclusion, therefore, is
that unless student loans are accompanied by carefully formulated policies regarding fees,
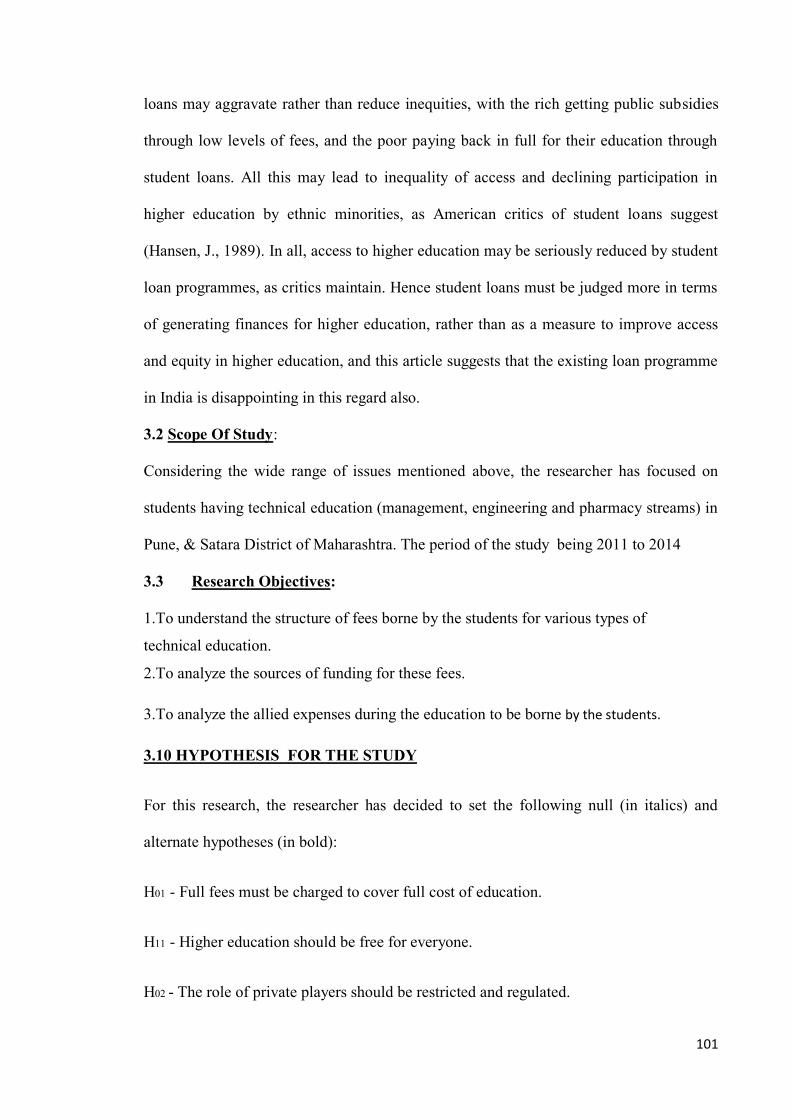
101
loans may aggravate rather than reduce inequities, with the rich getting public subsidies
through low levels of fees, and the poor paying back in full for their education through
student loans. All this may lead to inequality of access and declining participation in
higher education by ethnic minorities, as American critics of student loans suggest
(Hansen, J., 1989). In all, access to higher education may be seriously reduced by student
loan programmes, as critics maintain. Hence student loans must be judged more in terms
of generating finances for higher education, rather than as a measure to improve access
and equity in higher education, and this article suggests that the existing loan programme
in India is disappointing in this regard also.
3.2 Scope Of Study:
Considering the wide range of issues mentioned above, the researcher has focused on
students having technical education (management, engineering and pharmacy streams) in
Pune, & Satara District of Maharashtra. The period of the study being 2011 to 2014
3.3 Research Objectives:
1.To understand the structure of fees borne by the students for various types of
technical education.
2.To analyze the sources of funding for these fees.
3.To analyze the allied expenses during the education to be borne by the students.
3.10 HYPOTHESIS FOR THE STUDY
For this research, the researcher has decided to set the following null (in italics) and
alternate hypotheses (in bold):
H01 - Full fees must be charged to cover full cost of education.
H11 - Higher education should be free for everyone.
H02 - The role of private players should be restricted and regulated.

102
H12 - We need greater private participation in higher education.
H03 - A national education regulatory authority should be established to monitor.
H13 - There is no need to replace the Existing regulatory authorities Such as
UGC, AICTE etc.
H04 - higher education Fees should reflect cost of providing education.
H14 - Student fees must be kept low by public funding.
H05 - Fees should remain constant even when salaries rise.
H15 - Student fees should be linked to faculty salaries.
H06 - Fees in self financed course is not very high.
H16 - Fees in self-financed courses are generally very high.
H07 - There is no need to increase tuition fees in funded aided courses.
H17 - There is a need to hike the fees in State/Government aided courses.
H08 - Loans are not substitute for state funding education.
H18 - Student loans can take care of needs of poor students.
H09 - Institutions should largely depend on student fees or government funding.
H19 - Higher educational institutions should augment resources by research,
consultancy etc.
H10 - Government lacks the will to spend more on higher education.
H110 - Government lacks the resources to enhance spending on higher Education.

103
3.5 Research Methodology:
This section outlines the research method used for thestudy, which includes Data
Collection, Sample Design and Data Processing
3.5.1 Data Source:
The researcher has used secondary data in the form of various governments reports,
published statistics of higher education in India and other such material as has been
published in various research journals and periodicals. For the primary data, the
researcher has approached about 3200 students and about 15 each from Principles and 05
from Bankers.
3.5.2 Research Questionnaires:
3 Sets of questionnaire was used for study
1 . for Students
2. for Principal / Trustee
3 .for Bankers
3.6 Research Study
Research Methodology used was descriptive in nature .
Secondary Data for the study was collected from various available sources through desk
research including literature survey and referring e-libraries etc. Review of literature and
other available information from various published and unpublished Reports. Journals,
Books, Newspapers etc (including databases like Ebasco, Pro-quest, Sage Journals,
McKinsey and Co, IJRCM, Google Scholar, HubSpot, LNS Research, and Others
Sampling Plan
The target population of the study was identified as students from Different Institutions
With this assumption, the sample size can be determined by the formula:

104
Size and Design of Sample
The study was conducted Pune & Satara . The sampling method used was Stratified
Random Sampling. The sample units were Students, Principal and Banker
Sample Size: The total valid sample for the study was 2442students 15 Trustee/Principal
& 5 Bankers
Field Study:
A total of 3200 students was targeted and data collected from them, the spatial
distribution of theses 3200 students is as follows:-
of these 2442 students data was considered to be valid as relevant.
Aea of Study Pharmacy Engineering Management Total
Pune 160 2210 275 2645
Satara 65 425 65 555
Total 225 2635 340 3200
3.7 Data Analysis:
Data analysis was done using SPSS16 and chi-squared was primarily used as the
tool for analysis.
3.8 Questionnaire Design:
3.8.1 The questionnaire of students comprised of 19 questions
1.Demographic Issues -8 questions
2.Fees Paid By students – 3 questions
3.Students Loan – 2 questions
4.Faculty Related – 3 questions
5.Perception about College performance – 2 Questions
3.8.2 The questionnaire of Trustee/Principal comprised of 15 questions
1.Demographic Issues -6 questions
2.Fees Paid By students – 1 questions
3.Students Loan – 3 questions
4.Scholarship related – 02 questionns
5.Related to Hypothesis – 3 questions.
105
3.8.3 The questionnaire of Bankers comprised of 13 questions
1.Demographic Issues -4 questions.
2. Students loan – 5 questions.
3. Related to Hypothesis – 4 questions.
3.11 Limitations of The Study:
The study considers only students from chosen cities. Hence, it may not represent the
whole of the India. Additional the study does not consider the aspect of otherhigher
educationlike theHealth Sciences Education etc.

106
CHAPTER 4
DATA ANALYSIS AND FINDINGS
4.1 PILOT STUDY
The researcher has prepared a separate questionnaire for students of different courses.
Such questionnaire has been administered on 150 students undergoing different technical
courses, such as, Engineering (UG & PG), Pharmacy (UG & PG), and Management. The
whole idea was to test the correctness of the structure and language of the questionnaire,
as also the usefulness of the same in the context of this research. Out of these 150
students, only 132 students reliable at valid questionnaire was obtained .
The reliability has been checked with the help of cronbach alpha, the results are as
follows
As the cronbach’s Alpha is 0.801 (i.e. greater than 0.70), the questionnaire has been
proved to be reliable.The data has been tabulated in Microsoft Excel for Demographic
analysis.
COLLEGE
PERFORMAN
CE
PARAMETER
S
TEACHE
R
PERFOR
MANCE
ACAD
EMIC
FACIL
ITIES
NON-
TEACH
ING
BEHAV
IOUR
LIBR
ARY
FACI
LITY
COMP
UTER
FACIL
ITY
PARK
ING
FACI
LITY
SPOR
TS &
CULT
URAL
CO-
CURRIC
ULAR,
EXTRA
CURRIC
ULAR
CANT
EEN
&
MESS
OVER
ALL
COLL
EGE
RATI
NG
Mean 3.03 2.89 3.08 3.19 3.20 2.62 3.26 3.14 2.67 3.08
Median 3.00 3.00 3.00 3.00 3.00 3.00 3.00 3.00 3.00 3.00
Mode 3.00 3.00 4.00 4.00 4.00 3.00 4.00 4.00 3.00 3.00
Std.Deviation 0.85 0.95 0.98 0.91 0.86 1.24 0.86 0.91 1.06 0.66
Kurtosis -0.44 -0.87 0.60 2.29 0.20 -0.66 0.87 0.47 -0.15 0.74
Skewness -0.52 -0.37 -1.01 -1.36 -0.93 -0.63 -1.05 -0.94 -0.68 -0.49
Range 3.00 3.00 4.00 4.00 3.00 4.00 4.00 4.00 4.00 3.00
Count 132 132 132 132 132 132 132 132 132 132
Confidence
Level(95.0%) 0.04 0.04 0.04 0.04 0.04 0.05 0.04 0.04 0.04 0.03
Reliability Statistics
Cronbach's Alpha N of Items
0.801 38
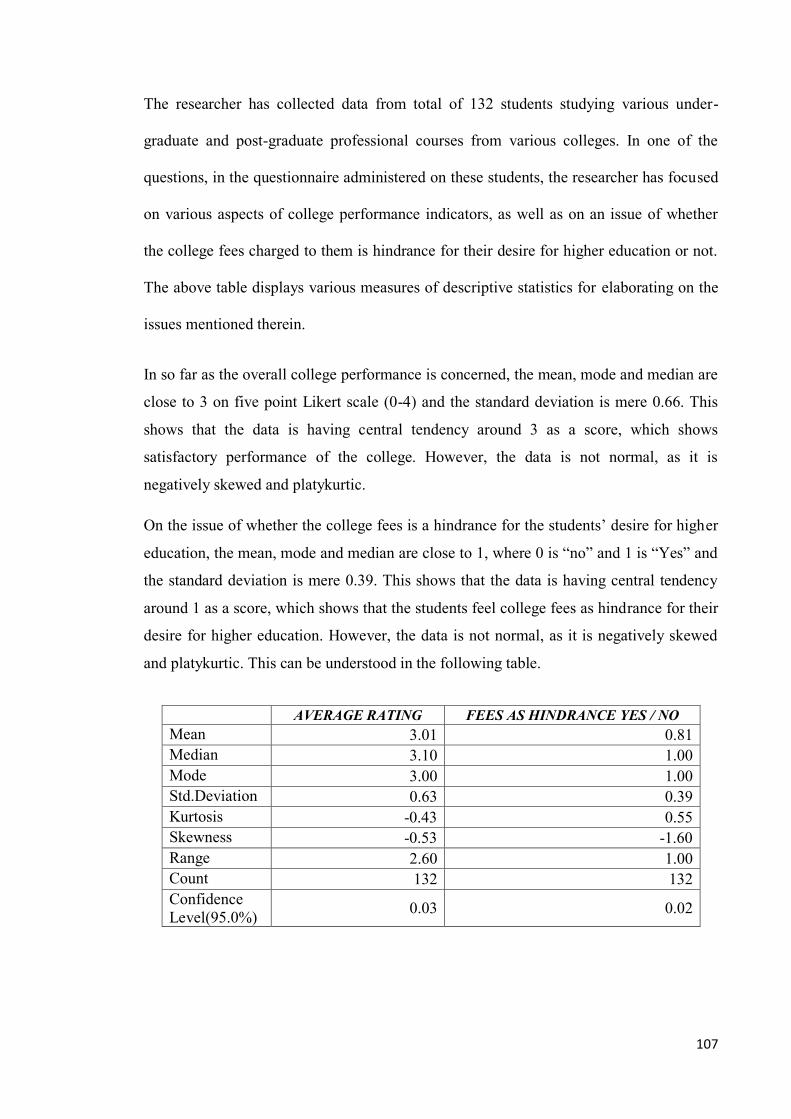
107
The researcher has collected data from total of 132 students studying various under-
graduate and post-graduate professional courses from various colleges. In one of the
questions, in the questionnaire administered on these students, the researcher has focused
on various aspects of college performance indicators, as well as on an issue of whether
the college fees charged to them is hindrance for their desire for higher education or not.
The above table displays various measures of descriptive statistics for elaborating on the
issues mentioned therein.
In so far as the overall college performance is concerned, the mean, mode and median are
close to 3 on five point Likert scale (0-4) and the standard deviation is mere 0.66. This
shows that the data is having central tendency around 3 as a score, which shows
satisfactory performance of the college. However, the data is not normal, as it is
negatively skewed and platykurtic.
On the issue of whether the college fees is a hindrance for the students’ desire for higher
education, the mean, mode and median are close to 1, where 0 is “no” and 1 is “Yes” and
the standard deviation is mere 0.39. This shows that the data is having central tendency
around 1 as a score, which shows that the students feel college fees as hindrance for their
desire for higher education. However, the data is not normal, as it is negatively skewed
and platykurtic. This can be understood in the following table.
AVERAGE RATING FEES AS HINDRANCE YES / NO
Mean 3.01 0.81
Median 3.10 1.00
Mode 3.00 1.00
Std.Deviation 0.63 0.39
Kurtosis -0.43 0.55
Skewness -0.53 -1.60
Range 2.60 1.00
Count 132 132
Confidence
Level(95.0%) 0.03 0.02

108
FEES AS HINDRANCE
YES / NO
SATISFIED WITH LOAN FACILITIES
YES/NO
Mean 0.81 0.74
Variance 0.15 0.19
Observations 132 132
Pearson Correlation
0.44
df 131
t Stat 7.11
P(T<=t) one-
tail 0.00
t Critical one-
tail 1.65
When the researcher has compared two important issues, i.e. whether fees is a hindrance
for their desire for higher education and whether they are satisfied with education loan
facilities available, there is a weak positive correlation between the two. However, as the
p value is less than 0.05 and the calculated t is greater than the t critical, these two
important issues are statistically significantly different.
PIL
OT
ST
UD
Y
DE
SC
RIP
TIV
E
ST
AT
IST
ICS
Hig
her
ed
uca
tio
n s
ho
uld
be
free
fo
r ev
ery
on
e.
We
nee
d g
rea
ter
pri
va
te
pa
rtic
ipa
tio
n i
n h
igh
er
edu
cati
on
Th
ere
is n
o n
eed
to
rep
lace
th
e E
xis
tin
g
reg
ula
tory
au
tho
riti
es
Su
ch a
s U
GC
, A
ICT
E e
tc.
Sch
ola
rsh
ips
an
d t
uit
ion
fees
waiv
er a
re t
o b
e
giv
en t
o l
arg
e n
um
ber
s o
f
stu
den
ts
Stu
den
t fe
es s
ho
uld
be
lin
ked
to
fa
cu
lty
sala
ries
Fee
s in
sel
f-fi
na
nce
d
cou
rses
are
gen
era
lly
ver
y
hig
h.
Th
ere
is a
nee
d t
o h
ike
the
fees
in
Sta
te/G
ov
ern
men
t
aid
ed c
ou
rses
Stu
den
t lo
an
s ca
n t
ak
e
care
of
nee
ds
of
po
or
stu
den
ts
Hig
her
ed
uca
tio
na
l
inst
itu
tio
ns
sho
uld
au
gm
ent
reso
urc
es b
y
rese
arc
h, co
nsu
lta
ncy
etc
. G
ov
ern
men
t la
cks
the
reso
urc
es t
o e
nh
an
ce
spen
din
g o
n h
igh
er
Ed
uca
tio
n
Mean 0.70 0.50 0.39 0.79 0.69 0.67 0.27 0.63 0.73 0.35
Median 1.00 0.50 0.00 1.00 1.00 1.00 0.00 1.00 1.00 0.00
Standard
Deviatio
n
0.46 0.50 0.49 0.41 0.46 0.47 0.44 0.48 0.45 0.48
Kurtosis -1.20 -2.03 -1.84 0.03
-
1.33 -1.51 -0.85
-
1.74 -0.95 -1.61
Skew
ness -0.91 0.00 0.44 -1.42
-
0.83 -0.72 1.08
-
0.54 -1.03 0.64
Count 132
132 132 132 132 132 132 132 132 132
Confide
nce
Level
(95.0%)
0.08 0.09 0.08 0.07 0.08 0.08 0.08 0.08 0.08 0.08

109
The testing of these hypotheses is relatively not so complex, as the data for each one of
them is dichotomous. Each of the respondents shall either select Null Hypothesis or
Alternative Hypothesis. For Null Hypothesis the score is assumed to be 0 and for
alternative hypothesis the score is assumed to be 1. Hence, if the mean score is greater
than 0.50 and the median and/or mode is 1, the alternative hypothesis is accepted and the
null hypothesis is rejected and the vice versa is also true. Thus, the descriptive statistics
alone can help us decisively prove or disprove our hypotheses.
As the mean score is greater than 0.50 in case of H1, H4, H5, H6, H8, and H9, where the
median and mode are 1, the alternative hypotheses are accepted. However, as the mean
score is less than or equal to 0.50 in case of H2, H3, H7, and H10, where the median and
mode are 0 (zero), the null hypotheses are accepted.
Different Test : 1. Chi - Square Test
From the top row of the table, Pearson Chi-Square statistic, and p < 0.001; i.e., a very
small probability of the observed data under the null hypothesis of no relationship. The
null hypothesis is rejected, since p < 0.05 (in fact p < 0.001).
Frequencies
H1
Observed
N
Expected
N
0 466 1068
1 1670 1068
Total 2136
H1
Chi-Square 678.65918
df 1
Asymp. Sig. 1.31E-149
2. Binomial Test
The output tells us that there are two groups: NO (denoted by 0) and YES (denoted by 1).
The column labeled N tells us that there were 2136 students considered for this test. The
Observed Prop. column gives the observed proportions. The next column, Test Prop.,

110
gives the value that is entered in the Test Proportion box in the Binomial Test dialog box.
The last column, Asymp. Sig. (2-tailed), gives the p value for this statistical test. As
always, when the p value is less than or equal to α level, one can reject H0.
The p value is .000 which is less than or equal to our α level of .05. Thus, we reject H0.
Category N Observed
Prop.
Test
Prop.
Asump. Sig.
(2-tailed)
H1 Group 1 1 1670 0.78 0.5 .000a
Group 2 0 466 0.22
Total 2136 1
3. The Friedman Test :
The Friedman test is the significance test for more than two dependent
samples and is also known as the Friedman two-way analysis of variance; it
is used to test the null hypothesis. In other words, it is used to test that
there is no significant difference between the size of 'k' dependent samples
and the population from which these have been drawn. In SPSS, the
Friedman test is done by selecting "Nonparametric Tests" from the analyze
menu and then selecting "K Related Samples." After this, select "Test
Variables," and then under the option test type, select "Friedman." The
Friedman test statistic is distributed approximately as chi-square, with (k -
1) degrees of freedom. The Friedman test statistic for more than two
dependent samples is given by the formula:
Chi-square Fr iedman = ([12/nk(k + 1)]*[SUM(T i2] - 3n(k + 1))
a. Friedman Test
Test Statistics(a)
N 2136
Chi-Square 3.00E+03
df 9
Asymp. Sig. 0

111
The Friedman test, which evaluated differences in medians among different 10
hypotheses, is not significant χ2(2, N = 2136) = 0.0003, p < .01. Kendall’s W is 0.156,
indicating fairly strong differences among these ten different hypotheses.
4. Kendall's W Test
Kendall 's W Test is referred to the normalization of the Friedman statistic. Kendall's
W is used to assess the trend of agreement among the respondents. In SPSS, Kendall's W
Test is done by selecting "Nonparametric Tests" from the analyze menu, and then by
clicking on "K Related Samples." After this, select "Test Variables," and then under the
option test type, select "Kendall's W." Kendall's W ranges from 0 to 1. The value '1'
refers to the complete agreement among/between the raters, and value '0' refers to the
complete.
Kendall's W Test
Ranks
Mean
Rank
H1 6.57
H2 4.71
H3 4.62
H4 6.69
H5 6.11
H6 5.81
H7 4.05
H8 5.54
H9 6.45
H10 4.46
Test Statistics
N 2136
Kendall's Wa 0.156
Chi-Square 3.00E+03
df 9
Asymp. Sig. 0
a. Kendall's Coefficient of Concordance

112
5. The Cochran's Q test
The Cochran's Q test is used to test whether or not the part of a given
variable is the same across the multiple dependent samples. In SPSS, the
Cochran's Q test is done by selecting "Nonparametric Tests" from the
analyze menu, and then selecting "K Related Samples." After this, select
"Test Variables," and then under test type, select "Cochran's Q."
6. Anova Test
Sum of
Squares df
Mean
Square F Sig.
H1 Between
Groups 88.374682 7 12.624955 97.354154 1.37E-123
Within
Groups 275.96052 2128 0.1296807
Total 364.33521 2135
Test of Hypothesis -2
Chi - Square Test
H2
Observed N Expected N
0 1258 1068
1 878 1068
Total 2136
H2
Chi-Square 67.602996
df 1
Asymp. Sig. 2E-16
Biominal Test
Category N Observed
Prop.
Test
Prop.
Asymp. Sig.
(2-tailed)
H2 Group 1 1 878 0.41 0.5 .000a
Group 2 0 1258 0.59
Total 2136 1

113
ANOVA
Sum of
Squares df
Mean
Square F Sig.
H2 Between Groups 88.051832 7 12.578833 62.388808 7.472E-
82
Within Groups 429.04742 2128 0.20162
Total 517.0992 2135
Test of Hypothesis -3
Chi - Square Test
H3
Observed N Expected N
0 1299 1068
1 837 1068
Total 2136
H3
Chi-Square 99.926966
df 1
Asymp. Sig. 1.581E-23
Biominal Test
Category N Observed
Prop.
Test
Prop.
Asymp. Sig.
(2-tailed)
H3 Group 1 0 1299 0.61 0.5 .000a
Group 2 1 837 0.39
Total 2136 1
ANOVA
Sum of
Squares df
Mean
Square F Sig.
H3 Between
Groups 44.125159 7 6.3035941 28.854049
3.181E-
38
Within
Groups 464.8931 2128 0.2184648
Total 509.01826 2135

114
Test of Hypothesis 4
Chi - Square Test
H4
Chi-Square 798.51873
df 1
Asymp. Sig. 1.13E-175
Biominal Test
Category N Observed Prop. Test Prop. Asymp. Sig.
(2-tailed)
H4 Group 1 1 1721 0.81 0.5 .000a
Group 2 0 415 0.19
Total 2136 1
ANOVA
Sum of Squares df
Mean
Squar
e
F Sig.
Total 509.01826 2135
H4 Between Groups 24.329806 7 3.475
6866
23.855
789 2.024E-31
Within Groups 310.04051 2128 0.145
6957
Total 334.37032 2135
H4
Observed N Expected N
0 415 1068
1 1721 1068
Total 2136

115
Test of Hypothesis 5
Chi - Square Test
H5
Observed N Expected N
0 660 1068
1 1476 1068
Total 2136
H5
Chi-
Square 311.73034
df 1
Asymp.
Sig. 9.168E-70
Binomial Test
Cate
gory N Observed Prop.
Test
Prop.
Asymp.
Sig. (2-
tailed)
H5 Group 1 0 660 0.31 0.5 .000a
Group 2 1 1476 0.69
Total 2136 1
ANOVA
Sum of Squares df
Mean
Squar
e
F Sig.
H5 Between
Groups 131.59928 7
18.79
9896 123.29771 2.4E-152
Within
Groups 324.46814
212
8
0.152
4756
Total 456.06742 213
5

116
Test of Hypothesis 6
Chi - Square Test
H6
Observe
d N
Expe
cted
N
0 790 1068
1 1346 1068
Total 2136
H6
Chi-
Square 144.72659
df 1
Asymp.
Sig. 2.465E-33
Binomial Test
Categor
y N
Observed
Prop. Test Prop.
Asymp. Sig. (2-
tailed)
H6 Group 1 1 1346 0.63 0.5 .000a
Group 2 0 790 0.37
Total 2136 1
ANOVA
Sum of
Squares df
Mean
Square F Sig.
H6
Betwee
n
Groups
94.3278
71 7
13.475
41
71.069
019 1.476E-92
Within
Groups
403.490
48 2128
0.1896
102
Total 497.818
35 2135

117
Test of Hypothesis - 7
Chi - Square Test
H7
Observed N Expected N
0 1541 1068
1 595 1068
Tota
l 2136
H7
Chi-Square 418.96816
df 1
Asymp. Sig. 4.093E-93
Binomial Test
Catego
ry N
Observed
Prop.
Test
Prop.
Asymp. Sig. (2-
tailed)
H7 Group 1 1 595 0.28 0.5 .000a
Group 2 0 1541 0.72
Total 2136 1
ANOVA
Sum of
Squares df
Mean
Square F Sig.
H7
Betwee
n
Groups
86.0014
32 7
12.285
919 76.16588 9.82E-99
Within
Groups
343.256
53 2128
0.1613
048
Total 429.257
96 2135
Test of Hypothesis - 8
Chi - Square Test
H8
Observed N Expected N
0 904 1068
1 1232 1068
Total 2136
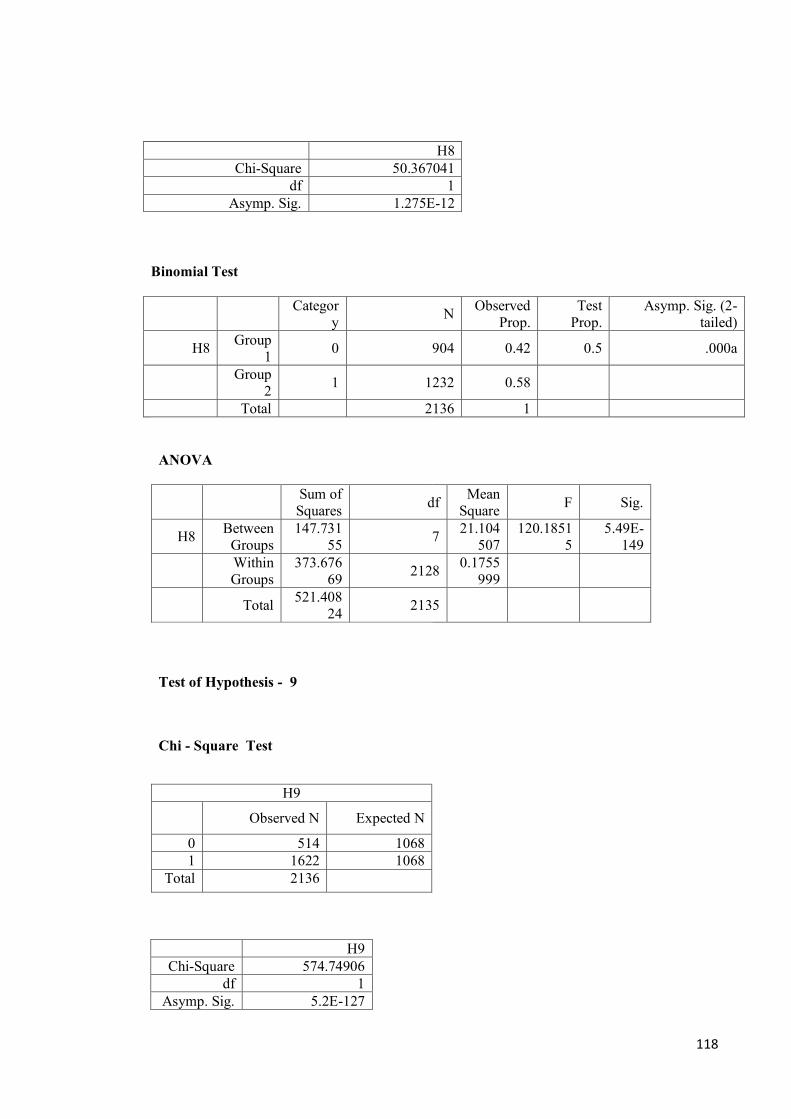
118
H8
Chi-Square 50.367041
df 1
Asymp. Sig. 1.275E-12
Binomial Test
Categor
y N
Observed
Prop.
Test
Prop.
Asymp. Sig. (2-
tailed)
H8 Group
1 0 904 0.42 0.5 .000a
Group
2 1 1232 0.58
Total 2136 1
ANOVA
Sum of
Squares df
Mean
Square F Sig.
H8 Between
Groups
147.731
55 7
21.104
507
120.1851
5
5.49E-
149
Within
Groups
373.676
69 2128
0.1755
999
Total 521.408
24 2135
Test of Hypothesis - 9
Chi - Square Test
H9
Observed N Expected N
0 514 1068
1 1622 1068
Total 2136
H9
Chi-Square 574.74906
df 1
Asymp. Sig. 5.2E-127

119
Binomial Test
Categ
ory N
Observed
Prop.
Test
Prop.
Asymp. Sig.
(2-tailed)
H
9 Group 1 0 514 0.24 0.5 .000a
Group 2 1 1622 0.76
Total 2136 1
ANOVA
Sum of
Squares df
Mean
Square F Sig.
H
9 Between Groups 34.781693 7
4.9688
133
29.74039
8
2.011E-
39
Within Groups 355.53104 2128 0.1670
729
Total 390.31273 2135
Test of Hypothesis - 10
Chi - Square Test
H10
Observed N Expected N
0 1367 1068
1 769 1068
Total 2136
H10
Chi-Square 167.4176
df 1
Asymp. Sig. 2.712E-38
a. 0 cells (.0%) have expected frequencies less than 5. The minimum expected cell frequency is
1068.0.
Binomial Test
Categ
ory N
Observed
Prop.
Test
Prop.
Asymp.
Sig. (2-
tailed)
H10 Group 1 1 769 0.36 0.5 .000a
Group 2 0 1367 0.64
Total 2136 1
a. Based on Z
Approximation.

120
ANOVA
Sum of
Squares df
Mean
Square F Sig.
H10 Between
Groups
121.9735
1 7
17.4247
87
100.1694
8 8.51E-127
Within
Groups
370.1720
9 2128
0.17395
31
Total 492.1456 2135
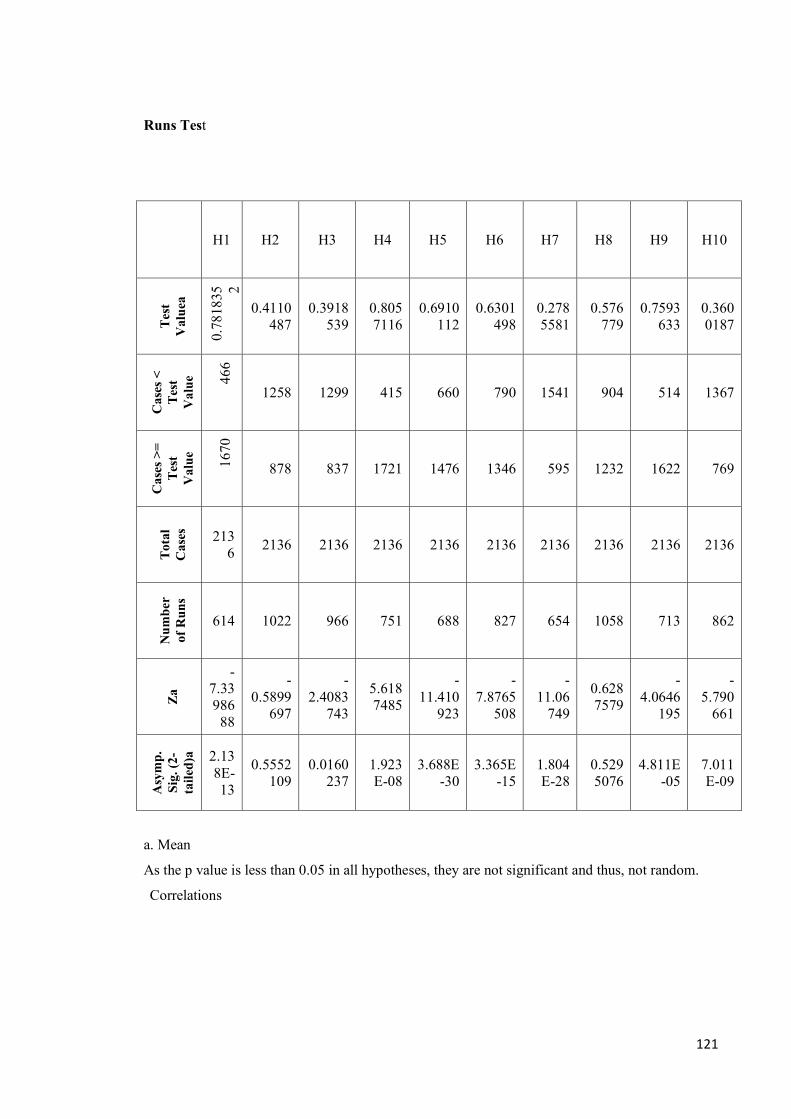
121
As the p value is less than 0.05 in all hypotheses, they are not significant and thus, not random.
Correlations
Runs Test
H1 H2 H3 H4 H5 H6 H7 H8 H9 H10
Tes
t
Valu
ea
0.7
818
35 2
0.4110
487
0.3918
539
0.805
7116
0.6910
112
0.6301
498
0.278
5581
0.576
779
0.7593
633
0.360
0187
Case
s <
Tes
t
Valu
e 46
6
1258 1299 415 660 790 1541 904 514 1367
Case
s >
=
Tes
t
Valu
e
16
70
878 837 1721 1476 1346 595 1232 1622 769
Tota
l
Case
s
213
6 2136 2136 2136 2136 2136 2136 2136 2136 2136
Nu
mb
er
of
Ru
ns
614 1022 966 751 688 827 654 1058 713 862
Za
-
7.33
986
88
-
0.5899
697
-
2.4083
743
5.618
7485
-
11.410
923
-
7.8765
508
-
11.06
749
0.628
7579
-
4.0646
195
-
5.790
661
Asy
mp
.
Sig
. (2
-
tail
ed)a
2.13
8E-
13
0.5552
109
0.0160
237
1.923
E-08
3.688E
-30
3.365E
-15
1.804
E-28
0.529
5076
4.811E
-05
7.011
E-09
a. Mean
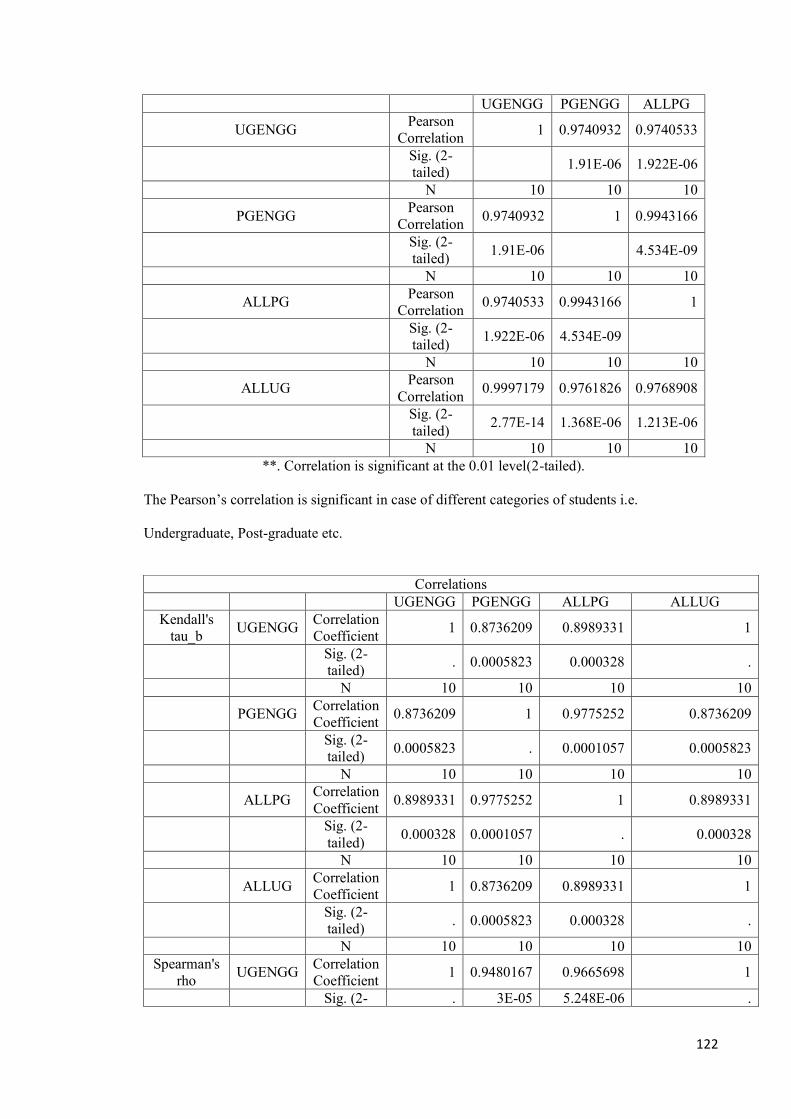
122
UGENGG PGENGG ALLPG
UGENGG Pearson
Correlation 1 0.9740932 0.9740533
Sig. (2-
tailed) 1.91E-06 1.922E-06
N 10 10 10
PGENGG Pearson
Correlation 0.9740932 1 0.9943166
Sig. (2-
tailed) 1.91E-06 4.534E-09
N 10 10 10
ALLPG Pearson
Correlation 0.9740533 0.9943166 1
Sig. (2-
tailed) 1.922E-06 4.534E-09
N 10 10 10
ALLUG Pearson
Correlation 0.9997179 0.9761826 0.9768908
Sig. (2-
tailed) 2.77E-14 1.368E-06 1.213E-06
N 10 10 10
**. Correlation is significant at the 0.01 level(2-tailed).
The Pearson’s correlation is significant in case of different categories of students i.e.
Undergraduate, Post-graduate etc.
Correlations
UGENGG PGENGG ALLPG ALLUG
Kendall's
tau_b UGENGG
Correlation
Coefficient 1 0.8736209 0.8989331 1
Sig. (2-
tailed) . 0.0005823 0.000328 .
N 10 10 10 10
PGENGG Correlation
Coefficient 0.8736209 1 0.9775252 0.8736209
Sig. (2-
tailed) 0.0005823 . 0.0001057 0.0005823
N 10 10 10 10
ALLPG Correlation
Coefficient 0.8989331 0.9775252 1 0.8989331
Sig. (2-
tailed) 0.000328 0.0001057 . 0.000328
N 10 10 10 10
ALLUG Correlation
Coefficient 1 0.8736209 0.8989331 1
Sig. (2-
tailed) . 0.0005823 0.000328 .
N 10 10 10 10
Spearman's
rho UGENGG
Correlation
Coefficient 1 0.9480167 0.9665698 1
Sig. (2- . 3E-05 5.248E-06 .
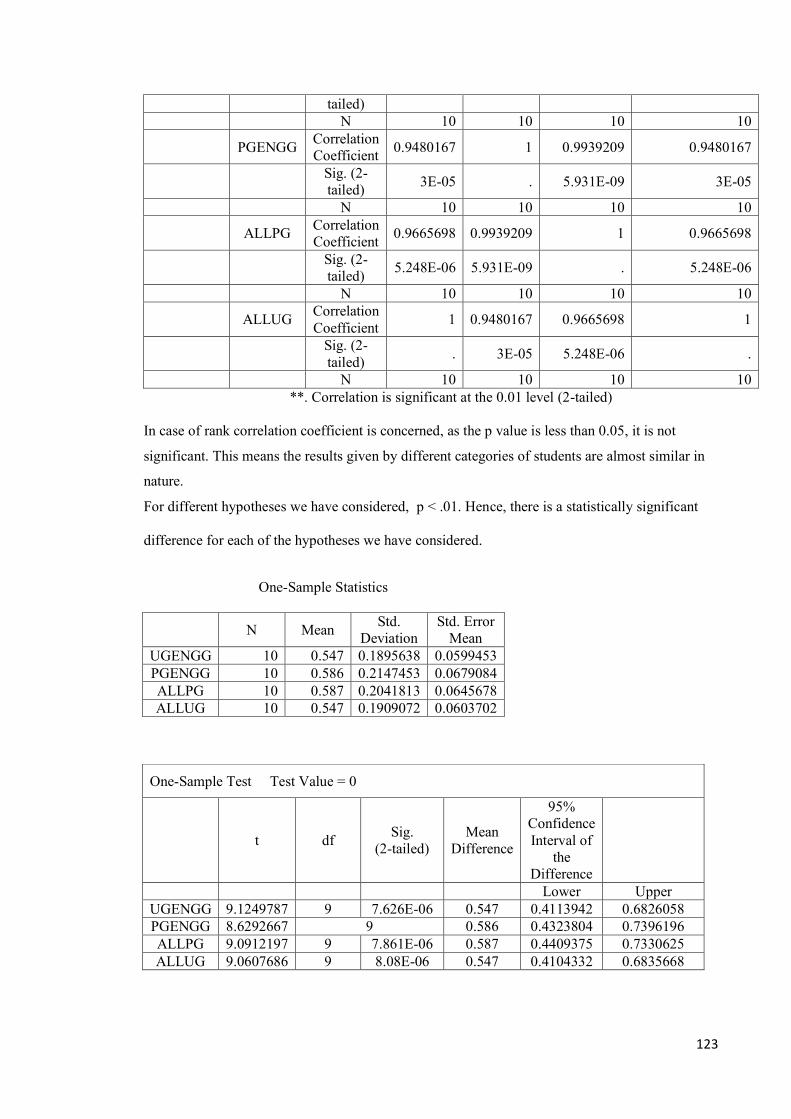
123
tailed)
N 10 10 10 10
PGENGG Correlation
Coefficient 0.9480167 1 0.9939209 0.9480167
Sig. (2-
tailed) 3E-05 . 5.931E-09 3E-05
N 10 10 10 10
ALLPG Correlation
Coefficient 0.9665698 0.9939209 1 0.9665698
Sig. (2-
tailed) 5.248E-06 5.931E-09 . 5.248E-06
N 10 10 10 10
ALLUG Correlation
Coefficient 1 0.9480167 0.9665698 1
Sig. (2-
tailed) . 3E-05 5.248E-06 .
N 10 10 10 10
**. Correlation is significant at the 0.01 level (2-tailed)
In case of rank correlation coefficient is concerned, as the p value is less than 0.05, it is not
significant. This means the results given by different categories of students are almost similar in
nature.
For different hypotheses we have considered, p < .01. Hence, there is a statistically significant
difference for each of the hypotheses we have considered.
One-Sample Statistics
N Mean Std.
Deviation
Std. Error
Mean
UGENGG 10 0.547 0.1895638 0.0599453
PGENGG 10 0.586 0.2147453 0.0679084
ALLPG 10 0.587 0.2041813 0.0645678
ALLUG 10 0.547 0.1909072 0.0603702
One-Sample Test Test Value = 0
t df Sig.
(2-tailed)
Mean
Difference
95%
Confidence
Interval of
the
Difference
Lower Upper
UGENGG 9.1249787 9 7.626E-06 0.547 0.4113942 0.6826058
PGENGG 8.6292667 9 0.586 0.4323804 0.7396196
ALLPG 9.0912197 9 7.861E-06 0.587 0.4409375 0.7330625
ALLUG 9.0607686 9 8.08E-06 0.547 0.4104332 0.6835668

124
The one sample t-test statistic is close to 9.00 and the p-value from this statistic is less than 0.05
(the level of significance usually used for the test) Such a p-value indicates that the categories of
the students are statistically significantly different from PG Engineering.
TYPE HYPODETAILS HYPONO Mean Median
Standard
Deviation Count
PG COMP SC
Higher
education should
be free for
everyone.
H1 0.80 1.00 0.41 25.00
PG CONSTR
ENGG
Higher
education should
be free for
everyone.
H1 0.89 1.00 0.31 47.00
PG DESIGN
ENGG
Higher
education should
be free for
everyone.
H1 0.86 1.00 0.35 37.00
PG M. PHARMA
Higher
education should
be free for
everyone.
H1 0.58 1.00 0.51 12.00
PG MBA
Higher
education should
be free for
everyone.
H1 0.80 1.00 0.40 132.00
PG MCA
Higher
education should
be free for
everyone.
H1 0.76 1.00 0.44 21.00
PG
NETWORKING
ENGG
Higher
education should
be free for
everyone.
H1 0.87 1.00 0.34 31.00
PG STRUCTURE
ENGG
Higher
education should
be free for
everyone.
H1 0.81 1.00 0.39 153.00
UG AUTO ENGG. Higher
education should
be free for
everyone.
H1 0.73 1.00 0.45 51.00
UG B. PHARMA
Higher
education should
be free for
everyone.
H1 0.77 1.00 0.42 110.00
UG CAD CAM
Higher
education should
be free for
everyone.
H1 0.67 1.00 0.58 3.00

125
UG CIVIL ENGG.
Higher
education should
be free for
everyone.
H1 0.78 1.00 0.42 171.00
UG COMMU
ENGG.
Higher
education should
be free for
everyone.
H1 0.55 1.00 0.51 20.00
UG COMP ENGG
Higher
education should
be free for
everyone.
H1 0.78 1.00 0.42 423.00
UG E & TC
Higher
education should
be free for
everyone.
H1 0.81 1.00 0.40 135.00
UG IT ENGG
Higher
education should
be free for
everyone.
H1 0.73 1.00 0.47 11.00
UG MECH ENGG
Higher
education should
be free for
everyone.
H1 0.77 1.00 0.42 754.00
PG COMP SC
We need greater
private
participation in
higher education
H2 0.60 1.00 0.50 25.00
PG CONSTR
ENGG
We need greater
private
participation in
higher education
H2 0.38 0.00 0.49 47.00
PG DESIGN
ENGG
We need greater
private
participation in
higher education
H2 0.41 0.00 0.50 37.00
PG M. PHARMA
We need greater
private
participation in
higher education
H2 0.50 0.50 0.52 12.00
PG MBA
We need greater
private
participation in
higher education
H2 0.41 0.00 0.49 132.00
PG MCA
We need greater
private
participation in
higher education
H2 0.62 1.00 0.50 21.00
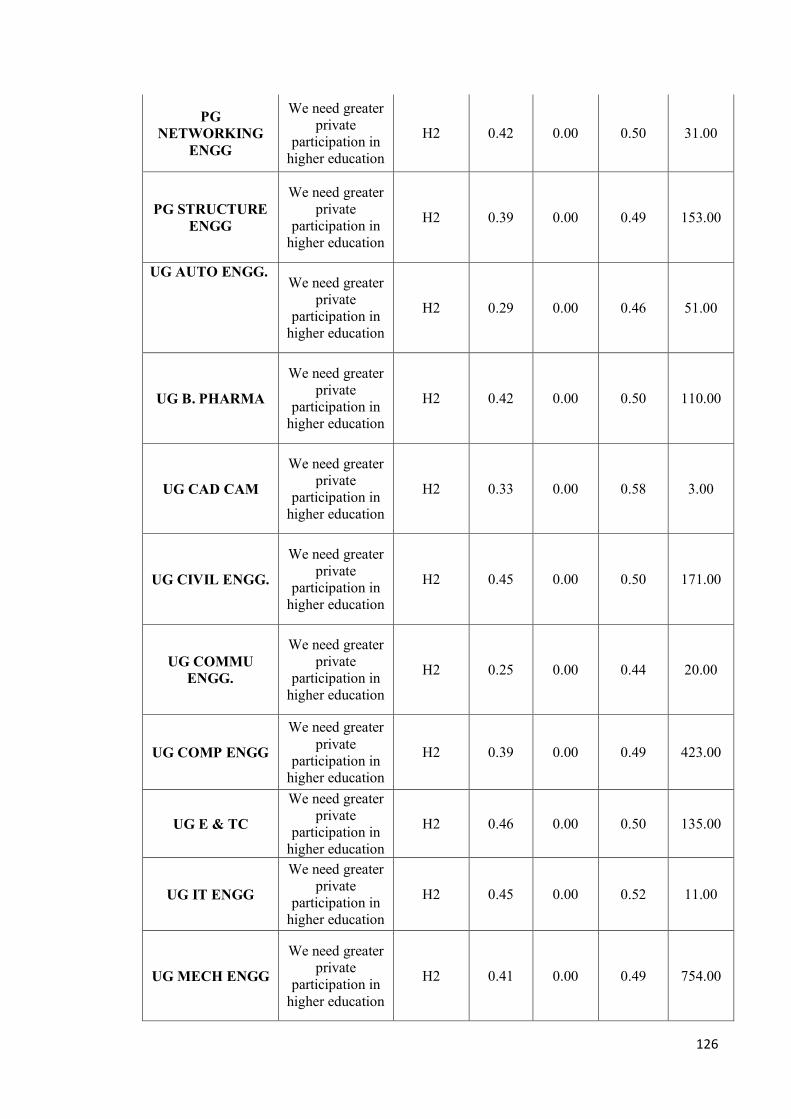
126
PG
NETWORKING
ENGG
We need greater
private
participation in
higher education
H2 0.42 0.00 0.50 31.00
PG STRUCTURE
ENGG
We need greater
private
participation in
higher education
H2 0.39 0.00 0.49 153.00
UG AUTO ENGG. We need greater
private
participation in
higher education
H2 0.29 0.00 0.46 51.00
UG B. PHARMA
We need greater
private
participation in
higher education
H2 0.42 0.00 0.50 110.00
UG CAD CAM
We need greater
private
participation in
higher education
H2 0.33 0.00 0.58 3.00
UG CIVIL ENGG.
We need greater
private
participation in
higher education
H2 0.45 0.00 0.50 171.00
UG COMMU
ENGG.
We need greater
private
participation in
higher education
H2 0.25 0.00 0.44 20.00
UG COMP ENGG
We need greater
private
participation in
higher education
H2 0.39 0.00 0.49 423.00
UG E & TC
We need greater
private
participation in
higher education
H2 0.46 0.00 0.50 135.00
UG IT ENGG
We need greater
private
participation in
higher education
H2 0.45 0.00 0.52 11.00
UG MECH ENGG
We need greater
private
participation in
higher education
H2 0.41 0.00 0.49 754.00
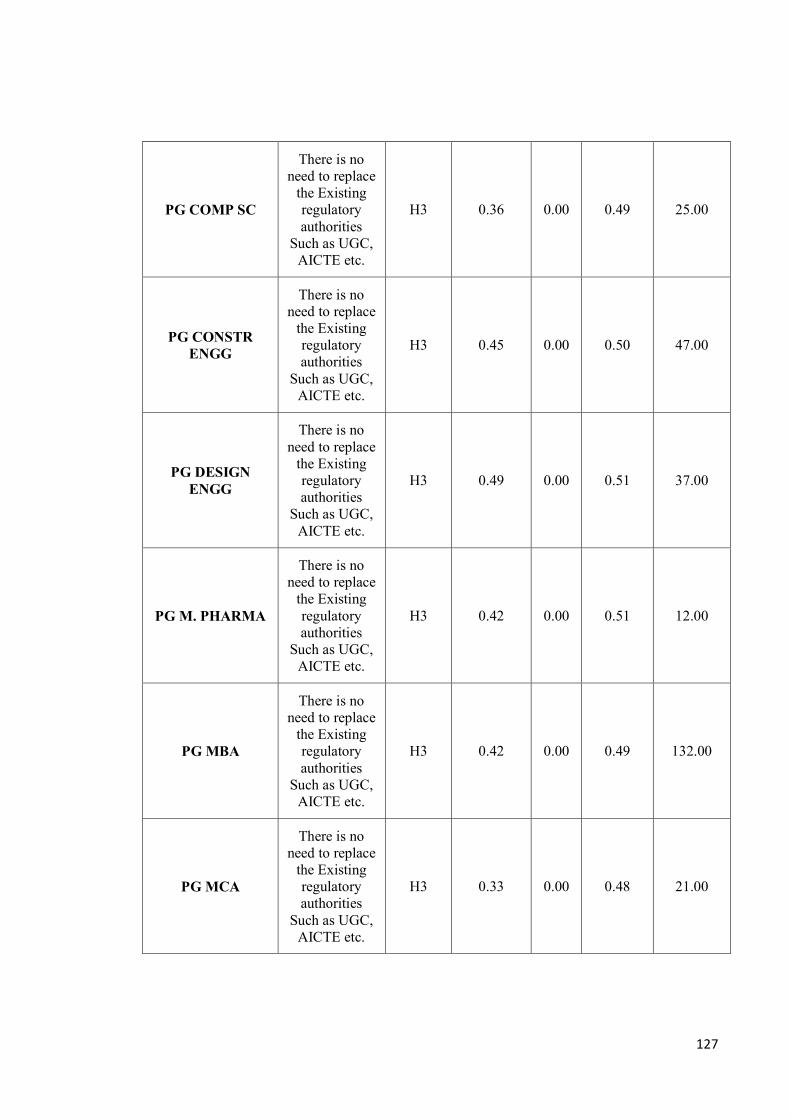
127
PG COMP SC
There is no
need to replace
the Existing
regulatory
authorities
Such as UGC,
AICTE etc.
H3 0.36 0.00 0.49 25.00
PG CONSTR
ENGG
There is no
need to replace
the Existing
regulatory
authorities
Such as UGC,
AICTE etc.
H3 0.45 0.00 0.50 47.00
PG DESIGN
ENGG
There is no
need to replace
the Existing
regulatory
authorities
Such as UGC,
AICTE etc.
H3 0.49 0.00 0.51 37.00
PG M. PHARMA
There is no
need to replace
the Existing
regulatory
authorities
Such as UGC,
AICTE etc.
H3 0.42 0.00 0.51 12.00
PG MBA
There is no
need to replace
the Existing
regulatory
authorities
Such as UGC,
AICTE etc.
H3 0.42 0.00 0.49 132.00
PG MCA
There is no
need to replace
the Existing
regulatory
authorities
Such as UGC,
AICTE etc.
H3 0.33 0.00 0.48 21.00

128
PG
NETWORKING
ENGG
There is no
need to replace
the Existing
regulatory
authorities
Such as UGC,
AICTE etc.
H3 0.39 0.00 0.50 31.00
PG STRUCTURE
ENGG
There is no
need to replace
the Existing
regulatory
authorities
Such as UGC,
AICTE etc.
H3 0.39 0.00 0.49 153.00
UG AUTO ENGG. There is no
need to replace
the Existing
regulatory
authorities
Such as UGC,
AICTE etc.
H3 0.31 0.00 0.47 51.00
UG B. PHARMA
There is no
need to replace
the Existing
regulatory
authorities
Such as UGC,
AICTE etc.
H3 0.40 0.00 0.49 110.00
UG CAD CAM
There is no
need to replace
the Existing
regulatory
authorities
Such as UGC,
AICTE etc.
H3 0.67 1.00 0.58 3.00
UG CIVIL ENGG.
There is no
need to replace
the Existing
regulatory
authorities
Such as UGC,
AICTE etc.
H3 0.42 0.00 0.49 171.00
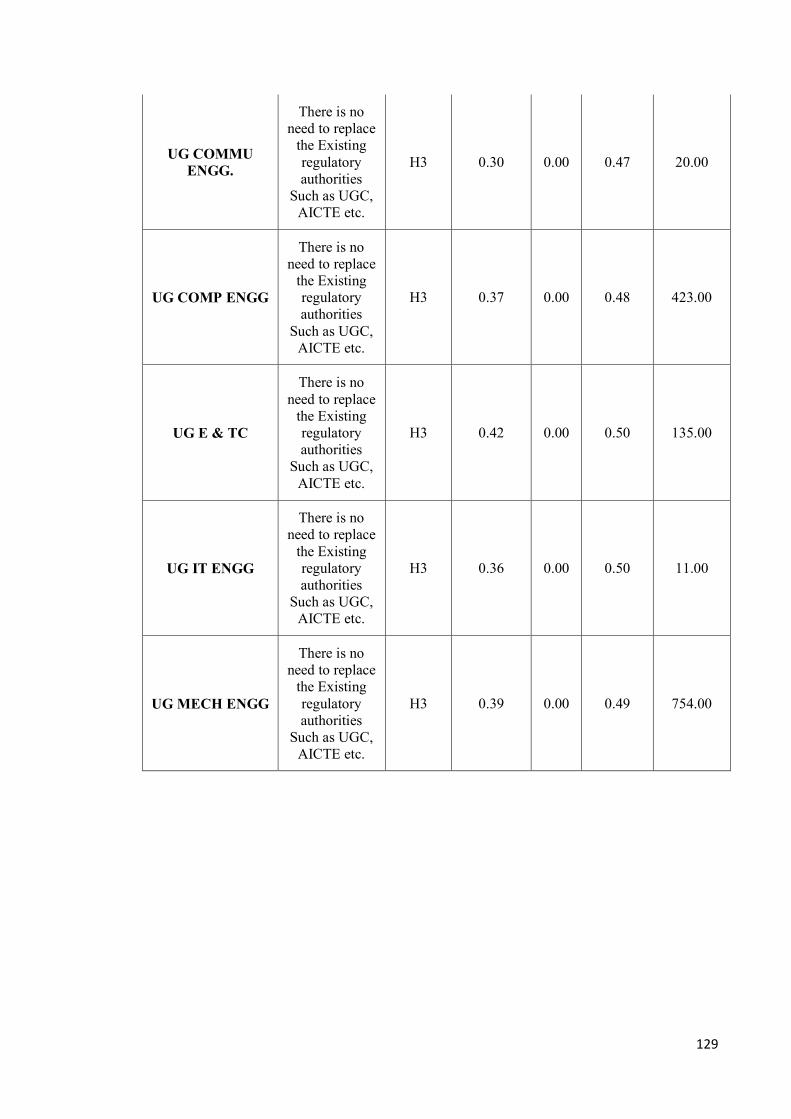
129
UG COMMU
ENGG.
There is no
need to replace
the Existing
regulatory
authorities
Such as UGC,
AICTE etc.
H3 0.30 0.00 0.47 20.00
UG COMP ENGG
There is no
need to replace
the Existing
regulatory
authorities
Such as UGC,
AICTE etc.
H3 0.37 0.00 0.48 423.00
UG E & TC
There is no
need to replace
the Existing
regulatory
authorities
Such as UGC,
AICTE etc.
H3 0.42 0.00 0.50 135.00
UG IT ENGG
There is no
need to replace
the Existing
regulatory
authorities
Such as UGC,
AICTE etc.
H3 0.36 0.00 0.50 11.00
UG MECH ENGG
There is no
need to replace
the Existing
regulatory
authorities
Such as UGC,
AICTE etc.
H3 0.39 0.00 0.49 754.00
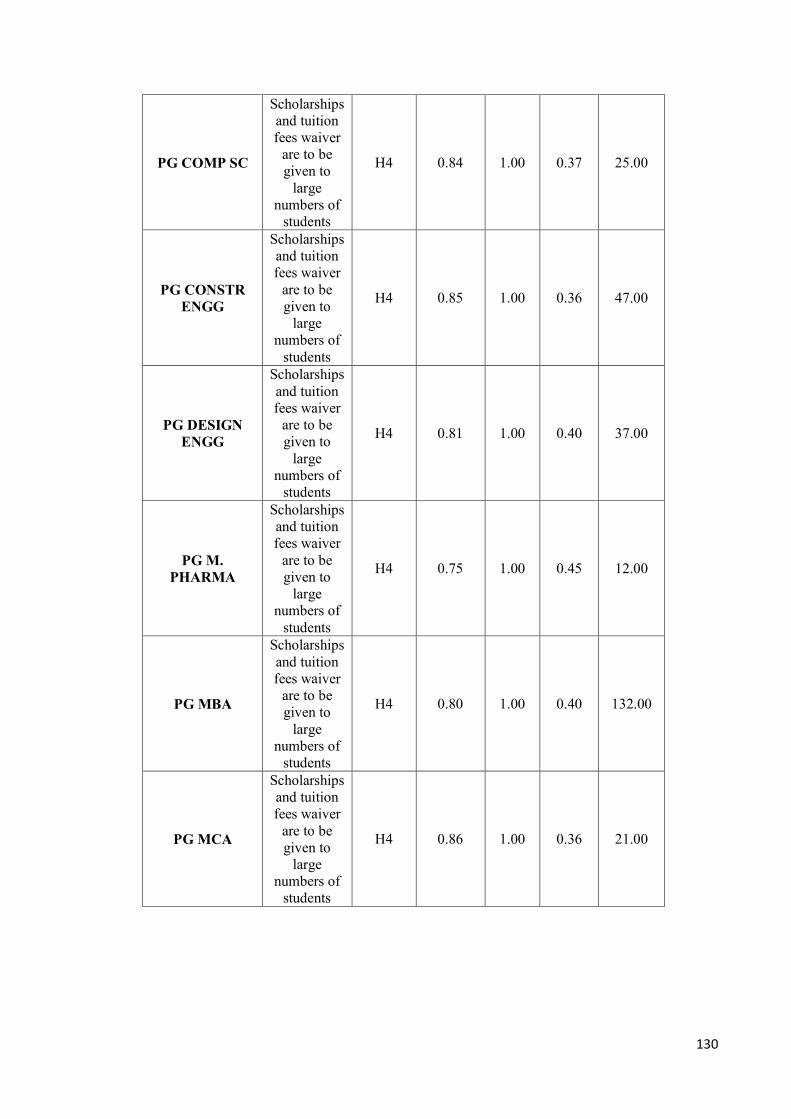
130
PG COMP SC
Scholarships
and tuition
fees waiver
are to be
given to
large
numbers of
students
H4 0.84 1.00 0.37 25.00
PG CONSTR
ENGG
Scholarships
and tuition
fees waiver
are to be
given to
large
numbers of
students
H4 0.85 1.00 0.36 47.00
PG DESIGN
ENGG
Scholarships
and tuition
fees waiver
are to be
given to
large
numbers of
students
H4 0.81 1.00 0.40 37.00
PG M.
PHARMA
Scholarships
and tuition
fees waiver
are to be
given to
large
numbers of
students
H4 0.75 1.00 0.45 12.00
PG MBA
Scholarships
and tuition
fees waiver
are to be
given to
large
numbers of
students
H4 0.80 1.00 0.40 132.00
PG MCA
Scholarships
and tuition
fees waiver
are to be
given to
large
numbers of
students
H4 0.86 1.00 0.36 21.00

131
PG
NETWORKING
ENGG
Scholarships
and tuition
fees waiver
are to be
given to
large
numbers of
students
H4 0.90 1.00 0.30 31.00
PG
STRUCTURE
ENGG
Scholarships
and tuition
fees waiver
are to be
given to
large
numbers of
students
H4 0.83 1.00 0.38 153.00
UG AUTO
ENGG.
Scholarships
and tuition
fees waiver
are to be
given to
large
numbers of
students
H4 0.76 1.00 0.43 51.00
UG B.
PHARMA
Scholarships
and tuition
fees waiver
are to be
given to
large
numbers of
students
H4 0.80 1.00 0.40 110.00
UG CAD CAM
Scholarships
and tuition
fees waiver
are to be
given to
large
numbers of
students
H4 0.67 1.00 0.58 3.00
UG CIVIL
ENGG.
Scholarships
and tuition
fees waiver
are to be
given to
large
numbers of
students
H4 0.80 1.00 0.40 171.00

132
UG COMMU
ENGG.
Scholarships
and tuition
fees waiver
are to be
given to
large
numbers of
students
H4 0.70 1.00 0.47 20.00
UG COMP
ENGG
Scholarships
and tuition
fees waiver
are to be
given to
large
numbers of
students
H4 0.80 1.00 0.40 423.00
UG E & TC
Scholarships
and tuition
fees waiver
are to be
given to
large
numbers of
students
H4 0.79 1.00 0.41 135.00
UG IT ENGG
Scholarships
and tuition
fees waiver
are to be
given to
large
numbers of
students
H4 0.91 1.00 0.30 11.00
UG MECH
ENGG
Scholarships
and tuition
fees waiver
are to be
given to
large
numbers of
students
H4 0.81 1.00 0.40 754.00

133
PG COMP SC
Student
fees should
be linked
to faculty
salaries
H5 0.72 1.00 0.46 25.00
PG CONSTR
ENGG
Student
fees should
be linked
to faculty
salaries
H5 0.77 1.00 0.43 47.00
PG DESIGN
ENGG
Student
fees should
be linked
to faculty
salaries
H5 0.73 1.00 0.45 37.00
PG M.
PHARMA
Student
fees should
be linked
to faculty
salaries
H5 0.67 1.00 0.49 12.00
PG MBA
Student
fees should
be linked
to faculty
salaries
H5 0.71 1.00 0.45 132.00
PG MCA
Student
fees should
be linked
to faculty
salaries
H5 0.81 1.00 0.40 21.00
PG
NETWORKING
ENGG
Student
fees should
be linked
to faculty
salaries
H5 0.77 1.00 0.43 31.00
PG
STRUCTURE
ENGG
Student
fees should
be linked
to faculty
salaries
H5 0.71 1.00 0.46 153.00
UG AUTO
ENGG.
Student
fees should
be linked
to faculty
salaries
H5 0.65 1.00 0.48 51.00
UG B.
PHARMA
Student
fees should
be linked
to faculty
salaries
H5 0.68 1.00 0.47 110.00
UG CAD CAM
Student
fees should
be linked
to faculty
H5 0.33 0.00 0.58 3.00

134
salaries
UG CIVIL
ENGG.
Student
fees should
be linked
to faculty
salaries
H5 0.67 1.00 0.47 171.00
UG COMMU
ENGG.
Student
fees should
be linked
to faculty
salaries
H5 0.50 0.50 0.51 20.00
UG COMP
ENGG
Student
fees should
be linked
to faculty
salaries
H5 0.69 1.00 0.46 423.00
UG E & TC
Student
fees should
be linked
to faculty
salaries
H5 0.71 1.00 0.45 135.00
UG IT ENGG
Student
fees should
be linked
to faculty
salaries
H5 0.82 1.00 0.40 11.00
UG MECH
ENGG
Student
fees should
be linked
to faculty
salaries
H5 0.68 1.00 0.47 754.00
PG COMP SC
Fees in
self-
financed
courses
are
generally
very
high.
H6 0.76 1.00 0.44 25.00
PG CONSTR
ENGG
Fees in
self-
financed
courses
are
generally
very
high.
H6 0.64 1.00 0.49 47.00
PG DESIGN
ENGG
Fees in
self-
financed
courses
H6 0.54 1.00 0.51 37.00

135
are
generally
very
high.
PG M.
PHARMA
Fees in
self-
financed
courses
are
generally
very
high.
H6 0.75 1.00 0.45 12.00
PG MBA
Fees in
self-
financed
courses
are
generally
very
high.
H6 0.62 1.00 0.49 132.00
PG MCA
Fees in
self-
financed
courses
are
generally
very
high.
H6 0.71 1.00 0.46 21.00
PG
NETWORKING
ENGG
Fees in
self-
financed
courses
are
generally
very
high.
H6 0.68 1.00 0.48 31.00
PG
STRUCTURE
ENGG
Fees in
self-
financed
courses
are
generally
very
high.
H6 0.65 1.00 0.48 153.00
UG AUTO
ENGG.
Fees in
self-
financed
courses
are
generally
very
high.
H6 0.65 1.00 0.48 51.00

136
UG B.
PHARMA
Fees in
self-
financed
courses
are
generally
very
high.
H6 0.63 1.00 0.49 110.00
UG CAD CAM
Fees in
self-
financed
courses
are
generally
very
high.
H6 0.67 1.00 0.58 3.00
UG CIVIL
ENGG.
Fees in
self-
financed
courses
are
generally
very
high.
H6 0.63 1.00 0.49 171.00
UG COMMU
ENGG.
Fees in
self-
financed
courses
are
generally
very
high.
H6 0.45 0.00 0.51 20.00
UG COMP
ENGG
Fees in
self-
financed
courses
are
generally
very
high.
H6 0.64 1.00 0.48 423.00
UG E & TC
Fees in
self-
financed
courses
are
generally
very
high.
H6 0.61 1.00 0.49 135.00
UG IT ENGG
Fees in
self-
financed
courses
are
generally
H6 0.64 1.00 0.50 11.00
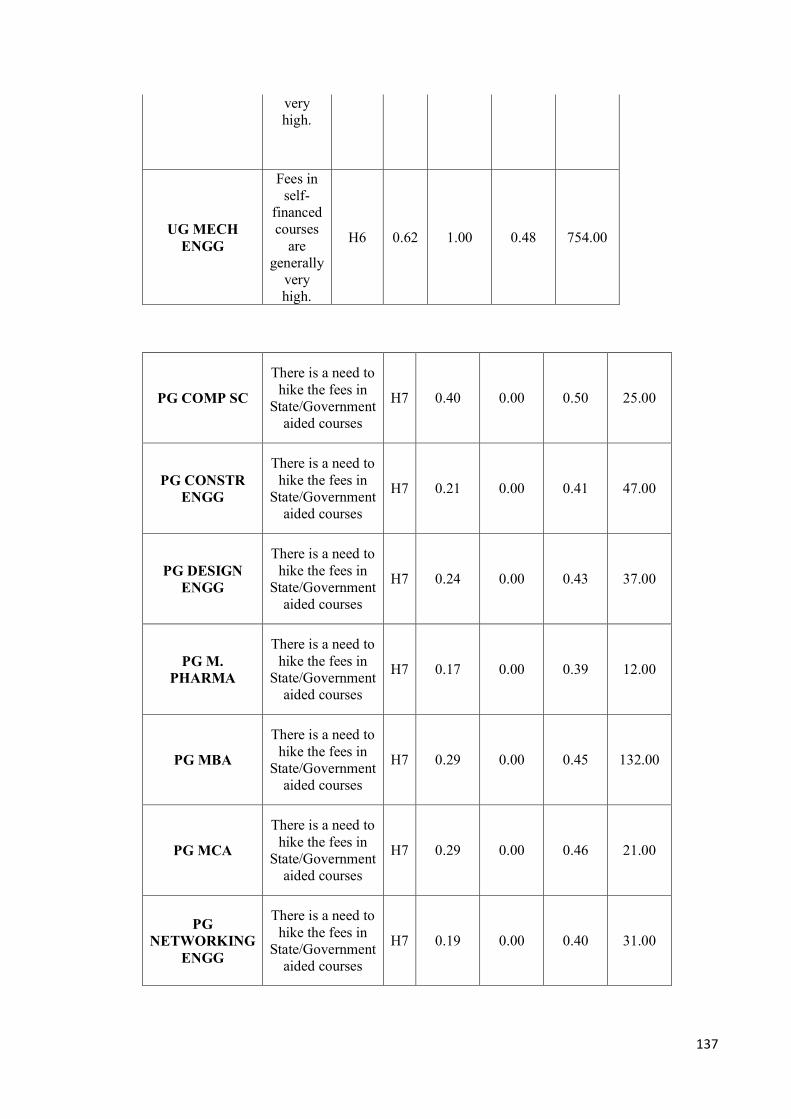
137
very
high.
UG MECH
ENGG
Fees in
self-
financed
courses
are
generally
very
high.
H6 0.62 1.00 0.48 754.00
PG COMP SC
There is a need to
hike the fees in
State/Government
aided courses
H7 0.40 0.00 0.50 25.00
PG CONSTR
ENGG
There is a need to
hike the fees in
State/Government
aided courses
H7 0.21 0.00 0.41 47.00
PG DESIGN
ENGG
There is a need to
hike the fees in
State/Government
aided courses
H7 0.24 0.00 0.43 37.00
PG M.
PHARMA
There is a need to
hike the fees in
State/Government
aided courses
H7 0.17 0.00 0.39 12.00
PG MBA
There is a need to
hike the fees in
State/Government
aided courses
H7 0.29 0.00 0.45 132.00
PG MCA
There is a need to
hike the fees in
State/Government
aided courses
H7 0.29 0.00 0.46 21.00
PG
NETWORKING
ENGG
There is a need to
hike the fees in
State/Government
aided courses
H7 0.19 0.00 0.40 31.00

138
PG
STRUCTURE
ENGG
There is a need to
hike the fees in
State/Government
aided courses
H7 0.25 0.00 0.43 153.00
UG AUTO
ENGG. There is a need to
hike the fees in
State/Government
aided courses
H7 0.25 0.00 0.44 51.00
UG B.
PHARMA
There is a need to
hike the fees in
State/Government
aided courses
H7 0.28 0.00 0.45 110.00
UG CAD CAM
There is a need to
hike the fees in
State/Government
aided courses
H7 0.00 0.00 0.00 3.00
UG CIVIL
ENGG.
There is a need to
hike the fees in
State/Government
aided courses
H7 0.30 0.00 0.46 171.00
UG COMMU
ENGG.
There is a need to
hike the fees in
State/Government
aided courses
H7 0.35 0.00 0.49 20.00
UG COMP
ENGG
There is a need to
hike the fees in
State/Government
aided courses
H7 0.27 0.00 0.44 423.00
UG E & TC
There is a need to
hike the fees in
State/Government
aided courses
H7 0.32 0.00 0.47 135.00
UG IT ENGG
There is a need to
hike the fees in
State/Government
aided courses
H7 0.36 0.00 0.50 11.00
UG MECH
ENGG
There is a need to
hike the fees in
State/Government
aided courses
H7 0.28 0.00 0.45 754.00

139
PG COMP SC
Student
loans
can
take
care of
needs
of poor
students
H8 0.40 0.00 0.50 25.00
PG CONSTR
ENGG
Student
loans
can
take
care of
needs
of poor
students
H8 0.64 1.00 0.49 47.00
PG DESIGN
ENGG
Student
loans
can
take
care of
needs
of poor
students
H8 0.70 1.00 0.46 37.00
PG M.
PHARMA
Student
loans
can
take
care of
needs
of poor
students
H8 0.75 1.00 0.45 12.00
PG MBA
Student
loans
can
take
care of
needs
of poor
students
H8 0.60 1.00 0.49 132.00
PG MCA
Student
loans
can
take
care of
needs
of poor
students
H8 0.48 0.00 0.51 21.00

140
PG
NETWORKING
ENGG
Student
loans
can
take
care of
needs
of poor
students
H8 0.65 1.00 0.49 31.00
PG
STRUCTURE
ENGG
Student
loans
can
take
care of
needs
of poor
students
H8 0.58 1.00 0.49 153.00
UG AUTO
ENGG.
Student
loans
can
take
care of
needs
of poor
students
H8 0.57 1.00 0.50 51.00
UG B.
PHARMA
Student
loans
can
take
care of
needs
of poor
students
H8 0.57 1.00 0.50 110.00
UG CAD CAM
Student
loans
can
take
care of
needs
of poor
students
H8 0.33 0.00 0.58 3.00
UG CIVIL
ENGG.
Student
loans
can
take
care of
needs
of poor
students
H8 0.58 1.00 0.49 171.00
UG COMMU
ENGG.
Student
loans
can
take
care of
needs
H8 0.55 1.00 0.51 20.00

141
of poor
students
UG COMP
ENGG
Student
loans
can
take
care of
needs
of poor
students
H8 0.57 1.00 0.50 423.00
UG E & TC
Student
loans
can
take
care of
needs
of poor
students
H8 0.58 1.00 0.50 135.00
UG IT ENGG
Student
loans
can
take
care of
needs
of poor
students
H8 0.64 1.00 0.50 11.00
UG MECH
ENGG
Student
loans
can
take
care of
needs
of poor
students
H8 0.57 1.00 0.50 754.00
PG COMP SC
Higher
educational
institutions
should
augment
resources
by
research,
consultancy
etc.
H9 0.72 1.00 0.46 25.00

142
PG CONSTR
ENGG
Higher
educational
institutions
should
augment
resources
by
research,
consultancy
etc.
H9 0.72 1.00 0.45 47.00
PG DESIGN
ENGG
Higher
educational
institutions
should
augment
resources
by
research,
consultancy
etc.
H9 0.70 1.00 0.46 37.00
PG M.
PHARMA
Higher
educational
institutions
should
augment
resources
by
research,
consultancy
etc.
H9 0.83 1.00 0.39 12.00
PG MBA
Higher
educational
institutions
should
augment
resources
by
research,
consultancy
etc.
H9 0.73 1.00 0.44 132.00
PG MCA
Higher
educational
institutions
should
augment
resources
by
research,
consultancy
etc.
H9 0.76 1.00 0.44 21.00
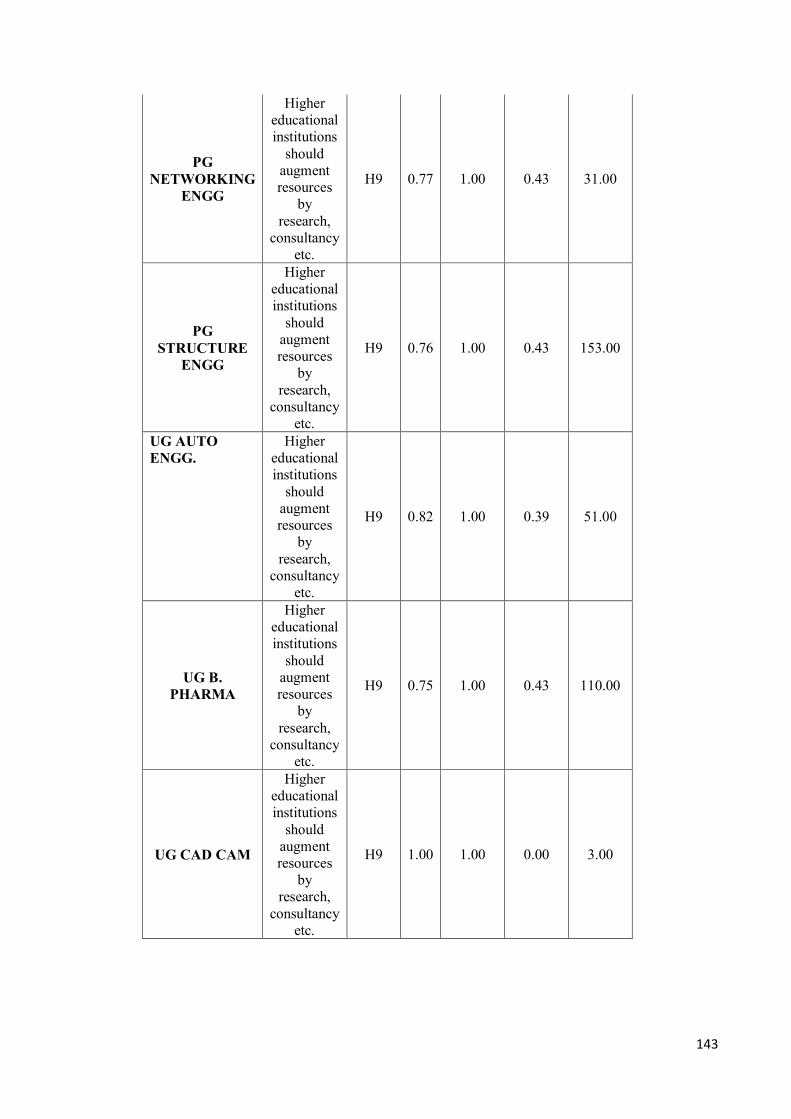
143
PG
NETWORKING
ENGG
Higher
educational
institutions
should
augment
resources
by
research,
consultancy
etc.
H9 0.77 1.00 0.43 31.00
PG
STRUCTURE
ENGG
Higher
educational
institutions
should
augment
resources
by
research,
consultancy
etc.
H9 0.76 1.00 0.43 153.00
UG AUTO
ENGG.
Higher
educational
institutions
should
augment
resources
by
research,
consultancy
etc.
H9 0.82 1.00 0.39 51.00
UG B.
PHARMA
Higher
educational
institutions
should
augment
resources
by
research,
consultancy
etc.
H9 0.75 1.00 0.43 110.00
UG CAD CAM
Higher
educational
institutions
should
augment
resources
by
research,
consultancy
etc.
H9 1.00 1.00 0.00 3.00
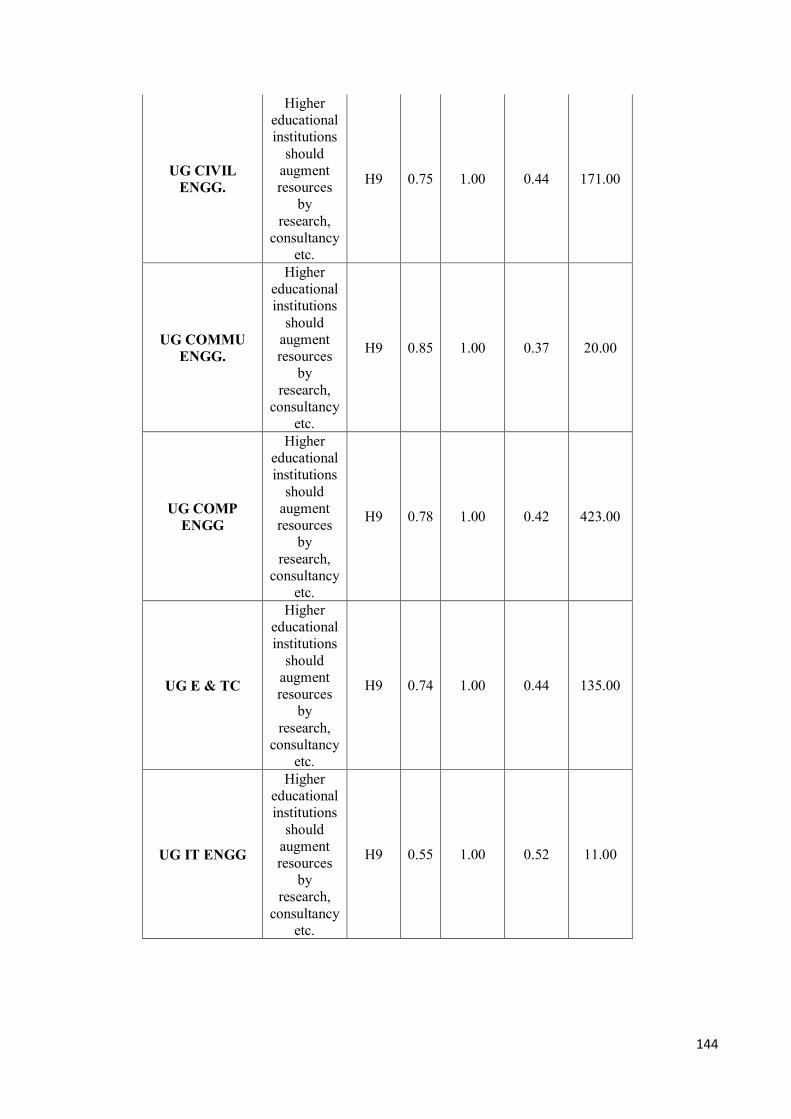
144
UG CIVIL
ENGG.
Higher
educational
institutions
should
augment
resources
by
research,
consultancy
etc.
H9 0.75 1.00 0.44 171.00
UG COMMU
ENGG.
Higher
educational
institutions
should
augment
resources
by
research,
consultancy
etc.
H9 0.85 1.00 0.37 20.00
UG COMP
ENGG
Higher
educational
institutions
should
augment
resources
by
research,
consultancy
etc.
H9 0.78 1.00 0.42 423.00
UG E & TC
Higher
educational
institutions
should
augment
resources
by
research,
consultancy
etc.
H9 0.74 1.00 0.44 135.00
UG IT ENGG
Higher
educational
institutions
should
augment
resources
by
research,
consultancy
etc.
H9 0.55 1.00 0.52 11.00

145
UG MECH
ENGG
Higher
educational
institutions
should
augment
resources
by
research,
consultancy
etc.
H9 0.76 1.00 0.43 754.00
PG COMP SC
Government
lacks the
resources to
enhance
spending on
higher
Education
H10 0.44 0.00 0.51 25.00
PG CONSTR
ENGG
Government
lacks the
resources to
enhance
spending on
higher
Education
H10 0.32 0.00 0.47 47.00
PG DESIGN
ENGG
Government
lacks the
resources to
enhance
spending on
higher
Education
H10 0.30 0.00 0.46 37.00
PG M.
PHARMA
Government
lacks the
resources to
enhance
spending on
higher
Education
H10 0.42 0.00 0.51 12.00
PG MBA
Government
lacks the
resources to
enhance
spending on
higher
Education
H10 0.34 0.00 0.48 132.00

146
PG MCA
Government
lacks the
resources to
enhance
spending on
higher
Education
H10 0.43 0.00 0.51 21.00
PG
NETWORKING
ENGG
Government
lacks the
resources to
enhance
spending on
higher
Education
H10 0.26 0.00 0.44 31.00
PG
STRUCTURE
ENGG
Government
lacks the
resources to
enhance
spending on
higher
Education
H10 0.35 0.00 0.48 153.00
UG AUTO
ENGG.
Government
lacks the
resources to
enhance
spending on
higher
Education
H10 0.39 0.00 0.49 51.00
UG B.
PHARMA
Government
lacks the
resources to
enhance
spending on
higher
Education
H10 0.36 0.00 0.48 110.00
UG CAD CAM
Government
lacks the
resources to
enhance
spending on
higher
Education
H10 0.00 0.00 0.00 3.00
UG CIVIL
ENGG.
Government
lacks the
resources to
enhance
spending on
higher
Education
H10 0.35 0.00 0.48 171.00

147
UG COMMU
ENGG.
Government
lacks the
resources to
enhance
spending on
higher
Education
H10 0.40 0.00 0.50 20.00
UG COMP
ENGG
Government
lacks the
resources to
enhance
spending on
higher
Education
H10 0.37 0.00 0.48 423.00
UG E & TC
Government
lacks the
resources to
enhance
spending on
higher
Education
H10 0.36 0.00 0.48 135.00
UG IT ENGG
Government
lacks the
resources to
enhance
spending on
higher
Education
H10 0.36 0.00 0.50 11.00
UG MECH
ENGG
Government
lacks the
resources to
enhance
spending on
higher
Education
H10 0.36 0.00 0.48 754.00
4.1 Focus
This chapter focuses on the data analysis and findings in the context of this research
work. The researcher has divided this chapter in three sections, namely, Descriptive
Statistics, Demographic Details, and Hypotheses-specific Analysis. The details are given
below.
TABLE B1- DESCRIPTIVE STATISTICS FOR COLLEGE PERFORMANCE
INDICATORS.
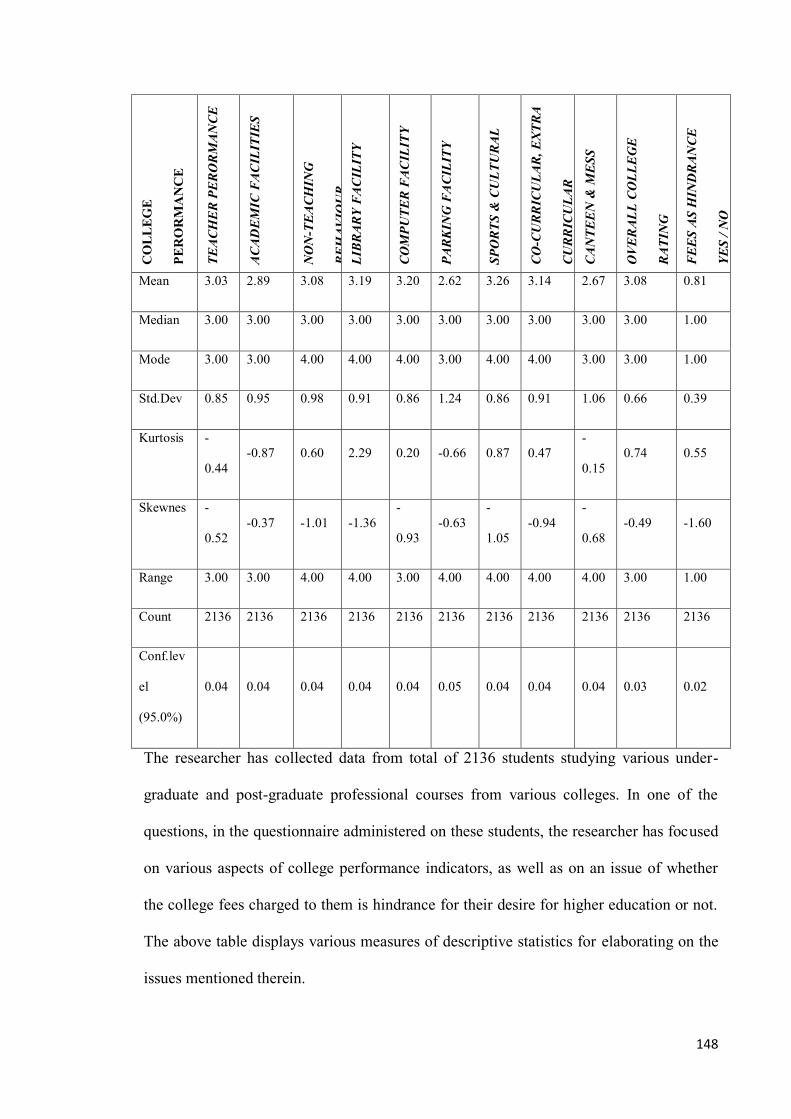
148
CO
LL
EG
E
PE
RO
RM
AN
CE
PA
RA
ME
TE
RS
T
EA
CH
ER
PE
RO
RM
AN
CE
AC
AD
EM
IC F
AC
ILIT
IES
NO
N-T
EA
CH
ING
BE
HA
VIO
UR
LIB
RA
RY
FA
CIL
ITY
CO
MP
UT
ER
FA
CIL
ITY
PA
RK
ING
FA
CIL
ITY
SP
OR
TS
& C
UL
TU
RA
L
CO
-CU
RR
ICU
LA
R,
EX
TR
A
CU
RR
ICU
LA
R
CA
NT
EE
N &
ME
SS
OV
ER
AL
L C
OL
LE
GE
RA
TIN
G
FE
ES
AS
HIN
DR
AN
CE
YE
S /
NO
Mean 3.03 2.89 3.08 3.19 3.20 2.62 3.26 3.14 2.67 3.08 0.81
Median 3.00 3.00 3.00 3.00 3.00 3.00 3.00 3.00 3.00 3.00 1.00
Mode 3.00 3.00 4.00 4.00 4.00 3.00 4.00 4.00 3.00 3.00 1.00
Std.Dev 0.85 0.95 0.98 0.91 0.86 1.24 0.86 0.91 1.06 0.66 0.39
Kurtosis -
0.44
-0.87 0.60 2.29 0.20 -0.66 0.87 0.47
-
0.15
0.74 0.55
Skewnes -
0.52
-0.37 -1.01 -1.36
-
0.93
-0.63
-
1.05
-0.94
-
0.68
-0.49 -1.60
Range 3.00 3.00 4.00 4.00 3.00 4.00 4.00 4.00 4.00 3.00 1.00
Count 2136 2136 2136 2136 2136 2136 2136 2136 2136 2136 2136
Conf.lev
el
(95.0%)
0.04 0.04 0.04 0.04 0.04 0.05 0.04 0.04 0.04 0.03 0.02
The researcher has collected data from total of 2136 students studying various under-
graduate and post-graduate professional courses from various colleges. In one of the
questions, in the questionnaire administered on these students, the researcher has focused
on various aspects of college performance indicators, as well as on an issue of whether
the college fees charged to them is hindrance for their desire for higher education or not.
The above table displays various measures of descriptive statistics for elaborating on the
issues mentioned therein.

149
In so far as the teachers’ performance is concerned, the mean, mode and median are close
to 3 on five point Likertscale (0-4) and the standard deviation is mere 0.85. This shows
that the data is having central tendency around 3 as a score, which shows satisfactory
performance of the teachers of the college. However, the data is not normal, as it is
negatively skewed and leptokurtic.
In so far as the academic facilities are concerned, the mean is 2.89, mode and median are
close to 3 on five point Likertscale (0-4) and the standard deviation is mere 0.95. This
shows that the data is having central tendency around 3 as a score, which shows
satisfactory academic facilities provided by the college. However, the data is not normal,
as it is negatively skewed and leptokurtic.
In so far as the behavior of non-teaching staff is concerned, the mean and median are
close to 3 (but the mode is 4) on five pointLikert scale (0-4) and the standard deviation is
mere 0.98. This shows that the data is having central tendency around 3 as a score, which
shows satisfactory behavior of non-teaching staff, may be a little better than the teaching
staff as the mode is 4. However, the data is not normal, as it is negatively skewed and
platykurtic.
In so far as the library facility is concerned, the mean and median are close to 3 (but the
mode is 4) on five pointLiker scale (0-4) and the standard deviation is mere 0.91. This
shows that the data is having central tendency around 3 as a score, which shows
satisfactory library facility of the college. However, the data is not normal, as it is
negatively skewed and platykurtic.
In so far as the computing facility is concerned, the mean and median are close to 3 (but
the mode is 4) on five pointLikert scale (0-4) and the standard deviation is mere 0.86.
This shows that the data is having central tendency around 3 as a score, which shows

150
satisfactory computing facility of the college. However, the data is not normal, as it is
negatively skewed and platykurtic.
In so far as the parking facility is concerned, the mean is 2.62 and mode and median are
close to 3 on five point Likert scale (0-4) and the standard deviation is 1.24. This shows
that the data is dispersed, which shows unsatisfactory parking facility of the college.
However, the data is not normal, as it is negatively skewed and leptokurtic.
In so far as the sports and cultural activities are concerned, the mean and median are
close to 3 (but the mode is 4) on five points Liker scale (0-4) and the standard deviation is
mere 0.86. This shows that the data is having central tendency around 3 as a score, which
shows satisfactory sports and cultural activities of the college. However, the data is not
normal, as it is negatively skewed and platykurtic.
In so far as co-curricular and extra-curricular activities are concerned, the mean and
median are close to 3 (but the mode is 4) on five pointLiker scale (0-4) and the standard
deviation is mere 0.91. This shows that the data is having central tendency around 3 as a
score, which shows satisfactory co-curricular and extra-curricular activities of the
college. However, the data is not normal, as it is negatively skewed and platykurtic.
In so far as the canteen and mess is concerned, the mean is 2.62 and mode and median are
close to 3 on five point Liker scale (0-4) and the standard deviation is 1.04. This shows
that the data is dispersed, which shows unsatisfactory performance of the canteen and
mess of the college. However, the data is not normal, as it is negatively skewed and
leptokurtic.
In so far as the overall college performance is concerned, the mean, mode and median are
close to 3 on five point Liker scale (0-4) and the standard deviation is mere 0.66. This
shows that the data is having central tendency around 3 as a score, which shows
151
satisfactory performance of the college. However, the data is not normal, as it is
negatively skewed and platykurtic.
On the issue of whether the college fees is a hindrance for the students’ desire for higher
education, the mean, mode and median are close to 1, where 0 is “no” and 1 is “Yes” and
the standard deviation is mere 0.39. This shows that the data is having central tendency
around 1 as a score, which shows that the students feel college fees as hindrance for their
desire for higher education. However, the data is not normal, as it is negatively skewed
and platykurtic.
4.2 Demographic Details
The demographic details have been elaborated in this section. The demographic details
have been classified on the basis of (a) Course (further classified as Engineering – UG &
PG, Pharmacy – UG & PG, Other Technical Courses – UG & PG and MBA & MCA –
only PG), (b) Hostel facilities (further classified as staying at Home or College Hostel or
Private Hostel). The details are given below:

152
TABLE C (a) 1 - DEMOGRAPHIC - COURSE- AUTO. ENGINEERING
CO
LL
EG
E
PE
RF
OR
MA
NC
E
PA
RA
ME
TE
R
TE
AC
HE
R P
ER
FO
RM
AN
CE
AC
AD
EM
IC F
AC
ILIT
IES
NO
N-T
EA
CH
ING
BE
HA
VIO
UR
LIB
RA
RY
FA
CIL
ITIE
S
CO
MP
UT
ER
FA
CIL
ITIE
S
PA
RK
ING
FA
CIL
ITIE
S
SP
OR
TS &
CU
LT
UR
AL
CO
-CU
RR
ICU
LA
R,
EX
TR
A
CU
RR
ICU
LA
R
CA
NT
EE
N &
ME
SS
OV
ER
AL
L C
OL
LE
GE
RA
TIN
G
FE
ES A
S H
IND
RA
NC
E Y
ES /
NO
Mean 2.76 2.63 2.90 2.96 3.06 2.22 2.98 2.92 2.73 2.98 0.80
Median 3.00 3.00 3.00 3.00 3.00 3.00 3.00 3.00 3.00 3.00 1.00
Mode 3.00 3.00 3.00 3.00 3.00 3.00 3.00 4.00 3.00 3.00 1.00
Standard
Deviation
0.91 1.02 1.10 1.06 0.99 1.43 0.97 1.07 1.17 0.73 0.40
Kurtosis
-0.79 -1.07 0.44 1.71 -0.12 -1.35 0.39 -0.24
-
0.48
0.69 0.51
Skewness
-0.17 -0.12 -1.02 -1.29 -0.90 -0.23 -0.78 -0.75
-
0.69
-0.60 -1.58
Range 3.00 3.00 4.00 4.00 3.00 4.00 4.00 4.00 4.00 3.00 1.00
Count
51.00 51.00 51.00 51.00 51.00 51.00
51.0
0
51.00
51.0
0
51.00 51.00
Confidenc
e Level
(95.0%)
0.26 0.29 0.31 0.30 0.28 0.40 0.27 0.30 0.33 0.21 0.11
The researcher has collected data from 51 students under this category. In all cases, the
mean is less than median and mode (except for computing facility) showing that the data
is dispersed meaning little below average satisfaction of the students on various issues.
The data is not normal, it is negatively skewed and leptokurtic.

153
TABLE C (a) 2 - DEMOGRAPHIC - COURSE - CIVIL ENG
CO
LL
EG
E
PE
RF
OR
MA
NC
E
PA
RA
ME
TE
R
TE
AC
HE
R P
ER
FO
RM
AN
CE
AC
AD
EM
IC F
AC
ILIT
IES
NO
N-T
EA
CH
ING
BE
HA
VIO
UR
LIB
RA
RY
FA
CIL
ITIE
S
CO
MP
UT
ER
FA
CIL
ITIE
S
PA
RK
ING
FA
CIL
ITIE
S
SP
OR
TS &
CU
LT
UR
AL
CO
-CU
RR
ICU
LA
R,
EX
TR
A
CU
RR
ICU
LA
R
CA
NT
EE
N &
ME
SS
OV
ER
AL
L C
OL
LE
GE
RA
TIN
G
FE
ES A
S H
IND
RA
NC
E Y
ES /
NO
Mean 3.06 2.91 3.13 3.19 3.25 2.63 3.30 3.16 2.64 3.11 0.82
Median 3.00 3.00 3.00 3.00 3.00 3.00 3.00 3.00 3.00 3.00 1.00
Mode 3.00 3.00 4.00 4.00 4.00 3.00 4.00 4.00 3.00 3.00 1.00
Std,
Deviation
0.82 0.94 0.92 0.91 0.80 1.25 0.81 0.86 1.06 0.62 0.38
Kurtosis -0.41 -0.84 0.58 2.37 0.28 -0.55 0.73 0.31 -0.05 0.83 0.98
Skewness -0.51 -0.39 -0.96 -1.36
-
0.89
-0.68 -1.00 -0.82 -0.70 -0.38 -1.72
Range 3.00 3.00 4.00 4.00 3.00 4.00 4.00 4.00 4.00 3.00 1.00
Count 171.00 171.0 171.0 171.0
171.
0
171.0 171.0 171.00 171. 171. 171.
Confidenc
e Level
(95.0%)
0.12 0.14 0.14 0.14 0.12 0.19 0.12 0.13 0.16 0.09 0.06
The researcher has collected data from 171 students under this category. In all cases, the
mean and median are close to 3 (but mode is close to 4 sometimes) showing that the data
is having central tendency meaning little above average satisfaction of the students on
various issues. The data is not normal, it is negatively skewed and leptokurtic.
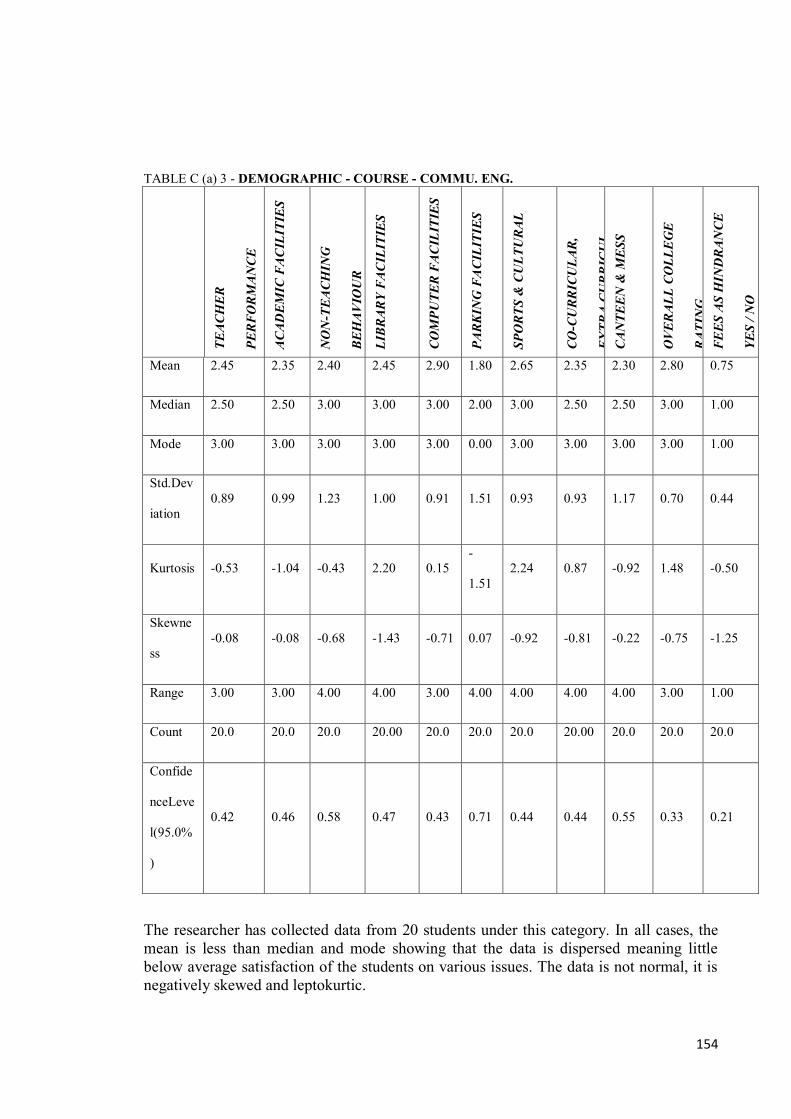
154
TABLE C (a) 3 - DEMOGRAPHIC - COURSE - COMMU. ENG.
TE
AC
HE
R
PE
RF
OR
MA
NC
E
AC
AD
EM
IC F
AC
ILIT
IES
NO
N-T
EA
CH
ING
BE
HA
VIO
UR
LIB
RA
RY
FA
CIL
ITIE
S
CO
MP
UT
ER
FA
CIL
ITIE
S
PA
RK
ING
FA
CIL
ITIE
S
SP
OR
TS
& C
UL
TU
RA
L
CO
-CU
RR
ICU
LA
R,
EX
TR
A C
UR
RIC
UL
CA
NT
EE
N &
ME
SS
OV
ER
AL
L C
OL
LE
GE
RA
TIN
G
FE
ES
AS
HIN
DR
AN
CE
YE
S /
NO
Mean 2.45 2.35 2.40 2.45 2.90 1.80 2.65 2.35 2.30 2.80 0.75
Median 2.50 2.50 3.00 3.00 3.00 2.00 3.00 2.50 2.50 3.00 1.00
Mode 3.00 3.00 3.00 3.00 3.00 0.00 3.00 3.00 3.00 3.00 1.00
Std.Dev
iation
0.89 0.99 1.23 1.00 0.91 1.51 0.93 0.93 1.17 0.70 0.44
Kurtosis -0.53 -1.04 -0.43 2.20 0.15
-
1.51
2.24 0.87 -0.92 1.48 -0.50
Skewne
ss
-0.08 -0.08 -0.68 -1.43 -0.71 0.07 -0.92 -0.81 -0.22 -0.75 -1.25
Range 3.00 3.00 4.00 4.00 3.00 4.00 4.00 4.00 4.00 3.00 1.00
Count 20.0 20.0 20.0 20.00 20.0 20.0 20.0 20.00 20.0 20.0 20.0
Confide
nceLeve
l(95.0%
)
0.42 0.46 0.58 0.47 0.43 0.71 0.44 0.44 0.55 0.33 0.21
The researcher has collected data from 20 students under this category. In all cases, the
mean is less than median and mode showing that the data is dispersed meaning little
below average satisfaction of the students on various issues. The data is not normal, it is
negatively skewed and leptokurtic.

155
TABLE C (a) 4 - DEMOGRAPHIC - COURSE - COMP. ENG.
TE
AC
HE
R P
ER
FO
RM
AN
CE
AC
AD
EM
IC F
AC
ILIT
IES
NO
N-T
EA
CH
ING
BE
HA
VIO
UR
LIB
RA
RY
FA
CIL
ITIE
S
CO
MP
UT
ER
FA
CIL
ITIE
S
PA
RK
ING
FA
CIL
ITIE
S
SP
OR
TS &
CU
LT
UR
AL
CO
-CU
RR
ICU
LA
R, E
XT
RA
CU
RR
CA
NT
EE
N &
ME
SS
OV
ER
AL
L C
OL
LE
GE
RA
TIN
G
FE
ES A
S H
IND
RA
NC
E Y
ES /
NO
Mean 3.03 2.91 3.09 3.20 3.20 2.62 3.24 3.15 2.69 3.08 0.82
Median 3.00 3.00 3.00 3.00 3.00 3.00 3.00 3.00 3.00 3.00 1.00
Mode 3.00 3.00 4.00 4.00 4.00 3.00 4.00 4.00 3.00 3.00 1.00
Standard
Deviation
0.85 0.95 0.99 0.88 0.87 1.24 0.88 0.93 1.06 0.68 0.38
Kurtosis -0.39 -0.83 0.53 2.31 0.30 -0.67 0.77 0.52 -0.23 0.62 0.81
Skewness -0.54 -0.41 -1.02 -1.32 -0.98 -0.62 -1.04 -1.01 -0.66 -0.51 -1.67
Range 3.00 3.00 4.00 4.00 3.00 4.00 4.00 4.00 4.00 3.00 1.00
Count 423.0 423.0 423.0 423.0 423.0 423.0 423.0 423.0 423.0 423.0 423.0
Confiden
Level
(95.0%)
0.08 0.09 0.09 0.08 0.08 0.12 0.08 0.09 0.10 0.06 0.04
The researcher has collected data from 423 students under this category. In many cases,
the mean is less than median and mode showing that the data is dispersed meaning little

156
below average satisfaction of the students on various issues. The data is not normal, it is
negatively skewed and leptokurtic.
TABLE C (a) 5 - DEMOGRAPHIC -COURSE - E & TC T
EA
CH
ER
PE
RF
OR
MA
NC
E
AC
AD
EM
IC
FA
CIL
ITIE
S
NO
N-
TE
AC
HIN
G
BE
HA
VIO
UR
L
IBR
AR
Y
FA
CIL
ITIE
S
CO
MP
UT
ER
FA
CIL
ITIE
S
PA
RK
ING
FA
CIL
ITIE
S
SP
OR
TS
&
CU
LT
UR
AL
CO
-
CU
RR
ICU
LA
R,
EX
TR
A
CU
RR
ICU
LA
R
CA
NT
EE
N
&
ME
SS
O
VE
RA
LL
CO
LL
EG
E
RA
TIN
G
FE
ES
A
S
HIN
DR
AN
CE
YE
S /
NO
Mean 3.07 2.95 3.16 3.18 3.25 2.76 3.37 3.17 2.59 3.10 0.79
Median 3.00 3.00 3.00 3.00 3.00 3.00 4.00 3.00 3.00 3.00 1.00
Mode 3.00 4.00 4.00 3.00 4.00 4.00 4.00 3.00 3.00 3.00 1.00
Standard
Deviation
0.79 0.94 0.93 0.86 0.82 1.17 0.76 0.82 1.05 0.61 0.41
Kurtosis -0.26 -0.92 1.02 2.42 0.25 -0.33 2.11 0.99 0.09 1.32 -0.03
Skewness -0.50 -0.39 -1.12 -1.27 -0.91 -0.74 -1.26 -0.91 -0.73 -0.45 -1.40
Range 3.00 3.00 4.00 4.00 3.00 4.00 4.00 4.00 4.00 3.00 1.00
Count 135.00 135.00
135.0
0
135.
00
135.
00
135.
00
135.
00
135.
00
135.
00
135.
00
135.0
0
Confidence
Leve
l(95.0%)
0.13 0.16 0.16 0.15 0.14 0.20 0.13 0.14 0.18 0.10 0.07
The researcher has collected data from 135 students under this category. In many cases,
the mean and median are close to 3, but the mode is close to 4 showing that the data is
having central tendency meaning little above average satisfaction of the students on
various issues. The data is not normal, it is negatively skewed and leptokurtic.

157
TABLE C (a) 6 - DEMOGRAPHIC - COURSE - IT ENG.
TE
AC
HE
R
PE
RF
OR
MA
NC
E
AC
AD
EM
IC F
AC
ILIT
IES
NO
N-T
EA
CH
ING
BE
HA
VIO
UR
LIB
RA
RY
FA
CIL
ITIE
S
CO
MP
UT
ER
FA
CIL
ITIE
S
PA
RK
ING
FA
CIL
ITIE
S
SP
OR
TS
& C
UL
TU
RA
L
CO
-CU
RR
ICU
LA
R,
EX
TR
A C
UR
RIC
UL
AR
CA
NT
EE
N &
ME
SS
OV
ER
AL
L
CO
LL
EG
E
RA
TIN
G
FE
ES
A
S
HIN
DR
AN
CE
YE
S /
NO
Mean 3.36 3.00 3.00 3.45 3.36 2.82 3.55 3.45 2.91 3.27 0.82
Median 3.00 3.00 3.00 4.00 4.00 3.00 4.00 4.00 3.00 3.00 1.00
Mode 3.00 3.00 3.00 4.00 4.00 3.00 4.00 4.00 3.00 3.00 1.00
Standard
Deviation
0.67 0.89 0.63 0.69 0.81 0.98 0.69 0.69 0.94 0.47 0.40
Kurtosis -0.29 1.56 0.42 0.08 -0.76 -0.59 0.98 0.08 0.20
-
0.76
2.04
Skewness -0.59 -1.02 0.00 -0.93 -0.85 -0.35 -1.32 -0.93 -0.66 1.19 -1.92
Range 2.00 3.00 2.00 2.00 2.00 3.00 2.00 2.00 3.00 1.00 1.00
Count
11.0
0
11.00 11.00 11.00 11.00 11.00 11.00 11.00 11.00
11.0
0
11.00
Confidenc
e Level
(95.0%)
0.45 0.60 0.42 0.46 0.54 0.66 0.46 0.46 0.63 0.31 0.27

158
The researcher has collected data from 11 students under this category. In all cases, the
mean and median are close to 3, but the mode is close to 4, showing that the data is
having central tendency meaning little above average satisfaction of the students on
various issues. The data is not normal, it is negatively skewed and leptokurtic.
TABLE C (a) 7 - DEMOGRAPHIC - COURSE - MECH. ENG.
TE
AC
HE
R
PE
RF
OR
MA
NC
E
AC
AD
EM
IC
FA
CIL
ITIE
S
NO
N-T
EA
CH
ING
BE
HA
VIO
UR
L
IBR
AR
Y
FA
CIL
ITIE
S
CO
MP
UT
ER
FA
CIL
ITIE
S
PA
RK
ING
FA
CIL
ITIE
S
SP
OR
TS
&
CU
LT
UR
AL
CO
-
CU
RR
ICU
LA
R,
EX
TR
A
CU
RR
ICU
LA
R
CA
NT
EE
N
&
ME
SS
O
VE
RA
LL
CO
LL
EG
E
RA
TIN
G
FE
ES
A
S
HIN
DR
AN
CE
YE
S
/ N
O
Mean 2.96 2.82 3.01 3.12 3.16 2.54 3.21 3.09 2.64 3.05 0.81
Median 3.00 3.00 3.00 3.00 3.00 3.00 3.00 3.00 3.00 3.00 1.00
Mode 3.00 3.00 3.00 3.00 4.00 3.00 4.00 4.00 3.00 3.00 1.00
Standard
Deviation
0.87 0.96 1.01 0.95 0.88 1.27 0.88 0.93 1.07 0.66 0.40
Kurtosis -0.57 -0.94 0.48 2.08 0.11 -0.77 0.86 0.40 -0.25 0.80 0.38
Skewness -0.44 -0.28 -0.96 -1.33 -0.90 -0.56 -1.02 -0.90 -0.65 -0.52 -1.54
Range 3.00 3.00 4.00 4.00 3.00 4.00 4.00 4.00 4.00 3.00 1.00
Count
754.
00
754.
00
754.
00
754.
00
754.
00
754.
00
754.
00
754.
00
754.
00
754.
00
754.
00
Confidence
Level(95.0%)
0.06 0.07 0.07 0.07 0.06 0.09 0.06 0.07 0.08 0.05 0.03
The researcher has collected data from 754 students under this category. In many cases,
the mean is less than median and mode showing that the data is dispersed meaning little
below average satisfaction of the students on various issues. The data is not normal, it is
negatively skewed and leptokurtic.

159
TABLE C (a) 8 - DEMOGRAPHIC - COURSE - DESIGN ENGG. PG
TE
AC
HE
R
PE
RF
OR
MA
NC
E
AC
AD
EM
IC
FA
CIL
ITIE
S
NO
N-
TE
AC
HIN
G
BE
HA
VIO
UR
L
IBR
AR
Y
FA
CIL
ITIE
S
CO
MP
UT
ER
FA
CIL
ITIE
S
PA
RK
ING
FA
CIL
ITIE
S
SP
OR
TS
&
CU
LT
UR
AL
CO
-
CU
RR
ICU
LA
R,
EX
TR
A
CU
RR
ICU
LA
R
CA
NT
EE
N
&
ME
SS
O
VE
RA
LL
CO
LL
EG
E
RA
TIN
G
FE
ES
A
S
HIN
DR
AN
CE
YE
S /
NO
Mean 3.41 3.38 3.76 3.51 3.41 3.16 3.59 3.27 2.70 3.24 0.84
Median 3.00 3.00 4.00 4.00 4.00 3.00 4.00 3.00 3.00 3.00 1.00
Mode 3.00 3.00 4.00 4.00 4.00 4.00 4.00 4.00 3.00 3.00 1.00
Standard
Deviation
0.60 0.64 0.43 0.65 0.72 0.96 0.55 0.73 1.05 0.49 0.37
Kurtosis -0.61 -0.57 -0.47 -0.01 -0.61 -0.03 -0.16 -0.96 0.87 -0.11 1.75
Skewness -0.43 -0.53 -1.25 -1.01 -0.81 -0.94 -0.92 -0.48 -1.03 0.49 -1.91
Range 2.00 2.00 1.00 2.00 2.00 3.00 2.00 2.00 4.00 2.00 1.00
Count
37.0
0
37.0
0
37.0
0
37.0
0
37.0
0
37.0
0
37.0
0
37.0
0
37.0
0
37.0
0
37.0
0
Confidence
Level(95.0%)
0.20 0.21 0.15 0.22 0.24 0.32 0.18 0.24 0.35 0.16 0.12
The researcher has collected data from 51 students under this category. In all cases, the
mean is more than median and mode showing that the data is having central tendency
meaning little above average satisfaction of the students on various issues. The data is not
normal, it is negatively skewed and leptokurtic.

160
TABLE C (a) 9 - DEMOGRAPHIC - COURSE - CONSTR. PG
TE
AC
HE
R
PE
RF
OR
MA
N
CE
A
CA
DE
MIC
FA
CIL
ITIE
S
NO
N-
TE
AC
HIN
G
BE
HA
VIO
UR
L
IBR
AR
Y
FA
CIL
ITIE
S
CO
MP
UT
ER
FA
CIL
ITIE
S
PA
RK
ING
FA
CIL
ITIE
S
SP
OR
TS
&
CU
LT
UR
AL
CO
-
CU
RR
ICU
LA
R,
EX
TR
A
CU
RR
ICU
LA
R
CA
NT
EE
N
&
ME
SS
OV
ER
AL
L
CO
LL
EG
E
RA
TIN
G
FE
ES
AS
HIN
DR
AN
CE
YE
S /
NO
Mean 3.34 3.19 3.38 3.60 3.32 3.13 3.45 3.38 2.79 3.26 0.83
Median 3.00 3.00 4.00 4.00 3.00 3.00 4.00 4.00 3.00 3.00 1.00
Mode 3.00 4.00 4.00 4.00 4.00 4.00 4.00 4.00 3.00 3.00 1.00
Standard
Deviation
0.70 0.80 0.82 0.61 0.78 0.92 0.75 0.82 0.91 0.61 0.38
Kurtosis 1.32 -0.31 0.15 0.62 0.23 0.24 -0.51 0.15 0.97 -0.47 1.34
Skewness -0.98 -0.63 -1.08 -1.27 -0.92 -0.95 -0.96 -1.08 -0.83 -0.18 -1.81
Range 3.00 3.00 3.00 2.00 3.00 3.00 2.00 3.00 4.00 2.00 1.00
Count
47.0
0
47.0
0
47.0
0
47.0
0
47.0
0
47.0
0
47.0
0
47.0
0
47.0
0
47.0
0
47.0
0
Confidence
Level(95.0%)
0.21 0.23 0.24 0.18 0.23 0.27 0.22 0.24 0.27 0.18 0.11
The researcher has collected data from 47 students under this category. In all cases, the
mean and median are close to 3 but the mode is close to 4, showing that the data is having
central tendency meaning little above average satisfaction of the students on various
issues. The data is not normal, it is negatively skewed and leptokurtic.

161
TABLE C (a) 10 - DEMOGRAPHIC - COURSE - COMP. SC. PG
TE
AC
HE
R
PE
RF
OR
MA
N
CE
A
CA
DE
MIC
FA
CIL
ITIE
S
NO
N-
TE
AC
HIN
G
BE
HA
VIO
UR
L
IBR
AR
Y
FA
CIL
ITIE
S
CO
MP
UT
ER
FA
CIL
ITIE
S
PA
RK
ING
FA
CIL
ITIE
S
SP
OR
TS
&
CU
LT
UR
AL
CO
-
CU
RR
ICU
LA
R,
EX
TR
A
CU
RR
ICU
LA
CA
NT
EE
N
&
ME
SS
OV
ER
AL
L
CO
LL
EG
E
RA
TI
FE
ES
AS
HIN
DR
AN
CE
YE
S /
NO
Mean 3.04 2.88 3.16 3.04 3.40 2.60 3.44 3.28 2.60 3.12 0.76
Median 3.00 3.00 3.00 3.00 3.00 3.00 4.00 3.00 3.00 3.00 1.00
Mode 3.00 2.00 3.00 3.00 4.00 3.00 4.00 3.00 3.00 3.00 1.00
Standard
Deviation
0.79 0.93 0.75 0.68 0.65 1.12 0.65 0.61 1.08 0.53 0.44
Kurtosis -1.35 -1.21 -1.08 -0.61 -0.48 -0.35 -0.35 -0.44 -0.05 0.88 -0.35
Skewness -0.07 -0.09 -0.27 -0.05 -0.61 -0.47 -0.75 -0.22 -0.60 0.18 -1.30
Range 2.00 3.00 2.00 2.00 2.00 4.00 2.00 2.00 4.00 2.00 1.00
Count
25.0
0
25.0
0
25.0
0
25.0
0
25.0
0
25.0
0
25.0
0
25.0
0
25.0
0
25.0
0
25.0
0
Confidence
Level(95.0%)
0.33 0.38 0.31 0.28 0.27 0.46 0.27 0.25 0.45 0.22 0.18
The researcher has collected data from 25 students under this category. In many cases,
the mean is less than median and mode showing that the data is dispersed meaning little
below average satisfaction of the students on various issues. The data is not normal, it is
negatively skewed and leptokurtic.

162
TABLE C (a) 11 - DEMOGRAPHIC - COURSE - NETWORK PG
TE
AC
HE
R
PE
RF
OR
MA
N
CE
A
CA
DE
MIC
FA
CIL
ITIE
S
NO
N-
TE
AC
HIN
G
BE
HA
VIO
UR
L
IBR
AR
Y
FA
CIL
ITIE
S
CO
MP
UT
ER
FA
CIL
ITIE
S
PA
RK
ING
FA
CIL
ITIE
S
SP
OR
TS
&
CU
LT
UR
AL
CO
-
CU
RR
ICU
LA
R,
EX
TR
A
CU
RR
ICU
LA
CA
NT
EE
N
&
ME
SS
OV
ER
AL
L
CO
LL
EG
E
RA
TI
FE
ES
AS
HIN
DR
AN
CE
YE
S /
NO
Mean 3.23 3.10 3.13 3.52 3.35 2.81 3.39 3.35 2.87 3.19 0.87
Median 3.00 3.00 3.00 4.00 4.00 3.00 4.00 4.00 3.00 3.00 1.00
Mode 3.00 4.00 4.00 4.00 4.00 4.00 4.00 4.00 3.00 3.00 1.00
Standard
Deviation
0.76 0.87 0.85 0.68 0.75 1.11 0.88 0.80 0.85 0.60 0.34
Kurtosis 0.98 -0.66 -0.37 0.08 -0.85 -0.16 0.29 1.08 -0.16 -0.23 3.65
Skewness -0.90 -0.52 -0.61 -1.10 -0.71 -0.69 -1.19 -1.17 -0.45 -0.09 -2.33
Range 3.00 3.00 3.00 2.00 2.00 4.00 3.00 3.00 3.00 2.00 1.00
Count
31.0
0
31.0
0
31.0
0
31.0
0
31.0
0
31.0
0
31.0
0
31.0
0
31.0
0
31.0
0
31.0
0
Confidence
Level(95.0%)
0.28 0.32 0.31 0.25 0.28 0.41 0.32 0.29 0.31 0.22 0.12
The researcher has collected data from 31 students under this category. In all cases, the
mean and median are close to 3 but the mode is close to 4, showing that the data is having
central tendency meaning little above average satisfaction of the students on various
issues. The data is not normal, it is negatively skewed and leptokurtic.

163
TABLE C (a) 12 - DEMOGRAPHIC - COURSE - STRUCTURE PG
TE
AC
HE
R
PE
RF
OR
MA
N
CE
A
CA
DE
MIC
FA
CIL
ITIE
S
NO
N-
TE
AC
HIN
G
BE
HA
VIO
UR
L
IBR
AR
Y
FA
CIL
ITIE
S
CO
MP
UT
ER
FA
CIL
ITIE
S
PA
RK
ING
FA
CIL
ITIE
S
SP
OR
TS
&
CU
LT
UR
AL
CO
-
CU
RR
ICU
LA
R,
EX
TR
A
CU
RR
ICU
LA
CA
NT
EE
N
&
ME
SS
OV
ER
AL
L
CO
LL
EG
E
RA
TI
FE
ES
AS
HIN
DR
AN
CE
YE
S /
NO
Mean 3.07 2.91 3.08 3.24 3.19 2.64 3.27 3.21 2.73 3.11 0.82
Median 3.00 3.00 3.00 3.00 3.00 3.00 3.00 3.00 3.00 3.00 1.00
Mode 3.00 3.00 4.00 4.00 4.00 3.00 4.00 4.00 3.00 3.00 1.00
Standard
Deviation
0.85 0.95 0.97 0.91 0.89 1.21 0.87 0.92 1.05 0.68 0.39
Kurtosis -0.36 -0.88 0.33 2.53 0.12 -0.62 0.64 0.55 0.00 0.53 0.75
Skewness -0.59 -0.38 -0.93 -1.44 -0.94 -0.62 -1.04 -1.05 -0.74 -0.52 -1.66
Range 3.00 3.00 4.00 4.00 3.00 4.00 4.00 4.00 4.00 3.00 1.00
Count
153.
00
153.
00
153.
00
153.
00
153.
00
153.
00
153.
00
153.
00
153.
00
153.
00
153.
00
Confidence
Level(95.0%)
0.14 0.15 0.15 0.15 0.14 0.19 0.14 0.15 0.17 0.11 0.06
The researcher has collected data from 153 students under this category. In all cases, the
mean and median are close to 3 but the mode is close to 4, showing that the data is
dispersed meaning little below average satisfaction of the students on various issues. The
data is not normal, it is negatively skewed and leptokurtic.

164
TABLE C (a) 13 - DEMOGRAPHIC-COURSE-B.PHARMA
TE
AC
HE
R
PE
RF
OR
MA
N
CE
A
CA
DE
MIC
FA
CIL
ITIE
S
NO
N-
TE
AC
HIN
G
BE
HA
VIO
UR
L
IBR
AR
Y
FA
CIL
ITIE
S
CO
MP
UT
ER
FA
CIL
ITIE
S
PA
RK
ING
FA
CIL
ITIE
S
SP
OR
TS
&
CU
LT
UR
AL
CO
-
CU
RR
ICU
LA
R,
EX
TR
A
CU
RR
I
CA
NT
EE
N
&
ME
SS
OV
ER
AL
L
CO
LL
EG
ER
tn
g
FE
ES
AS
HIN
DR
AN
CE
YE
S /
NO
Mean 3.11 2.93 3.08 3.28 3.18 2.68 3.23 3.19 2.75 3.15 0.81
Median 3.00 3.00 3.00 3.50 3.00 3.00 3.00 3.00 3.00 3.00 1.00
Mode 3.00 3.00 4.00 4.00 4.00 3.00 4.00 4.00 3.00 3.00 1.00
Standard
Deviation
0.86 0.94 1.01 0.91 0.89 1.23 0.90 0.96 1.02 0.69 0.39
Kurtosis -0.07 -0.69 0.32 2.92 0.12 -0.54 0.34 0.32 0.13 0.47 0.55
Skewness -0.74 -0.47 -0.97 -1.56 -0.92 -0.70 -0.94 -1.02 -0.77 -0.54 -1.59
Range 3.00 3.00 4.00 4.00 3.00 4.00 4.00 4.00 4.00 3.00 1.00
Count
110.
00
110.
00
110.
00
110.
00
110.
00
110.
00
110.
00
110.
00
110.
00
110.
00
110.
00
Confidence
Level(95.0%)
0.16 0.18 0.19 0.17 0.17 0.23 0.17 0.18 0.19 0.13 0.07
The researcher has collected data from 110 students under this category. In many cases,
the mean is less than median and mode showing that the data is dispersed meaning little
below average satisfaction of the students on various issues. The data is not normal, it is
negatively skewed and leptokurtic.

165
TABLE C (a) 14 - DEMOGRAPHIC - COURSE - PHARMA PG
TE
AC
HE
R
PE
RF
OR
MA
N
CE
A
CA
DE
MIC
FA
CIL
ITIE
S
NO
N-
TE
AC
HIN
G
BE
HA
VIO
UR
L
IBR
AR
Y
FA
CIL
ITIE
S
CO
MP
UT
ER
FA
CIL
ITIE
S
PA
RK
ING
FA
CIL
ITIE
S
SP
OR
TS
&
CU
LT
UR
AL
CO
-
CU
RR
ICU
LA
R,
EX
TR
A
CU
RR
ICU
LA
R
CA
NT
EE
N
&
ME
SS
OV
ER
AL
L
CO
LL
EG
E
RA
TIN
G
FE
ES
AS
HIN
DR
AN
CE
YE
S /
NO
Mean 3.08 3.00 3.25 3.50 3.33 2.25 3.25 3.08 3.17 3.00 0.83
Median 3.00 3.00 3.00 4.00 3.50 2.50 3.50 3.00 3.00 3.00 1.00
Mode 3.00 4.00 3.00 4.00 4.00 3.00 4.00 3.00 3.00 3.00 1.00
Standard
Deviation
0.79 1.04 0.75 0.67 0.78 1.29 0.97 1.08 0.94 0.74 0.39
Kurtosis -1.26 -0.86 -0.87 0.35 -0.79 -1.00 1.41 0.68 1.33 -0.86 2.64
Skewness -0.16 -0.57 -0.48 -1.07 -0.72 -0.25 -1.32 -1.22 -1.18 0.00 -2.06
Range 2.00 3.00 2.00 2.00 2.00 4.00 3.00 3.00 3.00 2.00 1.00
Count
12.0
0
12.0
0
12.0
0
12.0
0
12.0
0
12.0
0
12.0
0
12.0
0
12.0
0
12.0
0
12.0
0
Confidence
Level(95.0%)
0.50 0.66 0.48 0.43 0.49 0.82 0.61 0.69 0.60 0.47 0.25
The researcher has collected data from 12 students under this category. In many cases,
the mean is less than median and mode showing that the data is dispersed meaning little
below average satisfaction of the students on various issues. The data is not normal, it is
negatively skewed and leptokurtic.
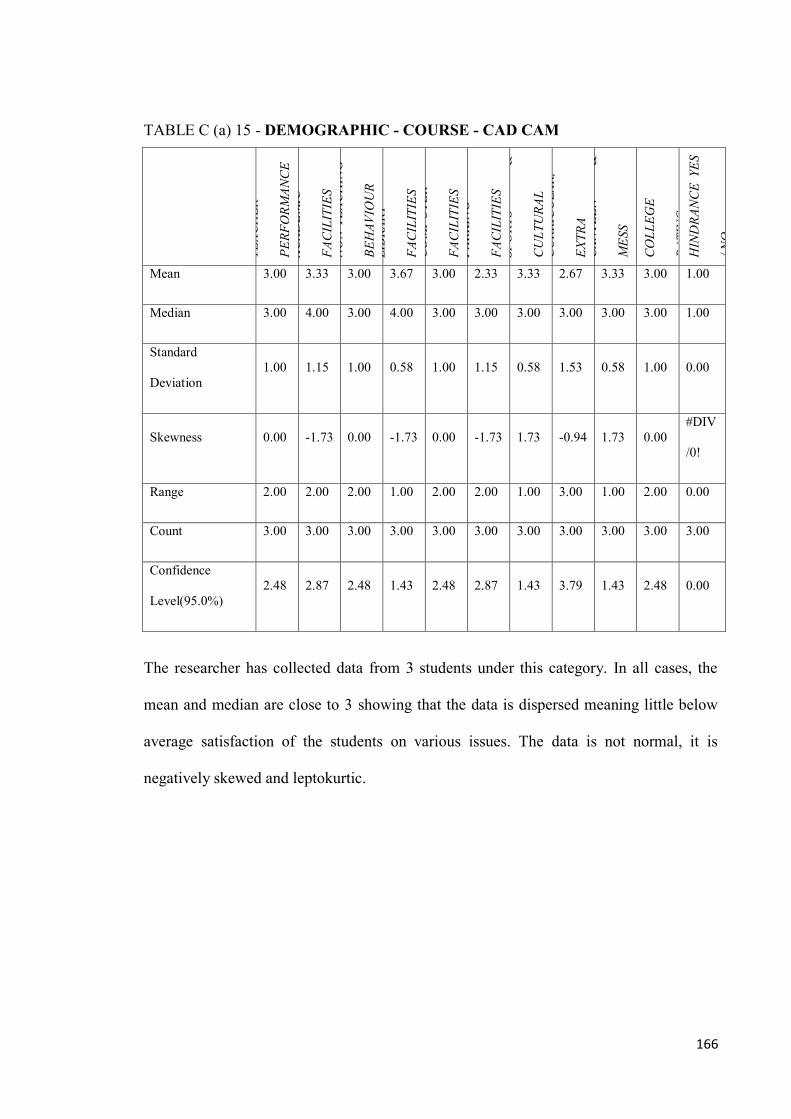
166
TABLE C (a) 15 - DEMOGRAPHIC - COURSE - CAD CAM
TE
AC
HE
R
PE
RF
OR
MA
NC
E
AC
AD
EM
IC
FA
CIL
ITIE
S
NO
N-T
EA
CH
ING
BE
HA
VIO
UR
L
IBR
AR
Y
FA
CIL
ITIE
S
CO
MP
UT
ER
FA
CIL
ITIE
S
PA
RK
ING
FA
CIL
ITIE
S
SP
OR
TS
&
CU
LT
UR
AL
CO
-
CU
RR
ICU
LA
R,
EX
TR
A
CU
RR
ICU
LA
R
CA
NT
EE
N
&
ME
SS
OV
ER
AL
L
CO
LL
EG
E
RA
TIN
G
FE
ES
AS
HIN
DR
AN
CE
YE
S
/ N
O
Mean 3.00 3.33 3.00 3.67 3.00 2.33 3.33 2.67 3.33 3.00 1.00
Median 3.00 4.00 3.00 4.00 3.00 3.00 3.00 3.00 3.00 3.00 1.00
Standard
Deviation
1.00 1.15 1.00 0.58 1.00 1.15 0.58 1.53 0.58 1.00 0.00
Skewness 0.00 -1.73 0.00 -1.73 0.00 -1.73 1.73 -0.94 1.73 0.00
#DIV
/0!
Range 2.00 2.00 2.00 1.00 2.00 2.00 1.00 3.00 1.00 2.00 0.00
Count 3.00 3.00 3.00 3.00 3.00 3.00 3.00 3.00 3.00 3.00 3.00
Confidence
Level(95.0%)
2.48 2.87 2.48 1.43 2.48 2.87 1.43 3.79 1.43 2.48 0.00
The researcher has collected data from 3 students under this category. In all cases, the
mean and median are close to 3 showing that the data is dispersed meaning little below
average satisfaction of the students on various issues. The data is not normal, it is
negatively skewed and leptokurtic.

167
TABLE C (a) 16 - DEMOGRAPHIC - COURSE – MBA
TE
AC
HE
R
PE
RF
OR
MA
N
CE
A
CA
DE
MIC
FA
CIL
ITIE
S
NO
N-
TE
AC
HIN
G
BE
HA
VIO
UR
L
IBR
AR
Y
FA
CIL
ITIE
S
CO
MP
UT
ER
FA
CIL
ITIE
S
PA
RK
ING
FA
CIL
ITIE
S
SP
OR
TS
&
CU
LT
UR
AL
CO
-
CU
RR
ICU
LA
R,
EX
TR
A
CU
RR
ICU
LA
R
CA
NT
EE
N
&
ME
SS
OV
ER
AL
L
CO
LL
EG
E
RA
TIN
G
FE
ES
AS
HIN
DR
AN
CE
YE
S /
NO
Mean 3.09 2.98 3.19 3.27 3.24 2.73 3.33 3.17 2.69 3.10 0.82
Median 3.00 3.00 3.00 3.00 3.00 3.00 4.00 3.00 3.00 3.00 1.00
Mode 3.00 3.00 4.00 4.00 4.00 3.00 4.00 4.00 3.00 3.00 1.00
Standard
Deviation
0.82 0.92 0.93 0.87 0.84 1.20 0.82 0.88 1.06 0.63 0.39
Kurtosis -0.28 -0.68 1.18 2.82 0.31 -0.41 1.28 0.55 -0.02 1.01 0.80
Skewness -0.59 -0.49 -1.19 -1.47 -0.96 -0.73 -1.17 -0.94 -0.73 -0.45 -1.67
Range 3.00 3.00 4.00 4.00 3.00 4.00 4.00 4.00 4.00 3.00 1.00
Count
132.
00
132.
00
132.
00
132.
00
132.
00
132.
00
132.
00
132.
00
132.
00
132.
00
132.
00
Confidence
Level(95.0%)
0.14 0.16 0.16 0.15 0.14 0.21 0.14 0.15 0.18 0.11 0.07
The researcher has collected data from 132 students under this category. In many cases,
the mean is less than median and mode showing that the data is dispersed meaning little
below average satisfaction of the students on various issues. The data is not normal, it is
negatively skewed and leptokurtic.

168
TABLE C (a) 17 - DEMOGRAPHIC - COURSE – MCA
TE
AC
HE
R
PE
RF
OR
MA
N
CE
A
CA
DE
MIC
FA
CIL
ITIE
S
NO
N-
TE
AC
HIN
G
BE
HA
VIO
UR
L
IBR
AR
Y
FA
CIL
ITIE
S
CO
MP
UT
ER
FA
CIL
ITIE
S
PA
RK
ING
FA
CIL
ITIE
S
SP
OR
TS
&
CU
LT
UR
AL
CO
-
CU
RR
ICU
LA
R,
EX
TR
A
CU
RR
ICU
LA
R
CA
NT
EE
N
&
ME
SS
OV
ER
AL
L
CO
LL
EG
E
RA
TIN
G
FE
ES
AS
HIN
DR
AN
CE
YE
S /
NO
Mean 2.86 2.67 3.05 2.95 3.33 2.48 3.33 3.19 2.38 3.05 0.81
Median 3.00 2.00 3.00 3.00 3.00 3.00 3.00 3.00 3.00 3.00 1.00
Mode 3.00 2.00 3.00 3.00 3.00 3.00 3.00 3.00 3.00 3.00 1.00
Standard
Deviation
0.73 1.02 0.74 0.67 0.66 1.29 0.66 0.60 1.02 0.50 0.40
Kurtosis -0.94 -1.22 -1.04 -0.50 -0.55 -0.64 -0.55 -0.10 0.08 1.86 0.98
Skewness 0.23 0.13 -0.08 0.05 -0.47 -0.56 -0.47 -0.07 -0.57 0.13 -1.70
Range 2.00 3.00 2.00 2.00 2.00 4.00 2.00 2.00 4.00 2.00 1.00
Count
21.0
0
21.0
0
21.0
0
21.0
0
21.0
0
21.0
0
21.0
0
21.0
0
21.0
0
21.0
0
21.0
0
Confidence
Level(95.0%)
0.33 0.46 0.34 0.30 0.30 0.59 0.30 0.27 0.47 0.23 0.18
The researcher has collected data from 21 students under this category. In many cases,
the mean is less than median and mode showing that the data is dispersed meaning little
below average satisfaction of the students on various issues. The data is not normal, it is
negatively skewed and leptokurtic.
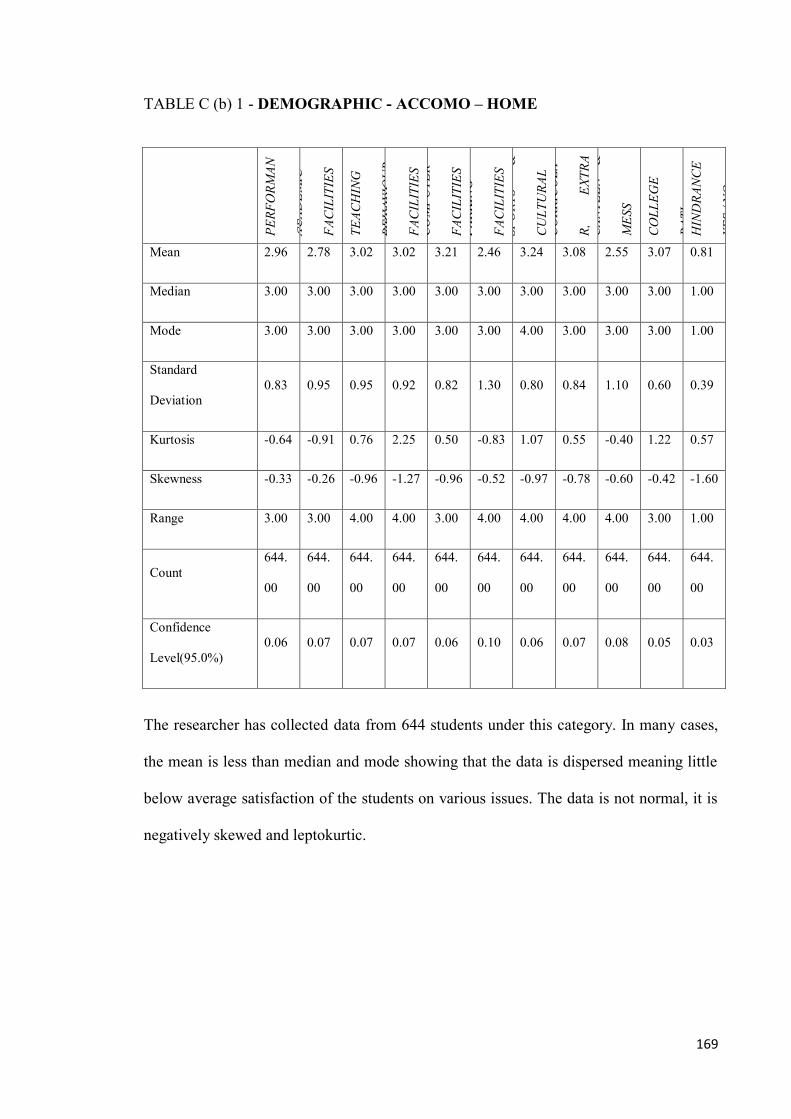
169
TABLE C (b) 1 - DEMOGRAPHIC - ACCOMO – HOME
TE
AC
HE
R
PE
RF
OR
MA
N
CE
A
CA
DE
MIC
FA
CIL
ITIE
S
NO
N-
TE
AC
HIN
G
BE
HA
VIO
UR
L
IBR
AR
Y
FA
CIL
ITIE
S
CO
MP
UT
ER
FA
CIL
ITIE
S
PA
RK
ING
FA
CIL
ITIE
S
SP
OR
TS
&
CU
LT
UR
AL
CO
-
CU
RR
ICU
LA
R,
EX
TR
A
CU
RR
ICU
LA
CA
NT
EE
N
&
ME
SS
OV
ER
AL
L
CO
LL
EG
E
RA
TI
FE
ES
AS
HIN
DR
AN
CE
YE
S /
NO
Mean 2.96 2.78 3.02 3.02 3.21 2.46 3.24 3.08 2.55 3.07 0.81
Median 3.00 3.00 3.00 3.00 3.00 3.00 3.00 3.00 3.00 3.00 1.00
Mode 3.00 3.00 3.00 3.00 3.00 3.00 4.00 3.00 3.00 3.00 1.00
Standard
Deviation
0.83 0.95 0.95 0.92 0.82 1.30 0.80 0.84 1.10 0.60 0.39
Kurtosis -0.64 -0.91 0.76 2.25 0.50 -0.83 1.07 0.55 -0.40 1.22 0.57
Skewness -0.33 -0.26 -0.96 -1.27 -0.96 -0.52 -0.97 -0.78 -0.60 -0.42 -1.60
Range 3.00 3.00 4.00 4.00 3.00 4.00 4.00 4.00 4.00 3.00 1.00
Count
644.
00
644.
00
644.
00
644.
00
644.
00
644.
00
644.
00
644.
00
644.
00
644.
00
644.
00
Confidence
Level(95.0%)
0.06 0.07 0.07 0.07 0.06 0.10 0.06 0.07 0.08 0.05 0.03
The researcher has collected data from 644 students under this category. In many cases,
the mean is less than median and mode showing that the data is dispersed meaning little
below average satisfaction of the students on various issues. The data is not normal, it is
negatively skewed and leptokurtic.

170
TABLE C (b) 2 - DEMOGRAPHIC - ACCOMO – COLLEGE HOSTEL
TE
AC
HE
R
PE
RF
OR
MA
NC
E
AC
AD
EM
IC
FA
CIL
ITIE
S
NO
N-T
EA
CH
ING
BE
HA
VIO
UR
L
IBR
AR
Y
FA
CIL
ITIE
S
CO
MP
UT
ER
FA
CIL
ITIE
S
PA
RK
ING
FA
CIL
ITIE
S
SP
OR
TS
&
CU
LT
UR
AL
C
O-C
UR
RIC
UL
AR
,
EX
TR
A
CU
RR
ICU
LA
C
AN
TE
EN
& M
ESS
OV
ER
AL
L
CO
LL
EG
E R
AT
I F
EE
S
AS
HIN
DR
AN
CE
YE
S /
NO
Mean 3.07 2.95 3.13 3.29 3.21 2.71 3.29 3.19 2.74 3.10 0.82
Median 3.00 3.00 3.00 4.00 3.00 3.00 4.00 3.00 3.00 3.00 1.00
Mode 3.00 3.00 4.00 4.00 4.00 3.00 4.00 4.00 3.00 3.00 1.00
Standard
Deviation
0.85 0.94 0.99 0.88 0.88 1.20 0.88 0.94 1.03 0.68 0.39
Kurtosis -0.23 -0.79 0.58 2.54 0.12 -0.56 0.84 0.52 0.01 0.50 0.68
Skewness -0.65 -0.46 -1.07 -1.47 -0.94 -0.68 -1.12 -1.05 -0.74 -0.50 -1.64
Range 3.00 3.00 4.00 4.00 3.00 4.00 4.00 4.00 4.00 3.00 1.00
Count
1312
.00
1312
.00
1312
.00
1312
.00
1312
.00
1312
.00
1312
.00
1312
.00
1312
.00
1312
.00
1312
.00
Confidence
Level(95%)
0.05 0.05 0.05 0.05 0.05 0.06 0.05 0.05 0.06 0.04 0.02
The researcher has collected data from 1312 students under this category. In many cases,
the mean is less than median and mode showing that the data is dispersed meaning little
below average satisfaction of the students on various issues. The data is not normal, it is
negatively skewed and leptokurtic.

171
TABLE C (b) 3 - DEMOGRAPHIC - ACCOMO - PRIVATE HOSTEL
TE
AC
HE
R
PE
RF
OR
MA
NC
E
AC
AD
EM
IC
FA
CIL
ITIE
S
NO
N-
TE
AC
HIN
G
BE
HA
VIO
UR
L
IBR
AR
Y
FA
CIL
ITIE
S
CO
MP
UT
ER
FA
CIL
ITIE
S
PA
RK
ING
FA
CIL
ITIE
S
SP
OR
TS
&
CU
LT
UR
AL
CO
-
CU
RR
ICU
LA
R,
EX
TR
A
CU
RR
ICU
LA
R
CA
NT
EE
N
&
ME
SS
O
VE
RA
LL
CO
LL
EG
E
RA
TIN
G
FE
ES
A
S
HIN
DR
AN
CE
YE
S /
NO
Mean 2.93 2.79 2.97 2.97 3.10 2.48 3.08 2.97 2.61 3.03 0.78
Median 3.00 3.00 3.00 3.00 3.00 3.00 3.00 3.00 3.00 3.00 1.00
Mode 3.00 2.00 3.00 3.00 3.00 3.00 3.00 3.00 3.00 3.00 1.00
Standard
Deviation
0.86 0.93 0.96 0.92 0.87 1.28 0.88 0.92 1.07 0.66 0.42
Kurtosis -0.76 -1.08 0.68 2.19 -0.02 -0.82 0.83 0.46 -0.22 1.28 -0.19
Skewness -0.29 -0.08 -0.90 -1.23 -0.77 -0.55 -0.85
-
0.76
-0.57 -0.63 -1.35
Range 3.00 3.00 4.00 4.00 3.00 4.00 4.00 4.00 4.00 3.00 1.00
Count 180.00
180.0
0
180.0
0
180.
00
180.
00
180.
00
180.
00
180.
00
180.0
0
180.
00
180.
00
Confidence
Level(95.0
%)
0.13 0.14 0.14 0.14 0.13 0.19 0.13 0.14 0.16 0.10 0.06
The researcher has collected data from 180 students under this category. In all cases, the
mean is less than median and mode (except for computing facility) showing that the data
is dispersed meaning little below average satisfaction of the students on various issues.
The data is not normal, it is negatively skewed and leptokurtic.
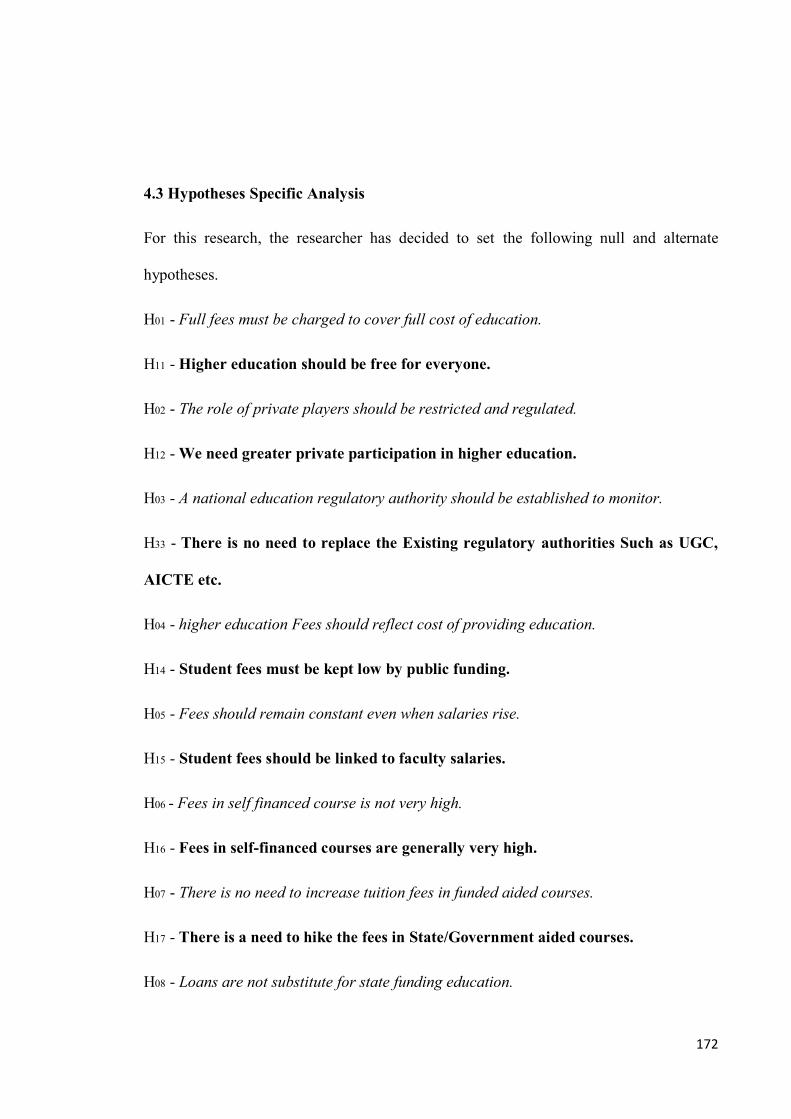
172
4.3 Hypotheses Specific Analysis
For this research, the researcher has decided to set the following null and alternate
hypotheses.
H01 - Full fees must be charged to cover full cost of education.
H11 - Higher education should be free for everyone.
H02 - The role of private players should be restricted and regulated.
H12 - We need greater private participation in higher education.
H03 - A national education regulatory authority should be established to monitor.
H33 - There is no need to replace the Existing regulatory authorities Such as UGC,
AICTE etc.
H04 - higher education Fees should reflect cost of providing education.
H14 - Student fees must be kept low by public funding.
H05 - Fees should remain constant even when salaries rise.
H15 - Student fees should be linked to faculty salaries.
H06 - Fees in self financed course is not very high.
H16 - Fees in self-financed courses are generally very high.
H07 - There is no need to increase tuition fees in funded aided courses.
H17 - There is a need to hike the fees in State/Government aided courses.
H08 - Loans are not substitute for state funding education.

173
H18 - Student loans can take care of needs of poor students.
H09 - Institutions should largely depend on student fees or government funding.
H19 - Higher educational institutions should augment resources by research,
consultancy etc. H10 - Government lacks the will to spend more on higher education.
H110 - Government lacks the resources to enhance spending on higher Education.
The testing of these hypotheses is relatively not so complex, as the data for each one of
them is dichotomous. Each of the respondents shall either select Null Hypothesis or
Alternative Hypothesis. For Null Hypothesis the score is assumed to be 0 and for
alternative hypothesis the score is assumed to be 1. Hence, if the mean score is greater
than 0.50 and the median and/or mode is 1, the alternative hypothesis is accepted and the
null hypothesis is rejected and the vice versa is also true. Thus, the descriptive statistics
alone can help us decisively prove or disprove our hypotheses.
Thus, this section is a combination of the earlier two sections in the sense that the
descriptive statistics are being followed. Further, after these basic tables, the researcher
shall compare these results with that of principals and bankers data as control group.
TABLE D 1 HYPOTHESES – OVERALL SCORE
H1 H2 H3 H4 H5 H6 H7 H8 H9 H10
Mean 0.78 0.41 0.39 0.81 0.69 0.63 0.28 0.58 0.76 0.36
Median 1.00 0.00 0.00 1.00 1.00 1.00 0.00 1.00 1.00 0.00
Mode 1.00 0.00 0.00 1.00 1.00 1.00 0.00 1.00 1.00 0.00
Std.Deviation 0.41 0.49 0.49 0.40 0.46 0.48 0.45 0.49 0.43 0.48
Kurtosis -0.13 -1.87 -1.81 -0.39 -1.32 -1.71 -1.02 -1.91 -0.53 -1.66
Skewness -1.37 0.36 0.44 -1.55 -0.83 -0.54 0.99 -0.31 -1.21 0.58
Range 1.00 1.00 1.00 1.00 1.00 1.00 1.00 1.00 1.00 1.00
Count 2136 2136 2136 2136 2136 2136 2136 2136 2136 2136
Confidence
Level(95.0%)
0.02 0.02 0.02 0.02 0.02 0.02 0.02 0.02 0.02 0.02
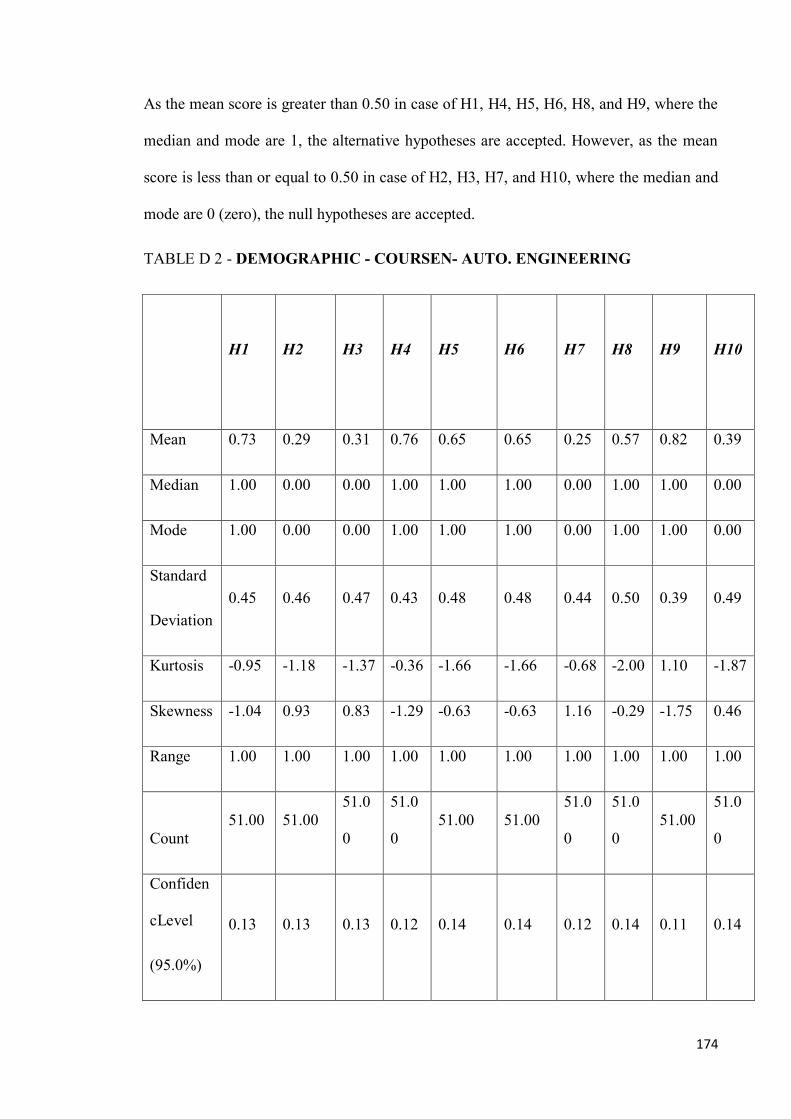
174
As the mean score is greater than 0.50 in case of H1, H4, H5, H6, H8, and H9, where the
median and mode are 1, the alternative hypotheses are accepted. However, as the mean
score is less than or equal to 0.50 in case of H2, H3, H7, and H10, where the median and
mode are 0 (zero), the null hypotheses are accepted.
TABLE D 2 - DEMOGRAPHIC - COURSEN- AUTO. ENGINEERING
H1 H2 H3 H4 H5 H6 H7 H8 H9 H10
Mean 0.73 0.29 0.31 0.76 0.65 0.65 0.25 0.57 0.82 0.39
Median 1.00 0.00 0.00 1.00 1.00 1.00 0.00 1.00 1.00 0.00
Mode 1.00 0.00 0.00 1.00 1.00 1.00 0.00 1.00 1.00 0.00
Standard
Deviation
0.45 0.46 0.47 0.43 0.48 0.48 0.44 0.50 0.39 0.49
Kurtosis -0.95 -1.18 -1.37 -0.36 -1.66 -1.66 -0.68 -2.00 1.10 -1.87
Skewness -1.04 0.93 0.83 -1.29 -0.63 -0.63 1.16 -0.29 -1.75 0.46
Range 1.00 1.00 1.00 1.00 1.00 1.00 1.00 1.00 1.00 1.00
Count
51.00 51.00
51.0
0
51.0
0
51.00 51.00
51.0
0
51.0
0
51.00
51.0
0
Confiden
cLevel
(95.0%)
0.13 0.13 0.13 0.12 0.14 0.14 0.12 0.14 0.11 0.14

175
As the mean score is greater than 0.50 in case of H1, H4, H5, H6, H8, and H9, where the
median and mode are 1, the alternative hypotheses are accepted. However, as the mean
score is less than or equal to 0.50 in case of H2, H3, H7, and H10, where the median and
mode are 0 (zero), the null hypotheses are accepted.
TABLE D 3 - DEMOGRAPHIC - COURSE - CIVIL ENGG.
H1 H2 H3 H4 H5 H6 H7 H8 H9 H10
Mean 0.78 0.45 0.42 0.80 0.67 0.63 0.30 0.58 0.75 0.35
Me
dian
1.00 0.00 0.00 1.00 1.00 1.00 0.00 1.00 1.00 0.00
Mode 1.00 0.00 0.00 1.00 1.00 1.00 0.00 1.00 1.00 0.00
Std.
Devn.
0.42 0.50 0.49 0.40 0.47 0.49 0.46 0.49 0.44 0.48
Kurt
osis
-0.18 -1.98 -1.90 0.32 -1.47 -1.75 -1.22 -1.90 -0.67 -1.62
Skew
ness
-1.35 0.20 0.35 -1.52 -0.74 -0.52 0.89 -0.35 -1.16 0.63
Range 1.00 1.00 1.00 1.00 1.00 1.00 1.00 1.00 1.00 1.00
Count
171.
00
171.
00
171.
00
171.
00
171.
00
171.
00
171.
00
171.
00
171.
00
171.
00
Confide
nce
Level(9
5.0%)
0.06 0.08 0.07 0.06 0.07 0.07 0.07 0.07 0.07 0.07
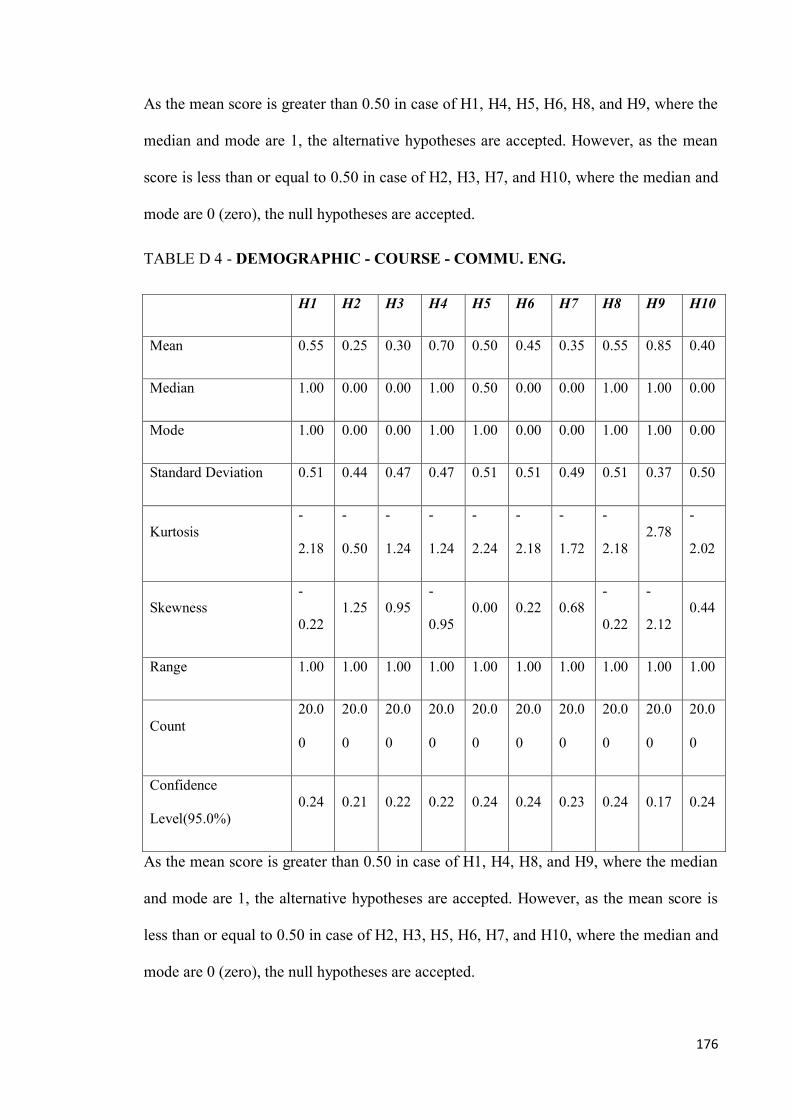
176
As the mean score is greater than 0.50 in case of H1, H4, H5, H6, H8, and H9, where the
median and mode are 1, the alternative hypotheses are accepted. However, as the mean
score is less than or equal to 0.50 in case of H2, H3, H7, and H10, where the median and
mode are 0 (zero), the null hypotheses are accepted.
TABLE D 4 - DEMOGRAPHIC - COURSE - COMMU. ENG.
H1 H2 H3 H4 H5 H6 H7 H8 H9 H10
Mean 0.55 0.25 0.30 0.70 0.50 0.45 0.35 0.55 0.85 0.40
Median 1.00 0.00 0.00 1.00 0.50 0.00 0.00 1.00 1.00 0.00
Mode 1.00 0.00 0.00 1.00 1.00 0.00 0.00 1.00 1.00 0.00
Standard Deviation 0.51 0.44 0.47 0.47 0.51 0.51 0.49 0.51 0.37 0.50
Kurtosis
-
2.18
-
0.50
-
1.24
-
1.24
-
2.24
-
2.18
-
1.72
-
2.18
2.78
-
2.02
Skewness
-
0.22
1.25 0.95
-
0.95
0.00 0.22 0.68
-
0.22
-
2.12
0.44
Range 1.00 1.00 1.00 1.00 1.00 1.00 1.00 1.00 1.00 1.00
Count
20.0
0
20.0
0
20.0
0
20.0
0
20.0
0
20.0
0
20.0
0
20.0
0
20.0
0
20.0
0
Confidence
Level(95.0%)
0.24 0.21 0.22 0.22 0.24 0.24 0.23 0.24 0.17 0.24
As the mean score is greater than 0.50 in case of H1, H4, H8, and H9, where the median
and mode are 1, the alternative hypotheses are accepted. However, as the mean score is
less than or equal to 0.50 in case of H2, H3, H5, H6, H7, and H10, where the median and
mode are 0 (zero), the null hypotheses are accepted.

177
TABLE D 5 - DEMOGRAPHIC - COURSE - COMP. ENG.
H1 H2 H3 H4 H5 H6 H7 H8 H9 H10
Mean 0.78 0.39 0.37 0.80 0.69 0.64 0.27 0.57 0.78 0.37
Median 1.00 0.00 0.00 1.00 1.00 1.00 0.00 1.00 1.00 0.00
Mode 1.00 0.00 0.00 1.00 1.00 1.00 0.00 1.00 1.00 0.00
Standard Deviation 0.42 0.49 0.48 0.40 0.46 0.48 0.44 0.50 0.42 0.48
Kurtosis -0.20 -1.82 -1.73 0.30 -1.36 -1.67 -0.92 -1.94 -0.25 -1.72
Skewness -1.34 0.43 0.52 -1.52 -0.80 -0.58 1.04 -0.26 -1.32 0.54
Range 1.00 1.00 1.00 1.00 1.00 1.00 1.00 1.00 1.00 1.00
Count
423.
00
423.
00
423.
00
423.
00
423.
00
423.
00
423.
00
423.
00
423.
00
423.
00
Confidence
Level(95.0%)
0.04 0.05 0.05 0.04 0.04 0.05 0.04 0.05 0.04 0.05
As the mean score is greater than 0.50 in case of H1, H4, H5, H6, H8, and H9, where the
median and mode are 1, the alternative hypotheses are accepted. However, as the mean
score is less than or equal to 0.50 in case of H2, H3, H7, and H10, where the median and
mode are 0 (zero), the null hypotheses are accepted.

178
TABLE D 6 - DEMOGRAPHIC -COURSE - E & TC
H1 H2 H3 H4 H5 H6 H7 H8 H9 H10
Mean 0.81 0.46 0.42 0.79 0.71 0.61 0.32 0.58 0.74 0.36
Median 1.00 0.00 0.00 1.00 1.00 1.00 0.00 1.00 1.00 0.00
Mode 1.00 0.00 0.00 1.00 1.00 1.00 0.00 1.00 1.00 0.00
Standard Deviation 0.40 0.50 0.50 0.41 0.45 0.49 0.47 0.50 0.44 0.48
Kurtosis 0.49 -2.00 -1.93 -0.03 -1.13 -1.80 -1.40 -1.93 -0.78 -1.69
Skewness -1.58 0.17 0.32 -1.40 -0.94 -0.48 0.79 -0.32 -1.11 0.58
Range 1.00 1.00 1.00 1.00 1.00 1.00 1.00 1.00 1.00 1.00
Count
135.
00
135.
00
135.
00
135.
00
135.
00
135.
00
135.
00
135.
00
135.
00
135.
00
Confidence
Level(95.0%)
0.07 0.09 0.08 0.07 0.08 0.08 0.08 0.08 0.07 0.08
As the mean score is greater than 0.50 in case of H1, H4, H5, H6, H8, and H9, where the
median and mode are 1, the alternative hypotheses are accepted. However, as the mean
score is less than or equal to 0.50 in case of H2, H3, H7, and H10, where the median and
mode are 0 (zero), the null hypotheses are accepted.

179
TABLE D 7 - DEMOGRAPHIC - COURSE - IT ENG.
H1 H2 H3 H4 H5 H6 H7 H8 H9 H10
Mean 0.73 0.45 0.36 0.91 0.82 0.64 0.36 0.64 0.55 0.36
Median 1.00 0.00 0.00 1.00 1.00 1.00 0.00 1.00 1.00 0.00
Mode 1.00 0.00 0.00 1.00 1.00 1.00 0.00 1.00 1.00 0.00
Standard Deviation 0.47 0.52 0.50 0.30 0.40 0.50 0.50 0.50 0.52 0.50
Kurtosis
-
0.76
-
2.44
-
1.96
11.0
0
2.04
-
1.96
-
1.96
-
1.96
-
2.44
-
1.96
Skewness
-
1.19
0.21 0.66
-
3.32
-
1.92
-
0.66
0.66
-
0.66
-
0.21
0.66
Range 1.00 1.00 1.00 1.00 1.00 1.00 1.00 1.00 1.00 1.00
Count
11.0
0
11.0
0
11.0
0
11.0
0
11.0
0
11.0
0
11.0
0
11.0
0
11.0
0
11.0
0
Confidence
Level(95.0%)
0.31 0.35 0.34 0.20 0.27 0.34 0.34 0.34 0.35 0.34
As the mean score is greater than 0.50 in case of H1, H4, H5, H6, H8, and H9, where the
median and mode are 1, the alternative hypotheses are accepted. However, as the mean
score is less than or equal to 0.50 in case of H2, H3, H7, and H10, where the median and
mode are 0 (zero), the null hypotheses are accepted.

180
TABLE D 8 - DEMOGRAPHIC - COURSE - MECH. ENG.
H1 H2 H3 H4 H5 H6 H7 H8 H9 H10
Mean 0.77 0.41 0.39 0.81 0.68 0.62 0.28 0.57 0.76 0.36
Median 1.00 0.00 0.00 1.00 1.00 1.00 0.00 1.00 1.00 0.00
Mode 1.00 0.00 0.00 1.00 1.00 1.00 0.00 1.00 1.00 0.00
Standard Deviation 0.42 0.49 0.49 0.40 0.47 0.48 0.45 0.50 0.43 0.48
Kurtosis -0.31 -1.86 -1.79 0.38 -1.38 -1.74 -1.07 -1.92 -0.51 -1.67
Skewness -1.30 0.38 0.46 -1.54 -0.79 -0.52 0.97 -0.29 -1.22 0.58
Range 1.00 1.00 1.00 1.00 1.00 1.00 1.00 1.00 1.00 1.00
Count
754.
00
754.
00
754.
00
754.
00
754.
00
754.
00
754.
00
754.
00
754.
00
754.
00
Confidence
Level(95.0%)
0.03 0.04 0.03 0.03 0.03 0.03 0.03 0.04 0.03 0.03
As the mean score is greater than 0.50 in case of H1, H4, H5, H6, H8, and H9, where the
median and mode are 1, the alternative hypotheses are accepted. However, as the mean
score is less than or equal to 0.50 in case of H2, H3, H7, and H10, where the median and
mode are 0 (zero), the null hypotheses are accepted.
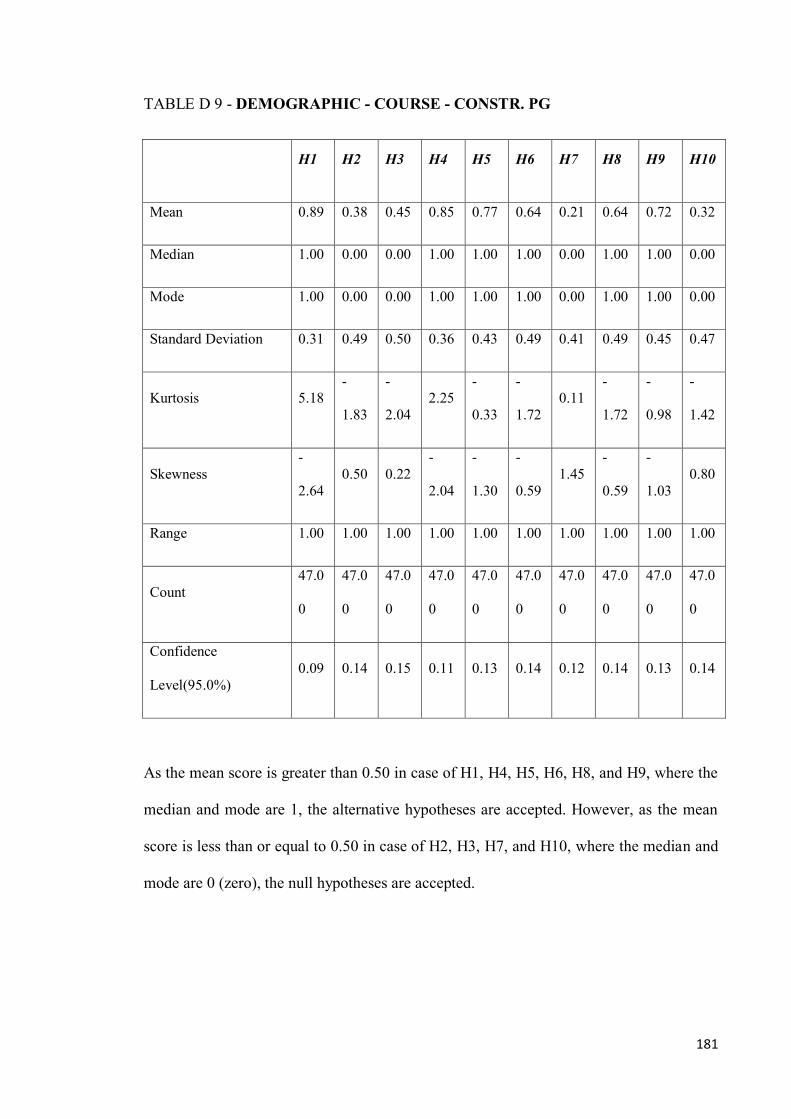
181
TABLE D 9 - DEMOGRAPHIC - COURSE - CONSTR. PG
H1 H2 H3 H4 H5 H6 H7 H8 H9 H10
Mean 0.89 0.38 0.45 0.85 0.77 0.64 0.21 0.64 0.72 0.32
Median 1.00 0.00 0.00 1.00 1.00 1.00 0.00 1.00 1.00 0.00
Mode 1.00 0.00 0.00 1.00 1.00 1.00 0.00 1.00 1.00 0.00
Standard Deviation 0.31 0.49 0.50 0.36 0.43 0.49 0.41 0.49 0.45 0.47
Kurtosis 5.18
-
1.83
-
2.04
2.25
-
0.33
-
1.72
0.11
-
1.72
-
0.98
-
1.42
Skewness
-
2.64
0.50 0.22
-
2.04
-
1.30
-
0.59
1.45
-
0.59
-
1.03
0.80
Range 1.00 1.00 1.00 1.00 1.00 1.00 1.00 1.00 1.00 1.00
Count
47.0
0
47.0
0
47.0
0
47.0
0
47.0
0
47.0
0
47.0
0
47.0
0
47.0
0
47.0
0
Confidence
Level(95.0%)
0.09 0.14 0.15 0.11 0.13 0.14 0.12 0.14 0.13 0.14
As the mean score is greater than 0.50 in case of H1, H4, H5, H6, H8, and H9, where the
median and mode are 1, the alternative hypotheses are accepted. However, as the mean
score is less than or equal to 0.50 in case of H2, H3, H7, and H10, where the median and
mode are 0 (zero), the null hypotheses are accepted.
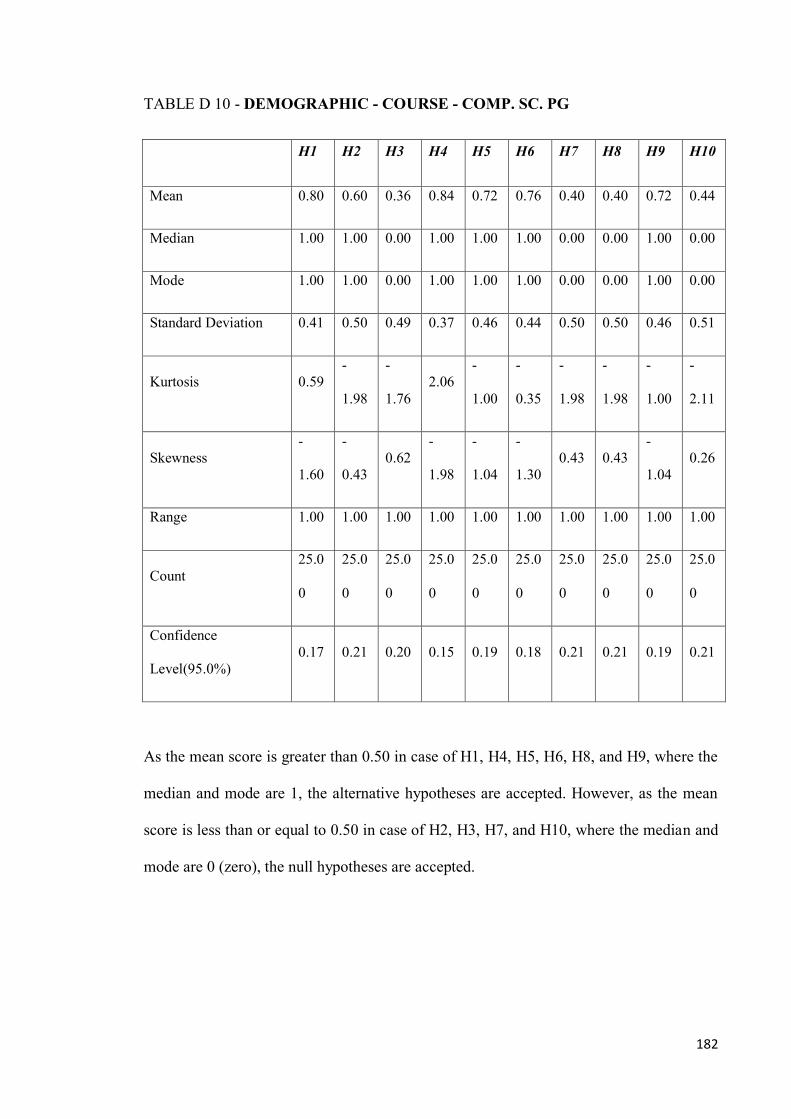
182
TABLE D 10 - DEMOGRAPHIC - COURSE - COMP. SC. PG
H1 H2 H3 H4 H5 H6 H7 H8 H9 H10
Mean 0.80 0.60 0.36 0.84 0.72 0.76 0.40 0.40 0.72 0.44
Median 1.00 1.00 0.00 1.00 1.00 1.00 0.00 0.00 1.00 0.00
Mode 1.00 1.00 0.00 1.00 1.00 1.00 0.00 0.00 1.00 0.00
Standard Deviation 0.41 0.50 0.49 0.37 0.46 0.44 0.50 0.50 0.46 0.51
Kurtosis 0.59
-
1.98
-
1.76
2.06
-
1.00
-
0.35
-
1.98
-
1.98
-
1.00
-
2.11
Skewness
-
1.60
-
0.43
0.62
-
1.98
-
1.04
-
1.30
0.43 0.43
-
1.04
0.26
Range 1.00 1.00 1.00 1.00 1.00 1.00 1.00 1.00 1.00 1.00
Count
25.0
0
25.0
0
25.0
0
25.0
0
25.0
0
25.0
0
25.0
0
25.0
0
25.0
0
25.0
0
Confidence
Level(95.0%)
0.17 0.21 0.20 0.15 0.19 0.18 0.21 0.21 0.19 0.21
As the mean score is greater than 0.50 in case of H1, H4, H5, H6, H8, and H9, where the
median and mode are 1, the alternative hypotheses are accepted. However, as the mean
score is less than or equal to 0.50 in case of H2, H3, H7, and H10, where the median and
mode are 0 (zero), the null hypotheses are accepted.

183
TABLE D 11 - DEMOGRAPHIC - COURSE - DESIGN ENGG. PG
H1 H2 H3 H4 H5 H6 H7 H8 H9 H10
Mean 0.86 0.41 0.49 0.81 0.73 0.54 0.24 0.70 0.70 0.30
Median 1.00 0.00 0.00 1.00 1.00 1.00 0.00 1.00 1.00 0.00
Mode 1.00 0.00 0.00 1.00 1.00 1.00 0.00 1.00 1.00 0.00
Standard Deviation 0.35 0.50 0.51 0.40 0.45 0.51 0.43 0.46 0.46 0.46
Kurtosis 3.12
-
1.95
-
2.11
0.78
-
0.89
-
2.09
-
0.47
-
1.21
-
1.21
-
1.21
Skewness
-
2.23
0.40 0.06
-
1.66
-
1.08
-
0.17
1.25
-
0.92
-
0.92
0.92
Range 1.00 1.00 1.00 1.00 1.00 1.00 1.00 1.00 1.00 1.00
Count
37.0
0
37.0
0
37.0
0
37.0
0
37.0
0
37.0
0
37.0
0
37.0
0
37.0
0
37.0
0
Confidence
Level(95.0%)
0.12 0.17 0.17 0.13 0.15 0.17 0.15 0.15 0.15 0.15
As the mean score is greater than 0.50 in case of H1, H4, H5, H6, H8, and H9, where the
median and mode are 1, the alternative hypotheses are accepted. However, as the mean
score is less than or equal to 0.50 in case of H2, H3, H7, and H10, where the median and
mode are 0 (zero), the null hypotheses are accepted.

184
TABLE D 12 - DEMOGRAPHIC - COURSE - NETWORK PG
H1 H2 H3 H4 H5 H6 H7 H8 H9 H10
Mean 0.87 0.42 0.39 0.90 0.77 0.68 0.19 0.65 0.77 0.26
Median 1.00 0.00 0.00 1.00 1.00 1.00 0.00 1.00 1.00 0.00
Mode 1.00 0.00 0.00 1.00 1.00 1.00 0.00 1.00 1.00 0.00
Standard Deviation 0.34 0.50 0.50 0.30 0.43 0.48 0.40 0.49 0.43 0.44
Kurtosis 3.65
-
2.02
-
1.89
6.65
-
0.11
-
1.46
0.70
-
1.71
-
0.11
-
0.70
Skewness
-
2.33
0.34 0.49
-
2.87
-
1.38
-
0.80
1.63
-
0.64
-
1.38
1.16
Range 1.00 1.00 1.00 1.00 1.00 1.00 1.00 1.00 1.00 1.00
Count
31.0
0
31.0
0
31.0
0
31.0
0
31.0
0
31.0
0
31.0
0
31.0
0
31.0
0
31.0
0
Confidence
Level(95.0%)
0.12 0.18 0.18 0.11 0.16 0.17 0.15 0.18 0.16 0.16
As the mean score is greater than 0.50 in case of H1, H4, H5, H6, H8, and H9, where the
median and mode are 1, the alternative hypotheses are accepted. However, as the mean
score is less than or equal to 0.50 in case of H2, H3, H7, and H10, where the median and
mode are 0 (zero), the null hypotheses are accepted.

185
TABLE D 13 - DEMOGRAPHIC - COURSE - STRUCTURE PG
H1 H2 H3 H4 H5 H6 H7 H8 H9 H10
Mean 0.81 0.39 0.39 0.83 0.71 0.65 0.25 0.58 0.76 0.35
Median 1.00 0.00 0.00 1.00 1.00 1.00 0.00 1.00 1.00 0.00
Mode 1.00 0.00 0.00 1.00 1.00 1.00 0.00 1.00 1.00 0.00
Standard Deviation 0.39 0.49 0.49 0.38 0.46 0.48 0.43 0.49 0.43 0.48
Kurtosis 0.57 -1.82 -1.80 1.17 -1.18 -1.64 -0.62 -1.91 -0.42 -1.64
Skewness -1.60 0.45 0.47 -1.78 -0.91 -0.62 1.18 -0.33 -1.26 0.62
Range 1.00 1.00 1.00 1.00 1.00 1.00 1.00 1.00 1.00 1.00
Count
153.
00
153.
00
153.
00
153.
00
153.
00
153.
00
153.
00
153.
00
153.
00
153.
00
Confidence
Level(95.0%)
0.06 0.08 0.08 0.06 0.07 0.08 0.07 0.08 0.07 0.08
As the mean score is greater than 0.50 in case of H1, H4, H5, H6, H8, and H9, where the
median and mode are 1, the alternative hypotheses are accepted. However, as the mean
score is less than or equal to 0.50 in case of H2, H3, H7, and H10, where the median and
mode are 0 (zero), the null hypotheses are accepted.
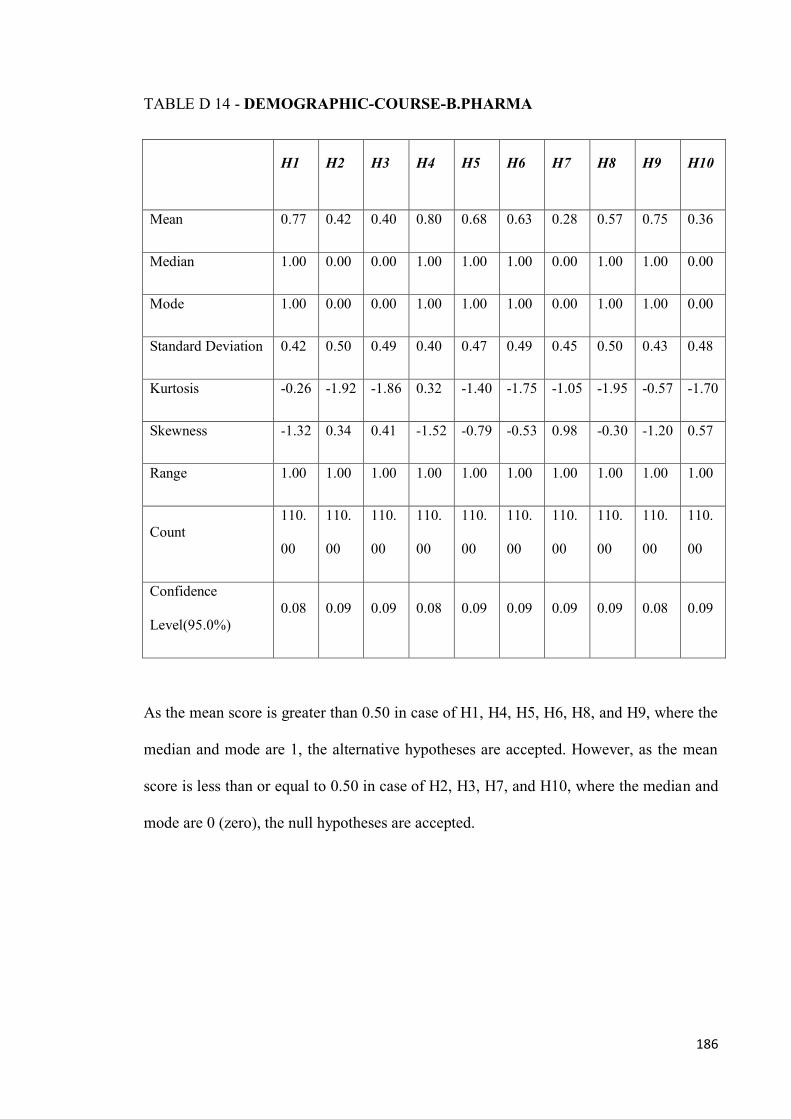
186
TABLE D 14 - DEMOGRAPHIC-COURSE-B.PHARMA
H1 H2 H3 H4 H5 H6 H7 H8 H9 H10
Mean 0.77 0.42 0.40 0.80 0.68 0.63 0.28 0.57 0.75 0.36
Median 1.00 0.00 0.00 1.00 1.00 1.00 0.00 1.00 1.00 0.00
Mode 1.00 0.00 0.00 1.00 1.00 1.00 0.00 1.00 1.00 0.00
Standard Deviation 0.42 0.50 0.49 0.40 0.47 0.49 0.45 0.50 0.43 0.48
Kurtosis -0.26 -1.92 -1.86 0.32 -1.40 -1.75 -1.05 -1.95 -0.57 -1.70
Skewness -1.32 0.34 0.41 -1.52 -0.79 -0.53 0.98 -0.30 -1.20 0.57
Range 1.00 1.00 1.00 1.00 1.00 1.00 1.00 1.00 1.00 1.00
Count
110.
00
110.
00
110.
00
110.
00
110.
00
110.
00
110.
00
110.
00
110.
00
110.
00
Confidence
Level(95.0%)
0.08 0.09 0.09 0.08 0.09 0.09 0.09 0.09 0.08 0.09
As the mean score is greater than 0.50 in case of H1, H4, H5, H6, H8, and H9, where the
median and mode are 1, the alternative hypotheses are accepted. However, as the mean
score is less than or equal to 0.50 in case of H2, H3, H7, and H10, where the median and
mode are 0 (zero), the null hypotheses are accepted.
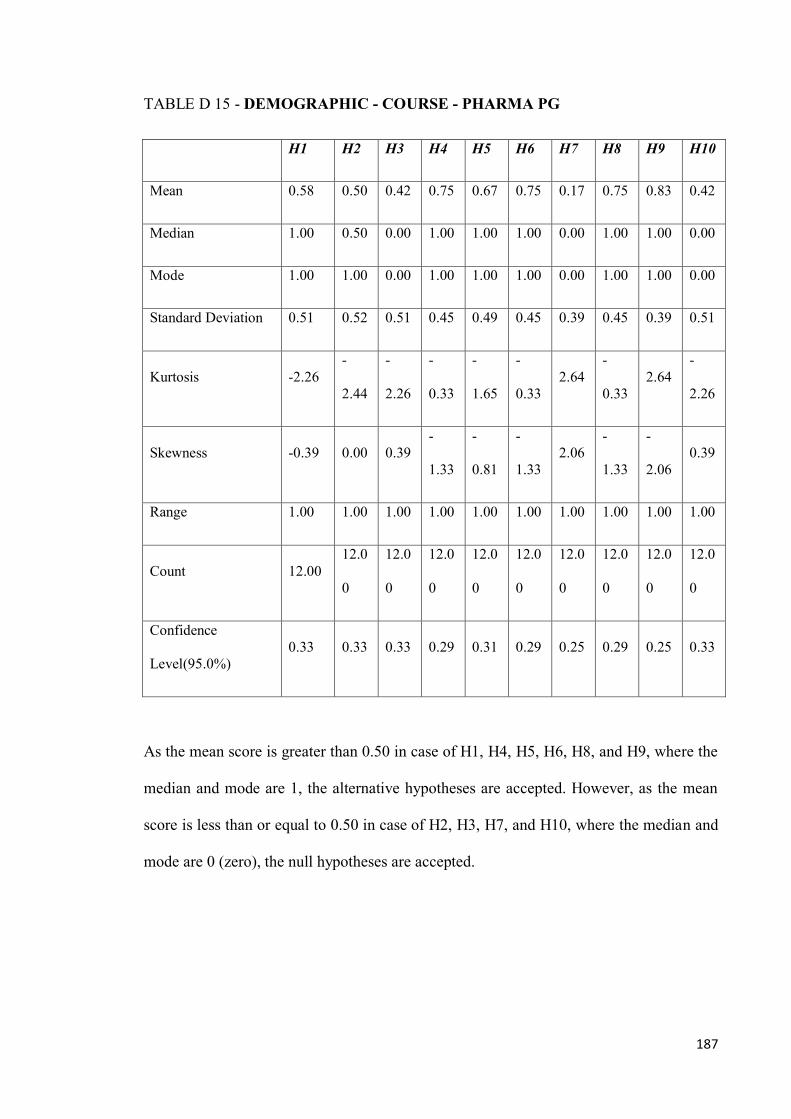
187
TABLE D 15 - DEMOGRAPHIC - COURSE - PHARMA PG
H1 H2 H3 H4 H5 H6 H7 H8 H9 H10
Mean 0.58 0.50 0.42 0.75 0.67 0.75 0.17 0.75 0.83 0.42
Median 1.00 0.50 0.00 1.00 1.00 1.00 0.00 1.00 1.00 0.00
Mode 1.00 1.00 0.00 1.00 1.00 1.00 0.00 1.00 1.00 0.00
Standard Deviation 0.51 0.52 0.51 0.45 0.49 0.45 0.39 0.45 0.39 0.51
Kurtosis -2.26
-
2.44
-
2.26
-
0.33
-
1.65
-
0.33
2.64
-
0.33
2.64
-
2.26
Skewness -0.39 0.00 0.39
-
1.33
-
0.81
-
1.33
2.06
-
1.33
-
2.06
0.39
Range 1.00 1.00 1.00 1.00 1.00 1.00 1.00 1.00 1.00 1.00
Count 12.00
12.0
0
12.0
0
12.0
0
12.0
0
12.0
0
12.0
0
12.0
0
12.0
0
12.0
0
Confidence
Level(95.0%)
0.33 0.33 0.33 0.29 0.31 0.29 0.25 0.29 0.25 0.33
As the mean score is greater than 0.50 in case of H1, H4, H5, H6, H8, and H9, where the
median and mode are 1, the alternative hypotheses are accepted. However, as the mean
score is less than or equal to 0.50 in case of H2, H3, H7, and H10, where the median and
mode are 0 (zero), the null hypotheses are accepted.

188
TABLE D 16 - DEMOGRAPHIC - COURSE - CAD CAM
H1 H2 H3 H4 H5 H6 H7 H8 H9 H10
Mean 0.67 0.33 0.67 0.67 0.33 0.67 0.00 0.33 1.00 0.00
Median 1.00 0.00 1.00 1.00 0.00 1.00 0.00 0.00 1.00 0.00
Standard
Deviation
0.58 0.58 0.58 0.58 0.58 0.58 0.00 0.58 0.00 0.00
Skewness
-
1.73
1.73 -1.73
-
1.73
1.73
-
1.73
#DIV/
0!
1.73
#DIV/
0!
#DIV/0!
Range 1.00 1.00 1.00 1.00 1.00 1.00 0.00 1.00 0.00 0.00
Count 3.00 3.00 3.00 3.00 3.00 3.00 3.00 3.00 3.00 3.00
Confidence
Level(95.0
%)
1.43 1.43 1.43 1.43 1.43 1.43 0.00 1.43 0.00 0.00
As the mean score is greater than 0.50 in case of H1, H4, H5, H6, H8, and H9, where the
median and mode are 1, the alternative hypotheses are accepted. However, as the mean
score is less than or equal to 0.50 in case of H2, H3, H7, and H10, where the median and
mode are 0 (zero), the null hypotheses are accepted.

189
TABLEA D 17 - DEMOGRAPHIC - COURSE – MBA
H1 H2 H3 H4 H5 H6 H7 H8 H9 H10
Mean 0.80 0.41 0.42 0.80 0.71 0.62 0.29 0.60 0.73 0.34
Median 1.00 0.00 0.00 1.00 1.00 1.00 0.00 1.00 1.00 0.00
Mode 1.00 0.00 0.00 1.00 1.00 1.00 0.00 1.00 1.00 0.00
Standar
d
Deviati
on
0.40 0.49 0.49 0.40 0.45 0.49 0.45 0.49 0.44 0.48
Kurtosi
s
0.38 -1.89 -1.91 0.38 -1.12 -1.77 -1.12 -1.86 -0.85 -1.56
Skewne
ss
-
1.54
0.37 0.34 -1.54 -0.95 -0.51 0.95 -0.41 -1.08 0.68
Range 1.00 1.00 1.00 1.00 1.00 1.00 1.00 1.00 1.00 1.00
Count 132.
00
132.0
0
132.00 132.00 132.00 132.00 132.0
0
132.00 132.0
0
132.00
Confide
nce
Level
(95.0%)
0.07 0.08 0.09 0.07 0.08 0.08 0.08 0.08 0.08 0.08

190
As the mean score is greater than 0.50 in case of H1, H4, H5, H6, H8, and H9, where the
median and mode are 1, the alternative hypotheses are accepted. However, as the mean
score is less than or equal to 0.50 in case of H2, H3, H7, and H10, where the median and
mode are 0 (zero), the null hypotheses are accepted.
TABLE D 18 - DEMOGRAPHIC - COURSE - MCA
H1 H2 H3 H4 H5 H6 H7 H8 H9 H10
Mean 0.76 0.62 0.33 0.86 0.81 0.71 0.29 0.48 0.76 0.43
Median 1.00 1.00 0.00 1.00 1.00 1.00 0.00 0.00 1.00 0.00
Mode 1.00 1.00 0.00 1.00 1.00 1.00 0.00 0.00 1.00 0.00
Standard Deviation 0.44 0.50 0.48 0.36 0.40 0.46 0.46 0.51 0.44 0.51
Kurtosis
-
0.28
-
1.91
-
1.58
3.14 0.98
-
1.06
-
1.06
-
2.21
-
0.28
-
2.12
Skewness
-
1.33
-
0.53
0.76
-
2.20
-
1.70
-
1.02
1.02 0.10
-
1.33
0.31
Range 1.00 1.00 1.00 1.00 1.00 1.00 1.00 1.00 1.00 1.00
Count
21.0
0
21.0
0
21.0
0
21.0
0
21.0
0
21.0
0
21.0
0
21.0
0
21.0
0
21.0
0
Confidence
Level(95.0%)
0.20 0.23 0.22 0.16 0.18 0.21 0.21 0.23 0.20 0.23
As the mean score is greater than 0.50 in case of H1, H4, H5, H6, H8, and H9, where the
median and mode are 1, the alternative hypotheses are accepted. However, as the mean
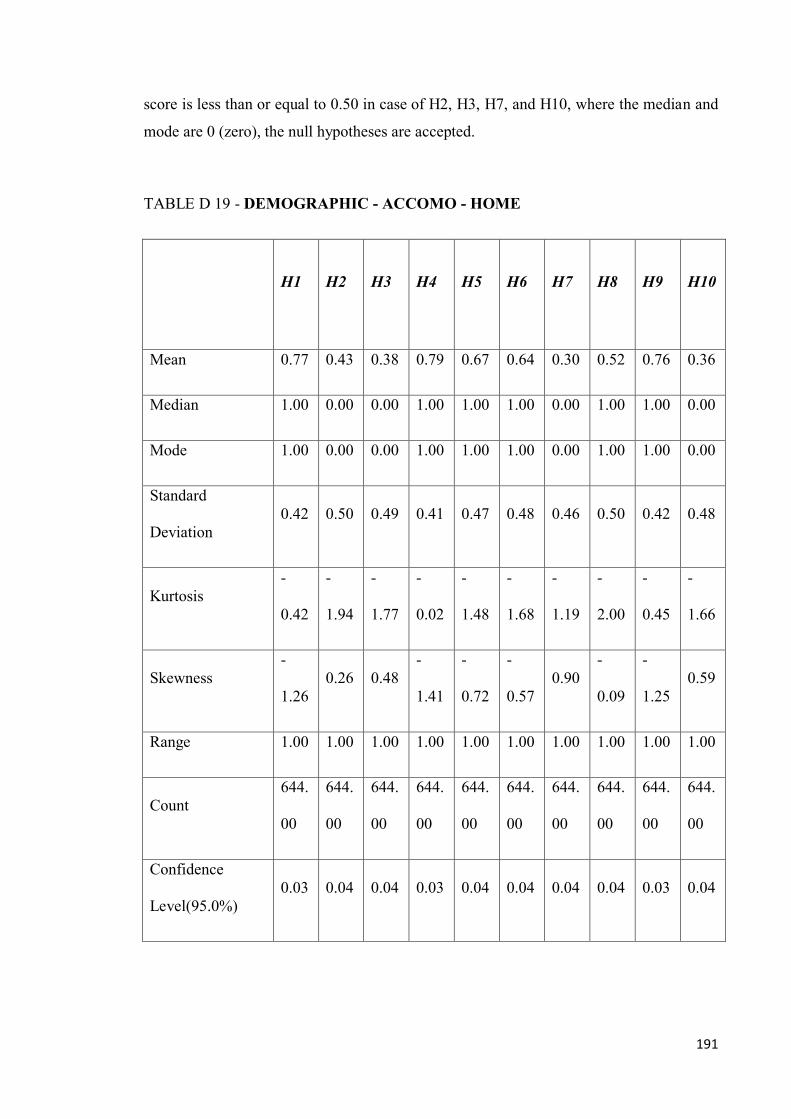
191
score is less than or equal to 0.50 in case of H2, H3, H7, and H10, where the median and
mode are 0 (zero), the null hypotheses are accepted.
TABLE D 19 - DEMOGRAPHIC - ACCOMO - HOME
H1 H2 H3 H4 H5 H6 H7 H8 H9 H10
Mean 0.77 0.43 0.38 0.79 0.67 0.64 0.30 0.52 0.76 0.36
Median 1.00 0.00 0.00 1.00 1.00 1.00 0.00 1.00 1.00 0.00
Mode 1.00 0.00 0.00 1.00 1.00 1.00 0.00 1.00 1.00 0.00
Standard
Deviation
0.42 0.50 0.49 0.41 0.47 0.48 0.46 0.50 0.42 0.48
Kurtosis
-
0.42
-
1.94
-
1.77
-
0.02
-
1.48
-
1.68
-
1.19
-
2.00
-
0.45
-
1.66
Skewness
-
1.26
0.26 0.48
-
1.41
-
0.72
-
0.57
0.90
-
0.09
-
1.25
0.59
Range 1.00 1.00 1.00 1.00 1.00 1.00 1.00 1.00 1.00 1.00
Count
644.
00
644.
00
644.
00
644.
00
644.
00
644.
00
644.
00
644.
00
644.
00
644.
00
Confidence
Level(95.0%)
0.03 0.04 0.04 0.03 0.04 0.04 0.04 0.04 0.03 0.04

192
As the mean score is greater than 0.50 in case of H1, H4, H5, H6, H8, and H9, where the
median and mode are 1, the alternative hypotheses are accepted. However, as the mean
score is less than or equal to 0.50 in case of H2, H3, H7, and H10, where the median and
mode are 0 (zero), the null hypotheses are accepted.
TABLE D 20 - DEMOGRAPHIC - ACCOMO - HOSTEL
H1 H2 H3 H4 H5 H6 H7 H8 H9 H10
Mean 0.79 0.40 0.40 0.81 0.70 0.63 0.26 0.60 0.76 0.36
Median 1.00 0.00 0.00 1.00 1.00 1.00 0.00 1.00 1.00 0.00
Mode 1.00 0.00 0.00 1.00 1.00 1.00 0.00 1.00 1.00 0.00
Standard
Deviation
0.40 0.49 0.49 0.39 0.46 0.48 0.44 0.49 0.43 0.48
Kurtosis 0.14 -1.82 -1.82 0.59 -1.21 -1.73 -0.77 -1.82 -0.47 -1.64
Skewness -1.46 0.43 0.42 -1.61 -0.89 -0.52 1.11 -0.42 -1.24 0.60
Range 1.00 1.00 1.00 1.00 1.00 1.00 1.00 1.00 1.00 1.00
Count 1312.0
1312
.00
1312
.00
1312
.00
1312
.00
1312
.00
1312
.00
1312
.00
1312
.00
1312
.00
Confidence
Level(95.0%)
0.02 0.03 0.03 0.02 0.02 0.03 0.02 0.03 0.02 0.03
As the mean score is greater than 0.50 in case of H1, H4, H5, H6, H8, and H9, where the
median and mode are 1, the alternative hypotheses are accepted. However, as the mean

193
score is less than or equal to 0.50 in case of H2, H3, H7, and H10, where the median and
mode are 0 (zero), the null hypotheses are accepted.
TABLE D 21 - DEMOGRAPHIC - ACCOMO - PRIVATE HOSTEL
H1 H2 H3 H4 H5 H6 H7 H8 H9 H10
Mean 0.74 0.44 0.39 0.82 0.68 0.64 0.37 0.57 0.72 0.39
Median 1.00 0.00 0.00 1.00 1.00 1.00 0.00 1.00 1.00 0.00
Mode 1.00 0.00 0.00 1.00 1.00 1.00 0.00 1.00 1.00 0.00
Standard
Deviation
0.44 0.50 0.49 0.39 0.47 0.48 0.48 0.50 0.45 0.49
Kurtosis -0.73 -1.96 -1.81 0.73 -1.38 -1.68 -1.74 -1.93 -1.07 -1.81
Skewness -1.13 0.25 0.46 -1.65 -0.79 -0.58 0.53 -0.29 -0.97 0.46
Range 1.00 1.00 1.00 1.00 1.00 1.00 1.00 1.00 1.00 1.00
Count
180.0
0
180.0
0
180.0
0
180.0
0
180.0
0
180.0
0
180.0
0
180.0
0
180.0
0
180.0
0
Confidence
Level(95.0%
)
0.06 0.07 0.07 0.06 0.07 0.07 0.07 0.07 0.07 0.07
As the mean score is greater than 0.50 in case of H1, H4, H5, H6, H8, and H9, where the
median and mode are 1, the alternative hypotheses are accepted. However, as the mean
score is less than or equal to 0.50 in case of H2, H3, H7, and H10, where the median and
mode are 0 (zero), the null hypotheses are accepted.

194
4.4 Frequency Data Analysis
Frequency analysis is a descriptive statistical method that shows the number of
occurrences of each response chosen by the respondents. While using frequency analysis,
SPSS statistics can also calculate the mean, median and mode to help users analyze the
results and draw conclusions. The researcher has used this for the purpose of testing the
hypotheses set for this research. In the questionnaire, the researcher has stated ten
different hypotheses along with the null hypotheses of each of them. The acceptance of
null hypotheses is rated as 0 (zero) and the rejection is rated as 1 (one). The related tables
and graphs are given below for each of the hypotheses.
H01 - Full fees must be charged to cover full cost of education.
H11 - Higher education should be free for everyone.
Frequency Percent Valid Percent
Valid 0 466.00 21.82 21.82
1 1670.00 78.18 78.18
Total 2136.00 100.00 100.00

195
As the majority has chosen 1 as their choice, the hypothesis that “Higher education
should be free for everyone” has been accepted.
H02 - The role of private players should be restricted and regulated.
H12 - We need greater private participation in higher education.
Frequency Percent Valid Percent
Valid 0 1258.00 58.90 58.90
1 878.00 41.10 41.10
Total 2136.00 100.00 100.00

196
As the majority has chosen 0 as their choice, the null hypothesis that “The role of private
players should be restricted and regulated” has been accepted.
H03 - A national education regulatory authority should be established to monitor.
H13 - There is no need to replace the Existing regulatory authorities Such as UGC,
AICTE etc.
H3
Frequency Percent
Valid
Percent
Valid 0 1299.00 60.81 60.81
1 837.00 39.19 39.19
Total 2136.00 100.00 100.00
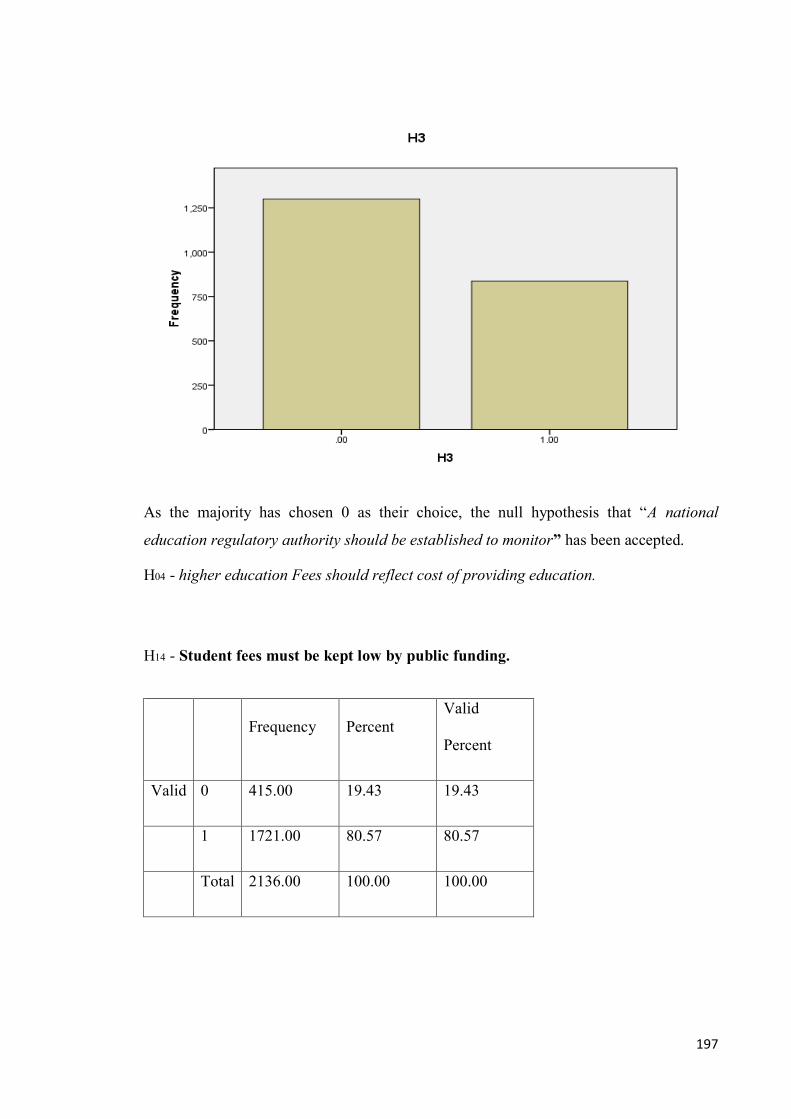
197
As the majority has chosen 0 as their choice, the null hypothesis that “A national
education regulatory authority should be established to monitor” has been accepted.
H04 - higher education Fees should reflect cost of providing education.
H14 - Student fees must be kept low by public funding.
Frequency Percent
Valid
Percent
Valid 0 415.00 19.43 19.43
1 1721.00 80.57 80.57
Total 2136.00 100.00 100.00

198
As the majority has chosen 1 as their choice, the hypothesis that “Student fees must be
kept low by public funding” has been accepted.
H05 - Fees should remain constant even when salaries rise.
H15 - Student fees should be linked to faculty salaries.
Frequency Percent
Valid
Percent
Valid 0 660.00 30.90 30.90
1 1476.00 69.10 69.10
Total 2136.00 100.00 100.00
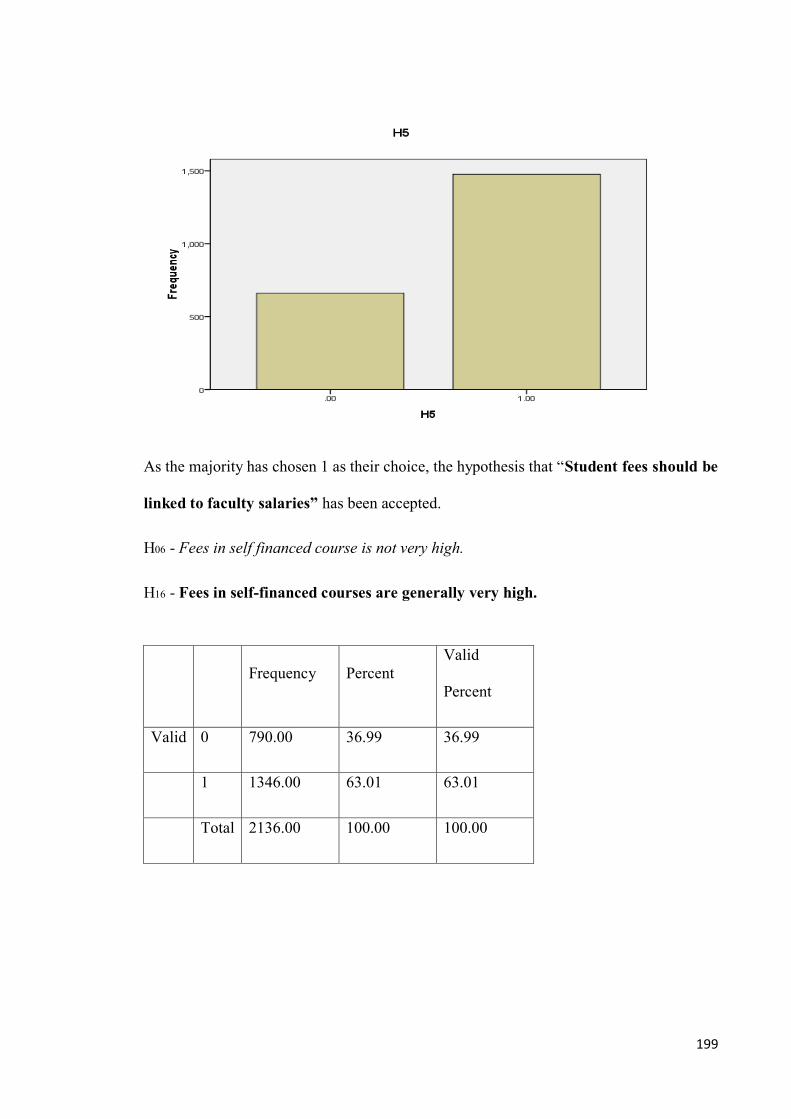
199
As the majority has chosen 1 as their choice, the hypothesis that “Student fees should be
linked to faculty salaries” has been accepted.
H06 - Fees in self financed course is not very high.
H16 - Fees in self-financed courses are generally very high.
Frequency Percent
Valid
Percent
Valid 0 790.00 36.99 36.99
1 1346.00 63.01 63.01
Total 2136.00 100.00 100.00

200
As the majority has chosen 1 as their choice, the hypothesis that “Fees in self-financed
courses are generally very high” has been accepted.
H07 - There is no need to increase tuition fees in funded aided courses.
H17 - There is a need to hike the fees in State/Government aided courses.
Frequency Percent Valid Percent
Valid 0 1541.00 72.14 72.14
1 595.00 27.86 27.86
Total 2136.00 100.00 100.00

201
As the majority has chosen 0 as their choice, the null hypothesis that “There is no need to
increase tuition fees in funded aided courses” has been accepted.
H08 - Loans are not substitute for state funding education.
H18 - Student loans can take care of needs of poor students.
Frequency Percent Valid Percent
Valid 0 904.00 42.32 42.32
1 1232.00 57.68 57.68
Total 2136.00 100.00 100.00

202
As the majority has chosen 1 as their choice, the hypothesis that “Student loans can take
care of needs of poor students” has been accepted.
H09 - Institutions should largely depend on student fees or government funding.
H19 - Higher educational institutions should augment resources by research,
consultancy etc.
Frequency Percent Valid Percent
Valid 0 514.00 24.06 24.06
1 1622.00 75.94 75.94
Total 2136.00 100.00 100.00

203
As the majority has chosen 1 as their choice, the hypothesis that “Higher educational
institutions should augment resources by research, consultancy etc.” has been
accepted.
H10 - Government lacks the will to spend more on higher education.
H110 -Government lacks the resources to enhance spending on higher Education.
Frequency Percent
Valid
Percent
Valid 0 1367.00 64.00 64.00
1 769.00 36.00 36.00
Total 2136.00 100.00 100.00

204
As the majority has chosen 0 as their choice, the null hypothesis that “Government lacks
the will to spend more on higher education” has been accepted.

205
CHAPTER 5
CONCLUSIONS
This chapter is focuses the data analysis indicates that
1.The Higher education should be free for everyone and students feel that all fees
should be borne by Government,
2. Need greater private participation in higher education.
3. There is no need to replace the Existing regulatory authorities Such as UGC, AICTE
etc.
4. Student fees must be kept low by public funding.
5. Student fees must be kept low by public funding.
6. Student loans can take care of needs of poor students
7. The maximum satisfaction level in all cases is found to be in Sports and Cultural
Activities
8.There is certain degree of dissatisfaction with teaching performances
9.Students staying in colleges hostels appear to be more satisfied within the college
vies-a-vs students staying in their own hostels or private hostels.
206
CHAPTER 6
Recommendations
Based on the study the researcher supports that the following recommendations may be
considered
1.Access: Though India can boast of having the largest system of higher education In
terms of the number of institutions, in relative terms, it still lags behind developed and
even several developing countries in terms of access. The access to higher and technical
education is still abysmally low, around 12 per cent in 2003-04. Obviously, this means
almost doubling the access to reach a minimum threshold of 20 percent. The primary
onus of increasing access of this level lies with the state, which needs to mobilise
additional resources to open new institutions, besides increasing the intake capacity of the
existing institutions. Priority must be given to the backward areas in opening new
institutions.
2. Equity: It is important that the increased access to higher education should be
inclusive. Education, particularly higher education, is being looked at providing avenues
for social mobility for the marginalised sections. Indeed, the recent spurt in the demand
for reservations for Other Backward Classes (OBCs) may be a reflection of the
important role of higher education in social mobility. We can no longer afford to ignore
such demands. Neither these demands can be satisfied with tokenism.
3.Cost recovery and privatisation: The higher and technical education in India is being
increasingly privatised in multiple ways. On the one hand, the public institutions had to
resort to cost recovery methods to stem out from financial crisis. On the other, private
institutions are cropping in large numbers changing the very face of higher and technical
education.

207
4.Fees: It is asserted that fee levels remain very low compared to the past. Though it is
necessary that fees should not be at an absurdly low level, it may not be fair to expect the
fee to provide substantial resources to higher education. In fact, it is noted by several
researchers that the cost recovery level through fees is not high anywhere in the world
and in advanced countries it hardly touches 15 per cent. In India also the total fee income
constitutes about 15 per cent of expenditure on higher education. In many universities,
the fee income exceeds the recommendations made by the Punnayya Committee [CABE
Committee 2005].
5.Self-financing courses and seats:Many a time, the distance courses are being
introduced solely with the aim of generating revenues for the university. The revenues
generated through distance modes are seldom used for the benefit of distant learners but
utilised to finance mainstream activities of the university. It hits hard the interest of
especially those who are relatively underprivileged.
6.Need to raise public funding: Now, it is very much clear from the above discussions
that the public allocation to higher and technical education is not only inadequate but also
declining since the last decade and a half. As the public funding of higher education
could not keep pace with the growing enrolment, the real unit costs have fallen
dramatically since the 1990s.
7.Need to evolve EMIS: The data base on higher and technical education system in India
is very weak and limited to a few areas like enrolment by disciplines and gender,
aggregate public expenditure, faculty strength, etc. Data is not available on several vital
aspects of higher education. The private sector is either not at all covered or covered in a
restricted way.

208
CHAPTER 7
AREAS FOR FURTHER RESEARCH
The study revealed that as as a supplement to this existing study following areas can
bestudied
1. Parking, Canteen & Mess.
2. Financial analysis of the different colleges as this will be reveal the financial
position of the colleges.
3. In so far as professional and technical courses are concerned, sports and cultural
activities of the students for such professional courses shall be further
investigated.
4. A separate and detailed study of under graduate and post graduate courses shall be
undertaken, as they are bound to differ on their approach.
5. If the data is made available, the detailed study of financials of these colleges
shall be undertaken with the help of their financial statements, preferably for a
longer time frame, e.g. ten years.

209
Bibliography
Abraham, Katherine G. and Melissa A. Clark. (2003). Financial Aid and Students'
College Decisions: Evidence from the District of Columbia's Tution Assistance Grant
Program. Retrieved July 2015, from www.nber.org.
Advisory Committee on Student Financial Assistance. (2002). Empty Promises: The Myths of
College Access in America. Retrieved July 2015, from www.ed.gov.
Agarwal, Pawan. (2006). Higher Education in India: Need for Change. ICIER.
Agarwal, Pawan. (2006). Higher Education in India: The Need for Change. ICRIER Working Paper
No.180.
Agarwal, Pawan. (2006). Higher Education in India: The Need for Change. Retrieved July 2015,
from www.icrier.org.
Albrecht, Douglas & Adrian, Ziderman. (1991). Deferred Cost Recovery for Higher Education:
Student Loan Programs in Developing Countries. Retrieved July 2015, from www-
wds.worldbank.org.
Altbach, Philip G. (Ed.). (1999). Private Prometheus: Private Higher Education and Development
in 21st Century. Westport, CT: Greenwood Press.
Anjum, Dr. Bimal & Rajesh Tiwari. (2012). An Exploratory Study of Supply Side Issues in Indian
Higher Educaiton. Asia Pacific Journal of Marketing and Management Review , 14-26.
Anjum, Dr. Bimal & Tiwari, Rajesh. (2012). An Exploratory Study of Supply Side Issues in Indian
Higher Educaiton. Asia Pacific Journal of Marketing and Management Review Vol.1 Issue 1 .
Anthony, Susanne. (1999). Student Income and Study Behaviour in Denmark. European Journal
of Education, 34(1) , 87-94.
Archibald, Robert B. (2002). Redesigning the Financial Aid System: Why Colleges and Universities
Should Switch Roles with the Federal Government. Baltimore, MD: Johns Hopkins University
Press.
Arunachalam, P. (2010). Higher Education Sector in India: Issues and Imperatives. Journal of
Global Economy, Vol.6, No.4 , 267-281.
Bain, Olga. (2001). The Costs of Higher Education to students and Parents in Russia: Tution
Policy Issues. Peabody Journal of Ecuation 76(3&4) , 57-80.
Barr, Nicholas. (2005). Financing Higher Educaiton: Answers from the U.K. London, UK:
Routledge Studies in Educaiton.
Bekhradnia, Bahram. (2003). Widening Participation and Fair Access: An Overview of the
Evidence. Retrieved 2015, from www.hepi.ac.uk.
210
Belfield, Clive & Henry, M. Levin. (2002). Educaiton Privatization: Cases, Consequences and
Planning Implicaitons. Paris: International Institute for Educational Planning, UNESCO.
Boezerooy, Petra & Vossensteyn, H. (1999). A Comparative Overview of Access to Higher
Education. Higher Education in Europe, XXIV (3) , 349-358.
Bray, Mark. (2002). The Costs and Financing of Educaiton: Trends and Policy Implications.
Manila, The Philippines: Asian Development Bank.
Callender, Claire. (2003). School Leavers and Further Education students' Attitudes to Debt.
London, UK: Universities UK and HEFCE.
Chapman, Bruce. (2004). A Critical Appraisal of the New Higher Educaiton Charges for Students.
Dialogue, 23, 1 , 61-72.
Chudgar, Amita. (2004). Higher Education Expenditure in India: Role of Household. ASHE
International Conference.
Colclough, C. (1990). Raising Additional Resources for Education in Developing Countries.
International Journal of Educational Development .
Dhanuraj, D. and Kumar, Rahul V. (2015). Understanding the status of Higher Education in India.
New Delhi: Centre for Public Policy Research.
Dr. S. Puttaswamaiah. (2010). Financing Higher Educaiton: A Study of Educaitonal Loans.
Dharwad: Center for Multi-Disciplinary Development Research.
Ehrenberg, Ronald G. (2000). Tuition Raising, Why College Costs So Much. London: Harvard
University Press.
Eicher, Jean-Claude. (1998). The Costs and Financing of Higher Education in Europe. European
Journal of Educaiton, 33(1) , 31-39.
Gill, T.K. & S. S. Gill. (2000). Financial Management of Universities in Developing Countries.
Higher Education Policy, 13(2) , 125-130.
Gupta, Deepti & Navneet Gupta. (2012). Higher Educaiton in India: Structure, Stature and
Challenges. Journal of Educaiton and Practice .
Hansen, J. (1989). Cost Sharing in Higher Education: the United States Experience. The Bedford
Way Series .
Hauptman, Arthur M. (1999). Ideas on Higher Education Funding: Internal Financing of Student
Loans. International Higher Educaiton, 16 .
Havaldar, Krishna K. (2011). Management Education In India: The Present Status and Future
Directions. Retrieved July 2015, from http://ssrn.com/abstract=2046868.
Hearn, James C. (2003). Diversifying Campus Revenue Streams: Opportunities and Risks.
Washington, DC: American Council on Education.

211
Herz, Barbara. (2005). University-Level Education for Women in the Developing World. New York:
Carnegie Corporation of New York.
Huang, Lohing. (2005). Elitism and Equality in Chinese Higher Education System. Retrieved 2015,
from www.interped.su.se.
Independent Committee of Inquiry into Student Finance. (2000). Student Finance Fairness for
the Future. Research Report.
Institute For Higher Education Policy. (2009). Financing Higher Education: A Myriad of Problems,
A Myriad of Soluions. Washington, DC: IHEP Working Paper Series.
Ishengoma, Johnson. (2002). Cost Sharing in Higher Education in Africa. Journal of Higher
Education in Africa, 2(2) , 101-133.
Johnstone, B. D. (2005). Higher Education Accessibility and Feasibility: the Role of Students
Loans. www.gse.buffalo.edu .
Jongbloed, Ben. (2010). Funding Higher Education: A View Across Europe. The Netherlands:
Center For Higher Educaiton Policy Studies.
Joshi, Dr. K. M. & Ahir, Dr. Kinjal Vijay. (2013). Indian Higher Education: Some Reflections.
Intellectual Economics. Vol.7, No.1 , 42-53.
Joshi, K. M. . (2006). Human Capital and the Economic Benefits of Education: Understanding the
Investment Arguments. OSED Working Paper No. 1/06.
Kapur, Devesh & Mehta Pratap Bhanu. (2007). Mortgaging the Future? Indian Higher Education.
Brrokings- NCAER India Policy Forum.
Kapur, Devesh & Pratap Bhanu Mehta. (2007). Mortgaging the Future? Indian Higher Education.
Brookings-NCAER India Policy Forum.
Kaul, Rekha. (1993). Caste, Class and Education: Politics of the Capitation Fee Phenomenon in
Karnataka. New Delhi: Sage Publications.
Kaul, Sanat. (2006). Higher Education in India: Seizing the Opportunity. ICRIER Working Paper.
Lee, W. O. (2002). Equity and Access to Education: Themes, Tensions, and Policies. Education in
Developing Asia .
Leslie, Larry & Paul Brinkman. (1988). The Economic Value of Higher Education. New York:
American Council on Educaiton.
Li, Helen. (2013). A Rising Cost of Higher Education: A Supply & Demand Analysis. New York
University.
Martin, Robert E. (2009). Revenue-to-Cost Spiral in Higher Education. The John William Pope
Center for Higher Educaiton Policy.
212
Mayhew, Ken et al. (2004). The Move to Mass Higher Education in the UK. Oxford Review of
educaiton 30(1) , 65-82.
Mishra, Jitendra Kumar et al. (2008). Indian Higher Education: Global Challenges and Local
Issues. JBS Working Paper Series.
Narayana, M. R. . (2005). Student Loan By Commercial Banks. Journal of Developing Areas , 171-
187.
P. Geetha Rani. (2010). Economic Reforms and Financing Higher Education in India. New Delhi:
National Institute of Educaitonal Planning and Administration.
P. Geetha Rani. (2002). Financing Higher Education in India in the Post Reform Period: Focus on
Access and Equity. NIEPA Occasional Paper No.31.
Palacios Lleras, Miguel. (2004). Investing in Human Capital. Cambridge, UK: Cambridge
University Press.
Palfreyman, David. (2004). The Economics of Higher Education: Affordability and Access:Costing
Pricing and Accountability. Oxford: Oxford Centre for Higher Education Policy Studies.
Patrinos, Harry Anthony & David Lakshmanan Ariasingam. (1997). Decentralization of Education:
Demand-side Financing. Washington, DC: The World Bank.
Payne, Joan and Claire, Callender. (1997). Student Loans, Who Borrows, and Why? London:
Policy Study Institute.
Pell Institute for the Study of Opportunity in Higher Education. (2004). Indicators of Opportunity
in Higher Education. Washington, DC: The Pell Institute.
Powar, K. B. & K. L. Johar (Eds.). (2004). Private Initiatives in Higher Education. Yamuna Nagar:
Sneh Prakashan.
Psacharopoulos, George and Harry Anthony Patrinos. (2004). Returns to Investment in
Education: A Further Update. Education Economics, 12(2) , 111-134.
Rizvi, Fazal & Radhika Gorur. (2011). The Challenges Facing Indian Higher Education. The
Fearless Nadia Occasional Papers on India-Australia Relations.
Ruch, Richard S. (2001). Higher Ed, Inc. The Rise of the For-Profit University. Baltimore and
London: The Johns Hopkins University Press.
Sanyal, C. B. & Martin, M. (2006). Financing Higher Education: International Perspectives. GUNI
Series on Social Commitments of Universities.
Singh, Dr. J. D. (2015). Higher Education in India - Issues, Challenges, and Suggestions. ------ .
St. John Edward P. (1994). Prices, Productivity, and Investment: Assessing Financial Strategy in
Higher Education. ASHE ERIC Higher Education Reports.

213
Suresh Babu G. S. (2011). Privatization of Higher Education in India: Challenges of Social Equality.
NUEPA.
(2015). Themes & Question for Policy Consultation on Higher Education. New Delhi: Ministry of
Human Resource Development (GOI).
Tilak, J. B. G. . (2005). Higher Education in Trishanku. Economic and Political Weekly , 4029-4037.
Tilak, J. B. G. (1994). Education for Development in Asia. New Delhi: Sage Publications.
Tilak, J. B. G. (1992). Public and Private Sectors in Educaiton in India. Emerging Issues in
Education .
Tilak, J.B.G. & Varghese, N.V. (1991). Financing Higher Education in India. Higher Education 21(1)
.
Tilak, J.B.G. (1990). The Political Economy of Education in India. Special Studies in Comparative
Education .
Tilak, Jandhyala B. G. . (2012). Financing of Higher Education: Traditional versus Modern
Approach.
Tilak, Jandhyala B. G. & Geetha Rani (Eds.). (2000). University Finances in India: A Profile. New
Delhi, India: National Institute of Educational Planning and Administration.
Tilak, Jandhyala B. G. (2008). Higher Education: A Public Good or a Commodity for Trade?
Prospects, 38 , 449-466.
Tilak, Jandhyala B. G. (1997). The Dilemma of Reforms in Financing Higher Education. Higher
Education Policy 10(1) , 7-21.
Tres, Jaoquim and Francesco Lopez Segrera (Eds.). (2005). Higher Education in the World 2006:
The Financing of Universities. Barcelona, Spain: Global University Network for Innovation.
UNKNOWN. (2009). EDUCATION IN INDIA. Retrieved from
http://en.wikipedia.org/wiki/Education in India.
UNKNOWN. (2008). HIGHER EDUCATION IN INDIA. Retrieved from http;//www.academics-
india.com.
Usher, Alex. (2004). Are the Poor Needy? Are the Needy Poor? Stanford & Toronto: Education
Policy Institute, Canadian Higher Education Report Series.
Varghese, N. V. . (2001). Impact of the Economic Crisis on Higher Education in Each Asia: Country
Experiences. Paris: IIEP / UNESCO.
Ved Prakash. (2007). Trends in Growth and Financing of Higher Education in India. Economic &
Political Weekly , 3249-3258.
Vossensteyn, Hans. (2002). Shared Interests, Shared Costs: Student Contributions in Dutch
Higher Education. Journal of Higher Education Policy and Management, 24(2) , 145-154.

214
Walia, Nidhi. (2013). Higher Education in India: Present Issues & Challenges. Indian Journal of
Applied Research .
Woodhall, M. (1987). Lending for Learning. Commonwealth Secreteratiat .

215
DOCTORAL RESEARCH -
“A CRITICAL STUDY OF STUDENTS’ FINANCIAL ISSUES IN HIGHER
EDUCATION IN INDIA”
QUESTIONNAIRE FOR STUDENTS
1. NAME OF THE STUDENT (Mr. /
Miss)___________________________________
2. NAME OF THE COLLEGE
_____________________________________________
3. COURSE – UG / PG
4. FACULTY OF - ENGINEERING / PHARMACY / MANAGEMENT
5. YEAR – I / II / III / IV
6. ACCOMODATION DURING STUDIES – HOSTEL / PRIVATE / HOME
7. NATIVE PLACE OF THE STUDENT _____________________
8. AGE OF THE STUDENT ______ YRS.
9. HOW MUCH FEES PAID FOR ONE ACADEMIC YEAR?
a. TUTION FEES
b. DEVELOPMENT FEES
c. BOOKS & STATIONARY
d. PRACTICAL FEES
e. UNIVERSITY EXAM. FEES
f. PLACEMENT ASSISTANCE FEES
g. GYMKHANA / SPORTS FEES
h. LIBRARY FEES (Excluding Refundable Deposits)
i. OTHER FEES (Pl. Specify)

216
j. TOTAL FEES
10. WHAT PERCENTAGE OF COST OF EDUCATION SHOULD BE
RECOVERED BY TUITION FEES?
20% / 40% / 60% / 80% / 100%
11. HOW MUCH LIVING COST IS PAID DURING ONE ACADEMIC YEAR?
I. HOSTEL / ACCOMODATION CHARGES
II. FOODS AND BEVERAGES
III. TRANSPORTATION CHARGES
IV. ENTERTAINMENT CHARGES
V. OUTSIDE TUITION CHARGES
VI. OTHER EXPENSES (Pl. Specify)
VII. TOTAL EXPENSES
12. HAVE YOU AVAILED EDUCATION LOAN FACILITY? YES / NO
11-A IF YES, HOW MUCH LOAN RECEIVED (Rs. ___________) from
____________________( NAME OF THE BANK),at _______%p.a.(INTEREST
RATE), and for _________ yrs.(REPAYMENT TIME)
13. CONSIDERING THE FEES PAID TO THE COLLEGE, ARE YOU SATISFIED
WITH THE FACILITIES PROVIDED BY THE COLLEGE – YES / NO
12 – A IF YES, RATE THE COLLEGE ON 5 POINT SCALE (0-4) WITH 0 AS
UNSATISFACTORY AND 4 AS TOTAL SATISFACTION ON THE FOLLOWING:
1. Teacher Performance
2. Other Academic Facilities & Environment
3. Behavior of non-teaching staff
4. Library Facility

217
5. Computer Center Facilities
6. Parking Facility
7. Sports & Cultural Events
8. Co-curricular and Extra-curricular Facilities
9. Canteen and Mess Facility
10. Overall College Rating
12 – B IF NO, WHAT ARE YOUR EXPECTATIONS FROM THE COLLEGE
________________________________________________________________
________________________________________________________________
14. SHALL THE COLLEGE RESORT TO PUBLIC FUNDING (DONATIONS,
SUBSIDIES, AND INDUSTRY GRANTS) TO REDUCE BURDEN OF COST
ON STUDENTS? YES / NO
13 –A IF YES, SUGGEST WAYS AND MEANS FOR THE SAME
_______________________________________________________________
_______________________________________________________________
15. DO YOU AGREE THAT YOU HAVE MISSED SOME OF THE GOOD
OPPORTUNITIES OF HIGHER EDUCATION DUE TO HIGHER FEES AND /
OR NON-AVAILABILITY OF FUNDS / LOANS? YES / NO
14 – A IF YES, SPECIFY THE OPPORTUNITIES YOU HAVE MISSED
______________________________________________________________
16. DO YOU AGREE THAT THE HIGHER THE COST OF EDUCATION THE
BETTER IS THE QUALITY? YES / NO

218
15 – A IF YES, SPECIFY THE TYPE OF COLLEGE YOU WOULD HAVE LOVED
TO TAKE ADMISSION TO _______________________________________
15 – B IF NO, DOES IT MEAN THAT HIGHER COST RESULTS INTO DECREASE
IN QUALITY? YES / NO __________________________________________
______________________________________________(JUSTIFY)
17. TO WHAT EXTENT IS THE ACCESS TO HIGHER EDUCATION
AFFECTED ADVERSELY BY HIGH LEVEL FEES IN SELF FINANCED
COURSES?
TO A GREAT EXTENT / TO A LESSER EXTENT / NOT AT ALL
18. QUESTIONS HERE ARE ARRANGED IN PAIRS. ONE TO THE LEFT IS
THE HYPOTHESIS AND THE OTHER TOWARDS THE RIGHT IS THE
CONVERSE. YOU CAN AGREE WITH EITHER OF THE TWO BUT NOT
BOTH
Agree with the hypothesis Agree with the converse
1) Higher education should be
free for everyone.
1) Full fees must be charged to cover full
cost of education.
2) We need greater private
participation in higher
education
2) The role of private players should be
restricted and regulated.
3) There is no need to replace
the Existing regulatory
authorities Such as UGC,
AICTE etc.
3) A national education regulatory
authority should be established to
monitor and oversee growth of
4) Student fees must be kept
low by public funding
4) higher education Fees should reflect
cost of providing education
5) Scholarships and tuition fees
waiver are to be given to
large numbers of students
5) Such concessions should be restricted
to only a few meritorious students.
6) Student fees should be linked
to faculty salaries
6) Fees should remain constant even
when salaries rise.
7) Fees in self-financed courses
are generally very high.
7) fees in self financed course is not very
high
8) There is a need to hike the
fees in State/Government
aided courses
8) There is no need to increase tuition
fees in funded aided courses.
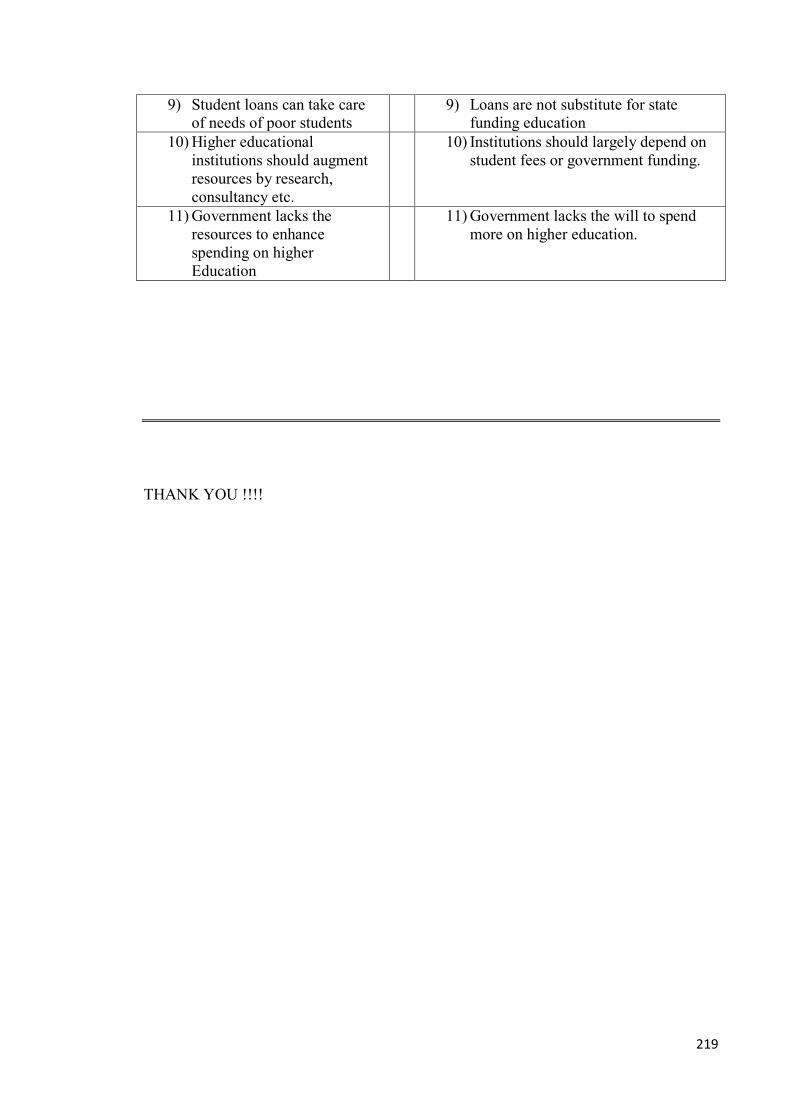
219
9) Student loans can take care of needs of poor students
9) Loans are not substitute for state funding education
10) Higher educational
institutions should augment
resources by research,
consultancy etc.
10) Institutions should largely depend on
student fees or government funding.
11) Government lacks the
resources to enhance
spending on higher
Education
11) Government lacks the will to spend
more on higher education.
THANK YOU !!!!

220
DOCTORAL RESEARCH -
“A CRITICAL STUDY OF STUDENTS’ FINANCIAL ISSUES IN HIGHER
EDUCATION IN INDIA”
QUESTIONNAIRE FOR PRINCIPAL / OWNER
1. Name of the Principal / Owner ______________________________________
2. Name of the College ______________________________________________
3. Address ________________________________________________________
4. Ph. No. _______________________, e-mail ____________________________
5. COURSE – UG / PG/BOTH
6. FACULTY OF - ENGINEERING / PHARMACY / MANAGEMENT
7. HOW MUCH FEES CHARGED FOR ONE ACADEMIC YEAR?
a. TUTION FEES
b. DEVELOPMENT FEES
c. BOOKS & STATIONARY
d. PRACTICAL FEES
e. UNIVERSITY EXAM. FEES
f. PLACEMENT ASSISTANCE FEES
g. GYMKHANA / SPORTS FEES
h. LIBRARY FEES (Excluding Refundable Deposits)
i. OTHER FEES (Pl. Specify)
j. TOTAL FEES
8. BANK LOAN ARRANGEMENT / TIE UPS DONE BY THE COLLEGE
____________________________________________________________
____________________________________________________________

221
8A. IF NO, REASON FOR THE SAME ______________________________________
9. ANY CERTIFICATE ISSUED TO STUDENTS FOR AVAILING BANK
LOAN?
9A. IF YES, WHETHER FEES / CHARGES QUOTED CONSISTS ANYTHING
OTHER THAN ABOVE FEES (Pl. specify)
10. ANY FREESHIP / SCHOLARSHIP PROVIDED BY THE COLLEGE? (Pl.
specify)
_________________________________________________________________
11. ASSISTANCE FOR FREESHIP / SCHOLARSHIP PROVIDED BY THE
COLLEGE
A. NATURE ______________________________
B. AMOUNT PER STUDENT __________________________
12. WHO PROVIDES THE SCHOLARSHIP – STATE / CENTRAL
GOVERNMENT / TRUSTS / COMPANIES / OTHERS
13. HOSTEL FACILITY PROVIDED? YES / NO
13A. IF YES, THE BREAK-UP AND TOTAL OF HOSTEL CHARGES
_________________________________________________________________
_________________________________________________________________
14. TOTAL ANNUAL EXPENSES ON THE FOLLOWING:
A. ANNUAL GATHERING
B. SPORTS FACILITY
C. EXTRA-CURRICULAR ACTIVITIES
D. CO-CURRICULAR ACTIVITIES

222
E. STUDENTS’ WELFARE
F. BOOK BANK & OTHER SUCH SCHEMES
G. EARN & LEARN SCHEME
THANK YOU !!!!

223
DOCTORAL RESEARCH -
“A CRITICAL STUDY OF STUDENTS’ FINANCIAL ISSUES IN HIGHER
EDUCATION IN INDIA QUESTIONNAIRE FOR BANKER
1. Name of the Banker - ______________________________________________
2. Name of the Bank _______________________________________
3. Branch Address __________________________________________
4. Ph. No. _____________________, email id. _____________________________
5. THE VOLUME AND VALUE OF THE STUDENTS LOAN ISSUED PER
ANNUM BY THE BRANCH:
VOLUME - _____________(No.)
VALUE Rs._________________
6. LOAN DISTRIBUTED TO : NUMBER AMOUNT Rs.
ENGINEERING STUDENTS ________
_____________
PHARMACY STUDENTS ________
_____________
MANAGEMENT STUDENTS _________
_____________
OTHERS _________
_____________
7. MODUS OPERANDI FOR THE STUDENTS TO KNOW ABOUT SUCH
LOAN SCHEME

224
_______________________________________________________________
_______________________________________________________________
8. WHO APPROACHES THE BANK FOR LOAN FACILITY?
STUDENTS, COLLEGE, PARENTS
9. THE RATE OF INTEREST FOR THE STUDENTS LOAN FOR CURRENT
YEAR:
____________________________________________
10. HOW MUCH TIME REQUIRED CLEARING THE LOAN PROPOSAL?
_________________________
11. HOW MUCH TIME REQUIRED TO DISBURSE THE LOAN AMOUNT?
___________________________
12. COLLATERAL SECURITY REQUIRED? YES / NO
12A. IF YES, THE NATURE OF SUCH SECURITY ___________________________
13. GURANTOR/S REQUIRED? YES / NO
13A. IF YES, THE NATURE OF GUARANTEE____________________________
14. HOW MANY OF SUCH LOANS TURNED TO NPA DURING LAST 5
YEARS? WHY?
_________________________________________________________

225
___________________________________________________________
THANK YOU !!!!